dsd-int 2015- open source pre and postprocessing workshop- bert jagers
TRANSCRIPT

Delft3D 4 - Open Source Pre- and
Postprocessing
Delft Software Days 2015
28 October 2015

Open Source Pre- and Postprocessing
• Delft3D-MATLAB tools
• open source since spring 2011 (included in OET by reference)
• top-down quality controlled
• read access for all
• write access to certified/trusted developers
• OpenEarthTools
• open source since autumn 2008
• includes Muppet and DelftDashBoard since 2009
• bottom-up quality control
• read and write access to all
• Valuable experience with 2 philosophies
to growth and control quality
Today’s focus
Growing importance

Open Source Pre- and Postprocessing
• RGFGRID
• curvi-linear and flexible mesh grid generator
• FORTRAN code
• source code to be released
• read access for all / limited write access
• DeltaShell
• new Delft3D flexible mesh user interface
• C# code
• source code to be released
• read access for all / limited write access
• DeltaShell Python scripting
• integrate scripting with the full user interface
• bottom-up quality control
• read and write access to all
Python Scripting in
SOBEK 3 & Delft3D
Flexible Mesh
course
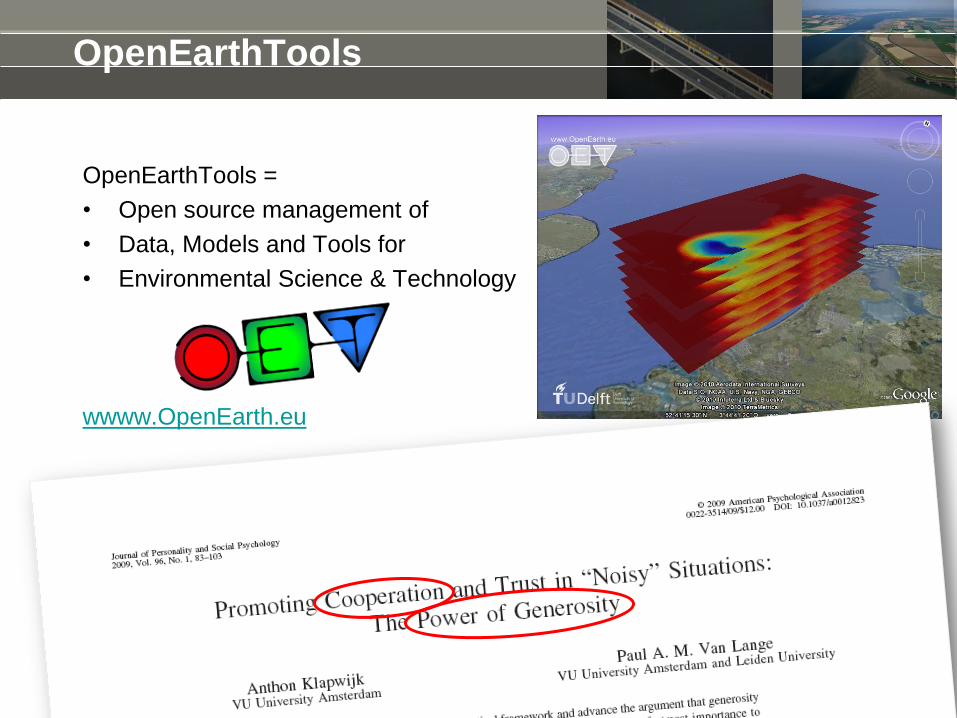
OpenEarthTools
OpenEarthTools =
• Open source management of
• Data, Models and Tools for
• Environmental Science & Technology
wwww.OpenEarth.eu

↓ Wikipedia keeps the history of all modifications, and so does Subversion ↓
OpenEarthTools: crowd-sourcing tools

OpenEarthTools
Developed by a community. Some
people contribute more than
others, but single contributions
can be very valuable to many
other people.

OpenEarthTools
Individuals come and go, but
the community stays.

Now the tools …
• How to get the code:
• registration at http://oss.deltares.nl
• get Tortoise subversion from http://tortoisesvn.net
• get MATLAB OpenEarthTools from https://svn.oss.deltares.nl/repos/openearthtools/trunk/matlab
• Run the tools:
• Go to OpenEarthTools source root folder
• Run “oetsettings”
• Focus on tools:
• Delft Dashboard: ddb
• QuickPlot: d3d_qp
• Muppet: muppet4
• GooglePlot

Delft Dashboard: ddb
Select model
Delft3D-FLOW
Draw
bounding box
Zoom in on COASTAL
area of interest
Create: grid,
bathymetry,
open boundaries,
boundary conditions
Choose
resolution
Save model
… and run

QuickPlot: d3d_qp
Open file
(or URL via menu)
Add subplot
Visualize
Edit dataset
plot options
Set subplot
properties
Set figure
properties
Select quantity
Select
time/space
Open Plot Manager
Create figure
Add geo data
(only for spherical)

QuickPlot macros and scripts
Record macro
selectfield 'water level'
presenttype 'continuous shades'
extend2edge 1
quickview
printfigure 'wl-cshade-extended.png' 'PNG file' 2 53 1
closefigure
Record MATLAB script
d3d_qp('selectfield','water level')
d3d_qp('presenttype','continuous shades')
d3d_qp('extend2edge',1)
d3d_qp('quickview')
d3d_qp('printfigure','wl-cshade-extended.png','PNG file',2,53,1)
d3d_qp('closefigure')
Macro
MATLAB script
Insert your own MATLAB code
Play recorded macro or script
Run from MATLAB prompt

QuickPlot MATLAB commands
File = qpfopen('filename') % open a file (just like QP)
File = qpfile % start using the file selected in QP
Fig = qpsf % get handle of figure selected in QP
qpsf(Fig) % select figure Fig in QP
Ax = qpsa % get handle of axes selected in QP
qpsf(Ax) % select axes Ax in QP
Qnts = qpread(File) % get quantities in the file
Qnam = {Qnts.Name}' % list quantity names
Size = qpread(File,Qnts(i),'size')
% get dataset size e.g. [11 0 42 3 0] for 11 time steps,
% 0 stations, (M,N) grid 42x3 and 0 layers (K)
% returned size is always [TMAX StatMAX MMAX NMAX KMAX]
Time = qpread(File,Qnts(i),'time') % get array of times
Stns = qpread(File,Qnts(i),'stations') % get array of station names
Data = qpread(File,Qnts(i),'griddata',5,1:20,1:3)
% get grid and data for timestep 5 and M=1:20 and N=1:3
% these indices refer to the non-zero elements of 'size'

GooglePlot Get data
data =
X: [73x37 double]
Y: [73x37 double]
XUnits: 'deg'
YUnits: 'deg'
Val: [73x37 double] % number of Val matches number of X/Y
Time: 736266 % if presentation type is not patches
Name: 'water level'
Units: 'm‘
% write data to KML file for GoogleEarth
>> KMLcontourf(data.Y,data.X,data.Val, ...
'fileName','myFile.kml');
>> KMLcontourf3(data.Y,data.X,data.Val, ...
'fileName','myFile.kml', ...
'zScaleFun',@(z) (z+3.2)*1000); % scale vertical coordinates
% for GoogleEarth
>> help googleplot

Muppet: muppet4
Open file and
define dataset Define subplot
Add dataset
to subplot
Edit dataset
plot options
Set basic subplot
properties
Set more detailed
subplot properties
Define legend
settings per subplot
Define colormap
per subplot Set figure
properties
Visualize

Associating files with stand-alone QUICKPLOT
QUICKPLOT will
automatically open a
data file when its name
is given on the
command line.
Make this association
via Windows Explorer
Open with…
Browse select
d3d_qp.exe open
Select “Always use the
selected program to
open this kind of file”
click OK
Note: files with extension .m or .qplog will
automatically be executed.

Associating files with stand-alone QUICKPLOT
If you can’t add d3d_qp.exe to the Open with… dialog, then you have
most likely made such an association in the past, but that QUICKPLOT
executable has been deleted or moved. To solve this open the registry
editor (regedit.exe)
• Find the entry
Computer/HKEY_CLASSES_ROOT/Applications/d3d_qp.exe
• Check the path specified in
…/d3d_qp.exe/shell/open/command

Associating files with stand-alone QUICKPLOT
In Total Commander
select a file and choose
from the menu File
Associate With …