dsf college success update september 21, 2011. mission “the denver scholarship foundation inspires...
Post on 19-Dec-2015
213 views
TRANSCRIPT
DSF College Success Update
September 21, 2011
Mission
“The Denver Scholarship Foundation inspires and empowers Denver Public Schools’ students to enroll in
and graduate from postsecondary institutions of higher education, by providing the tools, knowledge,
and financial resources essential for success”
2
History
2006-07 Pilot Year
• Pilot Future Centers Established at three high schools
• First scholarships awarded to 135 students in 2007-08
3
DSF Today
Three-Part Program
– Future Centers in 16 high schools• Services available to all seniors
– Need-Based Scholarships to over 2,000 students
– College Success partnerships at 13 colleges 4
Future Centers
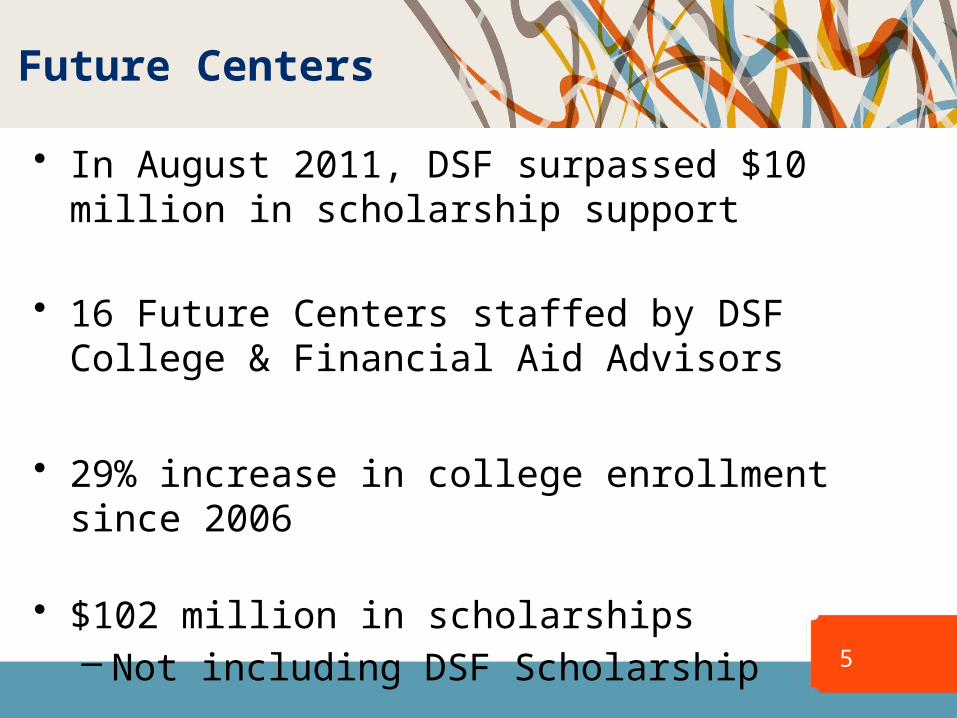
• In August 2011, DSF surpassed $10 million in scholarship support
• 16 Future Centers staffed by DSF College & Financial Aid Advisors
• 29% increase in college enrollment since 2006
• $102 million in scholarships– Not including DSF Scholarship 5
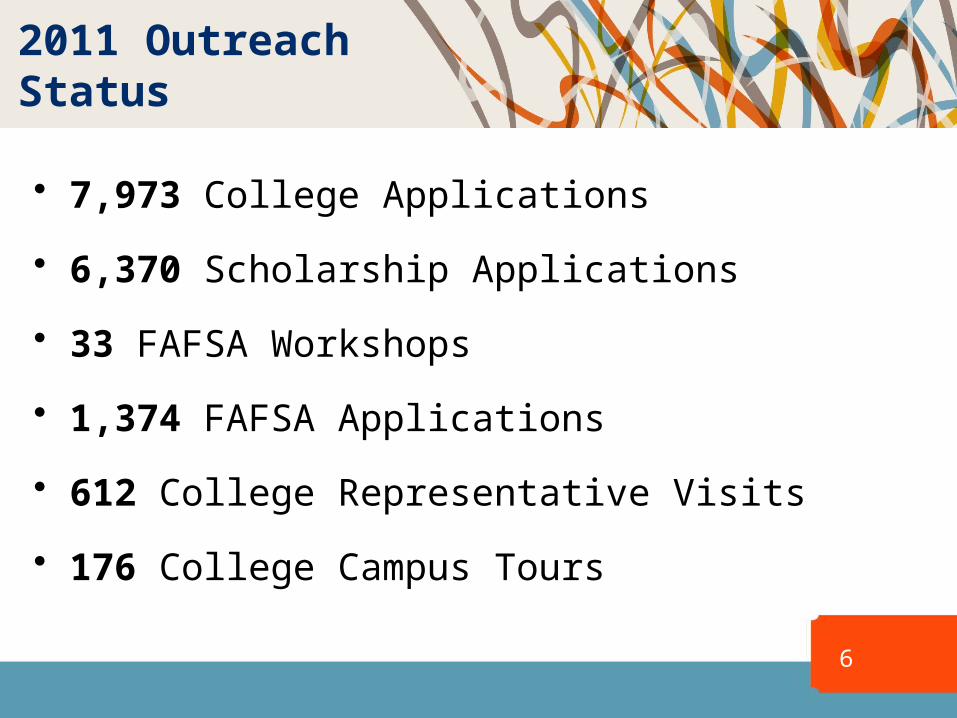
2011 Outreach Status
• 7,973 College Applications
• 6,370 Scholarship Applications
• 33 FAFSA Workshops
• 1,374 FAFSA Applications
• 612 College Representative Visits
• 176 College Campus Tours
6
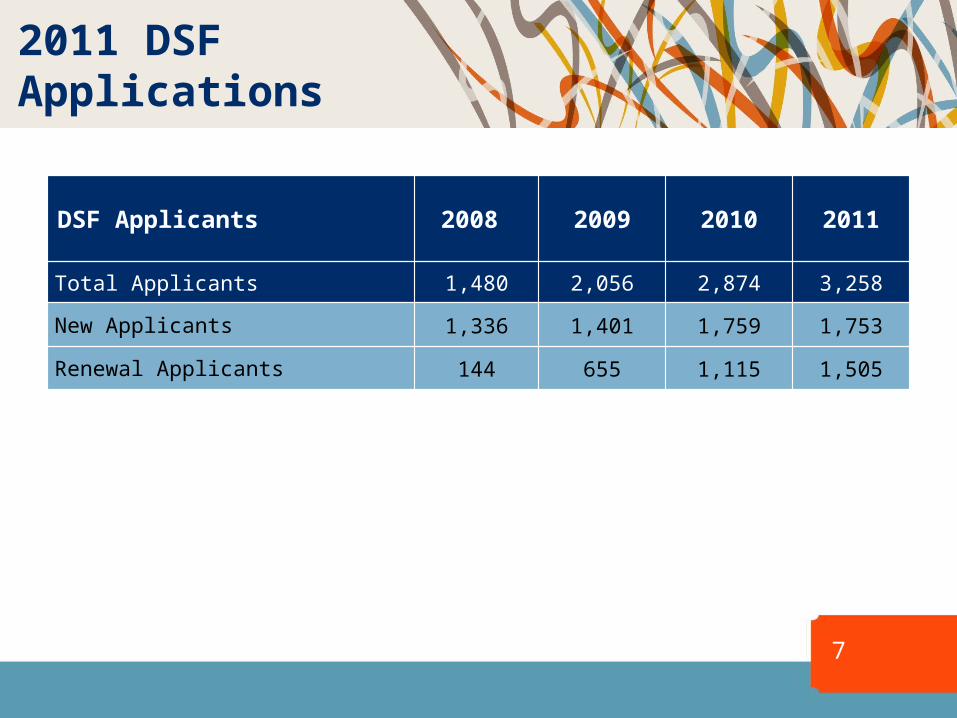
2011 DSF Applications
DSF Applicants 2008 2009 2010 2011
Total Applicants 1,480 2,056 2,874 3,258
New Applicants 1,336 1,401 1,759 1,753
Renewal Applicants 144 655 1,115 1,505
7
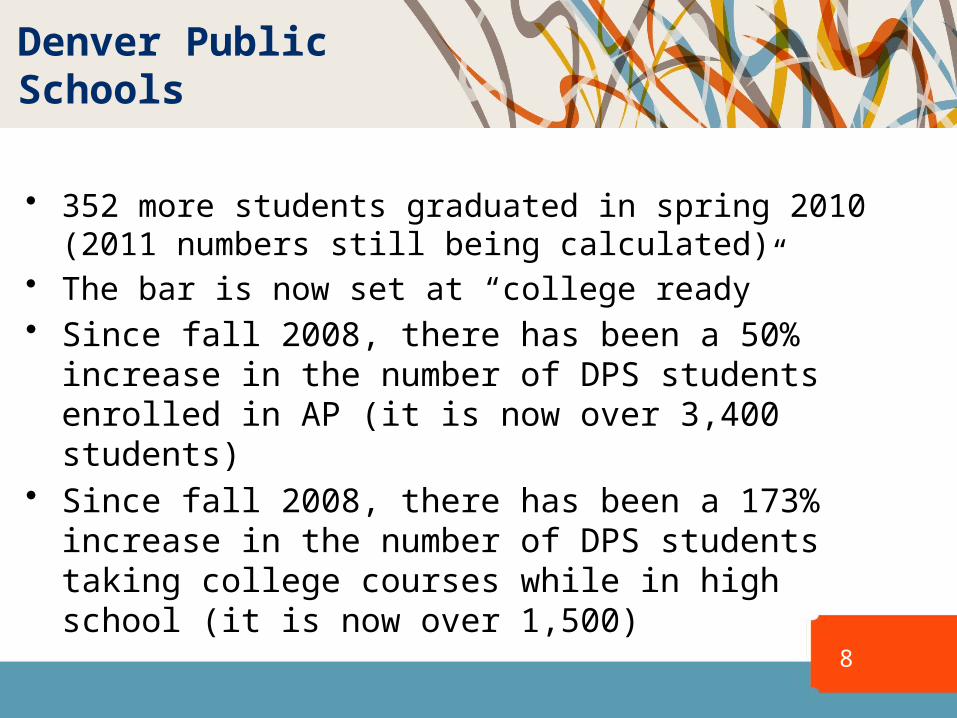
Denver Public Schools
• 352 more students graduated in spring 2010 (2011 numbers still being calculated)
• The bar is now set at “college ready”• Since fall 2008, there has been a 50% increase in
the number of DPS students enrolled in AP (it is now over 3,400 students)
• Since fall 2008, there has been a 173% increase in the number of DPS students taking college courses while in high school (it is now over 1,500)
8
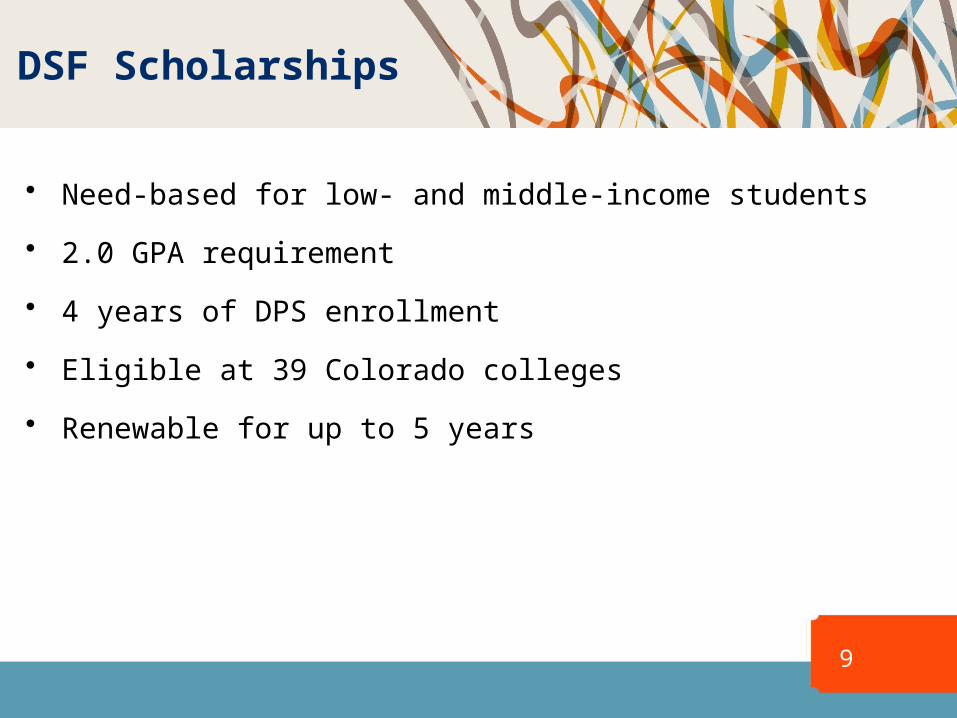
DSF Scholarships
• Need-based for low- and middle-income students
• 2.0 GPA requirement
• 4 years of DPS enrollment
• Eligible at 39 Colorado colleges
• Renewable for up to 5 years
9
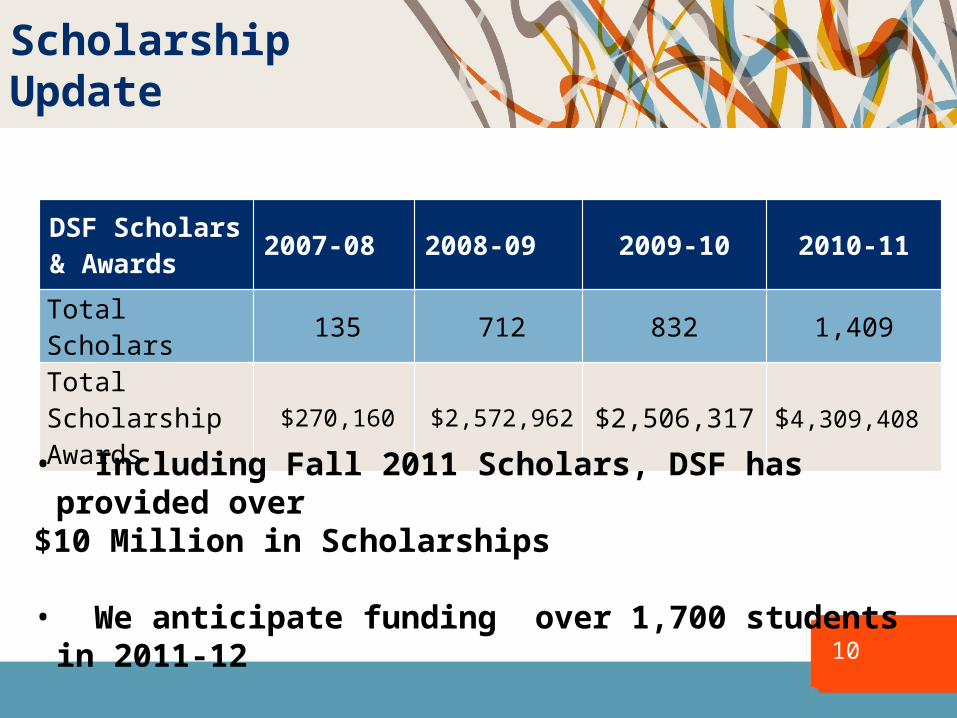
Scholarship Update
DSF Scholars & Awards
2007-08 2008-09 2009-10 2010-11
Total Scholars 135 712 832 1,409
Total Scholarship Awards
$270,160 $2,572,962 $2,506,317 $4,309,408
10
• Including Fall 2011 Scholars, DSF has provided over
$10 Million in Scholarships
• We anticipate funding over 1,700 students in 2011-12
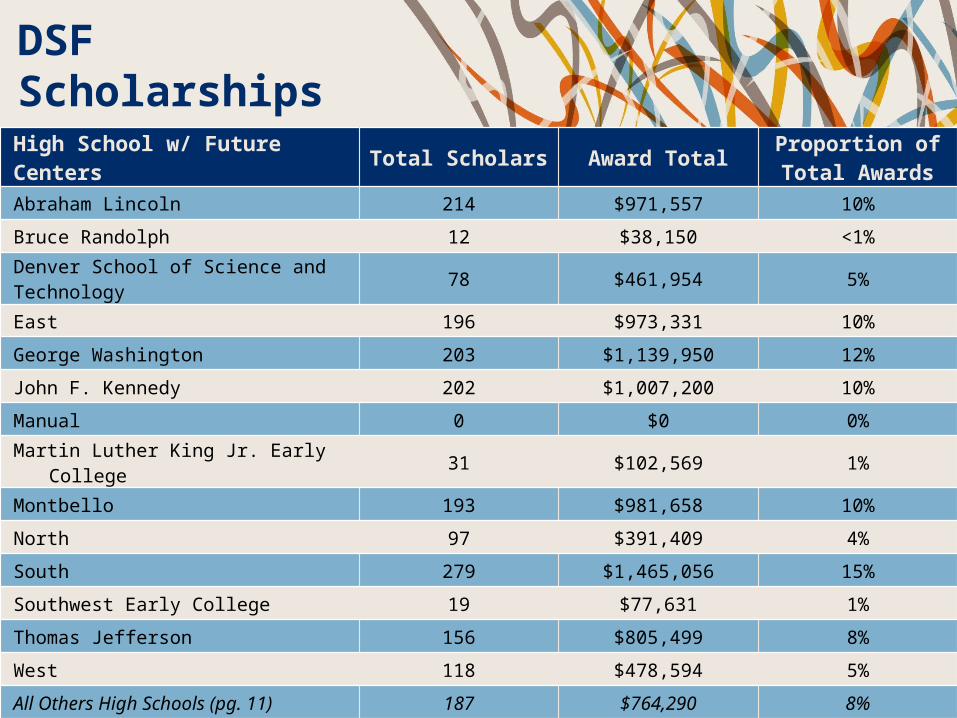
DSF Scholarships
High School w/ Future Centers Total Scholars Award Total Proportion of
Total AwardsAbraham Lincoln 214 $971,557 10%
Bruce Randolph 12 $38,150 <1%
Denver School of Science and Technology
78 $461,954 5%
East 196 $973,331 10%
George Washington 203 $1,139,950 12%
John F. Kennedy 202 $1,007,200 10%
Manual 0 $0 0%
Martin Luther King Jr. Early College 31 $102,569 1%
Montbello 193 $981,658 10%
North 97 $391,409 4%
South 279 $1,465,056 15%
Southwest Early College 19 $77,631 1%
Thomas Jefferson 156 $805,499 8%
West 118 $478,594 5%
All Others High Schools (pg. 11) 187 $764,290 8%
Total 1,985 $9,658,847 100%
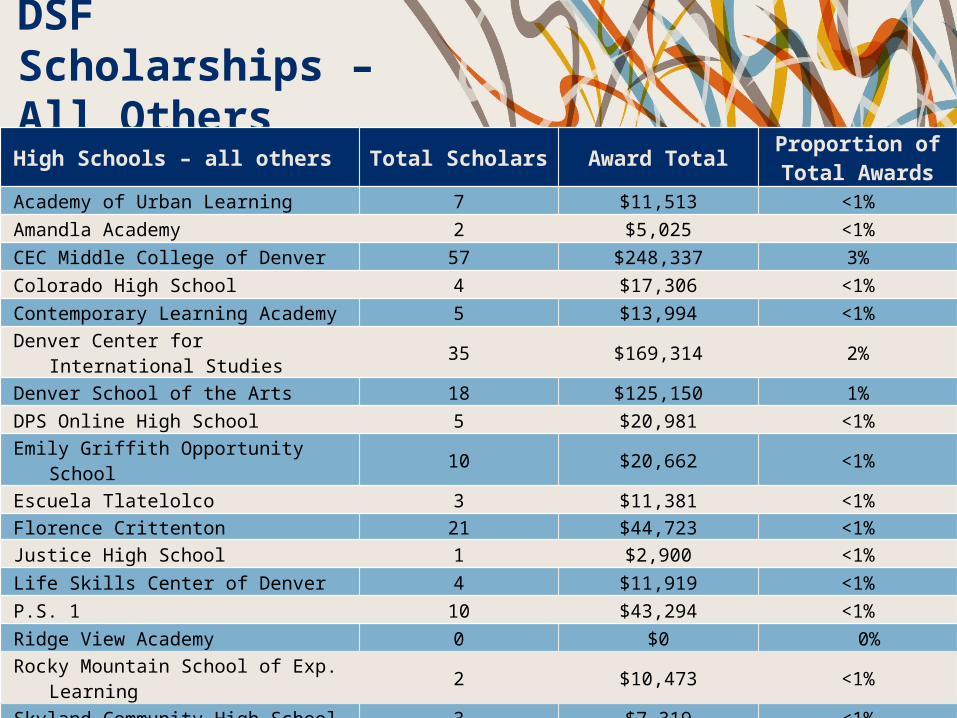
DSF Scholarships – All OthersHigh Schools – all others Total Scholars Award Total Proportion of
Total AwardsAcademy of Urban Learning 7 $11,513 <1%
Amandla Academy 2 $5,025 <1%
CEC Middle College of Denver 57 $248,337 3%
Colorado High School 4 $17,306 <1%
Contemporary Learning Academy 5 $13,994 <1%Denver Center for International
Studies35 $169,314 2%
Denver School of the Arts 18 $125,150 1%
DPS Online High School 5 $20,981 <1%
Emily Griffith Opportunity School 10 $20,662 <1%
Escuela Tlatelolco 3 $11,381 <1%Florence Crittenton 21 $44,723 <1%Justice High School 1 $2,900 <1%
Life Skills Center of Denver 4 $11,919 <1%
P.S. 1 10 $43,294 <1%
Ridge View Academy 0 $0 0%Rocky Mountain School of Exp.
Learning2 $10,473 <1%
Skyland Community High School 3 $7,319 <1%Future Center High Schools (pg.
10)1,798 $8,894,557 92%
Total 1,985 $9,658,847 100%

Colleges DSF Scholars Attend
Technical Colleges Fall 10Spring
11 State Colleges (cont.) Fall 10
Spring 11
Emily Griffith Opportunity School 9 pending Mesa State College 22 11
Pickens Technical College 2 1 Metropolitan State College of Denver 172 167
Community Colleges Western State College of Colorado 4 4
AIMS Community College 4 4 State UniversitiesArapahoe Community College 31 26 Colorado School of Mines 16 14
Colorado Mountain College 1 1 Colorado State University 128 131
CO Northwestern Com. College 1 1 Colorado State University-Pueblo 51 51
Community College of Aurora 10 15 University of Colorado at Boulder 122 120
Community College of Denver 250 202 University of Colorado at Colorado Springs 14 14
Front Range Community College 3 1 University of Colorado Denver 187 181
Northeastern Junior College 12 6 University of Northern Colorado 121 118
Otero Junior College 2 0
Pikes Peak Community College 0 1Private Colleges & Universities
Red Rocks Community College 19 16 Colorado Christian University 2 2
Trinidad State Junior College 0 2 Colorado College 7 8
State Colleges Johnson & Wales University 6 6
Adams State College 11 11 Regis University 27 25
Fort Lewis College 2 3 University of Denver 68 69
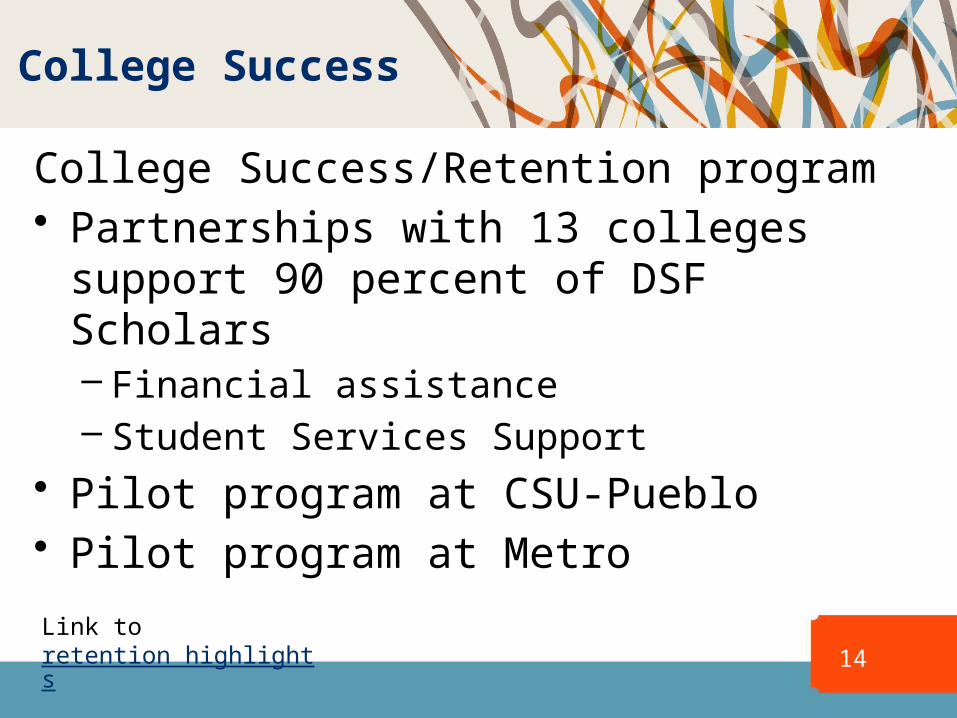
College Success
College Success/Retention program• Partnerships with 13 colleges support
90 percent of DSF Scholars– Financial assistance– Student Services Support
• Pilot program at CSU-Pueblo• Pilot program at Metro
14Link to retention highlights
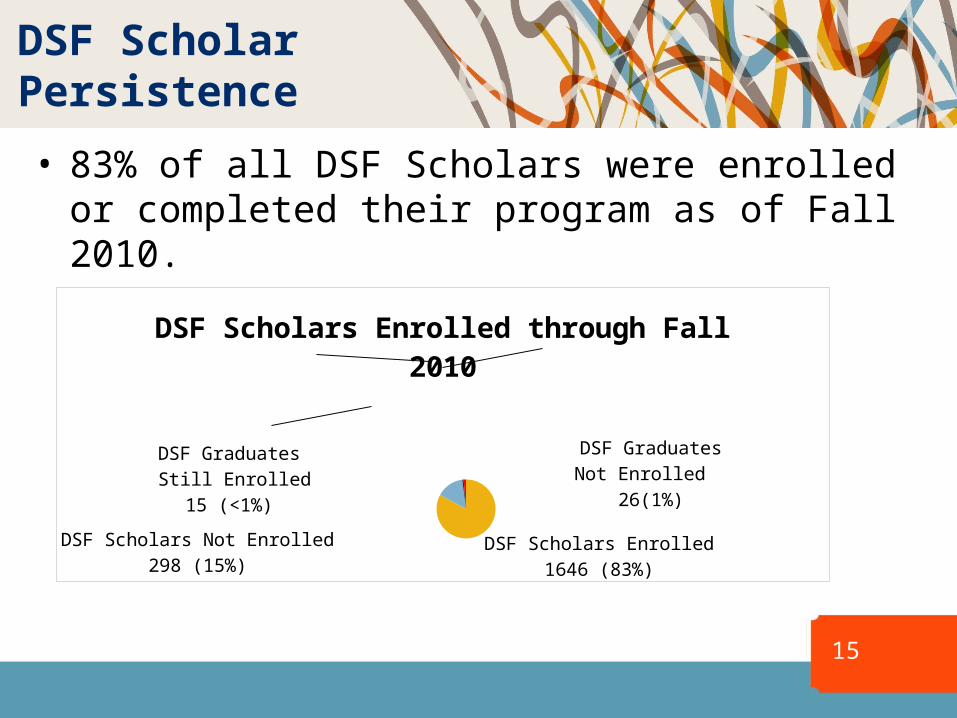
DSF Scholar Persistence
• 83% of all DSF Scholars were enrolled or completed their program as of Fall 2010.
15
DSF Scholars Enrolled1646 (83%)
DSF Scholars Not Enrolled298 (15%)
DSF Graduates Still Enrolled
15 (<1%)
DSF GraduatesNot Enrolled
26(1%)
DSF Scholars Enrolled through Fall 2010
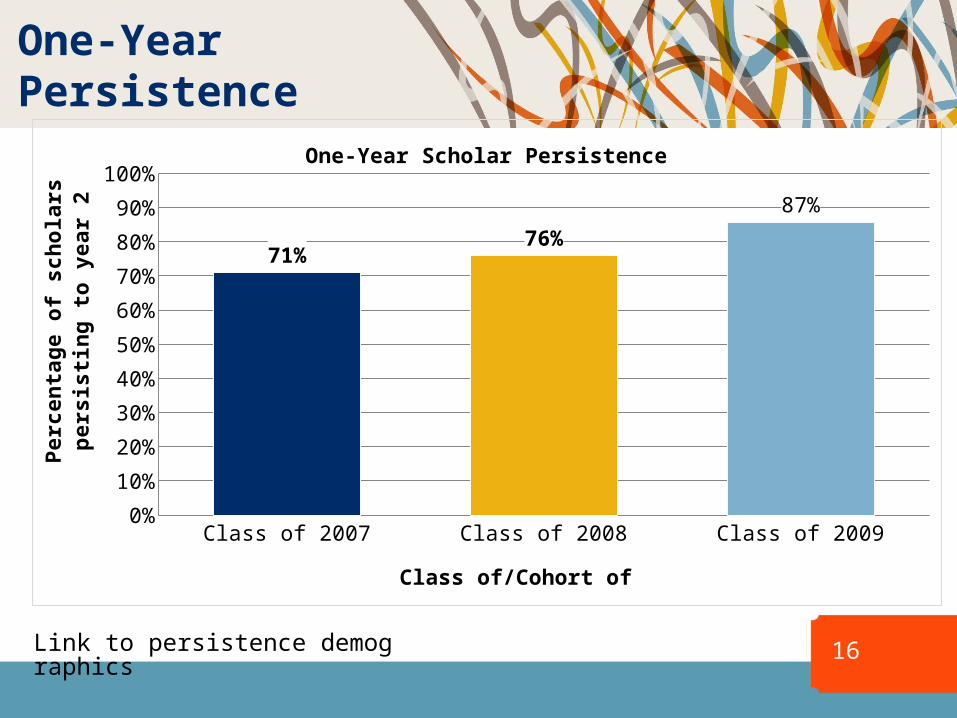
One-Year Persistence
Class of 2007 Class of 2008 Class of 20090%
10%
20%
30%
40%
50%
60%
70%
80%
90%
100%
71%76%
87%
One-Year Scholar Persistence
Class of/Cohort of
Pe
rce
nta
ge
of
sc
ho
lars
pe
rsis
tin
g t
o
ye
ar
2
16Link to persistence demographics
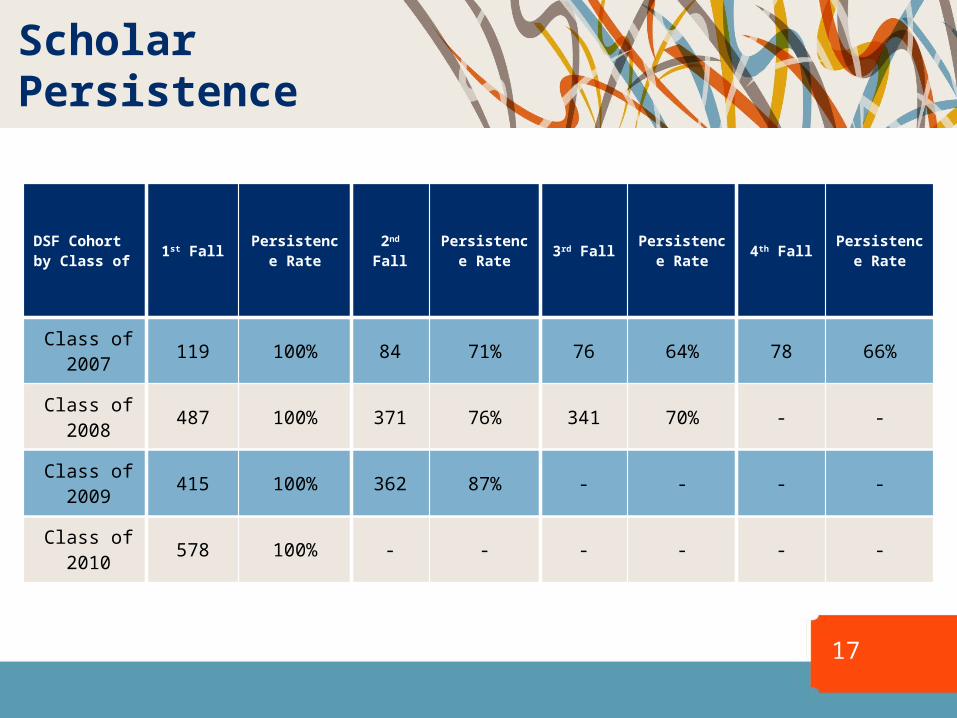
Scholar Persistence
17
DSF Cohort by Class of
1st FallPersistenc
e Rate2nd Fall
Persistence Rate
3rd FallPersistenc
e Rate4th Fall
Persistence Rate
Class of 2007
119 100% 84 71% 76 64% 78 66%
Class of 2008
487 100% 371 76% 341 70% - -
Class of 2009
415 100% 362 87% - - - -
Class of 2010
578 100% - - - - - -
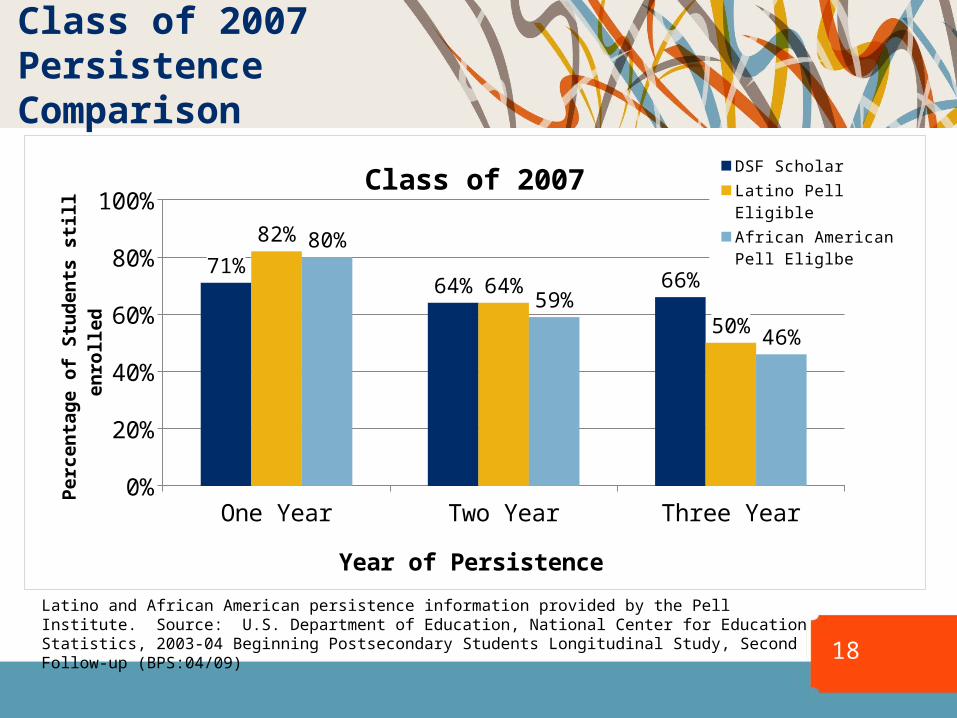
Class of 2007PersistenceComparison
18
One Year Two Year Three Year0%
10%20%30%40%50%60%70%80%90%
100%
71%64% 66%
82%
64%
50%
80%
59%
46%
Class of 2007 DSF Scholar
Latino Pell Eligible
African American Pell Eliglbe
Year of Persistence
Pe
rce
nta
ge
of
Stu
de
nts
sti
ll e
nro
lled
Latino and African American persistence information provided by the Pell Institute. Source: U.S. Department of Education, National Center for Education Statistics, 2003-04 Beginning Postsecondary Students Longitudinal Study, Second Follow-up (BPS:04/09)
19
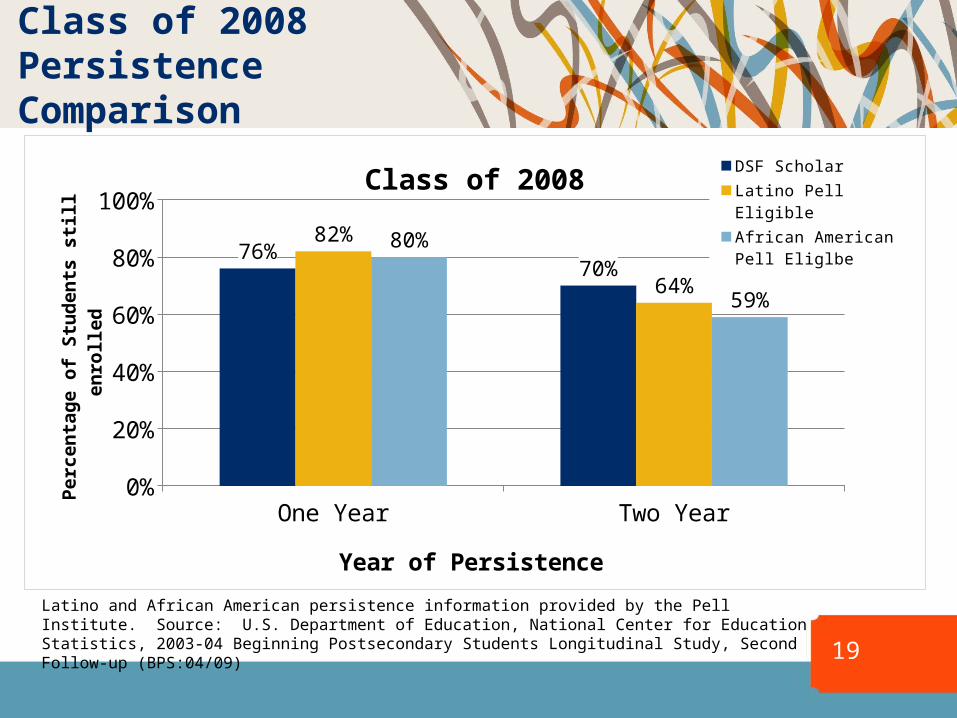
One Year Two Year0%
10%20%30%40%50%60%70%80%90%
100%
76%70%
82%
64%
80%
59%
Class of 2008 DSF Scholar
Latino Pell Eligible
African American Pell Eliglbe
Year of Persistence
Pe
rce
nta
ge
of
Stu
de
nts
sti
ll e
nro
lled
Latino and African American persistence information provided by the Pell Institute. Source: U.S. Department of Education, National Center for Education Statistics, 2003-04 Beginning Postsecondary Students Longitudinal Study, Second Follow-up (BPS:04/09)
Class of 2008PersistenceComparison
20
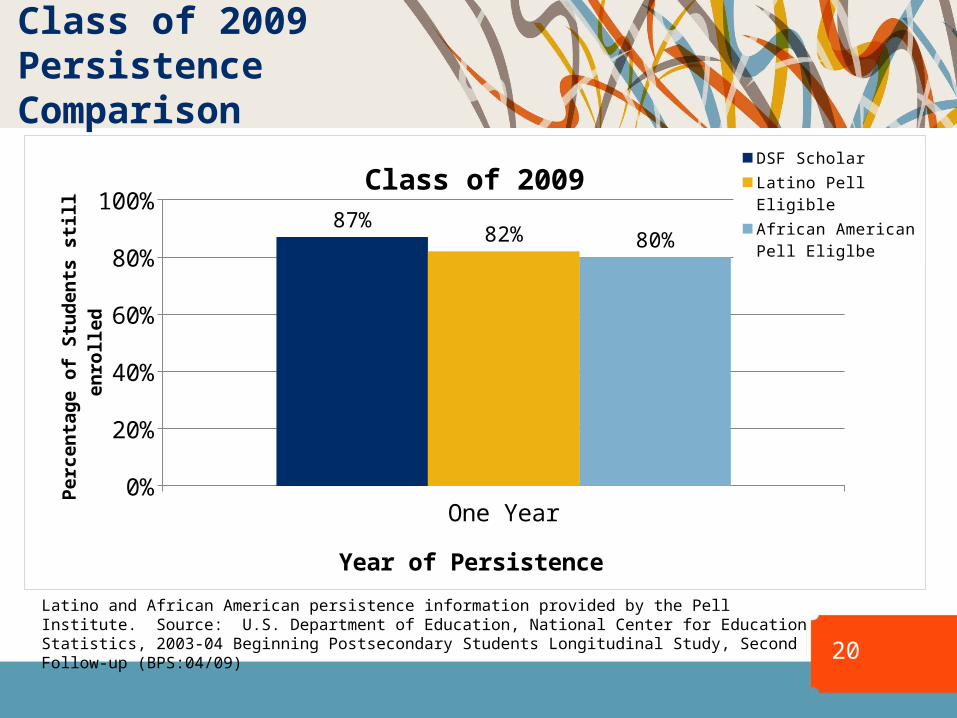
One Year0%
10%20%30%40%50%60%70%80%90%
100%87%
82% 80%
Class of 2009 DSF Scholar
Latino Pell Eligible
African American Pell Eliglbe
Year of Persistence
Pe
rce
nta
ge
of
Stu
de
nts
sti
ll e
nro
lled
Latino and African American persistence information provided by the Pell Institute. Source: U.S. Department of Education, National Center for Education Statistics, 2003-04 Beginning Postsecondary Students Longitudinal Study, Second Follow-up (BPS:04/09)
Class of 2009PersistenceComparison
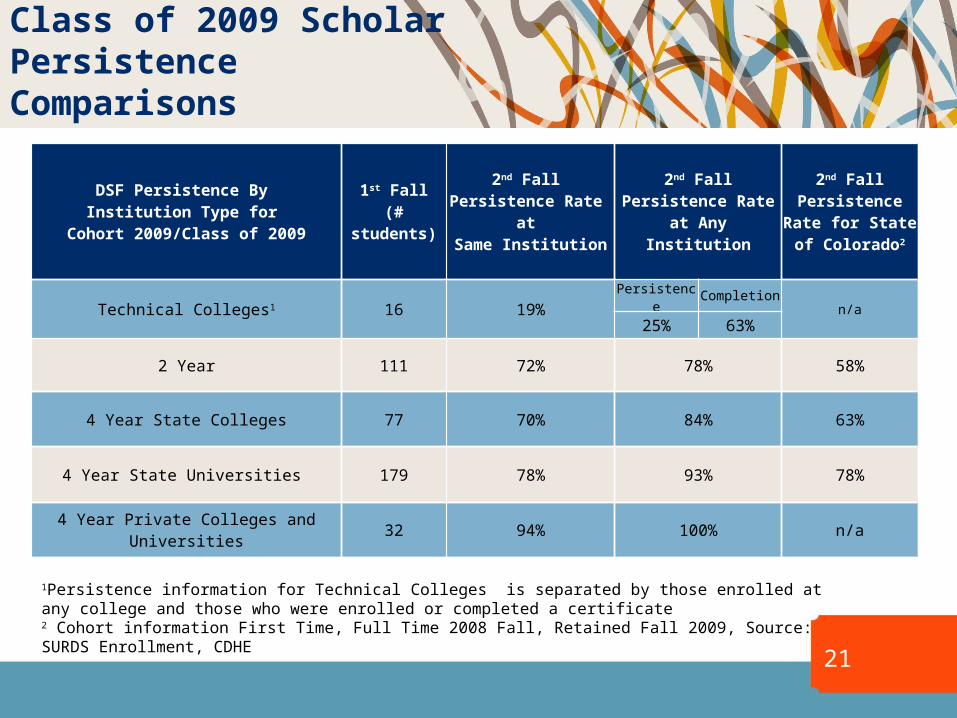
Class of 2009 ScholarPersistence Comparisons
21
DSF Persistence By Institution Type for
Cohort 2009/Class of 2009
1st Fall(#
students)
2nd Fall Persistence Rate
at Same Institution
2nd FallPersistence Rate at Any Institution
2nd Fall Persistence
Rate for State of Colorado2
Technical Colleges1 16 19%Persistence Completion
n/a25% 63%
2 Year 111 72% 78% 58%
4 Year State Colleges 77 70% 84% 63%
4 Year State Universities 179 78% 93% 78%
4 Year Private Colleges and Universities
32 94% 100% n/a
1Persistence information for Technical Colleges is separated by those enrolled at any college and those who were enrolled or completed a certificate2 Cohort information First Time, Full Time 2008 Fall, Retained Fall 2009, Source: SURDS Enrollment, CDHE
Appendices
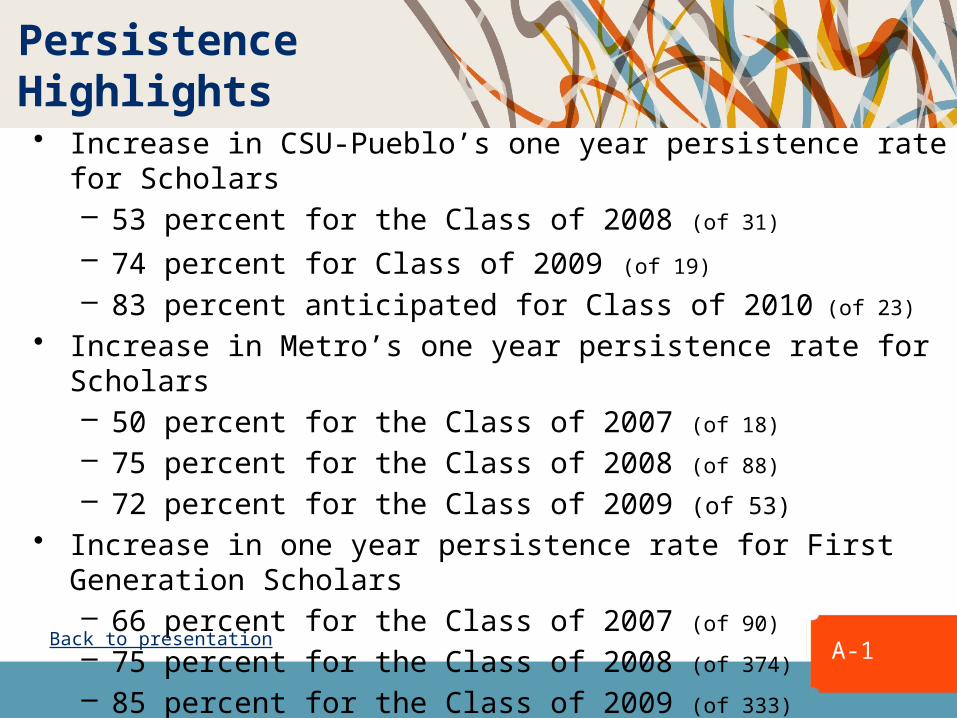
Persistence Highlights
A-1
• Increase in CSU-Pueblo’s one year persistence rate for Scholars– 53 percent for the Class of 2008 (of 31)
– 74 percent for Class of 2009 (of 19)
– 83 percent anticipated for Class of 2010 (of 23)
• Increase in Metro’s one year persistence rate for Scholars – 50 percent for the Class of 2007 (of 18)
– 75 percent for the Class of 2008 (of 88)
– 72 percent for the Class of 2009 (of 53)
• Increase in one year persistence rate for First Generation Scholars– 66 percent for the Class of 2007 (of 90)
– 75 percent for the Class of 2008 (of 374)
– 85 percent for the Class of 2009 (of 333)
Back to presentation
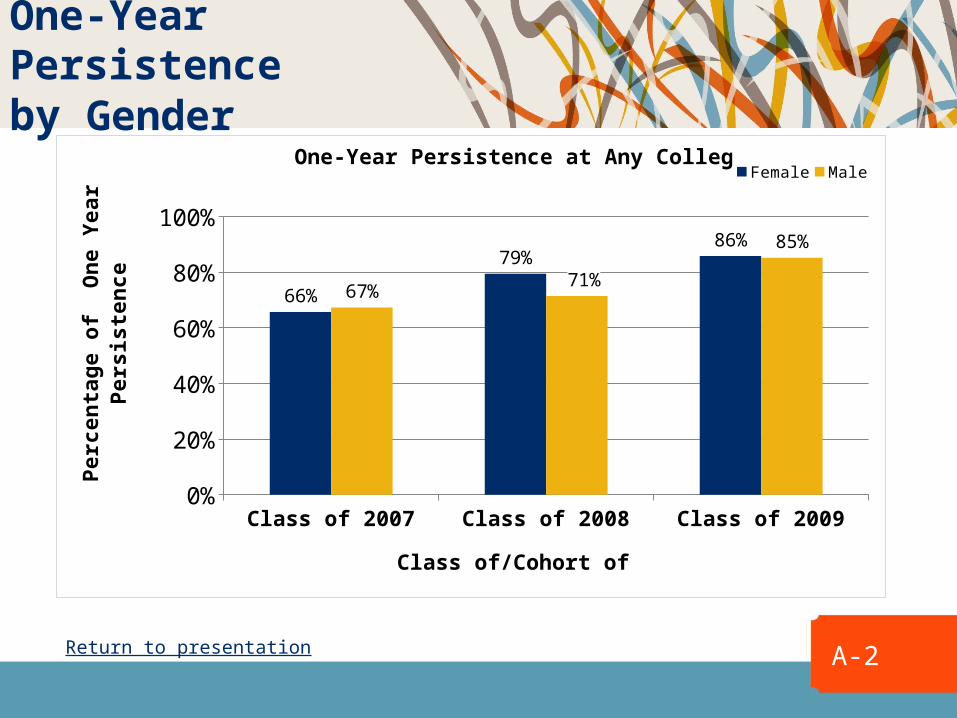
One-Year Persistenceby Gender
A-2
Class of 2007 Class of 2008 Class of 20090%
10%20%30%40%50%60%70%80%90%
100%
66%
79%86%
67%71%
85%
One-Year Persistence at Any CollegeFemale Male
Class of/Cohort of
Pe
rce
nta
ge
of
On
e Y
ea
r P
ers
is-
ten
ce
Return to presentation
Class of 2007 Class of 2008 Class of 20090%
10%
20%
30%
40%
50%
60%
70%
80%
90%
100%
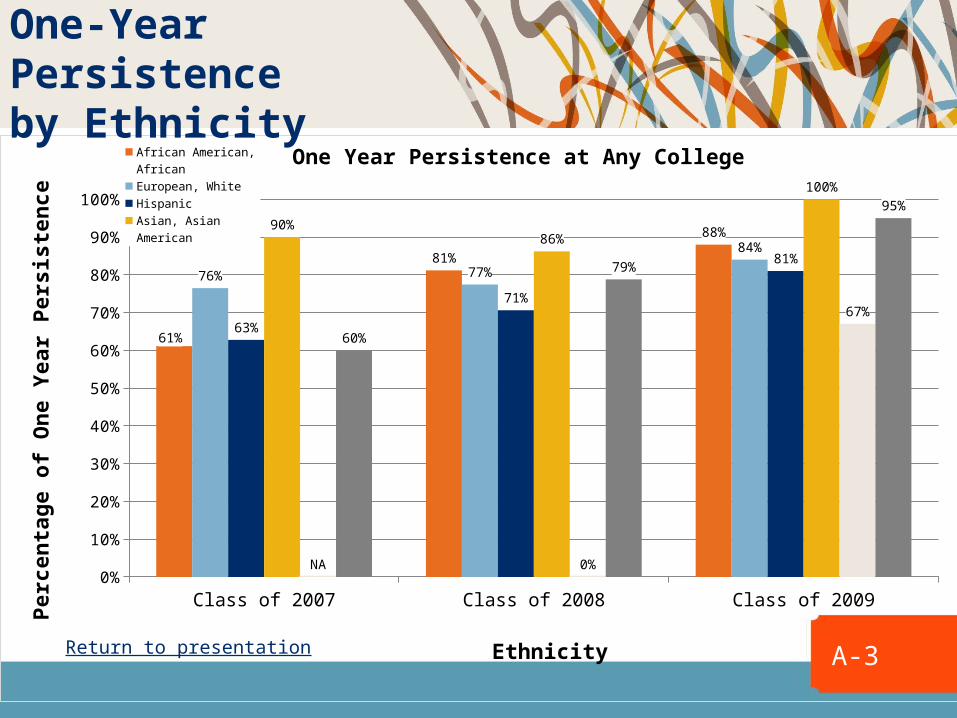
61%
81%
88%
76% 77%
84%
63%
71%
81%
90%86%
100%
NA 0%
67%
60%
79%
95%
One Year Persistence at Any CollegeAfrican American, AfricanEuropean, WhiteHispanicAsian, Asian AmericanNative AmericanOther
Ethnicity
Pe
rce
nta
ge
of
On
e Y
ea
r P
ers
iste
nc
eOne-Year Persistenceby Ethnicity
A-3Return to presentation
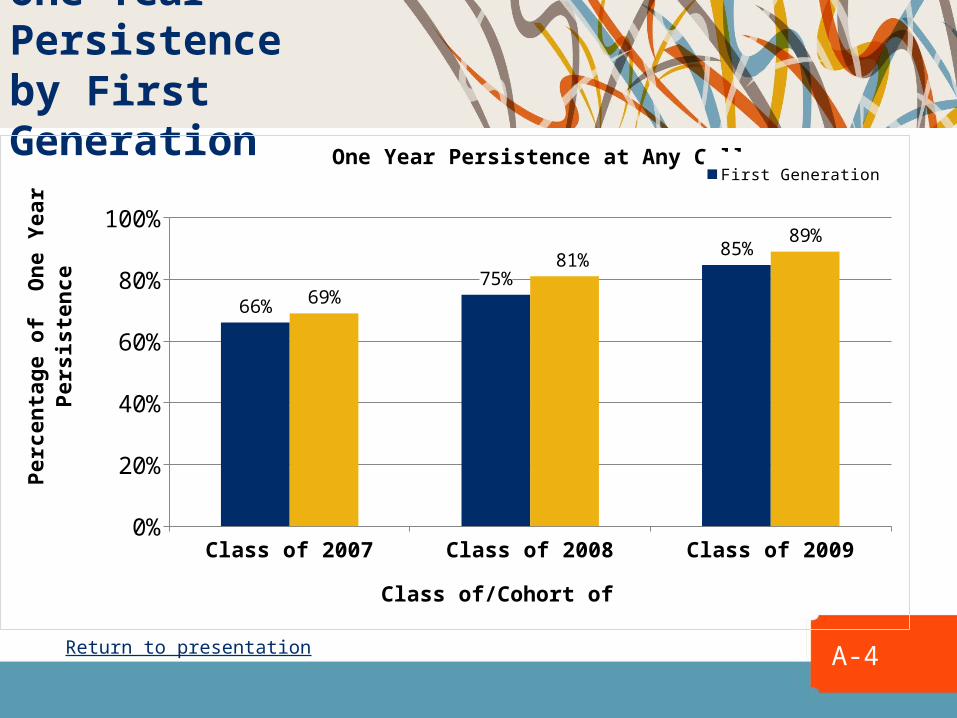
One-Year Persistenceby First Generation
A-4
Class of 2007 Class of 2008 Class of 20090%
10%20%30%40%50%60%70%80%90%
100%
66%
75%
85%
69%
81%
89%
One Year Persistence at Any College First GenerationContinuing Generation
Class of/Cohort of
Pe
rce
nta
ge
of
On
e Y
ea
r P
ers
iste
nc
e
Return to presentation
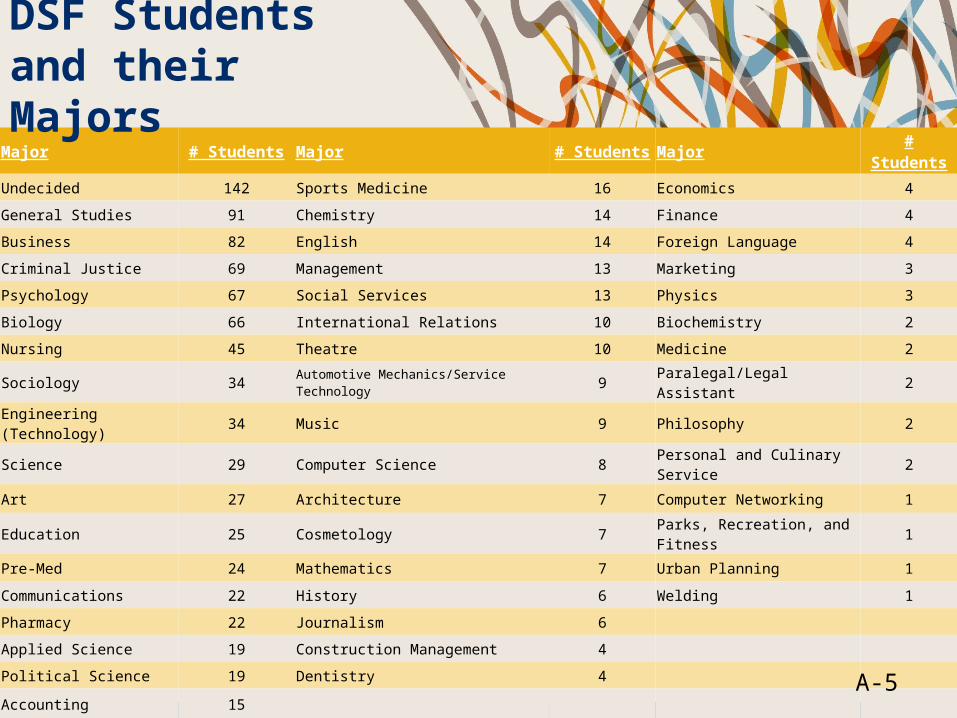
Major # Students Major # Students Major#
Students
Undecided 142 Sports Medicine 16 Economics 4
General Studies 91 Chemistry 14 Finance 4
Business 82 English 14 Foreign Language 4
Criminal Justice 69 Management 13 Marketing 3
Psychology 67 Social Services 13 Physics 3
Biology 66 International Relations 10 Biochemistry 2
Nursing 45 Theatre 10 Medicine 2
Sociology 34 Automotive Mechanics/Service Technology 9 Paralegal/Legal Assistant 2
Engineering (Technology) 34 Music 9 Philosophy 2
Science 29 Computer Science 8 Personal and Culinary Service 2
Art 27 Architecture 7 Computer Networking 1
Education 25 Cosmetology 7 Parks, Recreation, and Fitness 1
Pre-Med 24 Mathematics 7 Urban Planning 1
Communications 22 History 6 Welding 1
Pharmacy 22 Journalism 6
Applied Science 19 Construction Management 4
Political Science 19 Dentistry 4
Accounting 15
DSF Students and their Majors
A-5