dsquare solutions
TRANSCRIPT
Capability Overview
DSQUARE SOLUTIONS
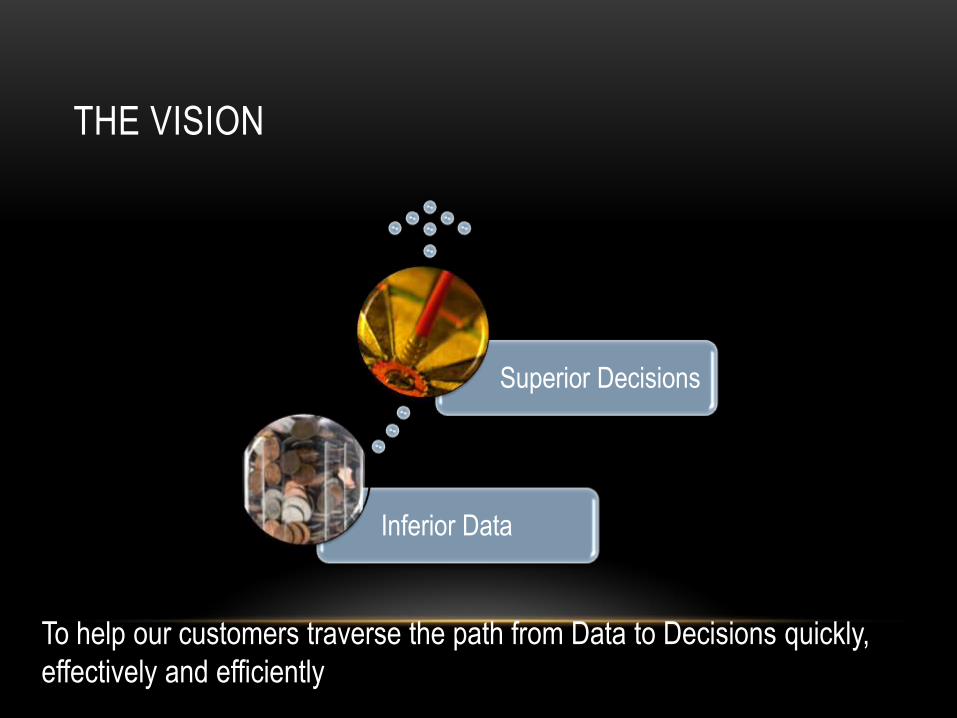
THE VISION
Inferior Data
Superior Decisions
To help our customers traverse the path from Data to Decisions quickly,
effectively and efficiently
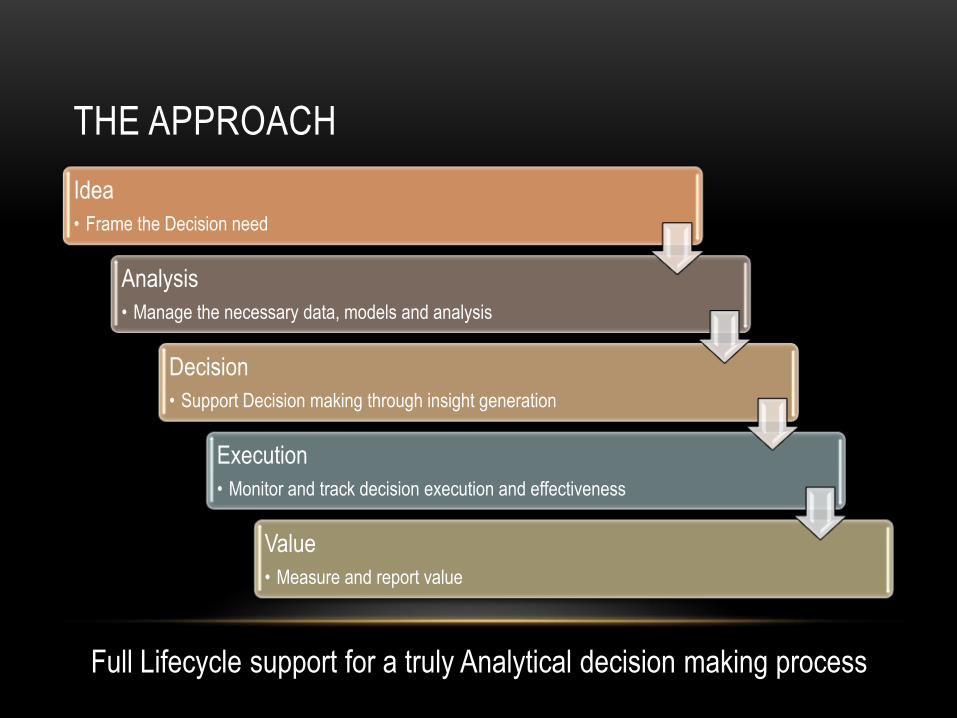
THE APPROACH
Idea
• Frame the Decision need
Analysis
• Manage the necessary data, models and analysis
Decision
• Support Decision making through insight generation
Execution
• Monitor and track decision execution and effectiveness
Value
• Measure and report value
Full Lifecycle support for a truly Analytical decision making process
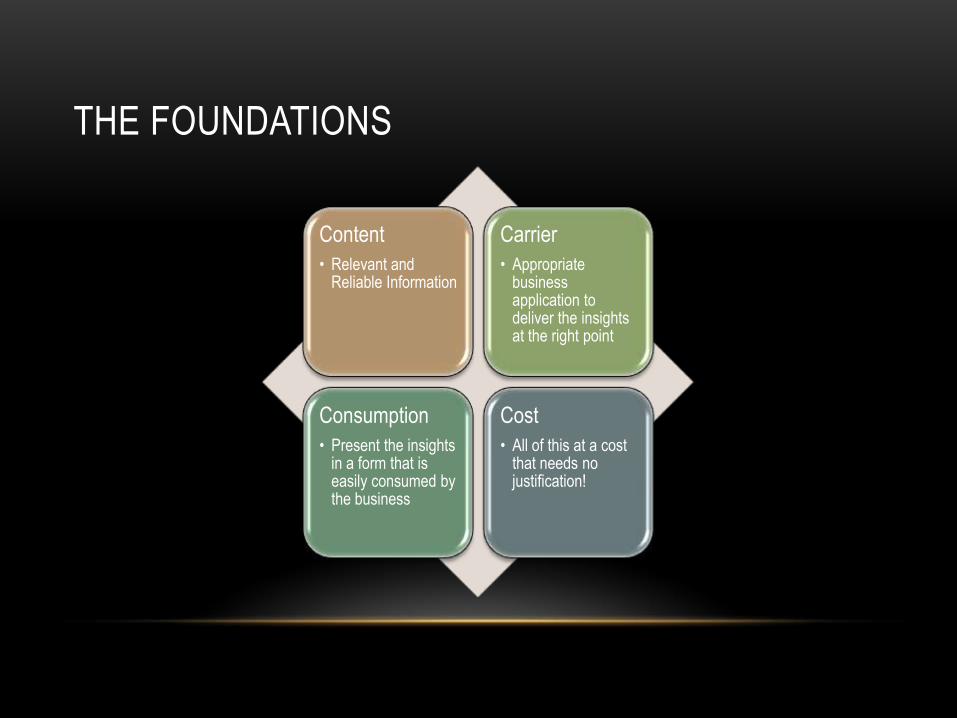
THE FOUNDATIONS
Content
• Relevant and Reliable Information
Carrier
• Appropriate business application to deliver the insights at the right point
Consumption
• Present the insights in a form that is easily consumed by the business
Cost
• All of this at a cost that needs no justification!
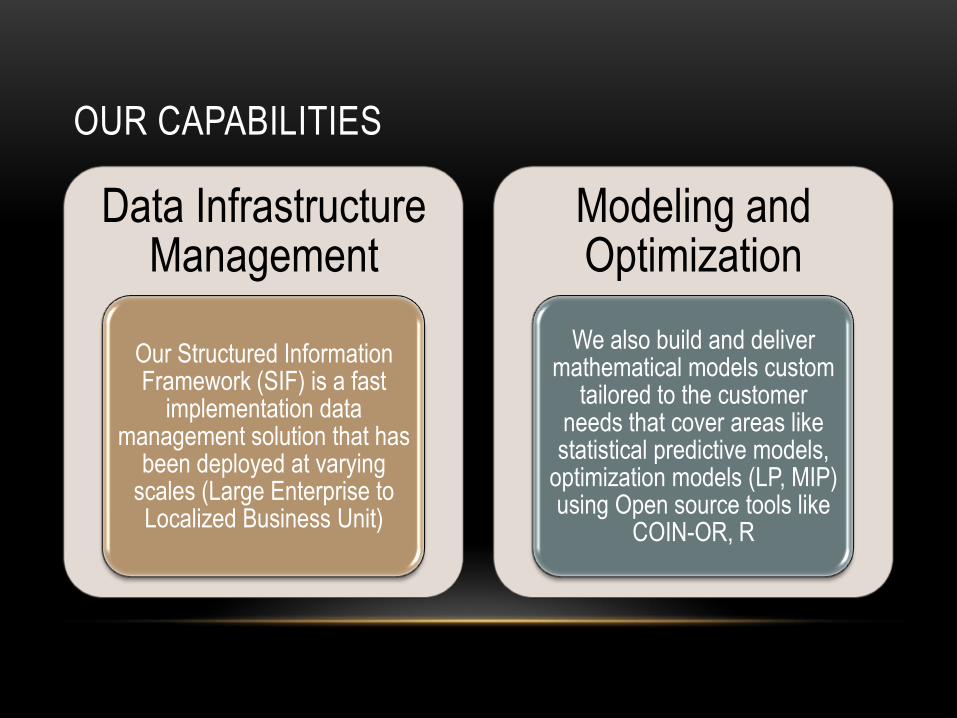
OUR CAPABILITIES
Data Infrastructure Management
Our Structured Information Framework (SIF) is a fast
implementation data management solution that has
been deployed at varying scales (Large Enterprise to Localized Business Unit)
Modeling and Optimization
We also build and deliver mathematical models custom
tailored to the customer needs that cover areas like statistical predictive models,
optimization models (LP, MIP) using Open source tools like
COIN-OR, R
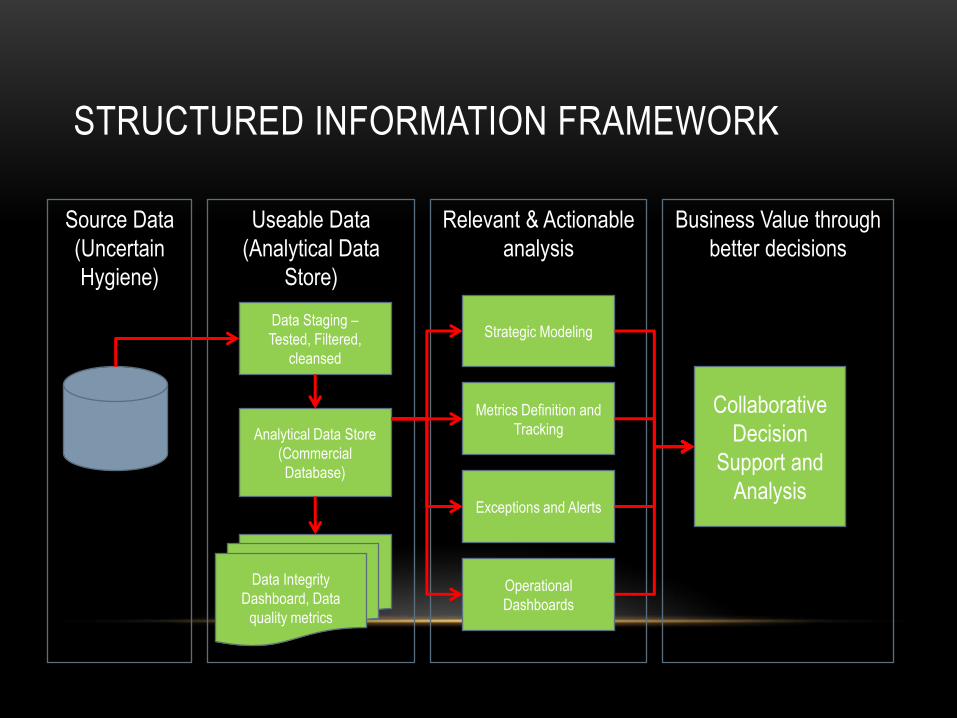
STRUCTURED INFORMATION FRAMEWORK
Source Data
(Uncertain
Hygiene)
Business Value through
better decisions
Useable Data
(Analytical Data
Store)
Data Staging –
Tested, Filtered,
cleansed
Analytical Data Store
(Commercial
Database)
Data Integrity
Dashboard, Data
quality metrics
Relevant & Actionable
analysis
Strategic Modeling
Exceptions and Alerts
Operational
Dashboards
Metrics Definition and
Tracking
Collaborative
Decision
Support and
Analysis
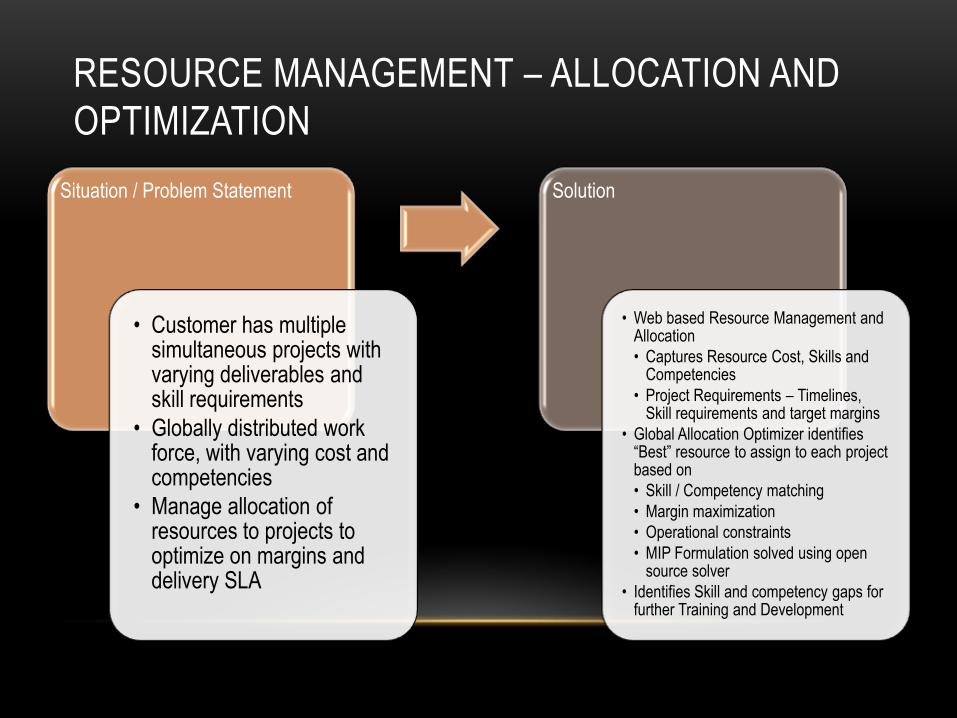
RESOURCE MANAGEMENT – ALLOCATION AND
OPTIMIZATION
Situation / Problem Statement
• Customer has multiple simultaneous projects with varying deliverables and skill requirements
• Globally distributed work force, with varying cost and competencies
• Manage allocation of resources to projects to optimize on margins and delivery SLA
Solution
• Web based Resource Management and Allocation
• Captures Resource Cost, Skills and Competencies
• Project Requirements – Timelines, Skill requirements and target margins
• Global Allocation Optimizer identifies “Best” resource to assign to each project based on
• Skill / Competency matching
• Margin maximization
• Operational constraints
• MIP Formulation solved using open source solver
• Identifies Skill and competency gaps for further Training and Development
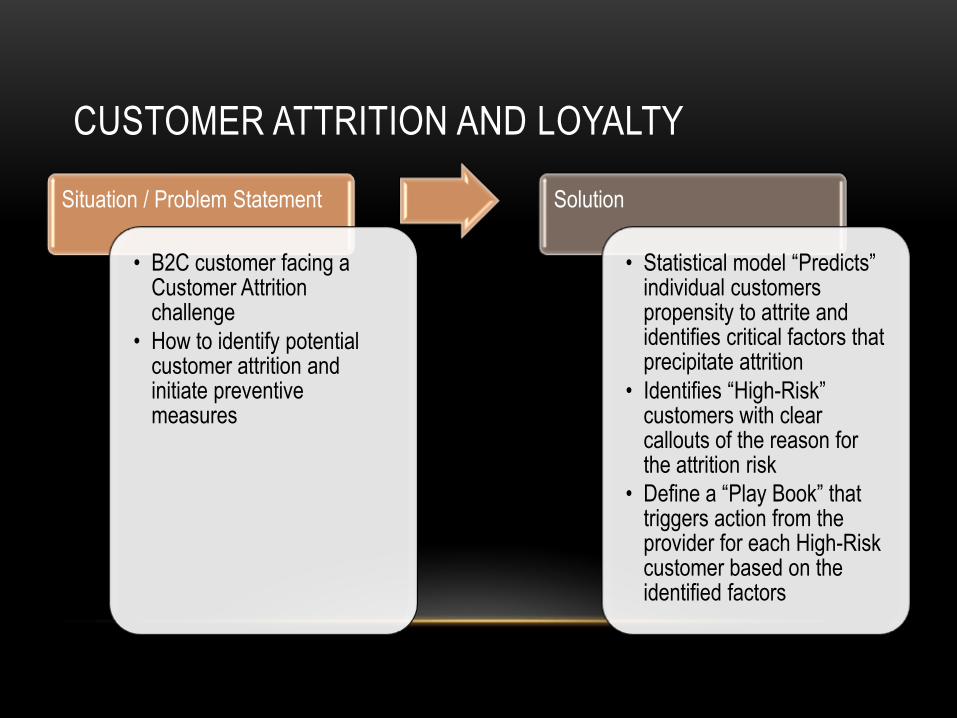
CUSTOMER ATTRITION AND LOYALTY
Situation / Problem Statement
• B2C customer facing a Customer Attrition challenge
• How to identify potential customer attrition and initiate preventive measures
Solution
• Statistical model “Predicts” individual customers propensity to attrite and identifies critical factors that precipitate attrition
• Identifies “High-Risk” customers with clear callouts of the reason for the attrition risk
• Define a “Play Book” that triggers action from the provider for each High-Risk customer based on the identified factors

ENGAGEMENT MODEL
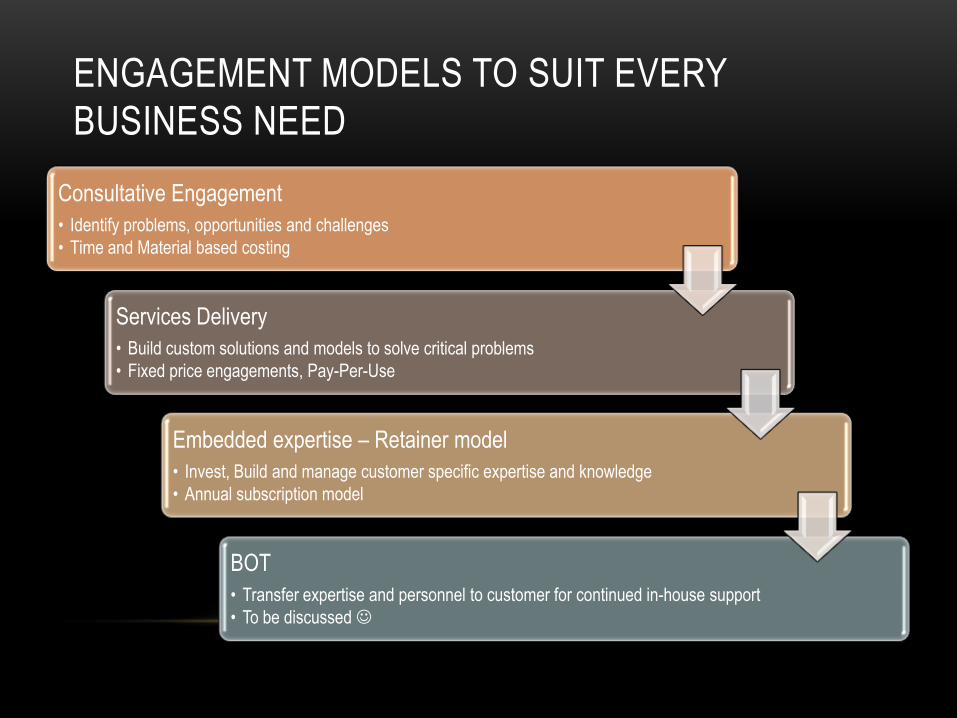
ENGAGEMENT MODELS TO SUIT EVERY
BUSINESS NEED
Consultative Engagement
• Identify problems, opportunities and challenges
• Time and Material based costing
Services Delivery
• Build custom solutions and models to solve critical problems
• Fixed price engagements, Pay-Per-Use
Embedded expertise – Retainer model
• Invest, Build and manage customer specific expertise and knowledge
• Annual subscription model
BOT
• Transfer expertise and personnel to customer for continued in-house support
• To be discussed
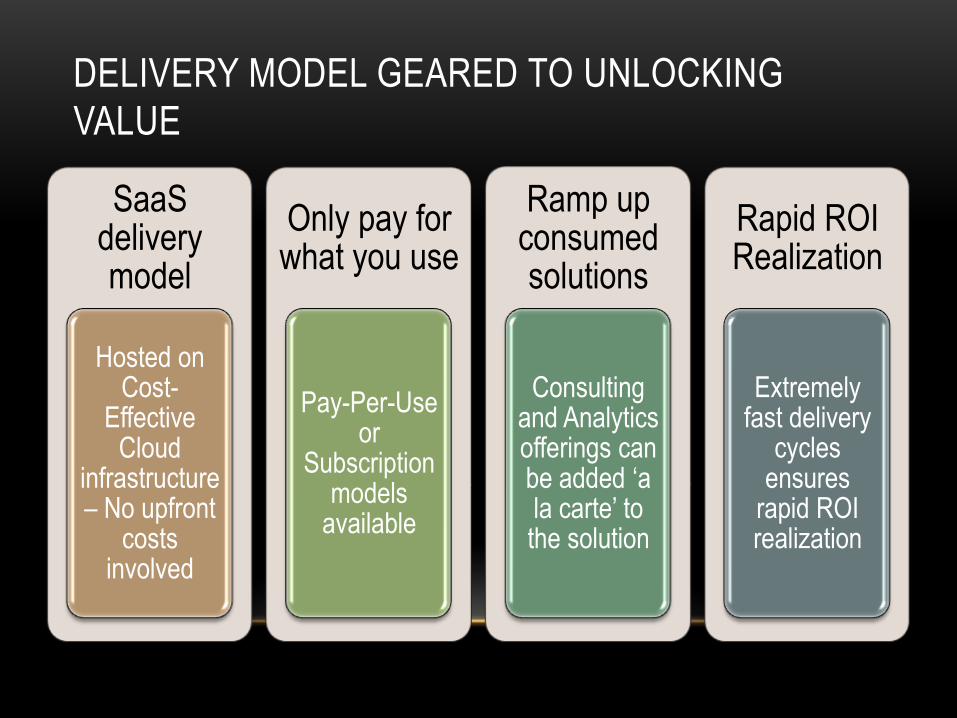
DELIVERY MODEL GEARED TO UNLOCKING
VALUE
SaaS delivery model
Hosted on Cost-
Effective Cloud
infrastructure – No upfront
costs involved
Only pay for what you use
Pay-Per-Use or
Subscription models
available
Ramp up consumed solutions
Consulting and Analytics offerings can be added „a la carte‟ to the solution
Rapid ROI Realization
Extremely fast delivery
cycles ensures
rapid ROI realization
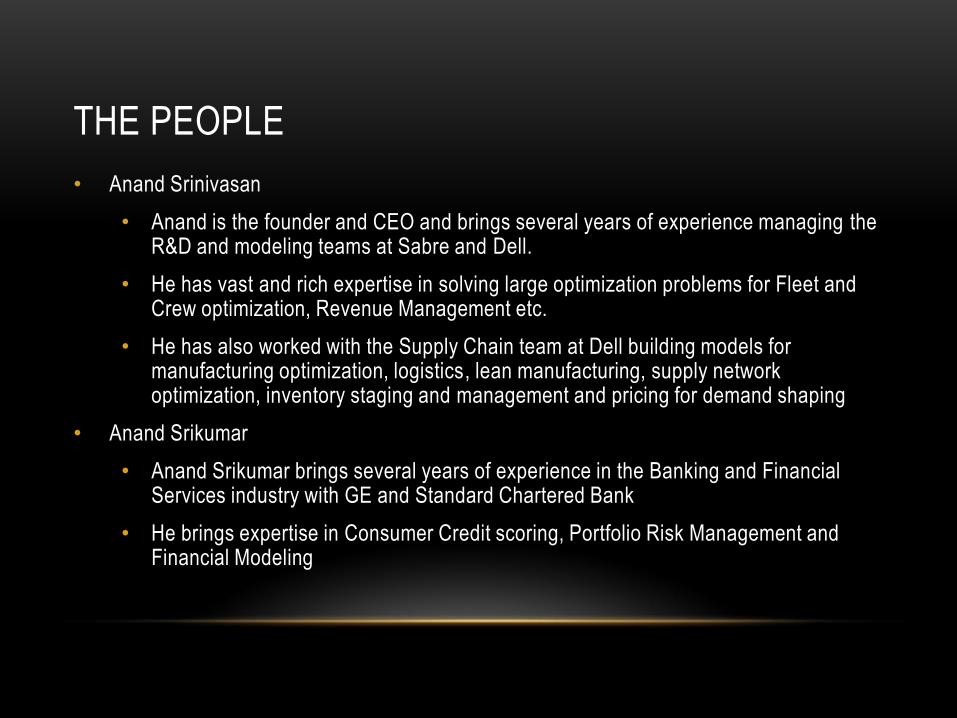
THE PEOPLE
• Anand Srinivasan
• Anand is the founder and CEO and brings several years of experience managing the R&D and modeling teams at Sabre and Dell.
• He has vast and rich expertise in solving large optimization problems for Fleet and Crew optimization, Revenue Management etc.
• He has also worked with the Supply Chain team at Dell building models for manufacturing optimization, logistics, lean manufacturing, supply network optimization, inventory staging and management and pricing for demand shaping
• Anand Srikumar
• Anand Srikumar brings several years of experience in the Banking and Financial Services industry with GE and Standard Chartered Bank
• He brings expertise in Consumer Credit scoring, Portfolio Risk Management and Financial Modeling
CASE STUDIES
Optimization and Advanced Analytical solutions from DSquare

HOTEL REVENUE MANAGEMENT
WHAT IS REVENUE MANAGEMENT AND WHY IS IT
RELEVANT?
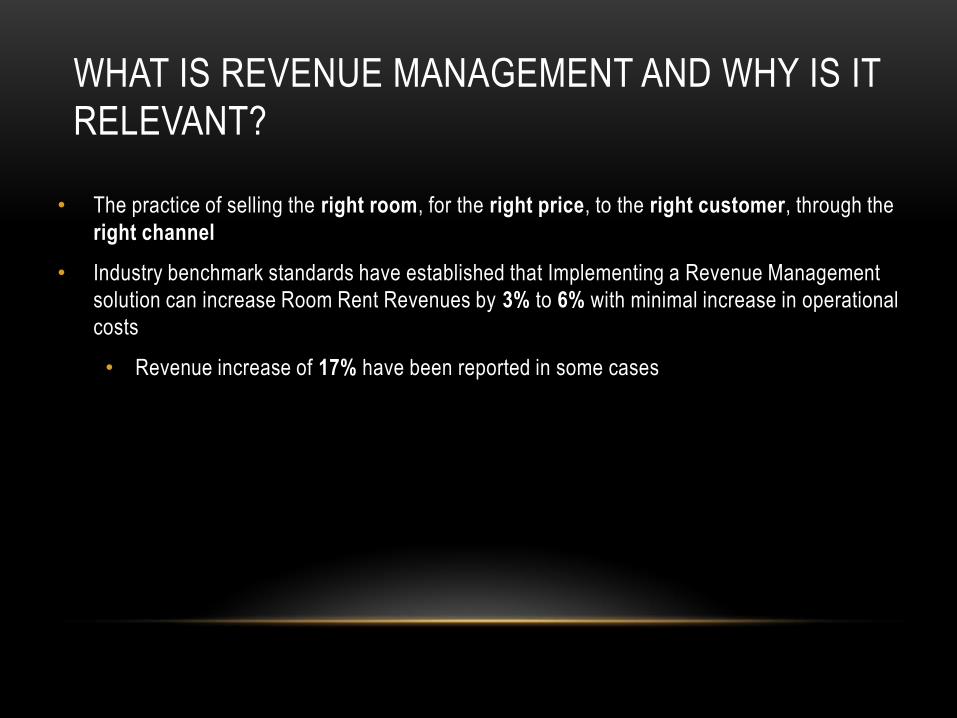
• The practice of selling the right room, for the right price, to the right customer, through the
right channel
• Industry benchmark standards have established that Implementing a Revenue Management
solution can increase Room Rent Revenues by 3% to 6% with minimal increase in operational
costs
• Revenue increase of 17% have been reported in some cases
REVENUE MANAGEMENT COMPONENTS AND
ALGORITHMS
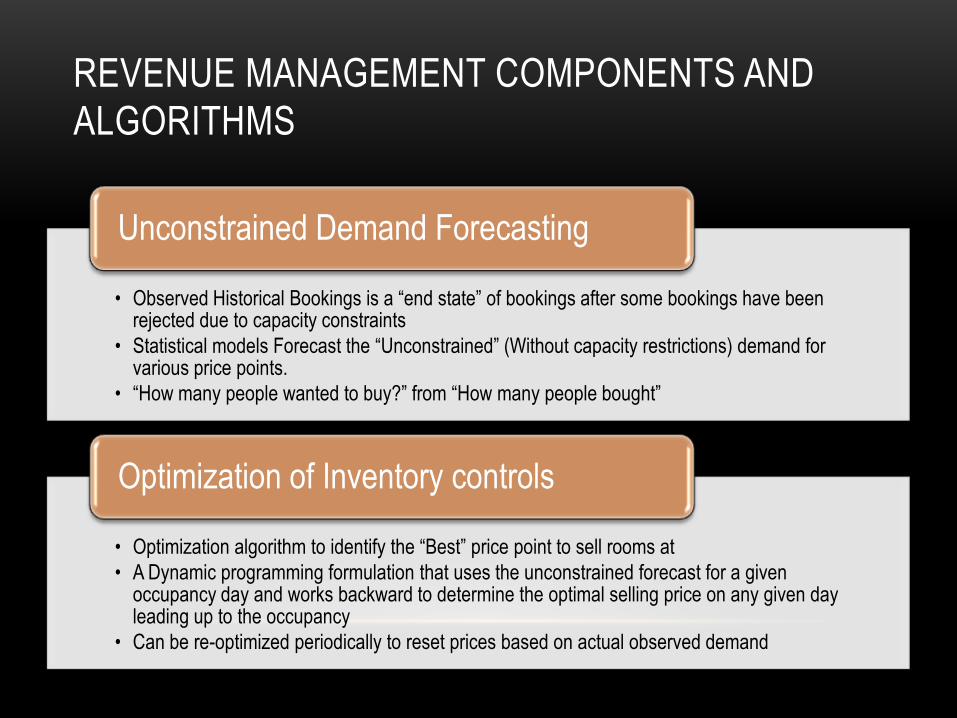
• Observed Historical Bookings is a “end state” of bookings after some bookings have been rejected due to capacity constraints
• Statistical models Forecast the “Unconstrained” (Without capacity restrictions) demand for various price points.
• “How many people wanted to buy?” from “How many people bought”
Unconstrained Demand Forecasting
• Optimization algorithm to identify the “Best” price point to sell rooms at
• A Dynamic programming formulation that uses the unconstrained forecast for a given occupancy day and works backward to determine the optimal selling price on any given day leading up to the occupancy
• Can be re-optimized periodically to reset prices based on actual observed demand
Optimization of Inventory controls
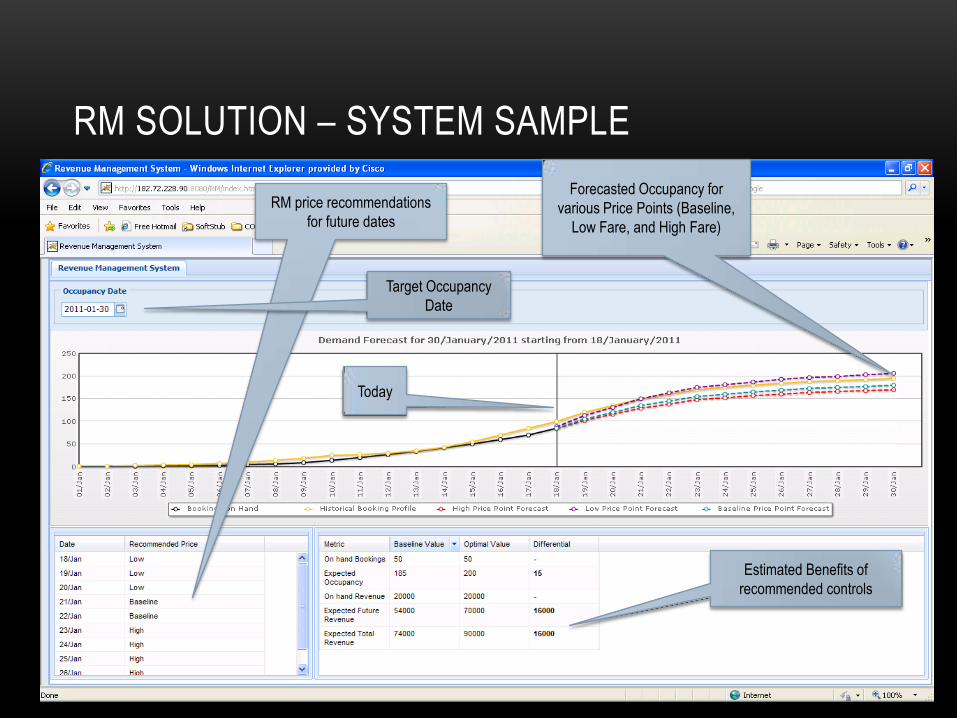
RM SOLUTION – SYSTEM SAMPLE
Today
Forecasted Occupancy for
various Price Points (Baseline,
Low Fare, and High Fare)
RM price recommendations
for future dates
Estimated Benefits of
recommended controls
Target Occupancy
Date

MARKETING PLAN OPTIMIZATION
Consumer Markets
THE PERSONAL COMPUTER MARKET
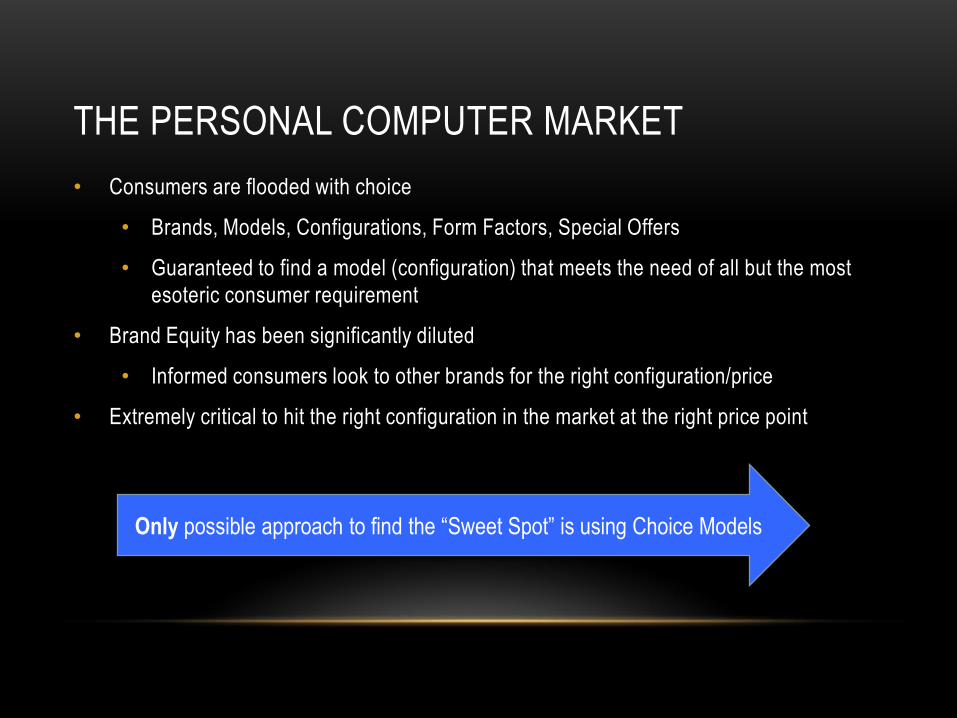
• Consumers are flooded with choice
• Brands, Models, Configurations, Form Factors, Special Offers
• Guaranteed to find a model (configuration) that meets the need of all but the most
esoteric consumer requirement
• Brand Equity has been significantly diluted
• Informed consumers look to other brands for the right configuration/price
• Extremely critical to hit the right configuration in the market at the right price point
Only possible approach to find the “Sweet Spot” is using Choice Models
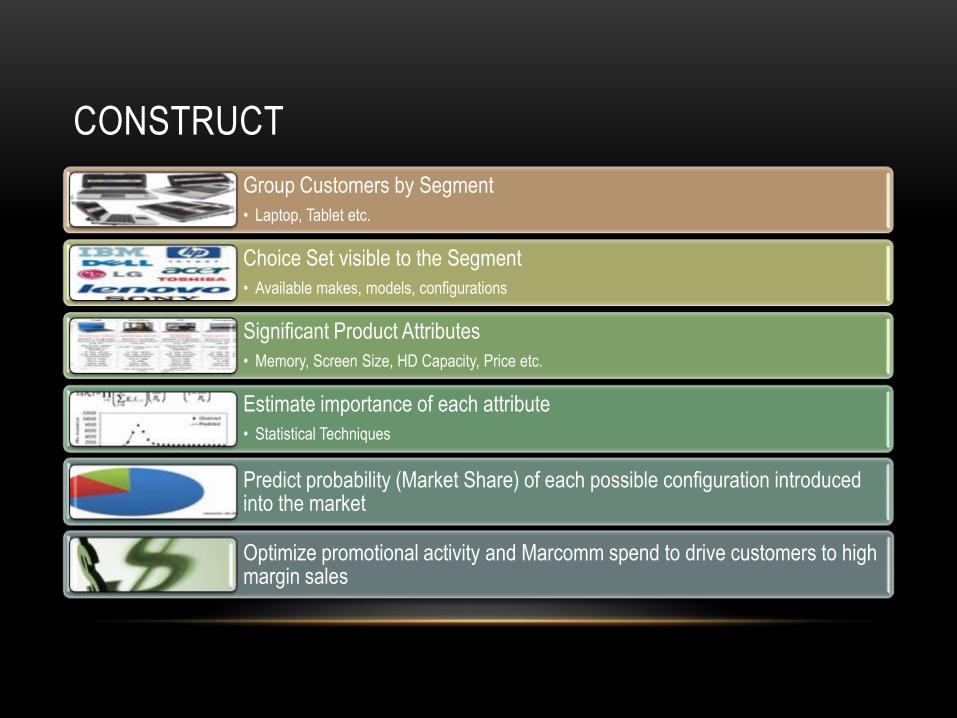
CONSTRUCT
Group Customers by Segment
• Laptop, Tablet etc.
Choice Set visible to the Segment
• Available makes, models, configurations
Significant Product Attributes
• Memory, Screen Size, HD Capacity, Price etc.
Estimate importance of each attribute
• Statistical Techniques
Predict probability (Market Share) of each possible configuration introduced into the market
Optimize promotional activity and Marcomm spend to drive customers to high margin sales
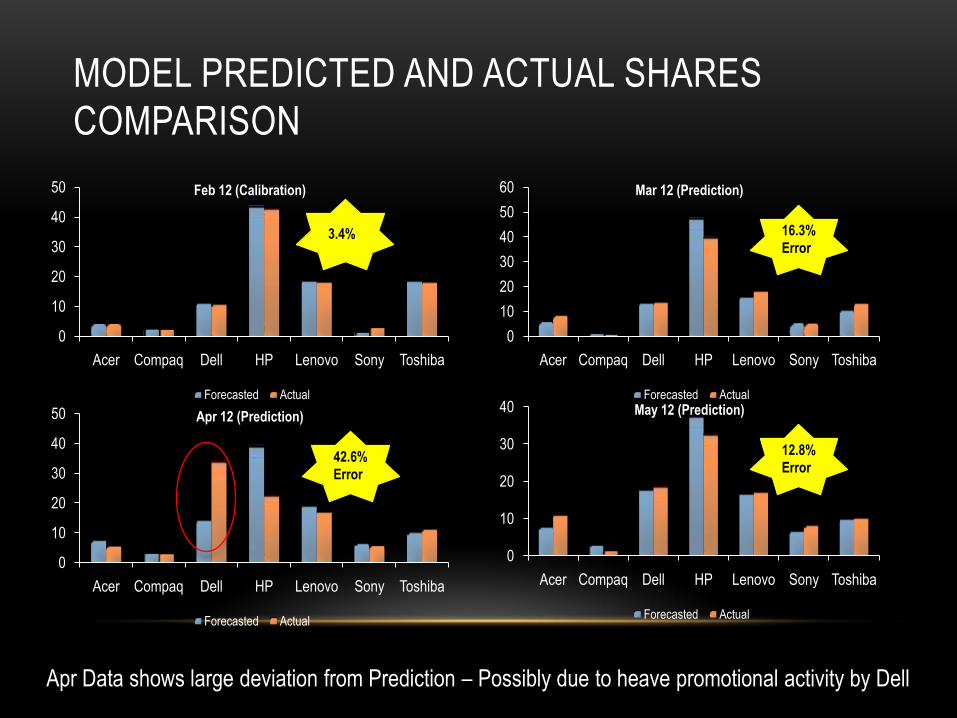
MODEL PREDICTED AND ACTUAL SHARES
COMPARISON
0
10
20
30
40
50
Acer Compaq Dell HP Lenovo Sony Toshiba
Feb 12 (Calibration)
Forecasted Actual
3.4%
0
10
20
30
40
50
60
Acer Compaq Dell HP Lenovo Sony Toshiba
Mar 12 (Prediction)
Forecasted Actual
16.3%
Error
0
10
20
30
40
50
Acer Compaq Dell HP Lenovo Sony Toshiba
Apr 12 (Prediction)
Forecasted Actual
42.6%
Error
0
10
20
30
40
Acer Compaq Dell HP Lenovo Sony Toshiba
May 12 (Prediction)
Forecasted Actual
12.8%
Error
Apr Data shows large deviation from Prediction – Possibly due to heave promotional activity by Dell
HOW TO USE THE MODEL
• Profitability Enhancement
• Clearly identified attributes that impact sales
• Can choose high margin components between “nodes of indifference”
• E.g. Screen Resolution
• Sales Target Setting
• The Model predicts “Fair Share” based on product attributes. Any share capture above that can be attributed to Sales and Marketing Activity
• MarCom ROI
• Can quantify the uplift generated in sales in a given month due the MarCom Spend.
• Apr Marcom/Promotions resulted in +20% market share for Dell
• Competitive Response
• Evaluate the impact of new product launch or price move by competition and respond appropriately