dsti/iccp/iis(2007)4/final working party on … · unclassified dsti/iccp/iis(2007)4/final ......
TRANSCRIPT

Unclassified DSTI/ICCP/IIS(2007)4/FINAL Organisation de Coopération et de Développement Economiques Organisation for Economic Co-operation and Development 29-Jan-2008 ___________________________________________________________________________________________
English text only DIRECTORATE FOR SCIENCE, TECHNOLOGY AND INDUSTRY COMMITTEE FOR INFORMATION, COMPUTER AND COMMUNICATIONS POLICY
Working Party on Indicators for the Information Society
MEASURING SECURITY AND TRUST IN THE ONLINE ENVIRONMENT: A VIEW USING OFFICIAL DATA
JT03239368
Document complet disponible sur OLIS dans son format d'origine Complete document available on OLIS in its original format
DST
I/ICC
P/IIS(2007)4/FINA
L
Unclassified
English text only

DSTI/ICCP/IIS(2007)4/FINAL
2
FOREWORD
This paper reviews available official statistics on trust and security in the online environment. It discusses whether security concerns are an obstacle to Internet use and examines how people and companies protect their equipment and networks.
The paper, prepared by Martin Schaaper of the Economic Analysis and Statistics (EAS) Division of the OECD Directorate for Science, Technology and Industry (DSTI), was discussed by the Working Party on Indicators for the Information Society (WPIIS) in May 2007 and transmitted to the Committee for Information, Computer and Communication Policy (ICCP).
The ICCP Committee declassified the document at its meeting on 4-5 October 2007.
The document is published under the responsibility of the Secretary-General of the OECD.
------------------------------------------------------------------------------------------------------------------------------
AVANT-PROPOS
Le présent document examine les statistiques officielles disponibles sur la confiance et la sécurité dans l�environnement en ligne. Il débat de la question de savoir si les problèmes de sécurité sont un obstacle à l�utilisation de l�Internet et examine la façon dont les individus et les entreprises protègent leurs équipements et leurs réseaux.
Ce document, préparé par Martin Schaaper de la Division des analyses économiques (AES) de la Direction de la science, de la technologie et de l�industrie de l�OCDE, a été examiné par le Groupe de travail sur les indicateurs pour la société de l�information (GTISI) en mai 2007 et transmis au Comité de la politique de l�information, de l�informatique et des communications (PIIC).
Le Comité PIIC a déclassifié le document à sa réunion des 4 et 5 octobre 2007.
Le document est publié sous la responsabilité du Secrétaire général de l�OCDE.
© Copyright OECD/OCDE, 2008.

DSTI/ICCP/IIS(2007)4/FINAL
3
MAIN POINTS
• Official data on security and trust in the online environment show that despite a growing awareness of security problems and a corresponding growth in security measures taken, security incidents are still widespread and are not abating.
• Furthermore, with more intensive use of the Internet, security problems are increasing � as are the measures taken to counter them.
• Fraud with credit or debit cards is a serious barrier to engaging in e-commerce, but current indications are this affects only a relatively small proportion of online users � although, of course, it can be serious for the victims.
• This raises the challenge for businesses to convince consumers that e-commerce can be conducted in a safe online environment.
• Collecting indicators in an area subject to dynamic technological change remains a statistical challenge. It is important that countries maintain or increase efforts to understand data issues and work to improve indicators in this area.
• A non-exhaustive inventory of sources showed that there are not many data sources on security and trust in relation to e-government. Despite the statistical challenges involved, this is an area that should be addressed more at the international level. One of the problem areas in measuring e-government is at what level of government the measurement should be done. The data shown in this paper confirm that this is a real challenge, with large differences observed for the different levels of government.
• In any case, there is a growing demand for data on security and trust and WPIIS could consider exploring new indicators and improving existing approaches. Although measurement may be difficult, some directions that could be investigated are:
- Adopting the existing questions in the business and household model questionnaires of ICT use.
- Expansion of existing indicators, such as a more details on fraudulent payment card use and on spam.
- In conjunction with work on improving measurement of e-government in general, develop indicators on trust and security in e-government, either by drawing on work of countries that carry out surveys in this respect, or by collaborating with the joint WPISP/APEC project on developing a new OECD-APEC Model Survey to guide the development of national surveys for indicators of security and trust targeted at governments.

DSTI/ICCP/IIS(2007)4/FINAL
4
- WPIIS could consider collaborating with the OECD Committee on Consumer Policy in developing common concepts and definitions of online identity theft and in piloting data collection on the size and impact of this phenomenon.
- Developing a common definition of concepts such as e-crime which could allow collection of data to inform questions on the economic and social impact of this phenomenon. Australia�s work in this area could be interesting and useful.
- Develop indicators on how enterprises deal with security incidents, such as whether they have an information security policy in place, how many incidents occurred in the reference period, whether these were reported to the official instances, and so on.

DSTI/ICCP/IIS(2007)4/FINAL
5
POINTS SAILLANTS
• Les données officielles sur la sécurité et la confiance dans l�environnement en ligne montrent que malgré une prise de conscience croissante des problèmes de sécurité et un développement concomitant des mesures de sécurité prises, les incidents de sécurité restent très répandus et ne diminuent pas.
• De plus, avec l�intensification de l�utilisation de l�Internet, les problèmes de sécurité augmentent � tout comme les mesures prises pour les contrer.
• La fraude à la carte de crédit ou de paiement est un obstacle sérieux à la pratique du commerce électronique, mais selon certaines indications elle n�affecterait actuellement qu�une relativement faible proportion d�utilisateurs en ligne � même si, bien entendu, elle peut avoir de sérieuses conséquences pour les victimes.
• Il appartient donc aux entreprises de convaincre les consommateurs que le commerce électronique peut être pratiqué dans un environnement en ligne sécurisé.
• Le recueil d�indicateurs dans un domaine caractérisé par un changement technologique dynamique demeure un défi statistique. Il est important que les pays maintiennent ou accentuent leurs efforts pour comprendre les problèmes de données et qu�ils s�attachent à améliorer les indicateurs dans ce domaine.
• Un recensement non exhaustif des sources a montré qu�il n�existe guère de sources de données sur la sécurité et la confiance dans le contexte de l�administration électronique. Malgré les défis statistiques que cela soulève, c�est un domaine dont il conviendrait de se préoccuper davantage au niveau international. L�une des difficultés de la mesure de l�administration électronique est de déterminer à quel niveau d�administration la mesure doit s�effectuer. Les données présentées dans ce document confirme que c�est un enjeu réel, du fait des grandes différences observées pour les différents niveaux d�administration.
• En tout état de cause, il existe une demande croissante de données sur la sécurité et la confiance, et le GTISI pourrait envisager d�étudier de nouveaux indicateurs et d�améliorer les approches existantes. Bien que la mesure puisse se révéler difficile, un certain nombre de pistes pourraient être explorées :
- L�adoption des questions figurant dans les questionnaires types sur l�utilisation des TIC à l�intention des entreprises et des ménages.
- L�élargissement des indicateurs existants, pour y inclure par exemple davantage de détails sur les paiements frauduleux par carte et sur le spam.
- Conjointement avec les travaux sur l�amélioration de la mesure de l�administration électronique en général, l�élaboration d�indicateurs sur la confiance et la sécurité dans l�administration électronique, soit en s�appuyant sur les travaux de pays qui procèdent à des
DSTI/ICCP/IIS(2007)4/FINAL
6
enquêtes à ce sujet, soit en collaborant au projet conjoint GTSIVP/APEC sur l�élaboration d�une nouvelle enquête type OCDE-APEC destinée à guider l�élaboration d�enquêtes nationales pour des indicateurs de sécurité et de confiance destinés aux pouvoirs publics.
- Le GTISI pourrait envisager de collaborer avec le Comité de la politique à l�égard des consommateurs de l�OCDE pour l�élaboration de définitions et concepts communs du vol d�identité en ligne et pour le pilotage du recueil de données sur l�ampleur et l�impact de ce phénomène.
- L�élaboration d�une définition commune de concepts concernant par exemple la criminalité électronique, qui pourrait permettre le recueil de données apportant des éclairages sur les impacts économiques et sociaux de ce phénomène. Les travaux de l�Australie dans ce domaine pourraient être intéressants et utiles.
- L�élaboration d�indicateurs sur la façon dont les entreprises traitent les incidents de sécurité, par exemple pour savoir si elles ont mis en place une politique de sécurité de l�information, le nombre d�incidents survenus dans la période de référence, si ceux-ci ont été ou non signalés aux autorités, etc.

DSTI/ICCP/IIS(2007)4/FINAL
7
TABLE OF CONTENTS
FOREWORD .................................................................................................................................................. 2
AVANT-PROPOS .......................................................................................................................................... 2
MAIN POINTS ............................................................................................................................................... 3
POINTS SAILLANTS .................................................................................................................................... 5
MEASURING SECURITY AND TRUST IN THE ONLINE ENVIRONMENT: A VIEW USING OFFICIAL DATA .......................................................................................................................................... 8
Introduction ................................................................................................................................................. 8 Internet access barriers ................................................................................................................................ 9 Security facilities in place ......................................................................................................................... 11 Security problems ...................................................................................................................................... 18 Perceived barriers to Internet sales ............................................................................................................ 26 E-commerce problems ............................................................................................................................... 32 Confidence building practices for Internet-commerce .............................................................................. 34 Government and e-security ....................................................................................................................... 35 Other indicators ......................................................................................................................................... 43
CONCLUSIONS .......................................................................................................................................... 47
REFERENCES ............................................................................................................................................. 50
ANNEX 1: COUNTRY CODES .................................................................................................................. 53

DSTI/ICCP/IIS(2007)4/FINAL
8
MEASURING SECURITY AND TRUST IN THE ONLINE ENVIRONMENT: A VIEW USING OFFICIAL DATA
Introduction
The Internet has rapidly become a fundamental infrastructure, critical for economic and social development. As such it is important that the Internet functions in a secure manner and that its users have confidence that it will work in a reliable, safe and secure way. Security and trust in the online environment has therefore become an important goal for policy makers.
Statistics and indicators inform policy makers and provide information to the public. Official data, that is data that are collected or endorsed by official government agencies, are important, as they are typically compiled according to established international and quality standards. Using official data reduces the risk of reporting incorrect results which can, for example, occur when sample surveys are too small or biased or, in the case of the Internet, company or network specific.
Measuring security and trust in the online environment has been on the agenda of the Working Party on Indicators for the Information Society (WPIIS) for several years. At the 2005 meeting of WPIIS, a paper was presented that took a broad view of trust and security, using a large variety of official and non-official data (OECD, 2005c). The aim of that paper was to provide a scoping study of available indicators and to provide a basis for discussion of amendments to the OECD�s model surveys. This paper focuses on security and trust issues, using official data, as collected by National Statistical Offices or responsible Ministries. Box 1 provides details on the data sources and some methodological notes.
Using official data, this paper aims to answer the following questions, and is structured accordingly:
• Are security concerns an important reason for people not to access the Internet?
• How do people and companies protect their equipment and networks when they access the Internet?
• Which security and privacy problems are encountered when accessing the Internet?
• How do security and related concerns impede people from buying on-line?
• Are those fears justified?
• What do enterprises do to enhance consumer trust?
These questions will be explored for households, individuals and enterprises. There is considerably less information for government demand and supply on this topic. A separate section towards the end of the paper deals with government and e-security, by making a non-exhaustive inventory of what is available in a few selected countries. Before conclusions are drawn, another section will explore some indicators that are of interest to policy makers and could be considered by the Working Party for future measurement work.

DSTI/ICCP/IIS(2007)4/FINAL
9
Box 1. Data sources and notes
Sources
The most important source of data is Eurostat�s database on ICT usage by households, individuals and enterprises.1 The countries covered by Eurostat are the 27 EU Member States, plus Iceland, Norway, Macedonia and Turkey. The database contains data for the years 2002 to 2006, although data for 2002 are not used. What makes the dataset particularly useful is that it contains many breakdowns, such as by age, education and broadband use for individuals and by size-class and industry for enterprises.
Seven of the eight OECD countries not covered by Eurostat (Australia, Canada, Japan, Korea, Mexico, Switzerland and the United States) have provided data via their replies to the data request for the 2005 Science, Technology and Industry Scoreboard (any subsequent revisions will include data from the 2007 questionnaire as data become available), in some cases complemented by data found on the websites of the responding institutions.2 Member countries able to supply additional data are encouraged to do so.
Finally, data for a few non-OECD economies are included, where these data were readily available. More details on these sources can be found in the References section at the end of this paper.
In the Figures, in general, country codes have been used. Annex 1 provides the country names that correspond to the codes used.
Notes
For individuals, various age cut-offs have been applied. For China, online surveys were carried out in respect of individuals aged 6 and over, using the Internet at least one hour per week. In the case of Korea, persons aged 6 and over were surveyed, although in some cases 12 or 13 years were the cut-off ages (these exceptions are noted). For Japan, the age cut-off was 6 years as well, although in some cases, 15 was the lower barrier (these exceptions are noted). For Brazil the cut-off age was 10 years, for Australia 14 and for Singapore and the United States 15. Finally, the Eurostat data are for individuals aged 16 to 74.
For Australia, the data presented on security measures taken and problems encountered are for active Internet users, who are Internet users aged 14 years and over who, in the 12 months to May 2005, undertook any of the following four activities on-line: undertaking purchases, paying bills, banking or supplying personal information. The data on e-commerce barriers are for all Internet users who did not buy on-line, aged 18 and over.
EU-25 aggregates were calculated by Eurostat only if the available countries represented at least 55% of the number of Member States and at least 60% of the EU population.
For enterprises, the data are for enterprises with 10 or more employees with the following exceptions: Australia 2005 all size classes, Mexico 50 employees or more and Japan 100 employees or more.
1. The Secretariat had direct access to the Eurostat database, but all data are disseminated as well in Eurostat�s NewCronos database.
2. See References at the end, which includes these sources. For New Zealand, no data were available.
Internet access barriers
This first section addresses the question of whether security or privacy concerns are important reasons for people not to access the Internet. This issue will only be looked at for households and individuals, as this is generally not asked of enterprises.
Figure 1 shows that the short answer to this question is that in general, privacy or security concerns are not an important reason for not having Internet access at home. The most important barriers in 2006 (2003 in the case of the United States and Japan) were lack of interest, lack of money and lack of skills. Not having a computer ranked high in the United States and in Brazil (this was not an option in the EU and Japan surveys), which could reflect any of the other categories.

DSTI/ICCP/IIS(2007)4/FINAL
10
Figure 1. Barriers to Internet access at home, 2006 Percentage of households without Internet access
0
10
20
30
40
50
60
70
80
Don't needInternet
Cost toohigh
Lack of skills No computer Other Accesselsewhere
Privacy orsecurity
concerns
Don�t wantInternet
Physicaldisability
EU 25 US (2003) Japan (2003) Korea Brazil Singapore
Notes: EU, Brazil and Japan: multiple answers allowed; US, Korea and Singapore: one reply allowed only; EU, Japan: �equipment cost too high�, instead of �cost too high�; Singapore: data for the category �no computer� are for 2005.
In respect to security and privacy, in the EU, these concerns generally decreased slightly between 2005 and 2006. However, in Cyprus1, Germany and Japan (although in the latter case for the year 2003), still more than 10% of households without Internet access at home declared security or privacy concerns among the main reasons for not having Internet access (Figure 2).
Figure 2. Privacy or security concerns as one of the main reasons for not having access to the Internet at home
Percentage of households without Internet access
02468
101214161820
CY
DE
JAP
(200
3) PT
UK SI
EE
EU
25 FR HU FI LU EL IT
TR (2
004) AT PL
BE NL IS SK
SG
P
BR
A
US
A (2
003) IE DK LT LV SE
CZ
NO
RO
(200
4)
2006 2005
Notes: Japan, Turkey, Korea and Romania: % of all individuals; Singapore, the United States and Korea: respondents were allowed to tick one reason only.
1. a) Note by Turkey: With regard to the Cyprus question, Turkey reserves its position as stated in its
declaration of 1 May 2004. The information in the report under the heading Cyprus relates to the southern part of the Island. There is no single authority representing both Turkish and Greek Cypriot people on the Island. Turkey recognises the Turkish Republic of Northern Cyprus (TRNC). b) Note by all the European Union Member States of the OECD and the European Commission: The Republic of Cyprus is recognised by all members of the United Nations with the exception of Turkey. The information in this report relates to the area under the effective control of the Government of the Republic of Cyprus.
DSTI/ICCP/IIS(2007)4/FINAL
11
Security facilities in place
An important question is what users do to protect themselves against security problems and how they ensure their privacy. This section considers indicators that shed some light on this topic.
Households and individuals
Aggregate level
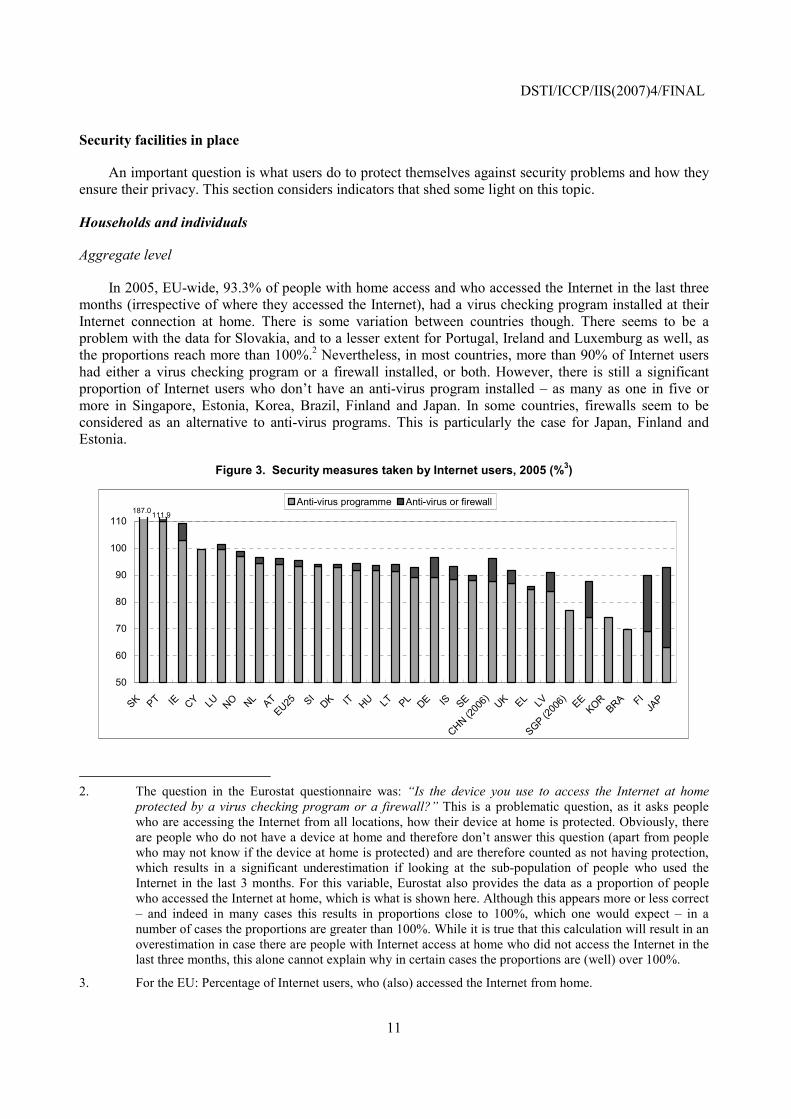
In 2005, EU-wide, 93.3% of people with home access and who accessed the Internet in the last three months (irrespective of where they accessed the Internet), had a virus checking program installed at their Internet connection at home. There is some variation between countries though. There seems to be a problem with the data for Slovakia, and to a lesser extent for Portugal, Ireland and Luxemburg as well, as the proportions reach more than 100%.2 Nevertheless, in most countries, more than 90% of Internet users had either a virus checking program or a firewall installed, or both. However, there is still a significant proportion of Internet users who don�t have an anti-virus program installed � as many as one in five or more in Singapore, Estonia, Korea, Brazil, Finland and Japan. In some countries, firewalls seem to be considered as an alternative to anti-virus programs. This is particularly the case for Japan, Finland and Estonia.
Figure 3. Security measures taken by Internet users, 2005 (%3)
187.0111.9
50
60
70
80
90
100
110
SK PT IE CY LU NO NL ATEU25 SI
DK IT HU LT PL DE IS SE
CHN (200
6) UK EL LV
SGP (200
6) EEKOR
BRA FIJA
P
Anti-virus programme Anti-virus or firewall
2. The question in the Eurostat questionnaire was: �Is the device you use to access the Internet at home
protected by a virus checking program or a firewall?� This is a problematic question, as it asks people who are accessing the Internet from all locations, how their device at home is protected. Obviously, there are people who do not have a device at home and therefore don�t answer this question (apart from people who may not know if the device at home is protected) and are therefore counted as not having protection, which results in a significant underestimation if looking at the sub-population of people who used the Internet in the last 3 months. For this variable, Eurostat also provides the data as a proportion of people who accessed the Internet at home, which is what is shown here. Although this appears more or less correct � and indeed in many cases this results in proportions close to 100%, which one would expect � in a number of cases the proportions are greater than 100%. While it is true that this calculation will result in an overestimation in case there are people with Internet access at home who did not access the Internet in the last three months, this alone cannot explain why in certain cases the proportions are (well) over 100%.
3. For the EU: Percentage of Internet users, who (also) accessed the Internet from home.

DSTI/ICCP/IIS(2007)4/FINAL
12
Looking at firewalls alone, there is a greater variation between countries. The Nordic countries, Portugal, Luxembourg and China rank highly, while Brazil, Greece and Australia rank lowly. The question arises whether the different country measures have the same meaning (Figure 4).
Figure 4. Internet users with a firewall installed, 2005 (%3)
0
10203040
5060
7080
90
FIPT NO LU
CHN (200
6) DK SE UK AT HU
SGP (200
6) NL DEEU25 EE SK IS IE SI
CYJA
P IT LV PL LT BRA ELAUS
A different type of security measure is when people have to use some form of online authentication when using the Internet. This is different from the previous indicators, as it is usually not something they choose to do, but imposed by the website they are visiting. Figure 5 shows a familiar ranking, with the Nordic and the Baltic countries showing the highest proportions, followed by the United Kingdom, the Netherlands and Luxembourg. The figure also shows that online authentication has been growing in importance in almost all countries.
Figure 5. Internet users using online authentication on the Internet for private use, such as a password, PIN or digital signature (%)
0%
10%
20%
30%
40%
50%
60%
70%
80%
90%
RO MK TR BG HU PT CZ SK PL EL CY IE DEEU25 AT SI
LU NL FIEE DK SE UK LT IS NO LV
2005 2004 2003
Breakdowns by socio-economic group
The Eurostat database is very rich, in that it contains aggregated data as well as breakdowns by gender, age, education level, and more. These data are available for all countries but only the breakdowns of the EU25 aggregate are shown here.

DSTI/ICCP/IIS(2007)4/FINAL
13
The data show that broadband users are better protected, even after correcting for home access.4 An Australian report makes a similar observation, by saying that there could be �a positive correlation between intensity of use and security measures taken. This suggests that many of the more intensive transactors are conscious of the need to adopt responsible practices, and they appear to have the knowledge and the means to put in place appropriate measures� (DCITA, 2005).
Figure 6 shows that people in an Objective One region5 of the EU area are more likely to have an anti-virus program installed, but less likely to have a firewall. Gender and education levels have some effect, but only marginally. The distribution over age-classes is parabolic, the middle-aged are more likely to have an anti-virus or a firewall installed than younger or older users. However, in the case of gender, education and age, differences may be within the confidence interval or close to it, therefore not significant.
Figure 6. Internet users in the EU with an anti-virus program or firewall installed, 2005 (%)
0102030405060708090
100
Men
Women
Low ed
ucati
on
Middle
educ
ation
High ed
ucati
on
Broadb
and
No broa
dban
d
Objecti
ve O
ne re
gion
Other r
egion
s
Aged 1
6-24
Aged 2
5-34
Aged 3
5-44
Aged 4
5-54
Aged 5
5-64
Aged 6
5-74
Anti-virus Firewall Anti-virus all individuals Firewall all individuals
In Brazil, a similar parabolic age curve is found. Gender is a more significant explanatory variable in Brazil than in the EU (Figure 7).
4. As for the aggregate level, data are �corrected� to represent only individuals with home access who
accessed the Internet in the last three months (irrespective of whether they accessed the Internet from home or from another location).
5. Objective One regions are regions most at need of the regional policy. To qualify for Objective One status the GDP per capita for the region must be below 75% of the EU average; areas with very low populations also qualify for Objective One status. The recognition of Objective One status is usually accompanied by structural funds support from the European Community as part of its regional policy.

DSTI/ICCP/IIS(2007)4/FINAL
14
Figure 7. Internet users in Brazil with an anti-virus program or firewall installed, 2005 (%)
01020304050607080
Men Women Aged 10-15 Aged 16-24 Aged 25-34 Aged 35-44 Aged 45-59 Aged 60+
Anti-virus Firewall Anti-virus all individuals Firewall all individuals
Concerning online authentication, age does not make a big difference, but for the other groups substantial differences can be observed. Individuals who do not live in Objective One regions are more likely to use online authentication, as are broadband users. Furthermore, the higher the education level, the more likely a person is to use online authentication. As was pointed out before, online authentication is imposed by the website visited, and is frequently related to e-commerce. Therefore, this all strongly suggests there is a correlation between online authentication and income (Figure 8).
Figure 8. Internet users in the EU using online authentication on the Internet for private use, such as a password, PIN or digital signature, 2005 (%)
0%10%20%30%40%50%60%70%80%
Men
Wom
en
Low ed
ucati
on
Middle
educ
ation
High ed
ucati
on
Broadb
and
No broa
dban
d
Objecti
ve O
ne re
gion
Other r
egion
s
All individuals
Enterprises
Aggregate level
In the EU, almost all enterprises with Internet access have virus-checking software. Firewalls are growing in use, while the use of other security measures is relatively stable.6 In other countries for which data are available the trends are similar. In Japan, the proportion of enterprises with anti-virus software is relatively low, especially considering that only enterprises with more than 100 employees are covered, but this could be because there are two different categories in their survey: �Introduction of virus checking
6. Other categories that are not in the figure, but that were used by at least one country are: introduction of
virus checking software into server systems, backup of critical data, spam filter, physical security, training programs, written IT security policy, virtual private network, network sniffer software and enterprise storage management.

DSTI/ICCP/IIS(2007)4/FINAL
15
software at terminals� (75.3%) and �Introduction of virus checking software into server systems� (70.2%). If these two categories were to be combined, this may well lead to a much higher percentage. The case of Korea is noteworthy as well, with all proportions very low (Figure 9).
Figure 9. Enterprises with Internet access with particular IT security measures in place (%)
0
10
20
30
40
50
60
70
80
90
100
Anti-virussoftware
Anti-spysoftware
Firewalls Access controlby IDs andpasswords
Off-site databackup
Secure servers Authenticationmechanisms
Encryption forconfidentiality
IntrusiondetectionSystems
None
EU 2006 AUS 2003 JAP 2005 KOR 2004 SGP 2005 BRA 2005
Note: EU: Other authentication mechanism (e.g. PIN code); electronic digital signature as customer�s authentication mechanism is a separate category. Japan: anti-virus software = introduction of virus checking software at terminals.
The Nordic and Western European countries rank highest on the use of firewalls, the Southern European and new Member States lowest. Between 2003 and 2006, the proportion of firewalls went up quickly and uniformly in all countries (in the case of the EU, from 58% in 2004 to 76.5% in 2006) (Figure 10).
Figure 10. Enterprises with Internet access with a firewall (%)
0
10
20
30
40
50
60
70
80
90
100
FISE NO UK NL DK DE MT
SGP IE LU BE IS ATEU25 HU SI
FRAUS EL PT IT ES
JAP EE
BRA CZ CY SK PL LV LT BGKOR RO
2006 2005 2004 2003
In the case of secure servers, Brazil, Greece and Malta rank higher than might be expected. Some peculiar patterns can be observed for some individual countries. Unexpectedly, the overall proportion of secure servers even declined slightly whereas data from firms engaged in online monitoring show their use

DSTI/ICCP/IIS(2007)4/FINAL
16
to be increasing.7 This may suggest that some respondents did not fully understand the question (Figure 11).
Figure 11. Enterprises with Internet access with secure servers (%)
0
10
20
30
40
50
60
70
IE NO LU DK SE FR UKBRA EL MT
SGP DEEU25 NL AT ES FI IT IS BE LT SI
HU CY EE PT LV SK PLRO BG
2006 2005 2004 2003
A substantial proportion of enterprises update their security facilities at least every three months, although the proportions are still below the levels that could be expected (Figure 12).
Figure 12. Enterprises with Internet access that updated any of their security facilities (e.g. virus protection software) in the last 3 months (%)
0%
10%
20%
30%
40%
50%
60%
70%
80%
90%
100%
SE FIMT AT NO DK IS LU IT BE ES SK CY PT IE SI
EL CZEU25 HU NL DE UK PL LT EE LV BG RO
2005 2004 2003
Breakdowns by type of enterprise
For all breakdowns by type of enterprise, more than 90% of enterprises have anti-virus programs installed. Perhaps somewhat surprising is that 1% to 2% of large enterprises reported that they did not have virus checking programs installed. The observed differences on the use of anti-virus programs are not likely to be significant.
7. For example Netcraft�s monthly survey (www.netcraft.com).

DSTI/ICCP/IIS(2007)4/FINAL
17
For firewalls, there is a strong relation to size. The larger the enterprise, the more likely it has a firewall installed. Enterprises in the services industries are more likely to have a firewall installed than manufacturing enterprises, in particular in business activities and in broadcasting activities. This is probably related to intensity of use (Figure 13).
Figure 13. Enterprises in the EU with Internet access with anti-virus programs and firewalls installed, 2006 (%)
0%10%20%30%40%50%60%70%80%90%
100%
Small Medium Large Industry Services
Anti-virus Firewall Anti-virus all enterprises Firewall all enterprises
For updating security facilities, the same small-medium-large pattern is observed, although it is not very marked, and there is hardly any difference between industry and services. Remarkably, for all breakdowns, the proportion of enterprises updating their security facilities declined between 2004 and 2005 (Figure 14).
Figure 14. Enterprises in the EU with Internet access that updated any of their security facilities (e.g. virus protection software) in the last 3 months, %
0%
20%
40%
60%
80%
100%
Small Medium Large Industry Services
2004 2005 2004 all enterprises 2005 all enterprises
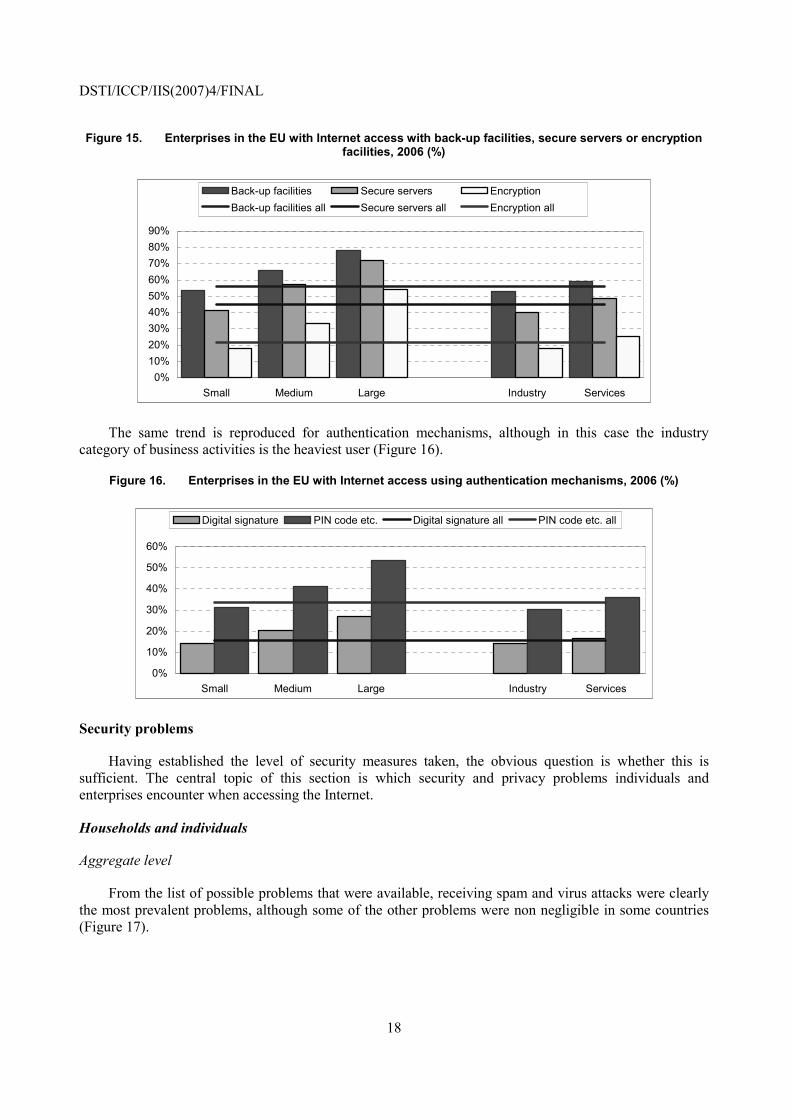
Back-up facilities, secure servers and encryption all show a strong size-related trend, and in all cases they are more likely to be implemented in services than in industry, especially in broadcasting activities (Figure 15).
DSTI/ICCP/IIS(2007)4/FINAL
18
Figure 15. Enterprises in the EU with Internet access with back-up facilities, secure servers or encryption facilities, 2006 (%)
0%10%20%30%40%50%60%70%80%90%
Small Medium Large Industry Services
Back-up facilities Secure servers EncryptionBack-up facilities all Secure servers all Encryption all
The same trend is reproduced for authentication mechanisms, although in this case the industry category of business activities is the heaviest user (Figure 16).
Figure 16. Enterprises in the EU with Internet access using authentication mechanisms, 2006 (%)
0%
10%
20%
30%
40%
50%
60%
Small Medium Large Industry Services
Digital signature PIN code etc. Digital signature all PIN code etc. all
Security problems
Having established the level of security measures taken, the obvious question is whether this is sufficient. The central topic of this section is which security and privacy problems individuals and enterprises encounter when accessing the Internet.
Households and individuals
Aggregate level
From the list of possible problems that were available, receiving spam and virus attacks were clearly the most prevalent problems, although some of the other problems were non negligible in some countries (Figure 17).

DSTI/ICCP/IIS(2007)4/FINAL
19
Figure 17. Internet users encountering security problems through using the Internet, 2005 (%)
0
10
20
30
40
50
60
70
80
90
Spam Computer virus No problems Abuse of personalinformation
Fraudulent payment card use
EU AUS JAP KOR (2006) CHN (2006) BRA CHT SGP (2006)
Notes: age cut-offs: Japan 15+, Korea 12+; Australia: virus = virus, worms and trojans and a range of other malware with spyware separated from this group.
The proportion of Internet users suffering from virus attacks was quite stable between 2004 and 2005, after some big increases between 2003 and 2004. The percentages range from 5% in Romania to more than 70% in China, with most countries between 20% and 40%. There is no obvious north-south or east-west divide, as otherwise is often the case with the use of ICTs (Figure 18).
Figure 18. Internet users suffering from virus attacks, resulting in loss of information or time (%)
0
10
20
30
40
50
60
70
80
CHNAUS ES
KOR LU IT SI LT BG UK DKEU25 IS DE PL FI
NL HU NO AT SK CY SE MK TR PTSGP
JAP
BRA EL LV IE CZ EECHT RO
2005 2004 2003
Notes: age cut-offs: Japan 15+, Korea 13+; Australia: virus = virus, worms and trojans and a range of other malware with spyware separated from this group.
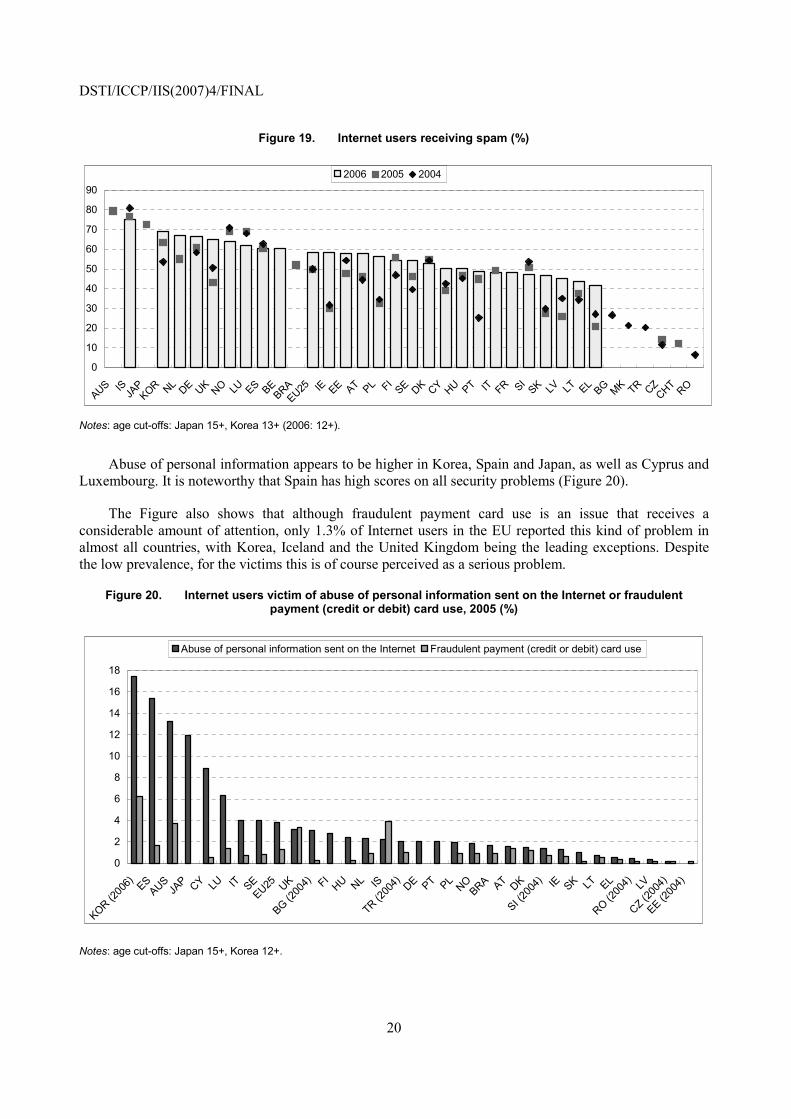
Receiving spam messages is becoming a larger problem than it had been in the immediate past. The proportions are closer together than for virus attacks, and all countries reported more than 40% of Internet users receiving spam in 2006, up to more than 70% in Iceland. It had become more problematic by 2006, especially for those countries that reported the lowest numbers in 2004 and 2005 (Figure 19).
DSTI/ICCP/IIS(2007)4/FINAL
20
Figure 19. Internet users receiving spam (%)
0
10
20
30
40
50
60
70
80
90
AUS IS JAPKOR NL DE UK NO LU ES BE
BRAEU25 IE EE AT PL FI
SE DK CY HU PT IT FR SISK LV LT EL BG MK TR CZ
CHT RO
2006 2005 2004
Notes: age cut-offs: Japan 15+, Korea 13+ (2006: 12+).
Abuse of personal information appears to be higher in Korea, Spain and Japan, as well as Cyprus and Luxembourg. It is noteworthy that Spain has high scores on all security problems (Figure 20).
The Figure also shows that although fraudulent payment card use is an issue that receives a considerable amount of attention, only 1.3% of Internet users in the EU reported this kind of problem in almost all countries, with Korea, Iceland and the United Kingdom being the leading exceptions. Despite the low prevalence, for the victims this is of course perceived as a serious problem.
Figure 20. Internet users victim of abuse of personal information sent on the Internet or fraudulent payment (credit or debit) card use, 2005 (%)
0
2
4
6
8
10
12
14
16
18
KOR (200
6) ESAUS
JAP CY LU IT SE
EU25 UK
BG (200
4) FIHU NL IS
TR (200
4) DE PT PLNO
BRA AT DK
SI (200
4) IE SK LT EL
RO (200
4) LV
CZ (200
4)
EE (200
4)
Abuse of personal information sent on the Internet Fraudulent payment (credit or debit) card use
Notes: age cut-offs: Japan 15+, Korea 12+.

DSTI/ICCP/IIS(2007)4/FINAL
21
However, if one assumes that only people who ordered goods or services online are exposed to fraudulent credit card use, these numbers should be shown relative to the number of online shoppers.8 With this perspective, Figure 219 shows that credit card fraud may be a more serious problem than it appeared at first, with a number of countries where fraudulent payment card use as a percentage of people who ordered goods or services online was more than 10%. To some extent, these data show a �reverse� north-south divide. The countries that usually are among the heaviest users have the least problems. However, the occurrence of payment card fraud is relatively rare, therefore the sample sizes may have been too small for these data to be completely reliable. This could be the case for example for Turkey. For the United Kingdom, the calculated proportion was 5.9% in 2005, which compares well with the 6% of all Internet users who suffered fraud while shopping online in 2006-2007, which was found by the survey referred to in footnote 7.
Figure 21. Internet users who were victim of fraudulent payment (credit or debit) card use in the last year
as a percentage of Internet users who ordered goods or services online in the last three months
0%
2%
4%
6%
8%
10%
12%
14%
16%
TR LT BRA
KOR (200
6) IS EL RO ES IT BG SI PLAUS UK CY DK AT
EU25 SK LU IE LV NL NO HU SE CZ EE FI
2005 2004 2003 ♦28.6
Note: Korea: Internet users who ordered goods or services online in the last year.
Breakdowns by socio-economic group
Breaking down the data for the EU by socio-economic group shows the same trends for virus attacks and for spam. More men reported virus problems and spam than women, and the proportion of people reporting incidences increases as the education level increases. Furthermore, broadband users were more likely to report virus problems and spam, while less users in poorer regions had problems. A smaller proportion of older people had problems, while the same proportion of young people and middle-aged reported problems. This is a pattern that seems to be fairly common, and implies a link with intensity of
8. This is only partially justified, as indicated by a survey of adult Internet users in the United Kingdom, held
in March 2007. The survey � Internet Safety: The State of the Nation � found that 12% of Internet users had experienced online fraud in the last year. In that time, 6% of all Internet users suffered fraud while shopping online, 5% experienced another form of general online fraud and 4% were subject to bank account or credit card fraud as a result of activity online (some users experienced more than one of these) (Get Safe Online, 2007).
9. With the exception of Korea, the fraudulent payment card use refers to the last 12 months, while ordering goods or services online refers to the last 3 months (12 months in Korea).

DSTI/ICCP/IIS(2007)4/FINAL
22
use. The more intensive the Internet is used, the higher the share of people experiencing problems (Figure 22).
Figure 22. Internet users in the EU suffering from virus attacks or receiving spam (%)
0%10%20%30%40%50%60%70%80%
Men
Women
Low ed
ucati
on
Middle
educ
ation
High ed
ucati
on
Broadb
and
No broa
dban
d
Objecti
ve O
ne re
gion
Other r
egion
s
Aged 1
6-24
Aged 2
5-34
Aged 3
5-44
Aged 4
5-54
Aged 5
5-64
Aged 6
5-74
Virus (2005) Spam (2006) Virus (2005) all Spam (2006) all
A similar pattern is found for Brazil. In addition, data for Brazil show an income effect, with virus attacks and spam increasing with income. This may well be related to intensity of Internet use as well (Figure 23).
Figure 23. Internet users in Brazil suffering from virus attacks or receiving spam, 2005 (%)
010203040506070
Male
Female
Below fu
ndam
ental
1
Funda
mental
1
Incom
plete
fund.
2
Funda
mental
2
Incom
plete
medium
Medium
Incom
plete
unive
rsity
Univers
ity
< R$5
00
R$501
-R$1
000
R$100
1-R$1
800
R$180
1 or m
ore
Aged 1
0-15
Aged 1
6-24
Aged 2
5-34
Aged 3
5-44
Aged 4
5-59
Aged 6
0+
Virus Spam Virus all Spam all
In Korea, however, there is no income effect and hardly a gender effect either. Otherwise, data are similar to those of the EU, although less pronounced (Figure 24).

DSTI/ICCP/IIS(2007)4/FINAL
23
Figure 24. Internet users in Korea suffering from virus attacks or receiving spam, 2006 (%)
0102030405060708090
Male
Female
Elemen
tary o
r und
er
Junio
r high
scho
ol
High sc
hool
Colleg
e or a
bove
< 1 m
illion w
on
1-2 m
illion w
on
2-3 m
illion w
on
3-4 m
illion w
on
> 4 m
illion w
on
Metrop
olitan
citie
s
Small/m
edium
citie
s
Rural a
reas
12-19 20
s30
s40
s50
s
60s o
r olde
r
Virus Spam Virus all Spam all
Note: age cut-off 12+.
For credit card fraud, using as a denominator only people who have purchased goods or services online in the last three months, the gender and education trends are as before. For the other categories, however, it is less clear, and depends on the year under scrutiny (Figure 25).
Figure 25. Internet users who were victim of fraudulent payment (credit or debit) card use in the last year
as a percentage of Internet users who ordered goods or services online in the last three months
0%
1%
2%
3%
4%
5%
6%
Men
Women
Low ed
ucati
on
Middle
educ
ation
High ed
ucati
on
Broadb
and
No broa
dban
d
Objecti
ve O
ne re
gion
Other r
egion
s
Aged 1
6-24
Aged 2
5-34
Aged 3
5-44
Aged 4
5-54
Aged 5
5-64
Aged 6
5-74
2004 2005 2004 all 2005 all
Enterprises
Aggregate level
Grouping all ICT-related security problems together, EU wide, the proportion of enterprises experiencing problems was stable between 2004 and 2006, decreasing slightly from 32% in 2004 to 30% in 2006, similar to the proportion found for individuals experiencing ICT security problems. However, this

DSTI/ICCP/IIS(2007)4/FINAL
24
obscures a large variation between member countries. For example, whilst in most countries the problems have been decreasing over time, Ireland and Italy have witnessed a sharp increase, reaching 78% and 67% respectively in 2006 (Figure 26).
Figure 26. Enterprises in the EU encountering ICT-related security problems (e.g. computer virus, worms or trojan attack; or unauthorised external access to the computer system), that resulted in a loss of
information or working time
As a proportion of enterprises using the Internet
0%
10%
20%
30%
40%
50%
60%
70%
80%
IE IT MT LT SK SIEU25 PL CY EL EE BG DE FR AT NO LU BE HU FI LV CZ ES UK SE IS DK NL PT RO
2006 2005 2004
Looking at specific problems, from Figure 27 it is clear that virus attacks are the most prevalent problem, especially outside the EU. Unauthorised access to enterprise computer systems or data is less common, although it reached more than 10% in Japan and Brazil. In the EU, blackmail or threats don�t seem to be a problem (it stood at <1% and is not shown in the figure) though it is difficult to know how respondents react to such a question.
Figure 27. Specific security problems encountered by enterprises
As a proportion of enterprises using the Internet
0
10
20
30
40
50
60
Virus Unauthorised access Denial of service
EU (2005) AUS (2004) JAP (2005) KOR (2004) MEX (2003) BRA (2005)
Note: Japan, Korea, Mexico: virus = virus, worm or trojan.

DSTI/ICCP/IIS(2007)4/FINAL
25
Looking more closely at virus attacks, in 2005 these ranged from 13% in Portugal to 65% in Hungary. In most countries, the proportion of enterprises suffering a virus attack decreased between 2003 and 2005. No obvious regional pattern can be discerned in the graph (Figure 28).
Figure 28. Enterprises that suffered a virus attack, resulting in a loss of information or working time
As a proportion of enterprises using the Internet
0
10
20
30
40
50
60
70
80
HU FIAUS IT
BRAJA
P MT IEKOR LT AT CY SI
EU25 EL ES SE CZ PL DK EE BE NO UK LU NL LV DE SK BGMEX PT IS
2005 2004 2003
Note: Japan, Korea, Mexico: virus = virus, worm or trojan.
Breakdowns by type of enterprise
It is interesting to note that a larger proportion of large enterprises in the EU had ICT-related security problems in 2004 than small and medium-sized enterprises, but this gap decreased quickly between 2004 and 2006. The industries of which the highest proportion of enterprises had security problems were hotels and other short stay accommodation enterprises and the broadcasting industry. As was the case for individuals using the Internet, there seems to be a relation between intensity of use and security problems encountered (Figure 29).

DSTI/ICCP/IIS(2007)4/FINAL
26
Figure 29. Enterprises in the EU encountering ICT-related security problems
As a proportion of enterprises using the Internet
0%
5%
10%
15%
20%
25%
30%
35%
40%
45%
50%
Small
Medium La
rge
Manufa
cturin
g
Electric
ity, g
as an
d wate
r
Constr
uctio
n
Who
lesale
and r
etail
Hotels
and c
ampin
gs
Transp
ort an
d com
munica
tion
Busine
ss ac
tivitie
s
Broadc
astin
g acti
vities
2004 2005 2006
In the EU, the proportion of large enterprises suffering a virus attack went down from 43.7% in 2004 to 37.2% in 2005, but it still stood above the proportion for SMEs. In Brazil, a similar small-medium-large trend cannot be detected (Figure 30).
Figure 30. Enterprises that suffered a virus attack, resulting in a loss of information or working time, by size-class, 2005
As a proportion of enterprises using the Internet
0
10
20
30
40
50
60
Sm
all
Med
ium
Larg
e
10-1
9
20-4
9
50-9
9
100-
249
250-
499
500-
999
>100
0
EU Brazil
Perceived barriers to Internet sales
Buying goods or services online has increased substantially over the last ten years or so, though perhaps not as quickly as had been expected in earlier years. What is the role of trust and security in this performance? Is it because expectations were inflated during the �Internet bubble�, or have security and related concerns impeded people from buying online? Both factors may have played a role.

DSTI/ICCP/IIS(2007)4/FINAL
27
Households and individuals
Aggregate level
Figure 31 provides an overview of the most important barriers to buying online. The data are not completely comparable, and not all countries used the same categories, but some broad conclusions can be drawn from the data. �No need� and �prefer to shop in person� are the most important reasons for not purchasing online, but security, privacy and trust concerns follow closely behind.
Figure 31. Reasons for not buying/ordering any goods or services online
Percentage of individuals with Internet access who did not buy online
0
10
20
30
40
50
60
70
80
90
No need Prefer toshop inperson
Securityconcerns
Trustconcerns
Privacyconcerns
Lack of skills No paymentcard
Tooexpensive
Others
EU 2005 AUS 2004 JAP 2003 KOR 2006 CHN 2005 BRA 2005 SGP 2006
Notes: Australia, Brazil, China, Singapore: one answer only; Brazil and Singapore: �prefer to shop in person� = �prefer to shop in person� plus �no interest�; age cut-offs: Australia 18+, Japan 15+, Korea 12+.
Generally, the countries with a high score on security concerns also had a high score on privacy concerns. For trust concerns, this correlation is less clear (Figure 32).10
The Figure further shows that there is a wide variation between countries and no obvious pattern. Very high percentages for Spain, Cyprus, Finland and Slovenia can be observed on security and privacy concerns. Cyprus and Finland score high again on trust concerns about receiving or returning goods and complaint / redress concerns, but this is not the case for Spain. Trust concerns have increased significantly between 2005 and 2006.
10. Note that to allow for an easy comparison of trust concerns with security and privacy concerns at the
individual country level, the countries in the right-hand graph of Figure 32 are sorted in the same order as the countries in the left-hand graph.

DSTI/ICCP/IIS(2007)4/FINAL
28
Figure 32. Security, privacy or trust concerns as reasons for not buying/ordering any goods or services online, 2005
Percentage of individuals with Internet access who did not buy online
75 50 25 0 25 50 75
ESCY
FISI
LUPT
TR (2004)NLUKHU
DK (2004)EU25
DEAUS (2004)
CHNISIT
JAP (2003)ATEL
BG (2004)SGP
SELTNOEE
KOR (2006)BRA
SKLVIE
PLMK (2004)
CZBEFR
Security concerns Privacy concerns
0 10 20 30 40 50
ESCY
FISI
LUPT
TR (2004)NLUKHU
DK (2006)EU25
DEAUS (2004)
CHNISIT
JAP (2003)ATEL
BG (2004)SGP
SELTNOEE
KOR (2006)BRA
SKLVIE
PLMK (2004)CZ (2006)BE (2006)FR (2006)
Trust or complaint/redress
Notes: Australia, Brazil, China, Singapore: one answer only; age cut-offs: Australia 18+, Japan 15+, Korea 12+.
The data for China cannot be compared easily with the other countries, but the replies are interesting and show an apparent lack of trust in e-commerce (Table 1).
Table 1. Primary obstacles for online purchasing in China, 2005
Primary obstacles of online purchases % of individualsQuality of products, after-sale services and the credit of the producer cannot be guaranteed 48.4% Security cannot be guaranteed 26.9% Unreliable information online 7.7% Inconvenient payment methods 6.3% Unattractive price 5.3% Late delivery 4.9% Others 0.5% Total 100%
Breakdowns by socio-economic group
Gender and broadband access do not seem to have a significant impact on security concerns as an impediment to e-commerce, but education and age (to a lesser extent) do make a difference. This may be linked to income, or perhaps the other way around, income level is linked to awareness. It could also be that people with less income are planning to buy less, or not at all, over the Internet, therefore the security

DSTI/ICCP/IIS(2007)4/FINAL
29
barrier may be of less concern to that group. Young people and students seem to be less concerned perhaps for the same reasons (Figure 33).
Figure 33. Security concerns as reason for not buying/ordering any goods or services online, by education and by age, 2005
Percentage of individuals with Internet access who did not buy online
Age
0 10 20 30 40
16-2425-3435-4445-5455-6465-7418-2425-3435-4445-5455-64
65+12-19
20s30s40s50s60+
10-1516-2425-3435-4445-59
60+
EU25
(200
5)AU
S (0
4-05
)KO
R (2
006)
BRA
(200
5)
Education
01020304050
Low
M iddle
High
<=Elementary
Junio r high
High schoo l
College or +
<Fund. 1
Fund. 1
Incompl.fund. 2
Fund. 2
Incompl.med.
M edium
Incompl. univ.
University
Notes: Australia, Brazil,: one answer only; age cut-offs: Australia 18+, Korea 12+.
The data for trust concerns are not shown here, but show a similar pattern.
Enterprises
The general question for this section is how important certain barriers are in limiting or preventing sales via the Internet. In answering this question, a distinction is made between enterprises that sold over the Internet in the reference period and enterprises that did not sell over the Internet for the same period.
Aggregate level
In the EU countries, for any given barrier, respondents were given four response options: extremely important, very important, of some importance, or of no importance. When summing up the proportions for each of these response options, the total should be 100% for each barrier. However, for the EU, in the case of non-seller barriers, summing up the categories for a given barrier results in percentages below 100% for some countries, but over 100% for other countries. The former may be related to the fact that the question was optional, and therefore not answered by all respondents, but the latter should not have occurred. In the case of seller barriers, with one exception, a summation of the categories results in percentages of 100% or below. Because of this, countries cannot be compared to each other and EU totals have not been calculated. The only analysis that can be done is comparing barriers per country.
However, in order to give an indication of the relative importance of the barriers, a very crude aggregation has been made. This consisted of rescaling all data so that the sum of the various levels of

DSTI/ICCP/IIS(2007)4/FINAL
30
importance per barrier equals 100% and calculating an (unweighted) average over countries, for the most recent year available. Figure 34 shows the result of this exercise. Because of the method applied, the resulting percentages are meaningless and are therefore not shown in the graph.
What the figure shows, is that for enterprises that have not sold yet over the Internet, the main barrier is that they feel their products or their organisation is not suitable for Internet sales. This barrier is followed by security problems with payments, customers or other enterprises not ready and an uncertain legal framework, all closely grouped together. For enterprises that do sell over the Internet, the most important barrier to (more) sales are security concerns over payments.
Figure 34. Unweighted average of rescaled data for EU countries on barriers in limiting or preventing sales via the Internet being extremely important or very important, for the latest year available
Proportion of enterprises using computers
Not suitable forInternet sales
Customers orother enterprises
not ready
Security problemswith payments
Uncertain legalframework
Logistics problems Other
Rel
ativ
e im
porta
nce
Enterprises that have not received orders via Internet Enterprises that have received orders via Internet
This picture is confirmed by looking at the data for non-EU countries. In the case of non-sellers, the most important barriers are that products are not suited or a preference to keep the current business model (Figure 35).

DSTI/ICCP/IIS(2007)4/FINAL
31
Figure 35. Barriers in limiting or preventing sales via the Internet of enterprises that did not sell over the Internet
as a % of businesses which did not sell their products over the Internet during the reference period
0
10
20
30
40
50
60
70
Pro
duct
s no
t sui
ted
Pre
fer t
o m
aint
ain
curre
nt b
usin
ess
mod
el
Con
fiden
tialit
y of
data
Cus
tom
ers/
partn
ers
not r
eady
Sec
urity
con
cern
s
Lack
of s
kille
dem
ploy
ees
Con
cern
s ov
erle
gal f
ram
ewor
k
Und
er d
evel
opm
ent
or in
futu
re w
ork
prog
ram
Cos
ts to
o hi
gh
AUS 2005 CAN 2004 JAP 2003 CHE 2002 BRA 2005
Note: Brazil: % of all enterprises that used computers.
In the case of sellers, security concerns were the most important barrier in Mexico and the second most important barrier in Japan (Figure 36).
Figure 36. Barriers in limiting or preventing sales via the Internet of enterprises that already did sell over the Internet
as a % of businesses which did sell their products over the Internet during the reference period
0102030405060
Sec
urity
con
cern
s
Pro
duct
s no
t sui
ted
Lack
of s
kille
dem
ploy
ees
Cus
tom
ers/
partn
ers
not r
eady
Cos
ts to
o hi
gh
Con
cern
s ov
erle
gal f
ram
ewor
k
Pre
fer t
o m
aint
ain
curr
ent b
usin
ess
mod
el
JAP 2003 MEX 2003 CHE 2002
In the EU, security concerns are an important barrier for many countries, in particular among the new EU member states (Figure 37).

DSTI/ICCP/IIS(2007)4/FINAL
32
Figure 37. Security concerns, e.g. over payments, as an extremely important or very important barrier in limiting or preventing sales via the Internet (%)
0
10
20
30
40
50
60
70
80
EL (20
05)
SI (200
5)
CY (200
5)
BG (04/0
5)
SK (200
5)
BE (200
4)
LU (2
004)
ES (200
5)
HU (200
5)
PL (20
05)
LV (2
005)
DE (200
5)
IT (200
2)
AT (200
4)
FR (200
2)
IE (2
005)
BRA (200
5)
RO (200
4)
JAP (2
003)
PT (05/0
4)
CHE (200
2)
CZ (200
3)
FI (200
4)
CAN (200
4)
AUS (200
5)
MEX (200
3)
MT (200
5)
DK (200
2)
NO (200
5)
non-sellers sellers
Notes: EU data have been rescaled so that the four categories of importance add up to 100%. Brazil and EU countries: % of all enterprises that used computers.
Breakdown by type of enterprise
The data underlying Figure 38 are based again on a crude manipulation of EU data, hence no percentages are shown on the y-axis. For non-sellers, there is a size related trend, even if the differences are not large. For sellers, large enterprises perceive security problems as a very important barrier even more than SMEs. For sellers and non-sellers alike, manufacturing enterprises perceive security problems as an extremely important barrier more than enterprises in the services sector.
Figure 38. Unweighted average of security concerns as an extremely important barrier in limiting or preventing sales via the Internet, for the latest year available for EU countries
Proportion of enterprises using computers
Small Medium Large Manufacturing Services
Non-sellers Sellers
E-commerce problems
This short section will try to uncover whether the perceived barriers of the previous section are justified by the experiences of people who did order goods or services online. Because this is a question that is generally not asked of enterprises, it will be looked at for individuals only. In addition, breaking the data down by socio-economic group did not add any new insights, so only the aggregate level is analysed.

DSTI/ICCP/IIS(2007)4/FINAL
33
It turns out that the fears expressed by people who do not buy online are not fully justified by the problems experienced by people who do buy online. In 2005, 81% of individuals who ordered online in the EU experienced no problems. The biggest problems were connected to the delivery of the products, either because it took too long or because the delivered goods were not the right goods or damaged. Lack of security of payments was a problem for less than 2% of online buyers only, while complaints and redress were difficult, or no satisfactory response was received after complaining, was a problem for less than 5% of online buyers (Figure 39).
Figure 39. Problems encountered by individuals in the EU when buying/ordering goods or services over the Internet in the last 12 months
as a % of individuals who bought or ordered goods over the Internet in the last 12 months
0% 2% 4% 6% 8% 10% 12%
Speed of delivery longer than indicated
Wrong or damaged goods delivered
Complaints/redress difficult or no satisf. response after complaint
Other
Difficulties concerning guarantees
Delivery costs/final price higher than indicated
Lack of security of payments
2005 2006
An Australian survey of Internet users (DCITA, 2005) asked about online concerns in general, not specifically related to e-commerce. The survey showed that after �Security of the Internet�, the most important concern was �Potential for fraud involving theft of funds/credit cards�, which was a concern for 23% of passive Internet users and 17% of active users (see Box 1 for details on active and passive users). However, according to the same survey, only 3.7% of active users lost money due to online fraud. The report concludes therefore, that �the concern may therefore largely be a result of users� general awareness of fraud related issues, especially those that receive press coverage. There are also numerous Internet sites (including security firms, government and financial institutions) that draw attention to fraud related activities such as phishing and similar scams�. (DCITA, 2005)
Figure 40 shows that in three countries, Luxembourg, Italy and Lithuania, lack of security of payments was a problem for more than 5% of online shoppers, but for the other countries this percentage was below 3%. Difficulties with complaint and/or redress was a somewhat more important problem, with a higher overall average, and proportions over 8% in three countries, Luxembourg, Italy and Portugal.

DSTI/ICCP/IIS(2007)4/FINAL
34
Figure 40. Security or trust problems encountered by individuals in the EU when buying/ordering goods or services over the Internet, 2006
as a % of individuals who bought or ordered goods over the Internet in the last 12 months
0%
2%
4%
6%
8%
10%
12%
LU IT PT ES UK DEEU25 FI
DK (200
5) LT SK PL HU
AT (06/0
5) CY NL IE LV SE
EL (05
/06)
NO (200
5) SI IS BE
Complaints and redress were difficult or no satisfactory response received after complaintLack of security of payments
Confidence building practices for Internet-commerce
The previous two sections have shown that there is a substantial lack of trust in buying online, but that these fears are not borne out by a high incidence of trust or security problems when people do buy online. This implies that there is a role for enterprises to enhance consumer trust in e-commerce. In the 2004 and 2005 EU questionnaires, there was an optional question about confidence building practices for Internet-commerce of enterprises. This section will look at some of the results of this question in the survey. Breaking the data down by type of enterprise did not add any new insights, so only the aggregate level is analysed.
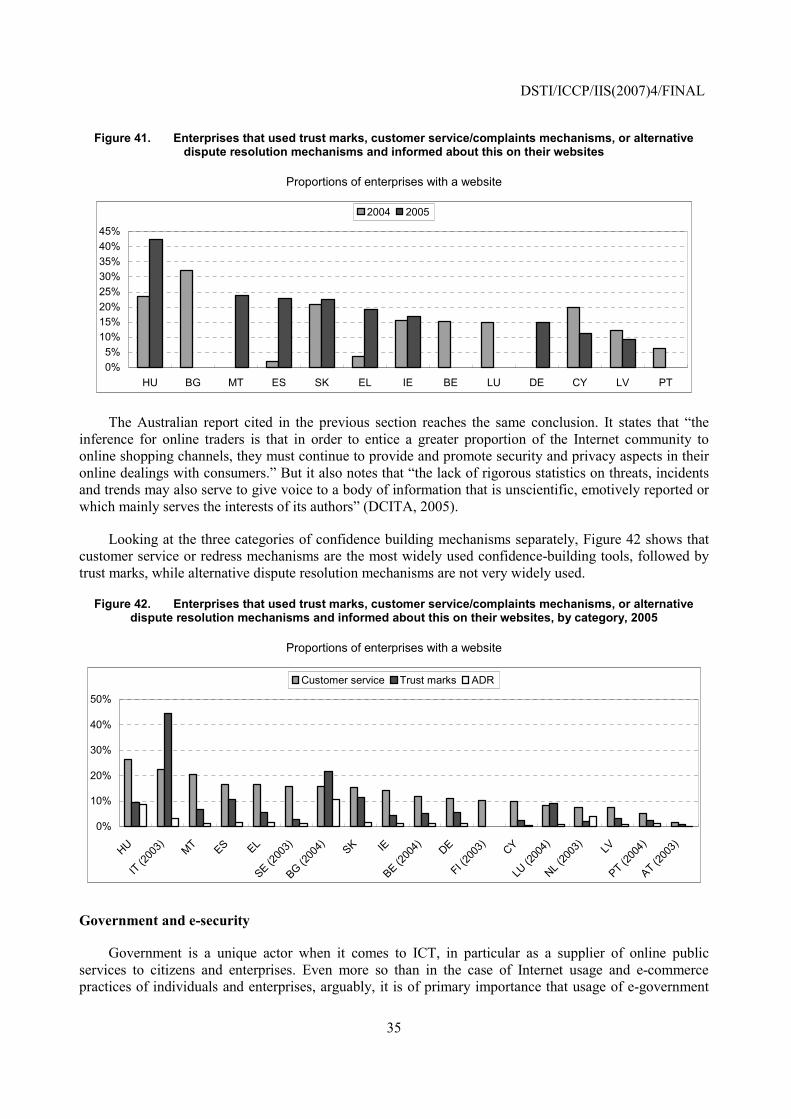
Figure 41 shows the proportion of enterprises with a website that used trust marks, customer service/complaints mechanisms, alternative dispute resolution mechanisms or a combination of these, and informed about those on their websites. Of the countries that answered, Hungary scored highest, with more than 40% of enterprises using any of these mechanisms in 2005. Otherwise, the data range from 9% to 24% in 2005, which seems quite a low proportion. Section 4 showed that trust concerns are a relevant barrier for many individuals, and this result indicates that enterprises may not be doing enough to alleviate these concerns. The question was, however, not very well answered, which could be considered an indicator in itself.
DSTI/ICCP/IIS(2007)4/FINAL
35
Figure 41. Enterprises that used trust marks, customer service/complaints mechanisms, or alternative dispute resolution mechanisms and informed about this on their websites
Proportions of enterprises with a website
0%5%
10%15%20%25%30%35%40%45%
HU BG MT ES SK EL IE BE LU DE CY LV PT
2004 2005
The Australian report cited in the previous section reaches the same conclusion. It states that �the inference for online traders is that in order to entice a greater proportion of the Internet community to online shopping channels, they must continue to provide and promote security and privacy aspects in their online dealings with consumers.� But it also notes that �the lack of rigorous statistics on threats, incidents and trends may also serve to give voice to a body of information that is unscientific, emotively reported or which mainly serves the interests of its authors� (DCITA, 2005).
Looking at the three categories of confidence building mechanisms separately, Figure 42 shows that customer service or redress mechanisms are the most widely used confidence-building tools, followed by trust marks, while alternative dispute resolution mechanisms are not very widely used.
Figure 42. Enterprises that used trust marks, customer service/complaints mechanisms, or alternative dispute resolution mechanisms and informed about this on their websites, by category, 2005
Proportions of enterprises with a website
0%
10%
20%
30%
40%
50%
HU
IT (200
3) MT ES EL
SE (200
3)
BG (200
4) SK IE
BE (200
4) DE
FI (200
3) CY
LU (2
004)
NL (20
03) LV
PT (200
4)
AT (200
3)
Customer service Trust marks ADR
Government and e-security
Government is a unique actor when it comes to ICT, in particular as a supplier of online public services to citizens and enterprises. Even more so than in the case of Internet usage and e-commerce practices of individuals and enterprises, arguably, it is of primary importance that usage of e-government

DSTI/ICCP/IIS(2007)4/FINAL
36
services is safe and secure, that the privacy of the users is protected and that users have trust that this is the case.
There is not much data available on this subject relative to its high importance. One reason for this is the difficulties countries are facing in measuring e-government in general. The OECD Guide to Measuring the Information Society (OECD, 2005a) points out a number of statistical challenges in measuring e-government:
• Definition of the scope of government surveys. For instance, should they include government businesses or semi-government organisations?
• Definition of government units and their categorisation to the appropriate tier of government. Should a unit include sub-entities or should all (or some) be distinct units?
• Measurement of the intensity of activities such as the offering of electronic services and their categorisation; and
• Heterogeneity of government units and the proportion or counts approach to data on ICT use. This heterogeneity concerns differences in government units (for instance, differences in how ICT functions are organised and changes in organisational structures over time) that make it difficult to make a valid comparison of proportion or counts data across geographic regions, tiers of government and time. It is thought that international comparisons are most affected by unit heterogeneity. (OECD, 2005a)
Because of the heterogeneity of the available data, and the difficulties in comparing e-government demand and supply between countries, instead of a comparative analysis, this section will present the results of a small number of countries that have undertaken measurement work in the area of trust and security in e-government, on a country-by-country basis (although a limited comparison will be made for three countries). Much of the text in this section has been taken from national reports. Information from additional countries would be welcome.
Norway
In the Norwegian surveys, the public administration is defined as enterprises within state and social administration, state business management, lenders of the state, state enterprises (owned 100% by the state) and the Bank of Norway. In 2006, 601 enterprises were covered by this definition and all of them received a questionnaire. Some 59 enterprises applied for exemption, which was agreed since they were represented by a higher level enterprise. Of the 542 remaining enterprises, 499 or 92.1% responded to the survey. There are substantial differences among these enterprises when it comes to responsibility for making decisions regarding ICT. A department or a state enterprise with 500 employees usually has more decisions to take on ICT issues than a local unit that is part of a department. To delimit the survey to decision-making enterprises, there are preliminary questions included for each topic (Statistics Norway, 2006).
The public administration enterprises were asked about organisational conditions and specific systems in use to secure their ICT systems. In 2004, 77% said that responsibility for ICT security was assigned to one person, and 80% of these reported to top management (Statistics Norway, 2004).
In general, public administration organisations in Norway seem to have taken comprehensive measures against potential security incidents. Anti-virus programs and firewalls are almost universal, and the other categories in Figure 43 are widely deployed as well.

DSTI/ICCP/IIS(2007)4/FINAL
37
Figure 43. Security measures in place by the public administration in Norway
as a % of all public administration enterprises
0 20 40 60 80
100
Virus protection software
subscription
Firewall Spam-filters External backup Uninterruptable power supply
Intrusion detection software
2004 2005 2006
Source: Statistics Norway.
Figure 44 shows that only a minority share of public administration organisations offer secure ways of communicating with their websites. Of course, not all interaction with web services of the government require a secure channel. Furthermore, data are for 2004, and since this is still very much an area under development, the situation may have improved substantially over the last three years.
Figure 44. Available security systems in the public administration in Norway in case of communication with website, 2004
as a % of all public administration enterprises
0 5 10 15 20 25 30 35 40
Electronic signing of documents
Electronic signature to identify users
One-time password or PIN-code
Server-certificate to identify server
Secure communication between user and server by cryptography
Password or PIN-code to identify users
Source: Statistics Norway.
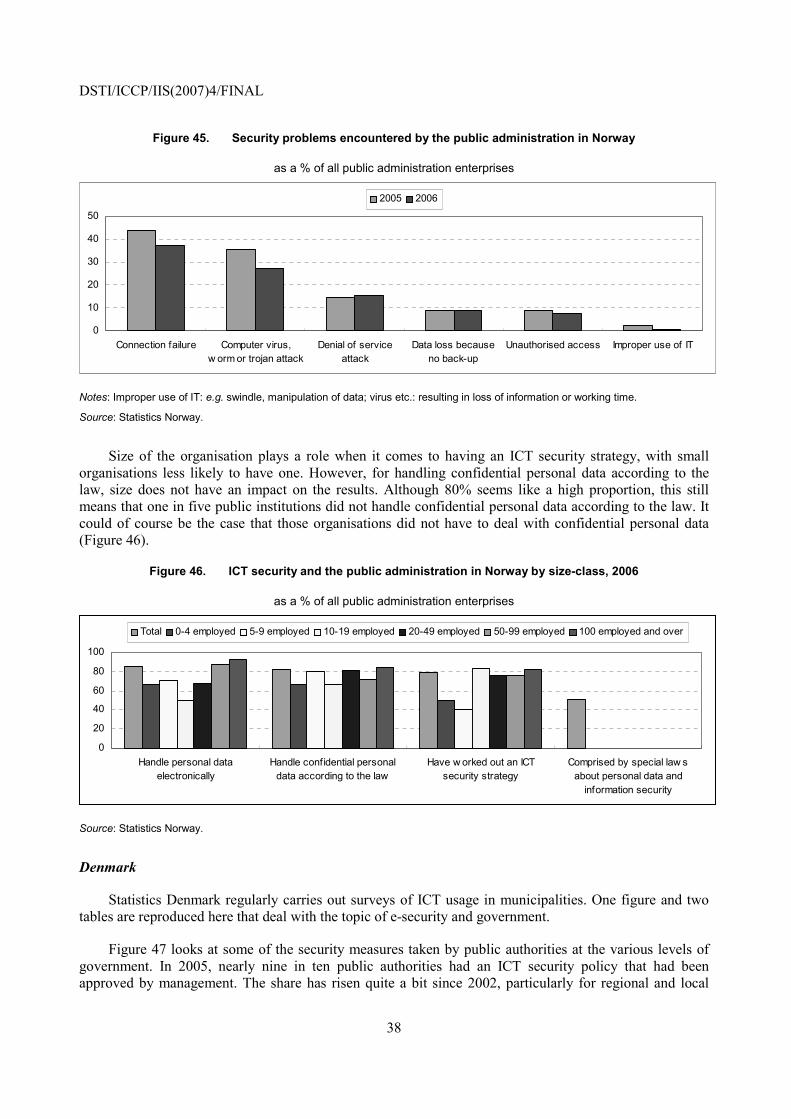
Despite the security measures in place, 27% of public administration organisations suffered from a computer virus, worm or trojan attack, leading to financial damage or a loss in working time. This was less than the 2005 number (35%), but more than the proportion of business enterprises in Norway that suffered a virus attack in 2005, which stood at 22%. A substantial proportion (15.5%) of public institutions were victim of a denial of service attack, while 8.7% lost data because they forgot to run a back-up and 7.6% reported unauthorised access (Figure 45).
DSTI/ICCP/IIS(2007)4/FINAL
38
Figure 45. Security problems encountered by the public administration in Norway
as a % of all public administration enterprises
0
10
20
30
40
50
Connection failure Computer virus,w orm or trojan attack
Denial of serviceattack
Data loss becauseno back-up
Unauthorised access Improper use of IT
2005 2006
Notes: Improper use of IT: e.g. swindle, manipulation of data; virus etc.: resulting in loss of information or working time.
Source: Statistics Norway.
Size of the organisation plays a role when it comes to having an ICT security strategy, with small organisations less likely to have one. However, for handling confidential personal data according to the law, size does not have an impact on the results. Although 80% seems like a high proportion, this still means that one in five public institutions did not handle confidential personal data according to the law. It could of course be the case that those organisations did not have to deal with confidential personal data (Figure 46).
Figure 46. ICT security and the public administration in Norway by size-class, 2006
as a % of all public administration enterprises
0
20
40
60
80
100
Handle personal dataelectronically
Handle confidential personaldata according to the law
Have w orked out an ICTsecurity strategy
Comprised by special law sabout personal data and
information security
Total 0-4 employed 5-9 employed 10-19 employed 20-49 employed 50-99 employed 100 employed and over
Source: Statistics Norway.
Denmark
Statistics Denmark regularly carries out surveys of ICT usage in municipalities. One figure and two tables are reproduced here that deal with the topic of e-security and government.
Figure 47 looks at some of the security measures taken by public authorities at the various levels of government. In 2005, nearly nine in ten public authorities had an ICT security policy that had been approved by management. The share has risen quite a bit since 2002, particularly for regional and local

DSTI/ICCP/IIS(2007)4/FINAL
39
authorities. The diffusion of an approved ICT security policy in 2005 is largely the same among central government, regional and local authorities as opposed to 2002, when central government was in the lead (Statistics Denmark & Ministry of Science, Technology and Innovation, 2006).
Figure 47. Security measures in place by public authorities, 2005
as a % of all public authorities
0102030405060708090
100
Anti-virus software Approved ICTsecurity policy
Formally appointedICT securityresponsible
Updated ICT-strategy
Updated emergencyplan
Current ICT securitytraining ofemployees
Total Central government Regional authorities All municipalities
Note: Anti-virus software and totals for updated emergency plan and current ICT security training of employees are for 2004.
Source: Statistics Denmark.
Table 2 provides details about a number of security problems encountered by public authorities in Denmark in 2005. Among public authorities, 17% experienced denial of service attacks in 2005, a small drop compared with 20% in 2004. In the same year, 10% were subjected to unauthorised access to systems/data of a disruptive or severe nature, which is about the same as in previous years. The difference in the average size of the organisations is one of the reasons why a larger share of authorities experience ICT security problems compared with enterprises. (Statistics Denmark & Ministry of Science, Technology and Innovation, 2006)
Virus attacks were the most important problem, standing at 31% in 2005, but this was a considerable decrease from 59% in 2002. As was the case for Norway, these percentages were higher than the percentages for business enterprises in Denmark, which stood at 24% in 2005. What is noticeable in this table is the wide variation between the various levels of government, in particular the high proportions for regional authorities.

DSTI/ICCP/IIS(2007)4/FINAL
40
Table 2. Security problems encountered by public authorities, 2005
as a % of all public authorities
Total Central
government Regional
authorities All
municipalities
Municipalities with
population below 15 000
Municipalities with
population above 15 000
Virus-attacks (resulting in a loss of information or working time) 31 32 82 28 30 23 Denial of service attacks 17 13 55 16 14 22 Data loss because of lack of backup 11 18 18 7 7 6 Unauthorised access 10 13 36 7 6 11 Economic IT abuse 1 1 9 1 0 2 Blackmail with data or software 1 0 0 1 1 2
Source: Statistics Denmark.
In sharp contrast with Norway, almost all Danish public authorities accepted or used digital signatures in 2005. Other forms of secure connection were less developed though. Not all public authorities, however, may have the need for this type of communication. Secure connections were available in 35% of the organisations, similar to Norway, while logging-in via a pincode or an access code was required in 28% of the government websites, about double the Norwegian proportion (Table 3).
Table 3. Secure communication with public authorities, 2005
Total Central
government Regional
authorities
All munici-palities
Municip. with
population below 15 000
Municip. with
population above 15 000
Public authorities accepting digital signature 97 93 100 98 98 100 Acceptance of signed e-mail 96 92 100 97 97 98 Complete and sign/verify blank forms 39 10 18 53 50 60 Login on the home-site using a digital signature 24 18 9 27 23 35 Public authorities using digital signature 97 94 100 97 97 98 Sending e-mail with organisation signature 92 84 100 96 94 98 Sending e-mail with employee signature 42 40 45 43 41 46 Other forms of secure communication Secure connection 35 34 27 35 27 51 Log-on via pincode or access code 28 39 27 23 18 31
Source: Statistics Denmark.
Denmark and Norway
Data on ICT security are collected in the Norwegian and Danish surveys of ICT usage in the public sector. A comparison of the municipalities of the two countries shows a high and generally uniform dispersion of security facilities (Nordic Council of Ministers, 2005) (Table 4).
For comparable indicators, the spread of security facilities corresponds to the spread among the largest enterprises of the two countries. For example, 100% of all municipalities have a firewall compared to 98-99% of enterprises with at least 100 employees. The larger municipalities are more likely to use
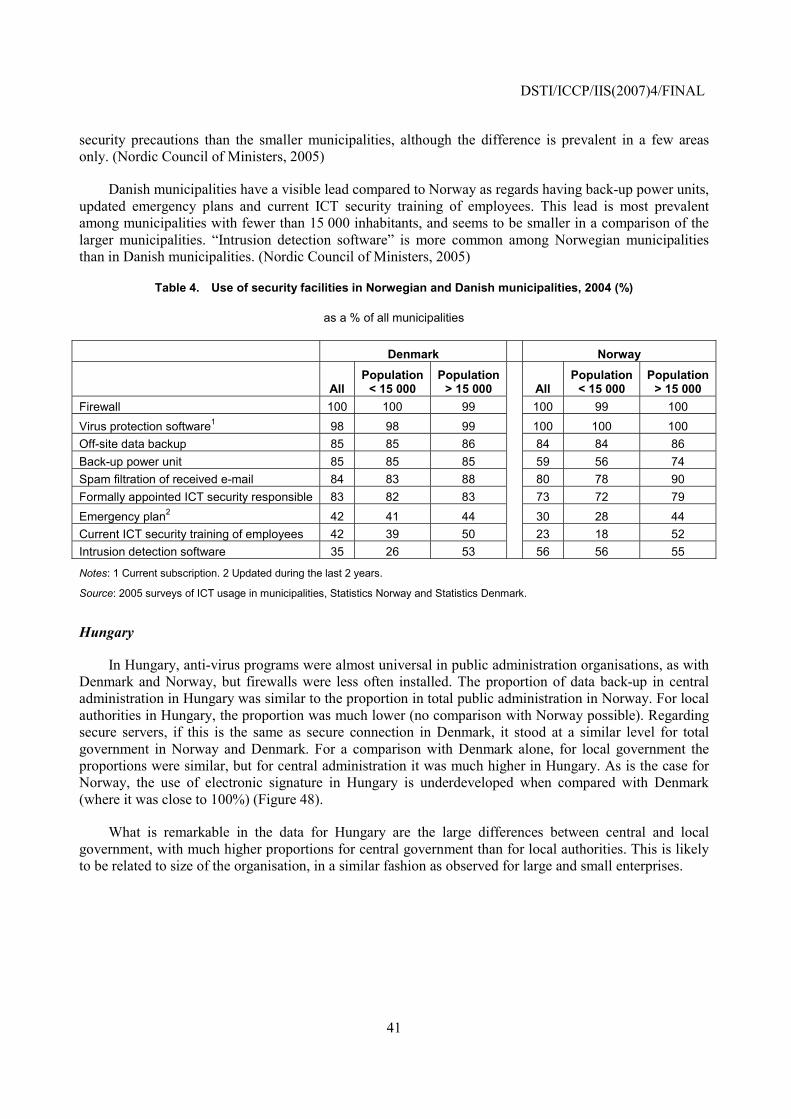
DSTI/ICCP/IIS(2007)4/FINAL
41
security precautions than the smaller municipalities, although the difference is prevalent in a few areas only. (Nordic Council of Ministers, 2005)
Danish municipalities have a visible lead compared to Norway as regards having back-up power units, updated emergency plans and current ICT security training of employees. This lead is most prevalent among municipalities with fewer than 15 000 inhabitants, and seems to be smaller in a comparison of the larger municipalities. �Intrusion detection software� is more common among Norwegian municipalities than in Danish municipalities. (Nordic Council of Ministers, 2005)
Table 4. Use of security facilities in Norwegian and Danish municipalities, 2004 (%)
as a % of all municipalities
Denmark Norway
All Population
< 15 000 Population
> 15 000 All Population
< 15 000 Population
> 15 000 Firewall 100 100 99 100 99 100 Virus protection software1 98 98 99 100 100 100 Off-site data backup 85 85 86 84 84 86 Back-up power unit 85 85 85 59 56 74 Spam filtration of received e-mail 84 83 88 80 78 90 Formally appointed ICT security responsible 83 82 83 73 72 79 Emergency plan2 42 41 44 30 28 44 Current ICT security training of employees 42 39 50 23 18 52 Intrusion detection software 35 26 53 56 56 55
Notes: 1 Current subscription. 2 Updated during the last 2 years.
Source: 2005 surveys of ICT usage in municipalities, Statistics Norway and Statistics Denmark.
Hungary
In Hungary, anti-virus programs were almost universal in public administration organisations, as with Denmark and Norway, but firewalls were less often installed. The proportion of data back-up in central administration in Hungary was similar to the proportion in total public administration in Norway. For local authorities in Hungary, the proportion was much lower (no comparison with Norway possible). Regarding secure servers, if this is the same as secure connection in Denmark, it stood at a similar level for total government in Norway and Denmark. For a comparison with Denmark alone, for local government the proportions were similar, but for central administration it was much higher in Hungary. As is the case for Norway, the use of electronic signature in Hungary is underdeveloped when compared with Denmark (where it was close to 100%) (Figure 48).
What is remarkable in the data for Hungary are the large differences between central and local government, with much higher proportions for central government than for local authorities. This is likely to be related to size of the organisation, in a similar fashion as observed for large and small enterprises.
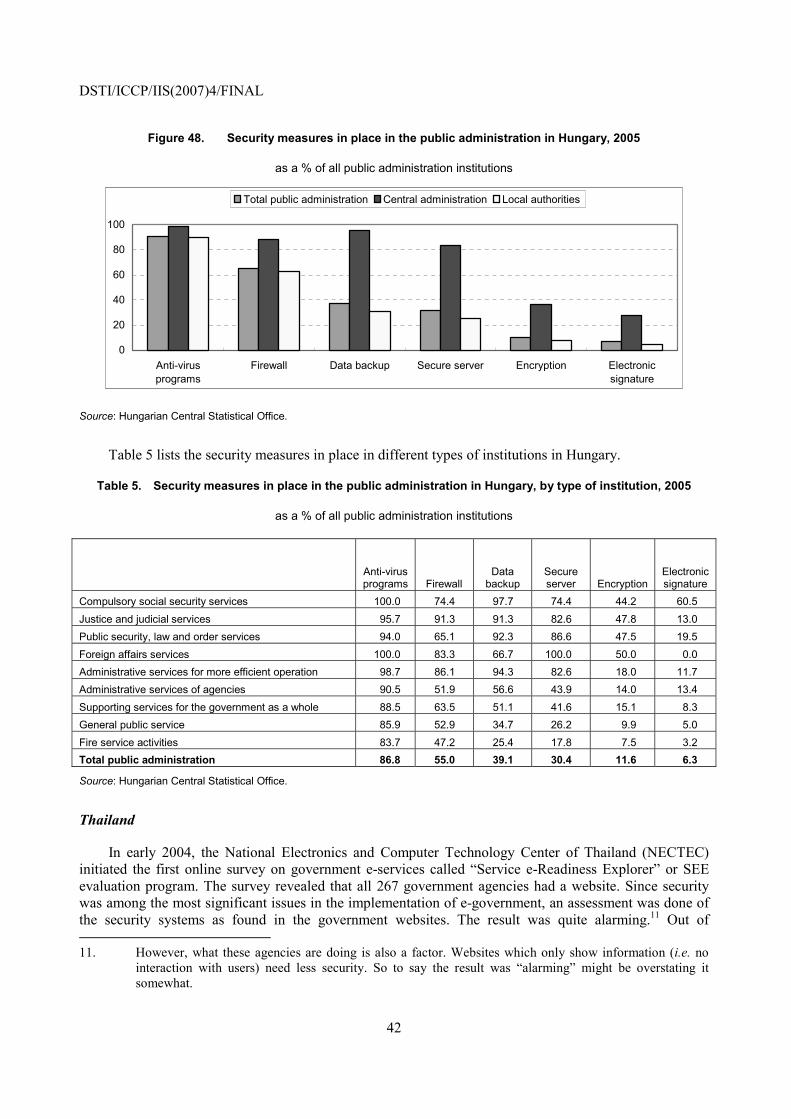
DSTI/ICCP/IIS(2007)4/FINAL
42
Figure 48. Security measures in place in the public administration in Hungary, 2005
as a % of all public administration institutions
0
20
40
60
80
100
Anti-virusprograms
Firewall Data backup Secure server Encryption Electronicsignature
Total public administration Central administration Local authorities
Source: Hungarian Central Statistical Office.
Table 5 lists the security measures in place in different types of institutions in Hungary.
Table 5. Security measures in place in the public administration in Hungary, by type of institution, 2005
as a % of all public administration institutions
Anti-virus programs Firewall
Data backup
Secure server Encryption
Electronic signature
Compulsory social security services 100.0 74.4 97.7 74.4 44.2 60.5 Justice and judicial services 95.7 91.3 91.3 82.6 47.8 13.0 Public security, law and order services 94.0 65.1 92.3 86.6 47.5 19.5 Foreign affairs services 100.0 83.3 66.7 100.0 50.0 0.0 Administrative services for more efficient operation 98.7 86.1 94.3 82.6 18.0 11.7 Administrative services of agencies 90.5 51.9 56.6 43.9 14.0 13.4 Supporting services for the government as a whole 88.5 63.5 51.1 41.6 15.1 8.3 General public service 85.9 52.9 34.7 26.2 9.9 5.0 Fire service activities 83.7 47.2 25.4 17.8 7.5 3.2 Total public administration 86.8 55.0 39.1 30.4 11.6 6.3
Source: Hungarian Central Statistical Office.
Thailand
In early 2004, the National Electronics and Computer Technology Center of Thailand (NECTEC) initiated the first online survey on government e-services called �Service e-Readiness Explorer� or SEE evaluation program. The survey revealed that all 267 government agencies had a website. Since security was among the most significant issues in the implementation of e-government, an assessment was done of the security systems as found in the government websites. The result was quite alarming.11 Out of 11. However, what these agencies are doing is also a factor. Websites which only show information (i.e. no
interaction with users) need less security. So to say the result was �alarming� might be overstating it somewhat.

DSTI/ICCP/IIS(2007)4/FINAL
43
267 websites surveyed, 104 websites (39%) did not have any security system implemented, 131 (49%) used a simple security system, i.e. user name/password authentication, 31 (12%) used a more advanced system, namely Secured Socket Layer (SSL) and data encryption, and only one (0.4%) had imposed the strongest security measures, i.e. digital signature for encryption and authentication (NECTEC, 2005).
Chinese Taipei
In Chinese Taipei, e-government indicators are based on data collected from two government agencies, the Research, Development and Evaluation Commission and the Public Construction Commission. From a comparison of the proportion of satisfied and dissatisfied responses about public satisfaction with e-government website information and transaction security, it is evident that Chinese Taipei�s e-government security environment still has room for improvement (�Very satisfied� and �Reasonably satisfied� 30.8%, �Average� 21.0%, �Unsatisfied� and �Very unsatisfied� 29.8%). Nevertheless, the public satisfaction level (�Very satisfied�, �Reasonably satisfied�, and �Average� taken together) with the security of e-government website information and transactions went up from 37.7% in 2004 to 51.8% in 2005/06 (Science and Technology Advisory Group, 2006).
Other indicators
This section explores a few other indicators relating to security and trust, drawing on work undertaken by a few countries and international organisations. The Working Party may consider investigating the relevance and feasibility of developing common concepts and definitions for some of these indicators. In some cases, this could prove to be very challenging from a statistical point of view.
Online identity theft
At its October 2005 meeting, the Information, Computer and Communications Policy Committee (ICCP) agreed to conduct future work that would analyse broad trends and policies that will shape the future of the Internet. It further agreed that the issues surrounding the future of the Internet would benefit from a Ministerial-level meeting that it will organise in June 2008. The Committee on Consumer Policy (CCP) was invited to participate. The CCP, at its 72nd session in October 2006, agreed to provide input to the project. Cyber fraud was identified as the main theme to be examined, with one of the focus areas on identity theft, which is a new topic for the CCP to explore. In light of the growing importance of this issue, the CCP entrusted the Secretariat with the task of preparing a scoping paper on online ID theft, to better understand the concept and the extent to which it can affect consumers and users. This paper was presented to the 73rd session of the CCP in April 2007.
ID theft is regarded by many as one of the major risks which consumers and users are exposed to in today�s digital environment. ID theft may be perpetrated for financial, identity cloning, and/or criminal purposes. Economic and financial fraud committed by the use of credit cards has clearly profited from technological advances. Due to the growing number of people using electronic payment systems, this kind of fraud could propagate further in the coming years. E-payment and e-banking services (�) substantially suffer from such mistrust (OECD, 2007).
Determining the impact of online ID theft is a challenging exercise. Statistics are collected differently by different countries, complicating cross-border comparisons. When data are available, they do not specifically cover ID theft which is buried in other categories. The absence of a common definition of what �ID theft� is (whether offline or online) complicates matters. As a result, data measuring the extent to which ID theft can be harmful presents significant weaknesses which distort the way in which the problem may be perceived. Moreover, statistics collected by public and private entities vary greatly: some sources

DSTI/ICCP/IIS(2007)4/FINAL
44
conclude that the scale of ID theft has gone down in the past years, resulting in growing consumer confidence. In contrast, other sources advance figures reflecting an increase in ID theft. Many statistics do not clearly distinguish between online and offline ID theft. The production of more tailored and accurate statistical data, covering all OECD member countries could help determine the impact of ID theft in the digital marketplace. (OECD, 2007)
WPIIS could consider collaborating with CCP in developing common concepts and definitions of online identity theft and in piloting data collection on the size and impact of this phenomenon.
The cost of e-crime
An OECD report on information security in Norway outlines general challenges in assessing the costs of cyber-crime. �Evaluating the costs of information security failures poses a number of methodological challenges, such as how to quantify the loss of a sensitive information asset, knowing that its eventual cost for the firm will depend on who holds it, at what time, and what use will be made of it; how to measure cascading effects, such as the repercussions of a system�s disruption on other linked systems; and how to account for indirect costs such as security expenses (e.g. the overhead costs of an incident response team). There is no standard, widely accepted method for dealing with these questions. Because of the scarcity of information and the lack of a consistent cost assessment method, estimates of the economic impact of information security failures are commonly based on surveys among organisations. However, such results cannot be interpreted as accurate measures of the costs of information security failures even among participating organisations, simply because the lack of a consistent method for quantifying costs also applies to the survey respondents. Indeed, about two-thirds of the participants in the first survey and half the participants in the second were unwilling or unable to quantify their losses. In addition, as the survey samples do not aim to be representative, the results cannot be extrapolated rigorously to national or global level. The most general cost assessments are produced by the information security industry, based on extrapolations from surveys � although the precise methodology of these assessments is usually not made public, and therefore cannot be evaluated objectively� (OECD, 2006).
Nevertheless, several studies or reports try to estimate these costs. For example, a report to the Norwegian Parliament (the Storting) �estimates the annual costs related to ICT crime and unwanted ICT events in Norwegian enterprises at NOK 1.8 billion (USD 300 million). The survey offers no general view of the size of the loss to private households resulting from a lack of ICT security in the home. There is however no reason to believe that the security situation in private households is better than in the private and public sectors� (Norwegian Ministry of Government Administration and Reform, 2007).
In the United Kingdom, a survey of adult Internet users, held in March 2007, found that Internet users who experienced online fraud lost an average of GBP 875 (USD 1750) each over the twelve months from March 2006 to March 2007 (Get Safe Online, 2007).
The 2006 Information Security Breaches Survey (ISBS) in the United Kingdom looked at four categories of impact in estimating the cost of e-security breaches: business disruption; incident response costs; direct financial losses; and damage to reputation. While for certain specific incidents businesses suffered considerable incident response costs and direct financial losses, on average business disruption accounted for around three-quarters of the total cost of the worst e-security breach that businesses faced. It cost UK businesses an estimated average cost of between GBP 8 000 (USD 16 000) and GBP 17 000 (USD 34 000) to deal with the worst e-security incident they had in 2005. Large companies faced higher costs from their worst incident, between GBP 65 000 (USD 30 000) and GBP 130 000 (USD 260 000). The ISBS estimated that for UK businesses overall, the cost of security breaches in 2005 was around 50% higher than in 2003, though the cost to large companies had fallen to about half the level they suffered

DSTI/ICCP/IIS(2007)4/FINAL
45
in 2003, suggesting that an increasing proportion of the overall burden was falling on small and medium-sized enterprises (ONS, 2007).
The Hi-Tech Crime Survey (HTCS), commissioned by the National Hi-Tech Crime Unit, estimated that the minimum total cost of impact of computer crime on UK-located companies with over 1 000 employees was GBP 2.4 billion (USD 4.8 billion) in 2004, while for businesses with between 100 and 1 000 employees the cost was GBP 177 million (USD 355 million), as shown in Table 6. Among firms with over 1 000 employees more than one-half of the estimated costs of computer enabled crime came from two main types of criminal activity: planting viruses, worms or trojans (28%) and financial fraud (25%), together costing an estimated GBP 1.3 billion (USD 2.6 billion). (ONS, 2007)
Table 6. Estimated total cost of computer-enabled crime in the UK, by type of crime, 2004
Firms with 100 to1000 employees
Firms with over 1000 employees
£ million $ million £ million $ million Viruses, worms or trojans 70.8 141.9 676.7 1356.6 Financial fraud 68.2 136.7 622.3 1247.5 Denial of service 2.9 5.8 555.2 1113.0 Equipment theft 28.8 57.7 383.7 769.2 Telecoms fraud 0.1 0.2 77.7 155.8 Systems used for criminal/illegitimate purposes 0.2 0.4 46.1 92.4 Unauthorised access to business systems 2.2 4.4 43.7 87.6 Theft of information/data 3.3 6.6 33.3 66.8 Sabotage of data or networks 0.7 1.4 5.7 11.4 Web site defacement 0.1 0.2 - -
Source: Hi-Tech Crime Survey, Serious Organised Crime Agency.
The Australian Bureau of Statistics has as one of its priorities to improve statistical information about fraud and electronic crime including data to assist measurement of the size of the problem, offender information and victim information, including economic impacts. A primary information requirement is to estimate the size of fraud and e-crime in terms of economic impact (including security costs and lost time), number of incidents, number of victims and jurisdiction of origin. A secondary information requirement is to be able to describe the characteristics of incidents including characteristics of offenders and victims (ABS, 2005).
The Working Party could consider following this direction as well. One idea could be to follow Australia�s lead, who are currently carrying out work on consumer fraud, the extent and impact of cyber crime on businesses, but also on a framework and classifications.
Reporting security incidents
The previously mentioned OECD review of risk management of information security in Norway points out that �surveys in various countries consistently indicate that only a small fraction of organisations which have suffered a cyber-attack report it to law enforcement authorities or governmental statistics offices� (OECD, 2006).
This is confirmed by the report to the Norwegian Parliament, where �it is estimated that Norwegian enterprises were exposed to some 3 900 data breaches in 2005. This result is in stark contrast to the police statistics which only show 61 reports in this category. Similarly, there are estimated to have been

DSTI/ICCP/IIS(2007)4/FINAL
46
8 900 cases of misuse of enterprises� ICT resources in this period. Here, there have been only 11 reports to the police� (Norwegian Ministry of Government Administration and Reform, 2007).
Business management of e-security
In conjunction with the previous one, a final indicator that could be considered concerns the business management of e-security. According to the UK Information Security Breaches Survey, �40% of UK businesses had a formal information security policy in place by the end of 2005, up from 34% in 2003. Large businesses were more likely to have one, with nearly three-quarters (73%) of companies employing 250 or more having a policy in 2005. In 2005 nearly two-thirds (65%) of UK businesses had documented procedures to ensure compliance with the Data Protection Act 1998, up from 47% in 2003. A further 9% of businesses were planning to introduce those� (ONS, 2007).

DSTI/ICCP/IIS(2007)4/FINAL
47
CONCLUSIONS
The indicators reviewed in this paper suggest that for households and individuals, security and trust concerns are not a major barrier for accessing the Internet. Furthermore, most individuals have taken security measures, often multiple, to protect themselves against virus attacks and other malware. Despite these measures, a substantial proportion of Internet users are plagued by virus attacks or other malware, which continues to evolve at a rapid pace. For most countries, this proportion stood between 20% and 40% in 2005, with extremes of 5% at the low end and 70% at the high end. Even more people reported receiving spam in their mailbox, between 40% and 70% in 2006 for most countries, and for most countries this proportion has been increasing over time.
Because spam is the number one security problem and since many types of malware are now being distributed through spam, it would be of interest to collect more data on spam. For example, in a survey of 2 400 people in the United Kingdom, carried out by YouGov for Get Safe Online, a fifth of those polled said they had replied to spam messages and 10% had clicked on an Internet link within a spam e-mail. These could be areas to further investigate including the question of whether official statistical agencies are best placed, given the nature of the phenomenon or whether this work should be undertaken elsewhere.
In the case of business users, most enterprises have security facilities in place. In particular firewalls are rapidly being implemented across countries over the last few years in line with the greater uptake of always-on broadband access. The suggested results are that in most countries some types of security problems encountered have decreased in the same period.
More intensive users � such as broadband users, men, higher educated people, or people that do not live in poorer regions in the case of individuals, and large enterprises and enterprises in service industries in the case of businesses � are more likely to have security measures in place when they access the Internet, but they are also more likely to have experienced a security problem, such as a computer virus, fraudulent payment or abuse of personal information sent on the Internet. Interestingly, many of the breakdowns observed in the EU, were similar to the experiences of Brazil and Korea.
Fraudulent payment use is serious when it happens. That is one of the reasons it attracts a lot of media attention, and why security and trust concerns are a major barrier to e-commerce. Security concerns were a barrier to engaging in e-commerce for 32% of individuals in the EU with Internet access who did not buy on-line, while for trust concerns this proportion stood at 25%. However, only 1.5% of Internet users in the EU (in 2006) reported a security problem with payments when buying goods online. A similar, if slightly different indicator, shows that 1.3% of Internet users in the EU reported fraudulent payment card use in 2005. Therefore, although this type of incident is serious for the victims and issuers of the cards, the prevalence seems to be lower than might be expected in the light of the attention it receives. On the other hand, perhaps the attention paid in the media and elsewhere plays a part in making users more cautious. The balance to be achieved is to try to ensure a well informed market place that can make decisions about trust in the online environment but not in erecting unnecessary barriers.
It would be interesting for analytical purposes if the data on fraudulent payment card use would not only be reported as a proportion of all Internet users, but also as a proportion of people who ordered or bought goods online.

DSTI/ICCP/IIS(2007)4/FINAL
48
This raises a challenge for businesses to convince consumers that e-commerce is relatively safe. Eurostat has been piloting a question in their questionnaire on the use of various confidence-building practices on the websites of enterprises, such as trustmarks, consumer service mechanisms or alternative dispute resolution mechanisms. The results were not very encouraging. Few countries responded, and the percentages were generally relatively low. Enterprises can � and maybe should � do more in this respect.
Concerning the measurement of e-government, a recent study by Booz Allen Hamilton, commissioned by the UK Cabinet Office, on world-wide best practice in e-government, found that �there are very few quantitative indicators to measure impact of ICT enabled government (�), e-government measurement clearly lags behind measurement of e-business and the Information Society, for which there are widespread data, and this is an area that needs to be addressed at supranational level over the next couple of years� (Booz Allen Hamilton, 2005).
This statement holds even more strongly for security and trust issues related to e-government. There are few countries that collect this type of data, and there are no international standards that can be followed. Nevertheless, data for the few countries that have been included in this paper show that in those countries almost all government organisations have taken � often multiple � security measures. Despite this, many of those organisations still encountered security problems, about the same proportion as for enterprises in the business sector.
One of the problem areas in measuring e-government is at what level of government the measurement should be done. The data on security and trust and e-government confirm that this is a real challenge, with large differences observed for the different levels of government.
One way forward is to treat public institutions as �normal� enterprises, and include them in the ICT surveys of businesses, possibly with some adaptations. This is an approach followed for example by Canada. Some indicators that could be considered include security measures in place, security problems encountered, ICT security policies in place, emergency plans in place, and secure communication channels in place. Furthermore, the questionnaires directed to individuals and businesses could include questions on trust in the security of government websites and problems experienced.
Of relevance and interest to the WPIIS is the co-operation between the OECD Working Party on Information Security and Privacy (WPISP) and APEC, which have agreed to develop a list of key model questions aimed to gather information from governments on ICT security and trust. If agreed by both organisations, the final set of model questions will be proposed for inclusion into a new OECD-APEC Model Survey to guide the development of national surveys for indicators of security and trust targeted at governments. The WPIIS could consider offering to collaborate in this project. In any case, the results of this exercise will be presented to the WPIIS at its 2008 meeting.
Returning to the data, for some of the indicators shown in this paper, time series are sometimes volatile and geographical patterns do not match the patterns usually found for ICT usage. In addition, there are often large variations between countries. Data quality issues arise for various reasons, including difficulties for respondents in understanding survey questions, reluctance of respondents to provide sensitive information, or insufficient sample sizes.
Despite these problems, there is a demand from policy makers for these data, and this demand is likely to grow with the increasing importance of the online environment to all economic and social development. It is important that countries maintain or increase efforts to understand these data issues and work to improve indicators in this area. This will also help in supporting or refuting data from private sources where the methodology may not be available or the intent neutral in respect to informing public policy.

DSTI/ICCP/IIS(2007)4/FINAL
49
Finally, the Korea Information Security Agency (KISA) has created an index, composed of 16 indicators, which has been developed to evaluate the national information security level. The index has been jointly developed by the Korea Information Security Agency and the Information-technology Promotion Agency of Japan and will be presented at the Working Party meeting. It will be interesting to explore this index as well for potential indicators.

DSTI/ICCP/IIS(2007)4/FINAL
50
REFERENCES
Australian Bureau of Statistics (ABS) (2005), National Information Development Plan for Crime and Justice Statistics 2005, ABS, Canberra, www.ausstats.abs.gov.au/ausstats/free.nsf/0/.../45200_2005.pdf
ABS (2006a), Business Use Of Information Technology 2004-05, Canberra, www.abs.gov.au
ABS (2006b), Household Use of Information Technology, Australia, 2005-06, Canberra, www.abs.gov.au.
Booz Allen Hamilton (2005), Beyond e-Government. The World�s Most Successful Technology-Enabled Transformations, London, www.boozallen.com/media/file/151607.pdf.
China Internet Network Information Center (CNNIC) (various issues), Statistical Survey Report on the Internet Development in China, Beijing, www.cnnic.net.cn/en/index/.
Comitê Gestor da Internet no Brasil (Brazilian Internet Steering Committee) (2006), Pesquisa Sobre o Uso das Tecnologias da Informação e da Comunicação no Brasil 2005 (Survey on the Use of Information and Communication Technologies in Brazil 2005), www.cetic.br/tic/2005/indicadores-2005.pdf.
Danmarks Statistik (2006), Den Offentlige Sektors Brug af IT 2005 (Public Sector Use of IT 2005), Serviceerhverv 2006:6, Statistiske Efterretninger, Copenhagen, www.dst.dk/upload/off2005e.pdf.
Department of Communications, Information Technology and the Arts (DCITA) (2005), Trust and Growth in the Online Environment, DCITA, Canberra, www.dcita.gov.au/__data/assets/pdf_file/34142/Trust_and_Growth_Report.pdf.
Get Safe Online (2007), www.getsafeonline.org/.
Hungarian Central Statistical Office (2005), A Közigazgatás Informatikai Eszközei és Információs Tevékenysége 2004 (Informatical Devices and Information-Related Activities in The Public Administration, 2004), Budapest, http://portal.ksh.hu/pls/ksh/docs/hun/xftp/idoszaki/kozinform/kozinform04.pdf
Hungarian Central Statistical Office (2006), A Közigazgatás Informatikai Eszközei és Információs Tevékenysége 2005 (Informatical Devices and Information-Related Activities in The Public Administration, 2005), Budapest, http://portal.ksh.hu/pls/ksh/docs/hun/xftp/idoszaki/kozinform/kozinform05.pdf.
Infocomm Development Authority (IDA), (various issues), Annual Survey on Infocomm Usage in Households and by Individuals, Singapore, www.ida.gov.sg/Publications/20061205092557.aspx.
IDA (various issues), Survey on Infocomm Usage in Businesses, Singapore, www.ida.gov.sg/Publications/20061205092557.aspx.

DSTI/ICCP/IIS(2007)4/FINAL
51
IDA (2006), Measuring Infocomm Usage by Companies for 2005, Singapore, www.ida.gov.sg/Publications/20061205092557.aspx.
Ministry of Economic Affairs of Chinese Taipei (MOEA) (2006), Internet in Taiwan, Taipei, www.find.org.tw/eng.
Ministry of Information and Communication, National Internet Development Agency of Korea (various issues), Survey on the Computer and Internet Usage, Seoul, www.nida.or.kr/english/.
Ministry of Internal Affairs and Communications of Japan (various issues), Communications Usage Trend Survey, Tokyo, www.soumu.go.jp/joho_tsusin/eng/statistics.html.
Ministry of Internal Affairs and Communications of Japan (2005), Information and Communications in Japan 2005, Tokyo, www.soumu.go.jp/joho_tsusin/eng/statistics.html.
National Electronics and Computer Technology Center (NECTEC) (2005), Thailand ICT Indicators 2005, NECTEC, National Science and Technology Development Agency, Ministry of Science and Technology, Bangkok, iir.ngi.nectec.or.th/download/indicator2005.pdf.
Nordic Council of Ministers (2005), Nordic Information Society Statistics 2005, Copenhagen, www.dst.dk/upload/nordic2005rev__001.pdf.
Norwegian Ministry of Government Administration and Reform (2007), An Information Society for All. Summary in English: Report No. 17 (2006�2007) to the Storting, DSTI/ICCP/RD(2007)3, Secretariat working paper.
OECD (2005a), Guide to Measuring the Information Society, OECD, Paris, www.oecd.org/dataoecd/41/12/36177203.pdf.
OECD (2005b), OECD Science, Technology and Industry Scoreboard 2005, Paris, www.oecd.org/sti/scoreboard.
OECD (2005c), Scoping Study for the Measurement of Trust in the Online Environment, Working Party on Indicators for the Information Society, DSTI/ICCP/IIS(2005)1/FINAL, Paris, www.oecd.org/dataoecd/26/15/35792806.pdf.
OECD (2006), �Norway. Information Security�, OECD Reviews of Risk Management Policies, OECD, Paris.
OECD (2007), Scoping paper on Online Identity Theft, Committee on Consumer Policy, DSTI/CP(2007)3, Secretariat working paper, Paris.
Office for National Statistics (ONS) (2007), Focus on the Digital Age. 2007 edition, London, www.statistics.gov.uk/downloads/theme_compendia/foda2007/FocusOnDA.pdf.
Science and Technology Advisory Group (2006), e-Taiwan. Challenge 2008 Program, Science and Technology Advisory Group, Executive Yuan, Taipei, www.etaiwan.nat.gov.tw.
Statistics Denmark & Ministry of Science, Technology and Innovation (2005), Key Figures on the Danish Information Society 2005 - Danish Figures, Copenhagen, www.dst.dk/HomeUK/Statistics/ofs/Publications.aspx.

DSTI/ICCP/IIS(2007)4/FINAL
52
Statistics Denmark & Ministry of Science, Technology and Innovation (2006), Key Figures on the Danish Information Society 2006 � Danish Figures, Copenhagen, www.dst.dk/HomeUK/Statistics/ofs/Publications.aspx.
Statistics Norway (various years), Use of ICT (Information and Communication Technology) in Public Administration, www.ssb.no/iktbruks_en/main.html.
U.S. Census Bureau (2004), Current Population Survey (CPS): 2003 Internet and Computer Use Data, Washington, www.bls.census.gov/cps/computer/2003/sdata.htm.

DSTI/ICCP/IIS(2007)4/FINAL
53
ANNEX 1: COUNTRY CODES
EU countries Other countries covered by Eurostat EU251 European Union (25 countries) MK Macedonia, the former Yugoslav Republic of BE Belgium IS Iceland BG Bulgaria NO Norway CZ Czech Republic TR Turkey DK Denmark DE Germany Other OECD countries EE Estonia AUS Australia IE Ireland CAN Canada GR Greece CHE Switzerland ES Spain JAP Japan FR France KOR South Korea IT Italy MEX Mexico CY Cyprus USA United States LV Latvia LT Lithuania Other economies LU Luxembourg BRA Brazil HU Hungary CHN China MT Malta SGP Singapore NL Netherlands CHT Chinese Taipei AT Austria PL Poland PT Portugal RO Romania SI Slovenia SK Slovakia FI Finland SE Sweden UK United Kingdom
1. Excluding Bulgaria and Romania.