dts, inc.€¦ · time necessary to build a strategic foundation around these key technology...
TRANSCRIPT

25JUL201117263719Dear Fellow Shareholders,
2013 continued DTS’ transition and transformation into a company entirely focused on the largeand growing network-connected opportunity. We had an extremely productive year, significantlyadvancing our long-term strategy as we continued to lay the foundation for an exciting future inconnected, on-the-go entertainment. We delivered meaningful top-line growth driven by continuedstrength in connected TVs, mobile devices and PCs. At the same time, we continued our sharp focuson costs in order to drive earnings growth and shareholder returns.
We have transitioned our business to focus not only on technology components, but on completeaudio solutions that address how entertainment is being consumed today—in the home wirelessly andon mobile devices—and ended 2013 with an unparalleled portfolio of technologies and products. Theresponse to some of our newest innovative solutions has been extremely positive. We continue to builda long-term ecosystem around our Headphone:X and Play-Fi technology platforms. Headphone:Xtargets the mobile use case and offers a level of experience and personalization never before availableon portable devices. Play-Fi targets wireless audio delivery in the home, and serves as a key bridgebetween mobile devices and home-based entertainment devices. By focusing our energy and taking thetime necessary to build a strategic foundation around these key technology platforms, we haveestablished the basis to drive long-term revenue growth.
The network-connected segment of consumer electronics—which includes TVs, smartphones,tablets, digital media players and PCs—is expected to grow substantially over the next several years asthe powerful trends driving mobility and connected entertainment continue to evolve, and theopportunity set in the network-connected market is tremendous. The modern connected lifestyledemands that entertainment content be available anytime, anywhere, and on any device, and wecontinue to develop solutions that address these trends. We expect network-connected revenues toexceed 50% of our total revenues for 2014, which speaks to the importance of this market overall.
We believe that audio will soon be recognized as an untapped frontier for greater improvements inthe performance of connected and mobile devices. Research has shown that people consider audioquality to be a far more important factor than video quality in determining the ‘‘likeability’’ of aparticular piece of entertainment content, and as a result, we believe that sound has the opportunity tobe recognized as a highly differentiating feature. This is something we have known for years—simplyput, sound matters!
Importantly, despite some shifts during 2013 in the timing of product launches, and thereforerevenue, we are now realizing many of the goals we set years ago. Looking at DTS’ performance inadvancing our technologies and spreading them out into large and profitable market opportunities,I have never been more enthusiastic about our company’s ability to grow our position in the network-connected market and to shape how consumers experience high quality entertainment. Our progressagainst our main mission—making the world sound better—is more relevant and important than everas content is increasingly consumed on smaller, thinner and lower power devices, requiring increasinglysophisticated sound technology.
We look forward to building upon our accomplishments in 2013 and driving more aggressivestrategic progress and growth in 2014 and over the years ahead. We want to thank our customers,partners and investors for their continued support of DTS during this exciting period of transformation.In addition, we are grateful to our employees for their continued commitment and dedication tobuilding an outstanding company.
Sincerely,
Jon E. KirchnerChairman & CEO

25JUL201117263719
UNITED STATESSECURITIES AND EXCHANGE COMMISSION
Washington, D.C. 20549
FORM 10-K� ANNUAL REPORT PURSUANT TO SECTION 13 OR 15(d) OF THE SECURITIES EXCHANGE
ACT OF 1934For the fiscal year ended December 31, 2013
OR
� TRANSITION REPORT PURSUANT TO SECTION 13 OR 15(d) OF THE SECURITIESEXCHANGE ACT OF 1934
For the transition period from to
Commission File Number 000-50335
DTS, Inc.(Exact name of Registrant as specified in its charter)
Delaware 77-0467655(State or Other Jurisdiction of (I.R.S. EmployerIncorporation or Organization) Identification Number)
5220 Las Virgenes RoadCalabasas, California 91302
(Address, including zip code, of Registrant’s principal executive offices)Registrant’s telephone number, including area code: (818) 436-1000
Securities registered pursuant to Section 12(b) of the Act:Title of each class Name of each exchange on which registered
Common Stock, $0.0001 par value NASDAQ Stock Market LLC
Securities registered pursuant to Section 12(g) of the Act:None
Indicate by check mark if the registrant is a well-known seasoned issuer, as defined in Rule 405 of the SecuritiesAct. Yes � No �
Indicate by check mark if the registrant is not required to file reports pursuant to Section 13 or Section 15(d) of theAct. Yes � No �
Indicate by check mark whether the registrant (1) has filed all reports required to be filed by Section 13 or 15(d) of the SecuritiesExchange Act of 1934 during the preceding 12 months (or for such shorter period that the registrant was required to file such reports),and (2) has been subject to such filing requirements for the past 90 days. Yes � No �
Indicate by check mark whether the registrant has submitted electronically and posted on its corporate Web site, if any, everyInteractive Data File required to be submitted and posted pursuant to Rule 405 of Regulation S-T (§232.405 of this chapter) during thepreceding 12 months (or for such shorter period that the registrant was required to submit and post such files). Yes � No �
Indicate by check mark if disclosure of delinquent filers pursuant to Item 405 of Regulation S-K is not contained herein, and willnot be contained, to the best of registrant’s knowledge, in definitive proxy or information statements incorporated by reference inPart III of this Form 10-K or any amendment to this Form 10-K. �
Indicate by check mark whether the registrant is a large accelerated filer, an accelerated filer, a non-accelerated filer, or a smallerreporting company. See the definitions of ‘‘large accelerated filer,’’ ‘‘accelerated filer,’’ and ‘‘smaller reporting company’’ in Rule 12b-2of the Exchange Act. (Check one):Large accelerated filer � Accelerated filer � Non-accelerated filer � Smaller reporting company �
(Do not check if asmaller reporting company)
Indicate by check mark whether the registrant is a shell company (as defined in Rule 12b-2 of the Exchange Act). Yes � No �The aggregate market value of the voting and non-voting common equity held by non-affiliates of the registrant, as of June 30,
2013 was approximately $186,812,830 (based upon the closing price of shares of the registrant’s Common Stock as reported on theNASDAQ Global Select Market for that date). Shares of Common Stock held by each officer and director have been excluded as suchpersons may be deemed affiliates. The determination of ‘‘affiliate’’ status for purposes of this report on Form 10-K shall not be deemeda determination as to whether an individual is an ‘‘affiliate’’ of the registrant for any other purposes.
As of March 7, 2014, 17,339,198 shares of common stock were outstanding.DOCUMENTS INCORPORATED BY REFERENCE
Portions of the registrant’s Definitive Proxy Statement to be filed with the Commission pursuant to Regulation 14A in connectionwith the registrant’s 2014 Annual Meeting of Stockholders, to be filed subsequent to the date hereof within 120 days of the registrant’sfiscal year ended December 31, 2013, are incorporated by reference into Part III of this Report, to the extent not set forth herein.

DTS, INC.FORM 10-K
For the Fiscal Year Ended December 31, 2013INDEX
Page
PART IItem 1. Business . . . . . . . . . . . . . . . . . . . . . . . . . . . . . . . . . . . . . . . . . . . . . . . . . . . . . . . . . 1Item 1A. Risk Factors . . . . . . . . . . . . . . . . . . . . . . . . . . . . . . . . . . . . . . . . . . . . . . . . . . . . . . 21Item 1B. Unresolved Staff Comments . . . . . . . . . . . . . . . . . . . . . . . . . . . . . . . . . . . . . . . . . . 38Item 2. Properties . . . . . . . . . . . . . . . . . . . . . . . . . . . . . . . . . . . . . . . . . . . . . . . . . . . . . . . . 38Item 3. Legal Proceedings . . . . . . . . . . . . . . . . . . . . . . . . . . . . . . . . . . . . . . . . . . . . . . . . . . 38Item 4. Mine Safety Disclosures . . . . . . . . . . . . . . . . . . . . . . . . . . . . . . . . . . . . . . . . . . . . . 38
PART IIItem 5. Market for Registrant’s Common Equity, Related Stockholder Matters and Issuer
Purchases of Equity Securities . . . . . . . . . . . . . . . . . . . . . . . . . . . . . . . . . . . . . . . 39Item 6. Selected Financial Data . . . . . . . . . . . . . . . . . . . . . . . . . . . . . . . . . . . . . . . . . . . . . . 42Item 7. Management’s Discussion and Analysis of Financial Condition and Results of
Operations . . . . . . . . . . . . . . . . . . . . . . . . . . . . . . . . . . . . . . . . . . . . . . . . . . . . . 45Item 7A. Quantitative and Qualitative Disclosures About Market Risk . . . . . . . . . . . . . . . . . . . 58Item 8. Financial Statements and Supplementary Data . . . . . . . . . . . . . . . . . . . . . . . . . . . . . 59Item 9. Changes in and Disagreements with Accountants on Accounting and Financial
Disclosure . . . . . . . . . . . . . . . . . . . . . . . . . . . . . . . . . . . . . . . . . . . . . . . . . . . . . . 101Item 9A. Controls and Procedures . . . . . . . . . . . . . . . . . . . . . . . . . . . . . . . . . . . . . . . . . . . . . 101Item 9B. Other Information . . . . . . . . . . . . . . . . . . . . . . . . . . . . . . . . . . . . . . . . . . . . . . . . . 102
PART IIIItem 10. Directors, Executive Officers and Corporate Governance . . . . . . . . . . . . . . . . . . . . . . 103Item 11. Executive Compensation . . . . . . . . . . . . . . . . . . . . . . . . . . . . . . . . . . . . . . . . . . . . . 103Item 12. Security Ownership of Certain Beneficial Owners and Management and Related
Stockholder Matters . . . . . . . . . . . . . . . . . . . . . . . . . . . . . . . . . . . . . . . . . . . . . . 103Item 13. Certain Relationships and Related Transactions, and Director Independence . . . . . . . 103Item 14. Principal Accounting Fees and Services . . . . . . . . . . . . . . . . . . . . . . . . . . . . . . . . . . 103
PART IVItem 15. Exhibits and Financial Statement Schedules . . . . . . . . . . . . . . . . . . . . . . . . . . . . . . . 104SIGNATURES . . . . . . . . . . . . . . . . . . . . . . . . . . . . . . . . . . . . . . . . . . . . . . . . . . . . . . . . . . . . 105

FORWARD-LOOKING STATEMENTS
This Annual Report on Form 10-K (including, but not limited to, the section titled ‘‘Management’sDiscussion and Analysis of Financial Condition and Results of Operations’’) and the documentsincorporated herein by reference contain forward-looking statements within the meaning of Section 27A ofthe Securities Act of 1933, as amended, and Section 21E of the Securities Exchange Act of 1934, asamended (‘‘Exchange Act’’). Words such as ‘‘believes,’’ ‘‘anticipates,’’ ‘‘estimates,’’ ‘‘expects,’’ ‘‘intends,’’‘‘projections,’’ ‘‘may,’’ ‘‘can,’’ ‘‘will,’’ ‘‘should,’’ ‘‘potential,’’ ‘‘plans,’’ ‘‘continues’’ and similar expressions areintended to identify those assertions as forward-looking statements, but are not the exclusive means ofidentifying forward-looking statements in this report. All statements, other than statements of historical fact,are statements that could be deemed forward-looking statements, including, but not limited to, statementsregarding our future financial performance or position, future economic conditions, our business strategy,plans or expectations, our future effective tax rates, and our objectives for future operations, includingrelating to our products and services. Although forward-looking statements in this report reflect our goodfaith judgment, such statements are based on facts and factors currently known by us. We caution readersthat forward-looking statements are not guarantees of future performance and our actual results andoutcomes may be materially different from those expressed or implied by the forward-looking statements.Important factors that could cause or contribute to such differences in results and outcomes include,without limitation, those discussed under the ‘‘Risk Factors’’ section contained in Part I, Item 1A below inthis Annual Report on Form 10-K and in other documents we file with the Securities and ExchangeCommission (‘‘SEC’’). Readers are urged not to place undue reliance on these forward-looking statements,which speak only as of the date of this report. We undertake no obligation to revise or update these forward-looking statements to reflect future events or circumstances, unless otherwise required by law.
PART I
References to ‘‘we,’’ ‘‘us’’ and ‘‘our’’ refer to DTS, Inc. and its consolidated subsidiaries.
Item 1. Business
Company Overview
We are a premier audio solutions provider for high-definition entertainment experiences—anytime,anywhere, on any device. We exist to make the world sound better. Our audio solutions are designed toenable recording, delivery and playback of simple, personalized, and immersive high-definition audioand are incorporated by hundreds of licensee customers around the world into an array of consumerelectronics devices, including televisions (‘‘TVs’’), personal computers (‘‘PCs’’), smartphones, tablets,digital media players, video game consoles, Blu-ray Disc players, audio/video receivers (‘‘AVRs’’),soundbars, DVD based products, automotive audio systems, set-top-boxes (‘‘STBs’’), and home theatersystems.
1
25MAR201405562716
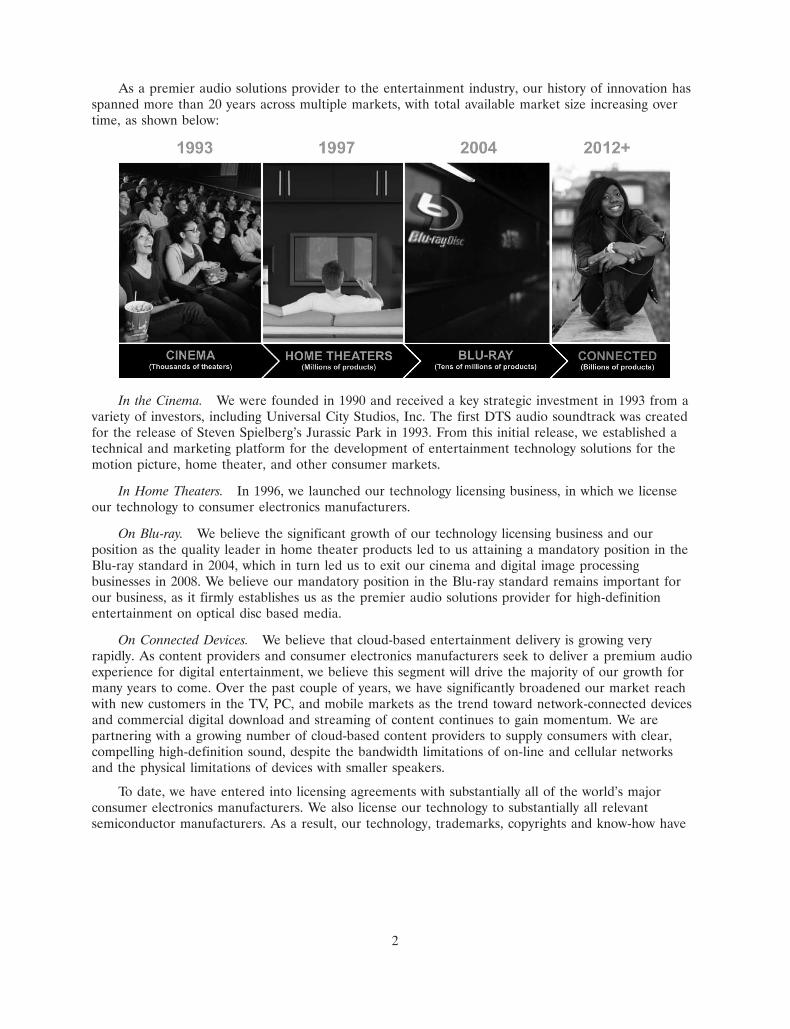
As a premier audio solutions provider to the entertainment industry, our history of innovation hasspanned more than 20 years across multiple markets, with total available market size increasing overtime, as shown below:
In the Cinema. We were founded in 1990 and received a key strategic investment in 1993 from avariety of investors, including Universal City Studios, Inc. The first DTS audio soundtrack was createdfor the release of Steven Spielberg’s Jurassic Park in 1993. From this initial release, we established atechnical and marketing platform for the development of entertainment technology solutions for themotion picture, home theater, and other consumer markets.
In Home Theaters. In 1996, we launched our technology licensing business, in which we licenseour technology to consumer electronics manufacturers.
On Blu-ray. We believe the significant growth of our technology licensing business and ourposition as the quality leader in home theater products led to us attaining a mandatory position in theBlu-ray standard in 2004, which in turn led us to exit our cinema and digital image processingbusinesses in 2008. We believe our mandatory position in the Blu-ray standard remains important forour business, as it firmly establishes us as the premier audio solutions provider for high-definitionentertainment on optical disc based media.
On Connected Devices. We believe that cloud-based entertainment delivery is growing veryrapidly. As content providers and consumer electronics manufacturers seek to deliver a premium audioexperience for digital entertainment, we believe this segment will drive the majority of our growth formany years to come. Over the past couple of years, we have significantly broadened our market reachwith new customers in the TV, PC, and mobile markets as the trend toward network-connected devicesand commercial digital download and streaming of content continues to gain momentum. We arepartnering with a growing number of cloud-based content providers to supply consumers with clear,compelling high-definition sound, despite the bandwidth limitations of on-line and cellular networksand the physical limitations of devices with smaller speakers.
To date, we have entered into licensing agreements with substantially all of the world’s majorconsumer electronics manufacturers. We also license our technology to substantially all relevantsemiconductor manufacturers. As a result, our technology, trademarks, copyrights and know-how have
2

25MAR201405562914
been incorporated into billions of consumer electronics products worldwide, and we have deeplypenetrated many consumer electronics markets, as shown below:
Sound, long known to be a powerful driver of people’s emotional connection with movies, musicand games, is emerging as an important product differentiator for a rapidly growing range of consumerelectronics devices, especially mobile or portable small screen devices, as consumers are using thesedevices to watch and listen to more entertainment than ever before. After years of focus on videoquality and usability features, industry professionals and consumers alike are realizing that sound is thenext frontier in the technical advancement of the high-definition entertainment experience. Simply put,sound changes the way we see.
We believe that sound matters and that we have industry leading end-to-end audio solutionsdesigned to enhance the entertainment experience for users of consumer electronics devices,particularly those subject to the physical limitations of smaller speakers, such as TVs, PCs and mobiledevices. Additionally, we provide products and services to motion picture studios, radio and TVbroadcasters, game developers and other content creators to facilitate the inclusion of compelling,realistic DTS-encoded soundtracks within their content.
We are dedicated to making the world sound better, one device at a time—no matter where youare or where you are going. Our goal is to be an essential ingredient in engaging, dynamic and realisticentertainment experiences by incorporating our technology into every connected device that plays ordelivers high-definition entertainment.
3

Industry Background
Over the past 20 years, the entertainment industry has shifted to take advantage of many technicaltrends and innovations, including the transition from analog to digital content, growth in broadbandspeed and subscriber base, an increase in the types of devices supporting content playback, and thetransition from physical media to network delivery via streaming and downloading. The mobilization ofcontent consumption allows for entertainment on the go—anytime, anywhere, on any device.
High-Definition Home Theater and Blu-Ray
Consumer demand for high-definition home theater systems has been fueled by consumers’ desireto experience exciting, high-definition entertainment in their homes, the mainstream affordability ofhome theater equipment, and the widespread availability of high-definition content. As consumers’demand for high-definition entertainment grew, beginning in 2004, Blu-ray emerged as the newest formof optical disc based media. Given our mandatory position in this standard, Blu-ray Disc players,including stand-alone players and game consoles, continue to be an important contribution to ourrevenues. According to Nielsen, a market research company, 85% of the top 100 titles sold in 2013,including nine out of the top ten movies in 2013, were encoded with DTS-HD Master Audio�. Today,through the inclusion of our technology in AVRs and Blu-ray, we have nearly 100% penetration inthese markets.
Almost all Blu-ray Disc players and game consoles are now network-enabled and a growingnumber are being utilized to download or stream media. Our dominant position in Blu-ray establishesDTS as ‘‘the’’ high-definition audio format, and we expect this premium market position to be animportant factor as content distributors expand to include higher quality choices in their cloud-basedofferings.
Network and Cloud-Based Content
Movie and music content was historically purchased and consumed primarily via optical disc basedmedia, such as Blu-ray Disc, DVD, and CD. With the growth of PC and mobile usage over the lastdecade, a shift to network and cloud-based content acquisition continues to occur, including the trendtoward full movie and music downloading and streaming services. Growth in the usage of network andcloud-based services will depend on integration partnerships within the ecosystem, further developmentsin content delivery methods and the ability to provide consumers with a high-definition experience onthinner, smaller devices and across multiple screens.
Content Delivery Ecosystem
Adding advanced audio technologies to an existing or new content delivery system requiresmultifaceted back-end integrations across numerous technology partners. Unlike the optical disc basedmedia distribution business, where only a few parties are involved in the replication and distribution ofa disc, the digital content delivery ecosystem can be vast—involving dozens of interrelationships forgetting the entertainment content from the creator to the ultimate consumer. We have spent yearsdeveloping relationships throughout the ecosystem, and we believe we are now well positioned with
4

25MAR201405563483
relevant industry partners to make DTS-encoded, high-definition content more readily available. Theillustration below shows a sample integration:
Responding to consumer demand, consumer electronics products beyond the traditional PC, suchas TVs, Blu-ray Disc players, game consoles and mobile devices, may now include network-capablefeatures to support the shift to cloud-based content delivery. This adoption of network support inmainstream consumer electronics products has triggered consumer demand for the enjoyment ofcontent in multiple formats, on multiple devices and in multiple locations. This requirement for broadcontent portability and accessibility has opened up many large, new markets to new media formats,such as high-definition audio, that had not been previously supported. The fundamental structure of thecontent ecosystem has now changed to focus not only on accessibility and ease-of-use, but also withhigher quality audio and video. This change significantly expands the market for digital media formattechnologies, such as those provided by DTS. According to DisplaySearch, in 2013 more than 34% offlat-panel TVs shipped worldwide were network-capable, a figure that is expected to rise to 46% by2017. We estimate that approximately 60% of these connected TVs included our technology in 2013.
As the transition to digital content delivery accelerates, we continue to pursue strategicpartnerships with top streaming technology companies to integrate DTS technologies into content to beavailable on as many connected devices as possible, thereby enabling growth in our licensing
5

opportunities. For example, in 2012, we joined forces with Deluxe Digital Distribution to expand ourpresence in cloud-based content.
Hollywood studios continue to explore new digital delivery methods to reach consumers with high-quality home entertainment. Currently, UltraVioletTM is the latest method for digital delivery ofentertainment content, and, since its launch in 2011, Blu-ray Disc has been the primary entry point toauthenticate access to UltraViolet. UltraViolet allows consumers to register their Blu-ray Disc moviesor content to a personal UltraViolet digital locker in the cloud, and then they can access that contenton virtually any playback device. By the end of 2013, UltraViolet household accounts have grown tomore than 15 million accounts, compared to 9 million at the end of 2012.
In response to this growing demand and in conjunction with ecosystem partners such as DigitalRapids, Elemental and Manzanita, we launched new tool offerings to support the UltraViolet standard.These tools serve the standard’s goal to combine the benefits of cloud access with the power of anopen, industry standard—empowering consumers to use multiple content services and device brandsinterchangeably, at home and on-the-go. In 2013, we entered into an agreement with ParamountPictures where the DTS-HD codec was selected as a surround sound format for its UltraViolet catalogof movies that are paired with immersive DTS soundtracks, allowing consumers to take full advantageof the benefits of cloud-based access.
Also, starting in 2013 Best Buy’s CinemaNow is now pairing their movie and TV show librarieswith powerful DTS-HD surround sound. We have enabled support across leading DRM platforms suchas Microsoft Smooth Streaming and Google Widevine. This integration of our technology gives majorstudios and retailers turn-key access to digitally distributed content with unparalleled audio quality. Todate, our premium audio technologies have been integrated into thousands of titles, and we are activelypursuing other partnerships to expand the integration of our premium audio technologies intostreaming content.
More recently, we have joined the Secure Content Storage Association (‘‘SCSA’’), a group ofcompanies working to create storage and transfer solutions for high-definition and premium copyright-protected content on hard drives, flash memory products and solid state drives. SCSA’s mission is toincrease market opportunities for content owners, content distributors and high-end devicemanufacturers by delivering a secure solution that allows consumers to enjoy the highest-qualityentertainment content across multiple devices.
We remain an active participant in industry forums defining emerging standards such asUltraViolet and SCSA to ensure that our content partners and consumer electronics licensees know wewill continue to be a leading format for high-quality audio entertainment.
Thinner, Smaller Devices and Portability
In this age of convenience, devices such as TVs, PCs and mobile electronics, are becoming thinner,smaller and more portable than previous models, but as a result, sound quality is commonly sacrificeddue to physical limitations. While the smaller, sleeker forms of these devices meet the demand for styleor portability, consumers still believe that sound matters, and they demand a higher quality audioexperience from these sophisticated devices. We believe that we possess one of the industry’s broadestrange of audio technology solutions to enhance the entertainment experience for users of these thinner,smaller and more portable devices.
Audio processing technologies allow listeners to enjoy a high-definition audio experience on anumber of consumer electronics devices that are limited to only two speakers or headphones. Theseaudio technologies represent significant growth opportunities as content providers and consumersbecome more familiar with the capability of high-definition audio on these devices to enhance theentertainment experience.
6

The introduction of our Headphone:X� technology in 2013 dramatically raised the bar forimmersive, realistic high-definition audio from the vast array of portable or mobile playback devices,such as smartphones, tablets, and PCs, or from any device where consumers may choose to enjoy theirmovies, music and games through their favorite headphones or ear buds.
Multi-Screen Playback
In addition to demanding high-quality audio on thinner or smaller devices, consumer demand formulti-screen playback of content is also increasing. With the growth in cloud-based services, consumersare increasingly able to purchase content one time and play back this content on multiple devices.From our success in Blu-ray, we are recognized as a premier audio solutions provider forhigh-definition entertainment, and as cloud-based service providers look to expand and differentiatetheir media offerings to multi-screen platforms, such as tablets and smartphones, we are in the uniqueposition of being able to help them deliver high-quality content and new entertainment experiences toconsumers across multiple devices.
Wireless Audio Playback
Another area with increasing consumer demand is the wireless audio market, which is being drivenby two major growth engines: consumer adoption of smart mobile devices (phones and tablets) and theincreasing usage of those devices as entertainment consumption platforms, particularly for streamingaudio and video content. With the growing base of on-line streaming music services and subscriptions,wireless speakers are becoming one of the fastest growing new categories in the consumer electronicsspace. Launched in 2013, our Play-Fi� solution sits squarely at the intersection of these highlycompelling market trends. This wireless streaming technology allows wi-fi enabled sources, such as PCs,smartphones, and tablets, to stream to Play-Fi enabled products, such as TVs, AVRs, Home Theatersin a Box (‘‘HTiBs’’), soundbars, and other speakers.
In summary, the proliferation of connected devices and cloud-based content distribution representssignificant opportunities for the deployment of our solutions to deliver high-definition entertainment.
DTS Solutions
At DTS, we combine various technologies and capabilities into what we call ‘‘solutions,’’ eachdesigned to address the needs of a particular product, market, or consumer use case. Our portfolio ofadvanced audio solutions addresses a broad spectrum of product applications within the markets thatwe have targeted. Our solutions typically combine several technologies, frequently including both codecand audio processing capabilities, to deliver a comprehensive, easy to deploy package for theenhancement of a product’s audio performance. Through the combination of leading edge audio codecsand an unsurpassed portfolio of audio processing technologies, we are uniquely positioned to fulfill ourvision of making the world sound better.
Further, with the launch of our Headphone:X technology, we have added the ability formanufacturers and consumers to tune or personalize their products for an optimal audio experience.For example, products manufacturers can use this capability to create a unique, signature sound fortheir products, such as speakers, soundbars, or headphones. Similarly, consumers can use ourHeadphone:X personalization technology to enhance the audio output of a device based on their ownhearing characteristics and preferences, thereby creating a truly unique and unparalleled listeningexperience.
We have a complete range of audio solutions—from ingest, through distribution and ontoplayback—and we continue to expand through ongoing research and development, targetedacquisitions, as well as strategic partnerships with consumer electronics manufacturers, contentproviders, and others within the digital media ecosystem.
7

25MAR201406211244
25MAR201406204478
25MAR201406210547
25MAR201406205605
25MAR201406212008
25MAR201406220253
Our solutions are tailored specifically for each market and may include the following:
Across all markets, this solution is a tailored,entry level suite of components from both ourspatial processing and loudness and dynamicsportfolio of products that provides a valueoffering to our customers.
Across all markets, this solution is our premiumoffering that includes a number of our latestfeatures. Our customers can use this suite tocreate the ultimate in sound quality.
Across all markets, this solution couples our DTSSound� or DTS Studio Sound� offerings withour DTS-HD surround sound decoder to providethe best in class solutions to the consumerelectronics industry and consumers alike.
Our DTS Headphone:X solution includes ourintegrated surround headphone technologycoupled with DTS-HD surround sound decoder,with user-driven headphone specific tuning andpersonalization features along with loudnessleveling and speaker correction for output overheadphones, speakers, soundbars, etc.
Our Play-Fi solution allows the synchronizedstreaming of music directly from a mobile deviceover a standard wi-fi network to anywhere in thehome. Play-Fi is currently available for mobiledevices that utilize the Android, Kindle Fire oriOS operating systems, as well as the Windows PCplatform. Play-Fi enabled speakers and receiversare now shipping and are available on-line and atselect retailers.
DTS-UHD� is our first object-based audioformat designed for consumer delivery, bringingenhanced realism through more accurate spatialrendering, height audio elements, andcustomizations that adapt to any speaker layout.In addition, DTS-UHD supports compatibility forplayback of DTS channel based content.
DTS Headphone:X—A Home Theater in Your Pocket
The rapid growth in usage of smartphones, tablets, portable computers and gaming devices forentertainment consumption has led to significant growth in the use of headphones by consumers. InJanuary 2013, we first announced and demonstrated the industry’s leading headphone technology: DTSHeadphone:X, which allows mobile devices to turn an ordinary pair of headphones into an impressivepersonal surround sound system—effectively turning one’s device into a ‘‘Home Theater in YourPocket.’’
8

Headphone:X faithfully reproduces the home theater surround sound experience through a simplepair of headphones or ear buds. The technology externalizes sound, so instead of the listener hearingthe sound inside their heads, as is typical for traditional headphone listening, they perceive it as comingfrom high-quality speakers located some distance around them. Moreover, this experience can beachieved through one’s favorite pair of headphones, as the technology is typically embedded in theplayback device rather than in the headphones themselves.
DTS Headphone:X allows movies, music and games to sound exactly the way the creator intended.This technology allows the user to experience the full 11.1 channel surround sound of a movie theaterfrom a tablet, smartphone or other device without the need for a multi-speaker set-up. Artists can nowrecord audio tracks in Headphone:X that capture the acoustics of a high-quality audio productionstudio, providing an entirely new way to experience mobile entertainment.
We all hear differently and our ears have different physical characteristics that affect how weexperience content. Headphone:X provides consumers with a way to personalize their listeningexperience and enables them to simply create and store a personal ‘‘sonic profile,’’ which then enhancesthe playback of all content on the device, for both headphone and speaker playback.
DTS Headphone:X provides the following features:
• Recreates an authentic, spatially accurate 3D home theater experience over one’s favoriteheadphones or ear buds
• Supports 2, 5.1, 7.1 and 11.1 channel audio
• Includes an audio personalization application to optimize each consumer’s listening experience
• Out-of-the-box calibration for a range of headphones and ear buds through partnerships withleading headphone manufacturers
• Post processing enhancements and device level tuning for headphone and speaker drivers
• The device solution for Headphone:X contains both application and system level audioprocessing to enhance the playback of all content on the device, for both headphone andspeaker playback
• Tightly integrated with DTS-HD and DTS-HD Master Audio
Simply put, DTS Headphone:X dramatically improves the mobile entertainment experience.
DTS Play-Fi—Wireless Streaming Technology
Mobile devices are becoming an essential ingredient in the playback and enjoyment of music,thanks to ease of use and a nearly unlimited variety of music streaming options. With Play-Fi, we areenabling consumers to build on their mobile headphone experience and connect to the high-qualityaudio systems in their home. Historically, making the connection between mobile and whole-homeentertainment has been challenging, due to physical connections, cables, and less-than-idealpoint-to-point streaming that has limited consumer enjoyment and expectations for what the homeaudio experience should be.
Our Play-Fi solution enables the synchronized streaming of music directly from a mobile deviceover a standard wi-fi network to anywhere in the home. Play-Fi leverages wi-fi’s extensive range andcapacity to stream audio with bit-for-bit accuracy for a higher quality audio experience. This solutionallows the consumer to play music uninterrupted without the various alerts that plague Bluetooth audioplayback, yet still being able to use the mobile device for calls, text messages, internet, etc. In addition,Play-Fi allows for multi-room, multi-source audio synchronization, again utilizing standard wi-ficapabilities that are built into most mobile devices and an increasing number of homes. With two or
9

25MAR201405563090
more Play-Fi enabled-speakers in a home, a consumer has the option to play different content indifferent rooms or the same content throughout the house.
Currently, Play-Fi is available for mobile devices that utilize the Android, Kindle Fire or iOSoperating systems, and it is also available for the Windows PC platform. Additionally, this solution willbe licensed to customers in the Home AV, Mobile and PC markets. We are shipping Play-Fi enabledspeakers and receivers under our own Phorus brand, which are available on-line and at select retailers.
In 2013, Play-Fi emerged as a leading open platform for wireless audio distribution over wi-fi withCore Brands, Wren, and more recently, Sound United, announcing products incorporating Play-Fitechnology. We also recently announced the expansion of the Play-Fi ecosystem to include a Play-Ficertified original design manufacturer (‘‘ODM’’) program. Program participants represent leading audiomanufacturers including Eastech Electronics Inc., Fenda Technology Co., Ltd., LiteOn TechnologyCorporation, Meiloon Industrial Co. Ltd., Solidex Audio Corporation, Tymphany Corporation, WistronCorporation, and Zylux Acoustic Corp. This makes Play-Fi a truly open turn-key solution for anyconsumer electronics customer who wants to address wi-fi based audio streaming, one of the fastestgrowing market segments in home electronics.
Also in 2013, we announced broad content support for Play-Fi from partners such as Pandora,Songza, QQMusic, KKBox and other internet radio stations.
Taken together, Headphone:X and Play-Fi are designed to make a uniquely compelling use casefor the modern connected lifestyle. Today’s consumers frequently listen to their favorite music serviceson mobile devices through a favorite pair of headphones, and when they get home, they typically wantto remove the headphones and listen to their music out loud. With our Headphone:X and Play-Fi,consumers can walk into their house, disconnect their headphones, and seamlessly send their audioentertainment throughout the home wirelessly over the existing wi-fi network. We believe this is howconsumers want to enjoy their entertainment today, and our technologies represent integrated solutionscapable of providing this end-to-end capability.
DTS-UHD—Object-Based Audio
Looking beyond today’s channel-based audio paradigm is DTS-UHD, our first open object-basedaudio format designed for consumer delivery. The DTS-UHD audio decoder enables soundbar, HTiBand AVR manufacturers to bring the advanced features of object-based audio to the consumer market.
10
There is an interest in the audio technology industry in shifting away from channel-based audio toobject-based audio, also referred to as ‘‘3D Audio’’ or ‘‘Immersive Audio’’. This shift begins at the timeof creation of an audio mix where the artist no longer specifies what mix of sounds comes from eachspeaker, but tells the system where, in space, each sound should come from regardless of speakerpositions. When this object-based audio is played back, it is rendered in space as the artist hadintended.
Object-based audio brings enhanced realism through more accurate spatial rendering, height audioelements, and customizations that adapt to any speaker layout. In addition to rendering object-basedaudio content, DTS-UHD supports complete compatibility for playback of DTS channel based content,providing the best audio experience from any content featuring DTS audio coding.
The benefits of DTS-UHD include:
• Environmentally compensated audio rendering allows consumers to hear audio directionality anddimensionality with more precision than ever before
• Object control enables consumers to interact with key objects within the audio mix and adjustthem to preference
• Customized rendering designed for arbitrary speaker layouts enables consumers to adapt theirAV system to their own home environment rather than pre-determined speaker layouts
In summary, we have a complete range of advanced audio solutions, including leading edge audiocodecs, audio processing technologies, industry leading wireless speaker playback technology, andforward-thinking object-based audio. Our advanced audio solutions are specifically engineered to meetthe unique needs of the markets we support, and we believe that our unsurpassed, industry-leadingportfolio of solutions uniquely positions us to drive substantial growth going forward.
Key Markets and Strategies
Network-Connected
The network-connected markets category has become the largest area of our business and includesconsumer electronics devices that are network-capable, mainly TVs, smartphones, tablets, and PCs.Consumers are increasingly seeking superior audio quality across all of their devices.
In 2013, several key digital content partners announced support for DTS audio to furtherstrengthen this strategy. CinemaNow, a digital movie rental and retail platform for Best Buy, launchedtheir HD movie and TV show libraries with DTS-HD surround sound. Furthermore, ParamountPictures announced that the launch of their movie catalog for UltraViolet will include broad supportfor DTS-HD audio.
Connected Home. One of our strongest positions in the connected home space is in the connectedTV market. Our key strategy in the connected TV market is joining forces with leading consumerelectronics manufacturers like Samsung, LG, Sony, Toshiba, and Panasonic, allowing us to play a moresignificant role in the connected home entertainment market and further ensuring consumer access tohigh-quality audio when enjoying entertainment content at home. We have partnerships with nearlyevery TV manufacturer worldwide, including all of the top 15 brands, and our DTS codec isincorporated into all of the top 10 TV original equipment manufacturers (‘‘OEMs’’).
In the game console space, two new game consoles came to market in late 2013—Sony’sPlaystation 4 and Microsoft’s Xbox One—both of which not only include Blu-ray drives, but alsosupport DTS-HD Master Audio as an audio format for playback of streamed high-quality audioentertainment.
11
Mobile Electronics. The mobile electronics market is the largest single consumer electronics devicemarket in the world in terms of unit volume, and we are currently focused primarily on the high-valuesmartphone and tablet sub-segments of the mobile market.
In years past, mobile products manufacturers had only a few entertainment services to offer theircustomers over known and predictable networks. However, the explosion of media services, networktopographies and device capabilities has caused the range of audio technologies needed by our partnersto increase, and we have helped to simplify their businesses by offering simple, scalable solutions tomeet their needs.
As smartphones continue to evolve into more feature-rich and sophisticated devices, consumers areseeking the same sound quality that they are accustomed to from their home theater or automobile.We believe that sound matters across all of these platforms; for example, with the integration of DTSSound and DTS StudioSound into a smartphone, customers can receive uncompromising sound at theirfingertips, redefining how they use and interact with their mobile devices. Moreover, with our morerecent DTS Headphone:X technology, customers can receive this same high-quality sound even whenusing a pair of headphones on their mobile devices. Importantly, mobile products manufacturers arebeginning to realize that sound, and thus our audio solutions, can be a powerful differentiator for theirproducts.
Today’s consumers increasingly expect high-quality sound in all of their electronics, includingsmartphones. Partnering with key manufacturers, such as LG, Huawei, and more recently Sharp, ZTEand vivo, as well as mobile service providers, such as Nextreaming and Saffron Digital, allows us theopportunity to improve the mobile audio experience through our audio solutions, which is our keystrategy. Notable accomplishments in 2013 within the mobile market include:
• expanding our relationship with Huawei to include DTS Sound within select Huawei smartphonemodels; and
• the integration of DTS-HD into ZTE’s new nubia branded smartphones, to decodehigh-definition audio for watching videos, listening to music, gaming or streaming content.
As the use of headphones and the demand for immersive high-definition audio continues to grow,we have expanded the reach of our DTS Headphone:X technology by:
• working with Hans Zimmer to compose the Man of Steel, Rush, and Winter’s Tale originalmotion picture soundtracks featuring a DTS Headphone:X audio mix allowing listeners to hearthe score precisely as Zimmer intended it to sound;
• incorporating Headphone:X technology within select models of media headsets from TurtleBeach which marked one of the first products to be designed featuring the highly anticipatedtechnology;
• collaborating with premium Chinese smartphone brand, vivo, to bring to market the firstsmartphones featuring DTS Headphone:X and 2K resolution video, which gives thesesmartphones currently the highest combined audio and video quality in the world; and
• introducing the Headphone:X Tuning Program, which offers leading headphone manufacturersaccess to tools and support designed to optimize the DTS Headphone:X experience acrossproduct lines. Leading headphone manufacturers, including Skullcandy, Inc., PanasonicCorporation, and Republic of Friends, have joined the Headphone:X Tuning Program.
We are continuing to pursue relationships to further expand the presence of our Headphone:Xtechnologies in the mobile space.
12

Wireless Audio. In the wireless audio space, over the past year we have expanded the presence ofour Play-Fi technology by:
• working with leading music subscription services, including Pandora, Songza, QQ Music, andKKBOX to integrate the subscription services into our Play-Fi app;
• releasing the Play-Fi app for iOS through the iTunes App Store;
• expanding availability of our Phorus brand Play-Fi enabled speakers and receivers throughnational distribution with Radio Shack;
• partnering with Core Brands and Sound United to incorporate Play-Fi technology into theirhigh-performance speaker product lines;
• partnering with vivo, a premium Chinese smartphone brand, to support the Play-Fi platform onthe vivo mobile product line; and
• expanding our Play-Fi ecosystem to include a Play-Fi Certified ODM Program, which includesseveral leading audio manufacturers including Eastech Electronics Inc., FendaTechnology Co., Ltd., LiteOn Technology Corporation, Meiloon Industrial Co. Ltd., SolidexAudio Corporation, Tymphany Corporation, Wistron Corporation, and Zylux Acoustic Corp.
Play-Fi enabled products from additional customers are expected to launch in 2014.
PCs. The PC market, composed of notebooks, ultrabooks, laptops, desktops, and all-in-one PCs islarge, with laptops and notebooks leading the way. Consumers continue to use PCs as multi-mediahubs, including Blu-ray Disc drives for high-definition playback, and our solutions are now found inmajor software media players from vendors such as CyberLink and sMedio. Additionally, with our DTSencoder, consumers can encode their own content into the DTS format and enjoy playback on DTSenabled devices.
The PC market, like the smartphone and tablet markets, is facing shrinking device sizes anddecreasing margins. As a result, it is increasingly turning to audio processing to augment devicecapabilities. At the same time, the demands of consumers for PCs with improved audio for applicationssuch as movies, music and games continues to rise, creating an increasing demand for advanced audiotechnologies. We address these demands with solutions tailored to meet both ends of an OEM’sproduct lines. With DTS Sound and DTS StudioSound, we are meeting the needs of major OEMs, suchas HP, Toshiba, ASUS, Fujitsu and Samsung. In 2013 we announced the incorporation of DTS StudioSound into Toshiba’s all-new KIRAbook� premium Ultrabook� enabling the delivery of impressive,high-performance audio right out of the box. Now, consumers can hear the best possible audio,whether they are watching TV, surfing the web or playing games on their PC.
As PC manufacturers continue to adopt our solutions across various platforms ranging frommotherboards to all-in-ones (AIOs), and from to notebooks to ultrabooks, there are growingopportunities for us to help these manufacturers differentiate and improve audio experiences on theirthinner, smaller and lighter platforms which are in demand by today’s consumers.
In summary, as connected devices play a more versatile role in the household, consumers arebecoming increasingly aware that sound matters. The integration of our solutions into a growingnumber of TVs, mobile devices and PCs further reinforces our commitment to providing manufacturersa means to deliver an immersive, realistic sound experience regardless of the platform.
Blu-ray
The Blu-ray market includes standalone players, gaming devices and disc drives included in PCs.As a mandated technology in the Blu-ray standard, our codec is in every product that incorporates aBlu-ray optical disc drive. As such, Blu-ray remains an important contributor to our revenues, and we
13

still expect to see some growth in this market primarily driven by the new gaming cycle launched bySony and Microsoft in late 2013. Almost all newly manufactured Blu-ray Disc players are now network-enabled, and a number of models are 3D-capable. We believe our dominant position on Blu-ray Disccontent establishes us as the premier audio format for high-definition entertainment and is expected todrive future growth as the industry transitions to network-based high-definition content delivery.
Home AV
The Home AV market includes AVRs, soundbars, DVD players and other DVD-based equipmentthat facilitate the home theater experience. The Home AV market continues to represent an importantrevenue base, and it continues to present opportunities for growth for our high-definition soundtechnologies. While DVD is on the decline, soundbars are now our focus for growth within the HomeAV market.
Automotive
The automotive market is comprised of infotainment systems, which may include networkconnectivity. New vehicle production has grown from 82 million units in 2012 to 84 million units in2013 and 88 million units expected in 2014, and a growing percentage of consumers are purchasing newautomobiles equipped with infotainment systems. As the trend toward network connectivity transitionsinto the automotive market, there is opportunity for us to benefit from the increase in demand for oursolutions beyond optical disc based infotainment systems. The growing prevalence of using mobileconsumer electronics for hosting personal music and movie libraries has prompted automobilemanufacturers to enhance their vehicles by allowing mobile devices to interact with automotiveinfotainment systems.
Our key strategy in the automotive market has always been the collaboration with automobilemanufacturers and their audio systems suppliers to use and incorporate our audio solutions at thefactory level. We are seeing an increase in the amount of automobile manufacturers who are offeringthe option of ordering factory installed Blu-ray Disc players into the rear of their vehicles for passengerenjoyment. For example, Toyota, Chrysler and GM all have Blu-ray Disc systems available in theirmodels. Since we have a mandatory position in the Blu-ray market, we believe that this will furtherexpand the use of our solutions within the automotive market, offering us an increasing opportunity toenhance the integration of mobile devices into any vehicle by enabling seamless conversion betweenstereo and surround sound audio for the ultimate high-definition experience.
Recently, we announced a partnership with Aupeo, a German internet radio service company, tocreate the first streaming audio platform capable of streaming music in DTS-HD surround sound,allowing consumers to receive immersive high-quality audio on their cars’ premium sound systems. Wecontinue to collaborate with other automobile manufacturers, including many luxury brands, such asCadillac, Lincoln, Acura, BMW, and Audi, to incorporate our audio solutions into certain models.
Broadcast/OTT
The broadcast market, including over-the-top (‘‘OTT’’) services, is generally comprised ofbroadcast hardware and STBs, which bring digital and high-definition broadcasts into households. Thecomprehensive migration of national broadcasters to digital transmission, combined with growinginterest in high-definition broadcast around the world has set the stage for increased demand for STBsand high-definition TVs over the next few years.
Our key strategy in the broadcast market is to actively work with broadcasters, operators,international standards organizations and STB manufacturers to expand the penetration of oursolutions to help them meet the increasing demand for high-definition audio delivery. Since 2009, ourDTS Neural Surround� technology has been integrated into the National Football League’s
14

international HD broadcast of the Super Bowl, providing TV viewers across the globe the opportunityto experience the game in full 5.1 surround sound. Also, we continue to maintain the followingalliances:
• Bouygues Telecom, a leading French telecom company, where we are providing advanced audiosolutions for their video on demand (‘‘VOD’’) service, Bbox VOD, delivering to consumers theultimate VOD entertainment experience.
• Chinese FM radio broadcasters to deliver DTS 5.1 content. By incorporating DTS Neural Soundtechnology, which has been widely embraced in the United States (‘‘U.S.’’) for live sports andHD radio broadcasts, this makes Guangzhou Broadcasting Network (GZBN) and Anhui FM thefirst radio stations to offer surround sound radio broadcasts in China.
Production Tools
Production tools are critical to the deployment of DTS-enabled content. The availability ofDTS-enabled content drives consumer demand for electronics that support DTS technologies. Forexample, all major North American motion picture studios use the DTS-HD Master Audio Suite, asoftware production tool that has allowed DTS to secure the primary audio tracks on the majority ofBlu-ray Disc titles, driving increased royalties from the adoption of 5.1 and 7.1 multi-channel DTSdecoders. As content delivery has moved beyond optical disc based media, we have broadened theproduction tools customers that we target. In addition to traditional motion picture studios,post-production houses and authoring facilities, this market now includes on-line services and broadcastfacilities.
With ongoing growth in cloud-based content delivery, we have maintained a strategy focused onincreasing DTS support among streaming solutions and tools providers within this ecosystem to enableour audio technologies in network-connected devices. Connected devices with varying content deliveryrequirements necessitate production tools capable of delivering high volumes of digital content files inmultiple formats. Our production tools include multiplexers, transcoders and automated quality controltools, an area in which we have made significant progress. Examples of our progress in tools forconnected entertainment include:
• Digital Rapids’ launch of its Transcode Manager 2.0 tool supporting DTS-HD encoding for theUltraViolet format, as well as the new streaming format, MPEG-DASH
• Elemental Technologies’ launch of its Elemental Server tool supporting DTS-HD encoding forthe UltraViolet format
• Rovi’s launch of its TotalCode tools supporting DTS-HD encoding for the UltraViolet format, aswell as its next-generation DivX Plus Streaming format
• Interra Systems’ automated quality control toolset, Baton, supporting the DTS-HD codec; thistools is used to automatically validate files prior to packaging and delivery to connected devices
• Release of DTS-HD MediaPlayer, a quality control tool used to playback and validate files inreal-time prior to packaging and delivery to connected devices
• Collaboration with Microsoft to add DTS-HD codec support to the Smooth Streaming formatfor delivering content to connected devices
Additional progress in tools for Blu-ray Disc includes the following product releases:
• CyberLink’s PowerDirector 10 video editing toolset includes DTS 5.1 Producer, an encodingtechnology for surround sound audio that delivers high-quality immersive sound when creatingdigital content, bringing advanced professional-grade audio capabilities to the home stage forBlu-ray Disc authoring. This partnership marks our first consumer-level tools offering.
15

• Adobe added support for DTS-HD audio codec profiles into its Creative Suite 6 video tools,enabling professionals and consumers alike to create Blu-ray Discs with the same audiotechnology featured on most Hollywood titles. This collaboration marks the first ‘‘prosumer’’offering capable of Blu-ray Disc authoring with DTS-HD Master Audio technology.
Research and Development
As demonstrated by our portfolio of industry-recognized, advanced technologies, we are centeredon strong research and development abilities. We were founded with key research and developmentthat focused on providing unique, cost effective and differentiated solutions, and we continue todevelop new technologies with this same goal in mind.
As we have grown, new technologies have not only been developed internally, but also acquiredfrom outside sources. Our technologies, and the talent and knowledge that created it, are key elementsof our research and development base and will continue to be a source of new solutions going forward.
We have a group of 151 engineers and scientists, including 18 PhDs, focused on research anddevelopment. This group oversees our product development efforts and is responsible for implementingour technology into existing and emerging products. We carry out research and development activitiesin the U.S., China, Japan, South Korea, Northern Ireland, Singapore and Taiwan.
Our research and development expenses totaled approximately $31.1 million during 2013,$25.8 million during 2012 and $13.5 million during 2011. We expect that we will continue to commitsignificant resources to research and development efforts in the future, particularly in support of ourexpansion across a wide variety of digital audio content and playback devices.
Intellectual Property
We have developed and maintain a sizeable library of copyrighted software and other technicalmaterials, both printed and digitized, as well as numerous trade secrets. We also have many individualpatent families resulting in hundreds of individual patents and patent applications throughout theworld.
As a provider of high-definition audio technologies to markets worldwide, we believe it isextremely important to protect our technology through the use of copyrights, trademarks, patents, andtrade secrets in many countries. We have targeted our intellectual property coverage to provideprotection in the major manufacturing and commercial markets of the world.
Our audio technologies are also embodied in the form of proprietary software to which we retainthe copyrights. Accordingly, copyrights are an important component of our intellectual property.
Our trademarks consist of many individual word marks, logos and slogans registered and in usethroughout the world. The marks cover our various products, technology, improvements and features aswell as the services that we provide. Our trademarks are an integral part of our licensing program and,generally, are required to be used on licensed products to identify the source of the technology in thedevice, to provide greater consumer awareness and to advance the sales of the licensed productsbearing the trademarks. In addition to over one hundred trademark registrations, we also havenumerous trademark applications pending worldwide, with additional marks in the pre-applicationphase.
It is our general practice to file patent applications for our technology in the U.S. and variousforeign countries where our customers manufacture, distribute or sell licensed products. We activelypursue new applications to expand our patent portfolio to address new technological innovations. Mostof the patents in our patent portfolio have an average life of 20 years from their date of filing. Anumber of our patents have expiration dates ranging from 2015 to 2030. The patents that expire sooner
16

primarily cover the process of producing media containing DTS and high-definition audio as well as theindividual finished product. We have multiple patents covering unique aspects and improvements formany of our technologies. We do not believe that the expiration of any single patent is likely tosignificantly affect our intellectual property position or our ability to generate licensing revenues.
Governmental and Industry Standards
There are a variety of governmental and industry-related organizations that are responsible foradopting system and product standards. Standards are important in many technology-focused industriesas they help to ensure compatibility of technologies across a system or series of products. Generally,standards adoption occurs on either a mandatory basis, requiring the existence of a particulartechnology or feature, or an optional basis, meaning that a particular technology or feature may be, butis not required to be, utilized.
We believe the market for audio and audio/video products is very standards driven and our activeparticipation with standards organizations is important as we work to include our technology instandards or change our status from optional to mandatory, where possible. We believe our standardsinvolvement also provides us early visibility into future opportunities.
Governmental standards are often operated by non-governmental organizations in cooperation withregional regulatory bodies. These organizations adopt standards by validating and publishing industrystandards that are appropriate for various regions and technical requirements. The standards of thisnature that we participate in include European Technical Standards Institute (ETSI) which is anaffiliated European Standards Organization under the European Union, International ElectrotechnicalCommission (IEC), and the Moving Pictures Expert Group (MPEG) which is a joint working groupunder the IEC and International Organization for Standardization (ISO).
The majority of standards we actively participate in are produced by industry-related organizations.These bodies adopt standards based on industry evaluations and discussions across effectedconstituencies finalizing with consensus voting as to the best solution around which to standardize. Theindustry standards we participate in include the following:
• The Alliance for • Advanced Television Systems • Audio Engineering SocietyTelecommunications Industry Committee (ATSC) (AES)Solutions (ATIS)
• Blu-ray Disc Association • Connected Media Experience • Consumer Electronics(BDA) Association (CEA)
• DASH Industry Forum • Digital Entertainment • Digital Living Network(DASH-IF) Content Ecosystem (DECE) Alliance (DLNA)
• Digital Video Broadcast • European Broadcast Union • GENIVI(DVB) (EBU)
• High-Definition Multimedia • Hybrid Broadcast Broadband • The Khronos GroupInterface (HDMI) TV (HbbTV)
• Open IPTV Forum (OIPF) • Secure Content Storage • Society of CableAssociation (SCSA) Telecommunications
Engineers (SCTE)
• Society for Motion Picture • Telecommunications • Wi-Fi Allianceand Television Engineers Technology Association of(SMPTE) Korea (TTA)
17
Some standards bodies are now ‘‘open standards’’ that require all technologies included in thestandard be included on non-proprietary and intellectual-property ‘‘free’’ technology platforms in whichno company maintains ownership over the dominant technologies. We are actively engaging thesebodies to determine how we may participate and the potential impact on our business model andfuture go to market strategies.
We anticipate being involved in a number of other standards organizations as appropriate tofacilitate the deployment of our technology.
Branding
The foundation of our marketing strategy is to broaden the awareness and reach of the DTS brandwith consumers so that the DTS brand becomes a catalyst in expanding the use of our existingtechnologies in new markets and in commercializing new technologies to existing markets.
In order to maximize our opportunities in the network-connected markets, we continue ourconsumer marketing campaign to position DTS as the company that cares about sound, and thecompany that makes connected devices sound better by delivering solutions that makes mediaexperiences engaging and exciting. The campaign ‘‘Sound Changes the Way We See’’ has hit a chord withyounger connected consumers and outperformed industry metrics for digital media delivery and socialmedia engagement. Digital and social media has been a key focus of this campaign, and in 2013, wereached nearly three million digital video views and surpassed one million followers on our Facebookpage.
We believe that continued targeted investment in the DTS brand, the strong adoption of DTS asthe preferred audio format for Blu-ray Disc content and our further expansion into network-connecteddevices will result in the proliferation of the DTS brand into expanding categories of consumerelectronics, and in turn, grow the consumer awareness of and appeal for the DTS brand.
Licensing to Customers
We have two licensing teams, one headquartered in Limerick, Ireland and one in California, thatmarket our technology directly to consumer electronics products manufacturers and to semiconductormanufacturers. We also have customer focused employees located in the U.S., Europe, China, HongKong, Japan, South Korea, Taiwan and Singapore. We believe that locating staff near the leadingconsumer electronics and semiconductor manufacturers is essential to providing the level of customersupport necessary in today’s rapidly evolving global marketplace.
We license our technology to consumer electronics products manufacturers primarily through atwo-step process:
• Semiconductor Manufacturers. First, we license to a substantial number of major semiconductormanufacturers a limited set of rights to incorporate our technology in their semiconductors, orchips, and to sell these chips supporting DTS technology to our consumer electronics productsmanufacturer licensees.
• Consumer Electronics Products Manufacturers. Secondly, we license hardware manufacturers alimited set of rights to utilize our technology in their physical products. Our business modeltypically provides for us to receive a per-unit royalty for products produced by the consumermanufacturer licensees that contain our technologies.
As part of the licensing terms for both semiconductor and hardware manufacturer licensees, wetypically receive fees for access to our developer kits and for product certification. Generally, we licenseon a non-exclusive, worldwide basis. We require that all licensees have their integrated circuits orhardware devices certified by us prior to distribution. We reserve the right to audit their books, records
18
and quality standards. Licensees are generally required to display the appropriate DTS trademark onthe products they manufacture.
We have licensed our technologies and our trademarks to substantially all of the major consumerelectronics products manufacturers worldwide. Collectively, these manufacturers have sold billions ofDTS-licensed consumer electronics products. While our business is not substantially dependent on anysingle customer agreement, we have entered into several license agreements with the various divisionsand/or companies that comprise Samsung Electronics Co., Ltd. and Sony Corporation which relate tovarious types of consumer electronics devices. Each of these significant customers, in the aggregate,accounts for more than 10% of total revenues for the year ended December 31, 2013. For additionalinformation, refer to ‘‘Concentration of Business and Credit Risk’’ in Note 2 of our consolidatedfinancial statements, ‘‘Significant Accounting Policies’’.
Content Providers
We have sold or provided our digital sound encoding software to many of the leading home videoand music content providers and professional audio facilities, enabling them to create high-definitionDTS-enabled content. We believe that allowing easy access to DTS encoders will result in more DTScontent, which we believe will drive consumer demand for DTS-enabled electronics products. To date,thousands of Blu-ray Disc and DVD titles have been produced with DTS high-definition audio tracks.In fact, according to Nielsen, 85% of the top 100 Blu-ray titles sold in 2013, including nine out of thetop ten movies in 2013, were encoded with DTS-HD Master Audio.
Seasonality of Business
Generally, consumer electronics manufacturing activities are lowest in the first calendar quarter ofeach year, and increase progressively throughout the remainder of the year. The third and fourthquarters are typically the strongest in terms manufacturing output as our technology licensees increasetheir manufacturing output to prepare for the holiday buying season. Since recognition of revenues inour business generally lags manufacturing activity by one quarter due to the timing of licenseereporting to us, our revenues and earnings are generally lowest in the second quarter.
In general, the introduction and inclusion of DTS technologies in new and rapidly growing marketscan have a material effect on quarterly revenues and profits, and can distort the moderate seasonalitydescribed above.
Also, from time to time, we may recognize royalty revenues that relate to licensing obligations thatoccurred in prior periods. These royalty recoveries may cause revenues to be higher than expectedduring a particular reporting period and may not occur in subsequent periods.
Competition
We face strong competition in the consumer electronics market and expect competition to continueto intensify in the future. Our primary competitor is Dolby Laboratories, who develops and markets,among other things, high-definition audio products and services. Dolby was founded over 40 years agoand for many years was the only significant provider of audio technologies. Dolby’s long-standingmarket position, brand, business relationships, resources and inclusion in various industry standardsprovide it with a strong competitive position.
In addition to Dolby, we compete in specific product markets with companies such as FraunhoferInstitut Integrierte Schaltungen, Koninklijke Philips Electronics N.V., and various other consumerelectronics products manufacturers. Many of these competitors have a wide variety of strengths thatafford them competitive advantages, such as longer operating histories, significantly greater resources,greater name recognition, or the ability to offer their technologies for a lower price or for free.
19

We believe that the principal competitive factors in each of our markets include some or all of thefollowing:
• technology performance, flexibility, and range of application;
• quality and reliability of technologies, products and services;
• brand recognition and reputation;
• inclusion in industry standards;
• price;
• relationships with semiconductor, consumer electronics manufacturers, and content producers;
• availability of encoding tools that deliver compatible high-definition audio content;
• timeliness and relevance of new product introductions; and
• relationships with and distribution networks for, production and post-production operatorsproviding content for digital broadcast.
We have been successful in penetrating the consumer electronics markets and building and growingmarket share. Many top selling Blu-ray Dics and DVDs contain high-definition soundtracks in ourformat, and a substantial majority of consumer electronics products with high-definition or surroundsound audio capability incorporate our technology, trademarks or know-how. Our success has been duein large part to our ability to position our brand as a premium offering that contains superiorproprietary technology, the quality of our customer service, our inclusion in industry standards and ourindustry relationships.
We believe there are significant barriers to entry into the consumer electronics products market,such as our mandatory status in the Blu-ray format. Also, the standards relating to DVD are wellestablished and support a limited number of technologies, including our codecs. Numerous otherstandards in which we participate support a limited number of technologies, including various DTStechnologies.
Employees
As of December 31, 2013, we had 373 employees, which includes 151 employees classified on ourconsolidated statements of operations as research and development and 222 classified as selling, generaland administrative. None of our employees are subject to a collective bargaining agreement, and wehave never experienced a work stoppage. We believe our relations with our employees are good.
Website Access To SEC Filings
We maintain an internet website at www.dts.com. We make available free of charge through ourwebsite our annual reports on Form 10-K, quarterly reports on Form 10-Q, current reports onForm 8-K, proxy statements and any amendments to those reports filed or furnished pursuant toSection 13(a) or 15(d) of the Securities Exchange Act of 1934, as amended, as soon as reasonablypracticable after we electronically file such material with, or furnish it to, the SEC.
20
Item 1A. Risk Factors
You should consider each of the following factors as well as the other information in this AnnualReport in evaluating our business and our prospects. The risks and uncertainties described below are not theonly ones we face. Additional risks and uncertainties not presently known to us or that we currently considerimmaterial may also impair our business operations. If any of the following risks actually occurs, ourbusiness, financial condition, or results of operations could suffer. In that case, the trading price of ourcommon stock could decline, and you may lose all or part of your investment.
Risks Related to Our Business
A continued decline in optical disc based media consumption and our inability to further penetrate the on-lineand mobile content delivery markets and adapt our technologies for those markets could adversely impact ourrevenues and ability to grow.
Movie and music content has historically been purchased and consumed primarily via optical discbased media, such as Blu-ray Disc, DVD, and CD. However, the growth of the internet and homecomputer usage, connected TVs, set-top boxes, tablets, smartphones, and other devices, along with therapid advancement of on-line and mobile content delivery has resulted in the recent trend toentertainment download and streaming services becoming mainstream with consumers in various partsof the world. We expect the shift away from optical disc based media to on-line and mobile mediacontent consumption to continue, which may result in further declines in revenue from DVD andBlu-ray Disc players that incorporate our technologies.
Also, the services that provide movie content from the cloud are not generally governed byinternational or national standards and are thus free to choose any media format(s) in order to delivertheir products and services. This freedom of choice on the part of on-line and mobile media contentproviders could limit our ability to grow if such content providers do not incorporate our technologiesinto their services, which could affect demand for our technologies.
Furthermore, our inclusion in mobile devices may be less profitable for us than DVD and Blu-rayDisc players. The on-line and mobile markets are characterized by intense competition, evolvingindustry standards and business and distribution models, disruptive software and hardware technologydevelopments, frequent new product and service introductions, short product and service life cycles, andprice sensitivity on the part of consumers, all of which may result in downward pressure on pricing.Any of the foregoing could adversely affect our business and operating results.
We may not be able to evolve our technologies, products, and services or develop new technology, products, andservices that are acceptable to our customers or the changing market.
The market for our technologies, products, and services is characterized by:
• rapid technological change and product obsolescence;
• new and improved product introductions;
• changing customer demands;
• increasingly competitive product landscape; and
• evolving industry standards.
Our future success depends upon our ability to enhance our existing technologies, products, andservices and to develop acceptable new technologies, products, and services on a timely basis. Thedevelopment of enhanced and new technologies, products, and services is a complex and uncertainprocess requiring high levels of innovation, highly-skilled engineering and development personnel, andthe accurate anticipation of technological and market trends. We may not be able to identify, develop,
21

market, or support new or enhanced technologies, products, or services on a timely basis, if at all.Furthermore, our new technologies, products, and services may never gain market acceptance, and wemay not be able to respond effectively to evolving consumer demands, technological changes, productannouncements by competitors, or emerging industry standards. Any failure to respond to thesechanges or concerns would likely prevent our technologies, products, and services from gaining marketacceptance or maintaining market share and could lead to our technologies, products and servicesbecoming obsolete.
Our ability to develop proprietary technology in markets in which ‘‘open standards’’ are adopted may belimited, which could adversely affect our ability to generate revenue.
Standards-setting bodies may require the use of open standards, meaning that the technologiesnecessary to meet those standards are publicly available, free of charge and often on an ‘‘open source’’basis. These standards are a relatively recent and limited occurrence and have primarily been focusedon markets and regions traditionally adverse to the notion of intellectual property ownership and theassociated royalties. If the concept of open standards gains industry momentum in the future, the useof open standards may reduce our opportunity to generate revenue, as open standards technologies arebased upon non-proprietary technology platforms in which no one company maintains ownership overthe dominant technologies.
A loss of one or more of our key customers or licensees in any of our markets could adversely affect ourbusiness.
From time to time, one or a small number of our customers or licensees may represent asignificant percentage of our revenue. While our business is not substantially dependent on any singlecustomer agreement, we have entered into several license agreements with the various divisions and/orcompanies that comprise Samsung Electronics Co., Ltd. and Sony Corporation, which relate to varioustypes of consumer electronics devices. Each of these significant customers, in the aggregate, accountsfor more than 10% of total revenues for the year ended December 31, 2013. For additionalinformation, refer to ‘‘Concentration of Business and Credit Risk’’ in Note 2 of our consolidatedfinancial statements, ‘‘Significant Accounting Policies’’. Although we have agreements with many of ourcustomers, many of these agreements do not require any material minimum purchases or minimumroyalty fees and typically do not prohibit customers from purchasing products and services fromcompetitors. A decision by any of our major customers or licensees not to use our technologies, ortheir failure or inability to pay amounts owed to us in a timely manner, or at all, could have asignificant adverse effect on our business.
22

We face intense competition. Certain of our competitors have greater resources than we do.
The digital audio, consumer electronics and entertainment markets are intensely competitive,subject to rapid change, and significantly affected by new product introductions and other marketactivities of industry participants. Our principal competitor is Dolby Laboratories, Inc., who competeswith us in most of our markets. We also compete with other companies offering digital audiotechnology incorporated into consumer electronics product and entertainment mediums, such asFraunhofer Institut Integrierte Schaltungen and Koninklijke Philips Electronics N.V. (Philips).
Certain of our current and potential competitors may enjoy substantial competitive advantages,including:
• greater name recognition;
• a longer operating history;
• more developed distribution channels and deeper relationships with our common customer base;
• a more extensive customer base;
• digital technologies that provide features that ours do not;
• broader product and service offerings;
• greater resources for competitive activities, such as research and development, strategicacquisitions, alliances, joint ventures, sales and marketing, subsidies and lobbying industry andgovernment standards;
• more technicians and engineers;
• greater technical support;
• open source or free codecs; and
• greater inclusion in government or industry standards.
As a result, these current and potential competitors may be able to respond more quickly andeffectively than we can to new or changing opportunities, technologies, standards, or customerrequirements.
In addition to the competitive advantages described above, Dolby also enjoys other uniquecompetitive strengths relative to us. For example, it introduced multi-channel audio technology beforewe did. It has also achieved mandatory standard status in product categories that we have not,including terrestrial digital TV broadcasts in the U.S. As a result of these factors, Dolby has acompetitive advantage in selling its digital multi-channel audio technology to consumer electronicsproducts manufacturers.
Our customers who are also our current or potential competitors may choose to use their own or competingtechnologies rather than ours.
We face competitive risks in situations where our customers are also current or potentialcompetitors. For example, certain of our licensee customers maintain in-house audio engineering teams.To the extent that our customers choose to use technologies they have developed or in which they havean interest, rather than use our technologies, our business and operating results could be adverselyaffected.
23

Our business and prospects depend upon the strength of our brand, and if we do not maintain and strengthenour brand, our business will be materially harmed.
Establishing, maintaining and strengthening our ‘‘DTS’’ brand is critical to our success. Our brandidentity is key to maintaining and expanding our business and entering new markets. Our successdepends in large part on our reputation for providing high-quality products, services and technologiesto the consumer electronics and entertainment industries. If we fail to promote and maintain our brandsuccessfully, our business and prospects may suffer. Moreover, we believe that the likelihood that ourtechnologies will be adopted in industry standards depends, in part, upon the strength of our brand,because professional organizations and industry participants are more likely to incorporate technologiesdeveloped by a well-respected and well-known brand into standards.
We expect our operating expenses to increase in the future, which may impact profitability.
We expect our operating expenses to increase as we, among other things:
• expand our sales and marketing activities, including the continued development of ourinternational operations and increased advertising;
• adopt a more customer-focused business model which is expected to entail additional hiring;
• acquire businesses or technologies and integrate them into our existing organization;
• increase our research and development efforts to advance our existing technologies, products,and services and develop new technologies, products, and services;
• hire additional personnel, including engineers and other technical staff;
• expand and defend our intellectual property portfolio; and
• upgrade our operational and financial systems, procedures, and controls.
As a result, we will need to grow our revenues and manage our costs in order to positively impactprofitability. In addition, we may fail to accurately estimate and assess our increased operating expensesas we grow.
We may have difficulty managing any growth that we might experience.
As a result of a combination of organic growth and growth through acquisitions, such as our 2012acquisitions of SRS and Phorus, we expect to continue to experience growth in the scope of ouroperations and the number of our employees. If our growth continues, it may place a significant strainon our management team and on our operational and financial systems, procedures, and controls. Ourfuture success will depend in part upon the ability of our management team to manage any growtheffectively. This will require our management to:
• hire and train additional personnel;
• implement and improve our operational and financial systems, procedures, and controls;
• maintain our cost structure at an appropriate level based on the revenues we generate;
• manage multiple concurrent development projects; and
• manage operations in multiple time zones with different cultures and languages.
Any failure to successfully manage our growth could distract management’s attention, and result inour failure to execute our business plan.
24

We may not successfully address problems encountered in connection with acquisitions or strategicinvestments.
We consider opportunities to acquire or make investments in other technologies, products, andbusinesses that could enhance our technical capabilities, complement our current products and services,or expand the breadth of our markets. While we have acquired a number of businesses in the past, ourhistory of acquiring and integrating businesses is limited, and there can be no assurance that we will besuccessful in realizing the expected benefits from an acquisition. Future success depends, in part, uponour ability to manage an expanded business, which could pose substantial challenges for management.Acquisitions and strategic investments involve numerous risks and potential difficulties, including:
• problems assimilating the purchased technologies, products, or business operations;
• significant future charges relating to in-process research and development and the amortizationof intangible assets;
• significant amount of goodwill and intangible assets that are not amortizable and are subject toannual impairment review and potential impairment losses;
• problems maintaining and enforcing uniform standards, procedures, controls, policies andinformation systems;
• unanticipated costs, including accounting and legal fees, capital expenditures, and transactionexpenses;
• diversion of management’s attention from our core business;
• adverse effects on existing business relationships with suppliers and customers;
• risks associated with entering markets in which we have no or limited experience;
• unanticipated or unknown liabilities relating to the acquired businesses;
• the need to integrate accounting, management information, manufacturing, human resources andother administrative systems and personnel to permit effective management; and
• potential loss of key employees of acquired organizations.
If we fail to properly evaluate and execute acquisitions and strategic investments, our managementteam may be distracted from our day-to-day operations, our business may be disrupted, and ouroperating results may suffer. In addition, if we finance acquisitions by issuing equity or convertible debtsecurities, our existing stockholders would be diluted. Foreign acquisitions involve unique risks inaddition to those mentioned above, including those related to integration of operations across differentgeographies, cultures and languages, currency risks and risks associated with the particular economic,political and regulatory environment in specific countries. Also, the anticipated benefit of ouracquisitions and investments may not materialize, whether because of failure to obtain stockholderapproval or otherwise. Future acquisitions and investments could result in potentially dilutive issuancesof our equity securities, the incurrence of debt or contingent liabilities, amortization expenses, orimpairment losses on goodwill and intangible assets, any of which could harm our operating results orfinancial condition. Future acquisitions may also require us to obtain additional equity or debtfinancing, which may not be available on favorable terms or at all.
If we are unable to maintain a sufficient amount of entertainment content released with DTS audiosoundtracks, demand for the technologies, products, and services that we offer to consumer electronicsproducts manufacturers may significantly decline, which would adversely impact our business and prospects.
We expect to derive a significant percentage of our revenues from the technologies, products, andservices that we offer to manufacturers of consumer electronics products. We believe that demand for
25
our DTS audio technologies in growing markets for multi-channel audio, including automobiles, videogame consoles, soundbars, TVs, tablets and mobile phones will be based on the number, quality, andpopularity of the movies, music, and video games either released with DTS audio soundtracks orcapable of being coded and played in DTS format. Although we have existing relationships with manyleading providers of movie, music, computer, and video game content, we generally do not havecontracts that require these parties to develop and release content with DTS audio soundtracks.Accordingly, our revenue could decline if these parties elect not to incorporate DTS audio into theircontent or if they sell less content that incorporates DTS audio.
In addition, we may not be successful in maintaining existing relationships or developing newrelationships with other existing or new content providers. As a result, we cannot assure you that asufficient amount of content will be released in a DTS audio format to ensure that manufacturerscontinue offering DTS decoders in the consumer electronics products that they sell.
Declining retail prices for consumer electronics products could force us to lower the license or other fees wecharge our customers or prompt our customers to exclude our audio technologies from their productsaltogether, which would adversely affect our business and operating results.
The market for consumer electronics products is intensely competitive and price sensitive. Retailprices for consumer electronics products that include our audio technologies have decreasedsignificantly and we expect prices to continue to decrease for the foreseeable future. Declining pricesfor consumer electronics products could create downward pressure on the licensing fees we currentlycharge our customers who integrate our technologies into the consumer electronics products that theysell and distribute. As a result of pricing pressure, consumer electronics products manufacturers whoproduce products in which our audio technologies are not a mandatory standard could decide toexclude our audio technologies from their products altogether.
Our revenue is dependent upon our customers and licensees incorporating our technologies into their products,and we have limited control over existing and potential customers’ and licensees’ decisions to include ourtechnologies in their product offerings.
Except for Blu-ray products, where our technology is mandatory, we are dependent upon ourcustomers and licensees—including consumer electronics products manufacturers, semiconductormanufacturers, producers and distributors of content for movies, TV shows, music, and games—toincorporate our technologies into their products, purchase our products and services, or release theircontent in our proprietary DTS audio format. Although we have contracts and license agreements withmany of these companies, generally, these agreements do not require any minimum purchasecommitments, are on a non-exclusive basis, and do not require incorporation or use of ourtechnologies, trademarks or services. Furthermore, the decision by a party dominant in theentertainment value chain to provide audio technology at very low or no cost could impact a licensee’sdecision to use our technology. Our customers, licensees and other manufacturers might not utilize ourtechnologies or services in the future. Accordingly, our revenue will decline if our customers andlicensees choose not to incorporate our technologies in their products, or if they sell fewer productsincorporating our technologies.
Our licensing revenue depends in large part upon semiconductor manufacturers incorporating ourtechnologies into integrated circuit (‘‘ICs’’), for sale to our consumer electronics product licensees and if, forany reason, our technologies are not incorporated in these ICs or fewer ICs are sold that incorporate ourtechnologies, our operating results would be adversely affected.
Our licensing revenue from consumer electronics products manufacturers depends in large partupon the availability of ICs that implement our technologies. IC manufacturers incorporate ourtechnologies into these ICs, which are then incorporated into consumer electronics products. We do not
26

manufacture these ICs, but rather depend upon IC manufacturers to develop, produce and then sellthem to licensed consumer electronics products manufacturers. We do not control the ICmanufacturers’ decisions whether or not to incorporate our technologies into their ICs, and we do notcontrol their product development or commercialization efforts. If these IC manufacturers are unableor unwilling, for any reason, to implement our technologies into their ICs, or if, for any reason, theysell fewer ICs incorporating our technologies, our operating results will be adversely affected.
The licensing of patents constitutes a significant source of our revenue. If we do not replace expiring patentswith new patents or proprietary technologies, our revenue could decline.
We hold patents covering much of the technologies that we license, and our licensing revenue istied in large part to the life of those patents. Our right to receive royalties related to our patentsterminates with the expiration of the last patent covering the relevant technologies. Accordingly, to theextent that we do not replace licensing revenue from technologies covered by expiring patents withlicensing revenue based on new patents and proprietary technologies, our revenue could decline.
Our business is partially dependent upon the sales of Blu-ray Disc products, and to the extent that consumeruse of Blu-ray Disc products declines, our business may be adversely affected.
Past growth in our business has been largely due to the rapid growth in sales of DVD basedproducts and home theater systems incorporating our technologies. More recently, our mandatoryinclusion in the Blu-ray standard represented a significant opportunity. We expect markets for opticaldisc based products to mature and eventually decline in favor of an expanding market for network-based entertainment delivery. If the pace of our participation in network-based entertainment lags theeventual decline in our optical disc based media business, our operating results and prospects could beadversely affected.
Our technologies and products are complex and may contain errors that could cause us to lose customers,damage our reputation, or incur substantial costs.
Our technologies or products could contain errors that could cause our technologies or products tooperate improperly and could cause unintended consequences. If our technologies or products containerrors, we could be required to replace them, and if any such errors cause unintended consequences,we could face claims for product liability. Although we generally attempt to contractually limit ourexposure to incidental and consequential damages, as well as provide insurance coverage for suchevents, if these contract provisions are not enforced or are unenforceable for any reason, if liabilitiesarise that are not effectively limited, or if our insurance coverage is inadequate to satisfy the liability,we could incur substantial costs in defending or settling product liability claims.
We are dependent upon certain key employees.
Our success depends, in part, upon the continued availability and contributions of our managementteam and engineering and technical personnel because of the complexity of our products and services.Important factors that could cause the loss of key personnel include:
• our existing employment agreements with the members of our management team allow suchpersons to terminate their employment with us at any time;
• we do not have employment agreements with a majority of our key engineering and technicalpersonnel;
• not maintaining a competitive compensation package, including cash and equity compensation;
• significant portions of the equity awards held by the members of our management team arevested; and
27

• equity awards held by some of our executive officers provide for accelerated vesting in the eventof a sale or change of control of our company.
The loss of key personnel or an inability to attract qualified personnel in a timely manner couldslow our technology and product development and harm our ability to execute our business plan.
Economic downturns could disrupt and materially harm our business.
Negative trends in the general economy could cause a downturn in the market for ourtechnologies, products and services, as many of the products in which our technologies are incorporatedare discretionary goods, including TVs, PCs, and mobile devices. Continued weakness in the globalfinancial markets has resulted in a tightening in the credit markets, a low level of liquidity in manyfinancial markets and volatility in credit and equity markets. This continued weakness may adverselyaffect our operating results if it results, for example, in the insolvency of a key licensee or othercustomer, the inability of our licensees or other customers to obtain credit to finance their operations,including financing the manufacture of products containing our technologies, and delays in reporting orpayments from our licensees. Tight credit markets could also delay or prevent us from acquiring ormaking investments in other technologies, products or businesses that could enhance our technicalcapabilities, complement our current products and services, or expand the breadth of our markets. Ifwe are unable to execute such acquisitions or strategic investments, our operating results and businessprospects may suffer.
In addition, global economic conditions, including increased cost of commodities, widespreademployee layoffs, actual or threatened military action by the U.S. and the continued threat of terrorism,have resulted in decreased consumer confidence, disposable income and spending. Continuation of orany further reduction in consumer confidence or disposable income may negatively affect the demandfor consumer electronics products that incorporate our technologies.
We cannot predict other negative events that may have adverse effects on the global economy ingeneral and the consumer electronics industry specifically. However, the factors described above andsuch unforeseen events could negatively affect our revenues and operating results.
We may experience fluctuations in our operating results.
We have historically experienced moderate seasonality in our business due to our business mix andthe nature of our products. Consumer electronics manufacturing activities are generally lowest in thefirst calendar quarter of each year, and increase progressively throughout the remainder of the year.Manufacturing output is generally strongest in the third and fourth quarters as our technology licenseesincrease manufacturing to prepare for the holiday buying season. Since recognition of revenuesgenerally lags manufacturing activity by one quarter, our revenues and earnings are generally lowest inthe second quarter. The introduction of new products and inclusion of our technologies in new andrapidly growing markets can distort and amplify the seasonality described above. Our revenues maycontinue to be subject to fluctuations, seasonal or otherwise, in the future. Unanticipated fluctuations,whether due to seasonality, economic downturns, product cycles, or otherwise, could cause us to missour earnings projections, or could lead to higher than normal variation in short-term earnings, either ofwhich could cause our stock price to decline.
In addition, we actively engage in intellectual property compliance and enforcement activitiesfocused on identifying third parties who have either incorporated our technologies, trademarks, orknow-how without a license or who have underreported to us the amount of royalties owed underlicense agreements with us. As a result of these activities, from time to time, we may recognize royaltyrevenues that relate to manufacturing activities from prior periods, and we may incur expendituresrelated to enforcement activity. These royalty recoveries and expenditures, as applicable, may causerevenues to be higher than expected, or results to be lower than expected, during a particular reporting
28

period and may not recur in future reporting periods. Such fluctuations in our revenues and operatingresults may cause declines in our stock price.
We rely on the accuracy of our customers’ manufacturing reports for reporting and collecting our revenues,and if these reports are untimely or incorrect, our revenues could be delayed or inaccurately reported.
Most of our revenues are generated from consumer electronics products manufacturers who licenseand incorporate our technology in their consumer electronics products. Under our existing agreements,these customers pay us per-unit licensing fees based on the number of consumer electronics productsmanufactured that incorporate our technology. We rely on our customers to accurately report thenumber of units manufactured in collecting our license fees, preparing our financial reports,projections, budgets, and directing our sales and product development efforts. Most of our licenseagreements permit us to audit our customers, but audits are generally expensive, time consuming,difficult to manage effectively, dependent in large part upon the cooperation of our licensees and thequality of the records they keep, and could harm our customer relationships. If any of our customerreports understate the number of products they manufacture, we may not collect and recognizerevenues to which we are entitled, or may endure significant expense to obtain compliance.
If we fail to protect our intellectual property rights, our ability to compete could be harmed.
Protection of our intellectual property is critical to our success. Copyright, trademark, patent, andtrade secret laws and confidentiality and other contractual provisions afford only limited protection andmay not adequately protect our rights or permit us to gain or keep any competitive advantage. We facenumerous risks in protecting our intellectual property rights, including the following:
• our competitors may produce competitive products or services that do not unlawfully infringeupon our intellectual property rights;
• the laws of foreign countries may not protect our intellectual property rights to the same extentas the laws of the U.S., and mechanisms for enforcement of intellectual property rights may beinadequate in foreign countries;
• we may be unable to successfully identify or prosecute unauthorized uses of our technologies;
• efforts to identify and prosecute unauthorized uses of our technologies are time consuming,expensive, and divert resources from the operation of our business;
• our patents may be challenged, found unenforceable or invalidated by our competitors;
• our pending patent applications may not issue, or if issued, may not provide meaningfulprotection for related products or proprietary rights;
• we may not be able to practice our trade secrets as a result of patent protection afforded athird-party for such product, technique or process; and
• we may not be able to prevent the unauthorized disclosure or use of our technical knowledge orother trade secrets by employees, consultants, and advisors.
As a result, our means of protecting our intellectual property rights and brands may proveinadequate. Furthermore, despite our efforts, third parties may violate, or attempt to violate, ourintellectual property rights. Enforcement, including infringement claims and lawsuits would likely beexpensive to resolve and would require management’s time and resources. In addition, we have notsought, and do not intend to seek, patent and other intellectual property protections in all foreigncountries. In countries where we do not have such protection, products incorporating our technologymay be lawfully produced and sold without a license.
29
We may be sued by third parties for alleged infringement of their proprietary rights, and we may be subject tolitigation proceedings that could harm our business.
Companies that participate in the digital audio, consumer electronics, and entertainment industrieshold a large number of patents, trademarks, and copyrights, and are frequently involved in litigationbased on allegations of patent infringement or other violations of intellectual property rights.Intellectual property disputes frequently involve highly complex and costly scientific matters, and eachparty generally has the right to seek a trial by jury which adds additional costs and uncertainty.Accordingly, intellectual property disputes, with or without merit, could be costly and time consumingto litigate or settle, and could divert management’s attention from executing our business plan. Inaddition, our technologies and products may not be able to withstand any third-party claims or rightsagainst their use. If we were unable to obtain any necessary license following a determination ofinfringement or an adverse determination in litigation or in interference or other administrativeproceedings, we may need to redesign some of our products to avoid infringing a third party’s rightsand could be required to temporarily or permanently discontinue licensing our products.
In the past, we have been a party to litigation related to protection and enforcement of ourintellectual property, and we may be a party to additional litigation in the future. Litigation is subjectto inherent uncertainties, and unfavorable rulings could occur. An unfavorable ruling could includemonetary damages (including treble damages under the Clayton Act) and an injunction prohibiting usfrom licensing our technologies in particular ways or at all. If an unfavorable ruling occurred, ourbusiness and operating results could be materially harmed. In addition, any protracted litigation coulddivert management’s attention from our day-to-day operations, disrupt our business and cause ouroperating results to suffer.
We have in the past and may in the future have disputes with our licensees regarding our licensingarrangements.
At times, we are engaged in disputes regarding the licensing of our intellectual property rights,including matters related to our royalty rates and other terms of our licensing arrangements. Thesetypes of disputes can be asserted by our customers or prospective customers or by other third parties aspart of negotiations with us or in private actions seeking monetary damages or injunctive relief, or inregulatory actions. In the past, licensees have threatened to initiate litigation against us regarding ourlicensing royalty rate practices including our adherence to licensing on fair, reasonable, andnon-discriminatory terms and potential antitrust claims. Damages and requests for injunctive reliefasserted in claims like these could be material, and could be disruptive to our business. Any disputeswith our customers or potential customers or other third parties could adversely affect our business,results of operations, and prospects.
We are subject to additional risks associated with our international operations.
We market and sell our products and services outside the U.S. We currently have employeeslocated in several countries throughout Europe and Asia, and most of our customers and licensees arelocated outside the U.S. As a key component of our business strategy, we intend to expand ourinternational sales and customer support. During the year ended December 31, 2013, nearly 90% ofour revenues were derived internationally. We face numerous risks in doing business outside the U.S.,including:
• unusual or burdensome foreign laws or regulatory requirements or unexpected changes to thoselaws or requirements;
• tariffs, trade protection measures, import or export licensing requirements, trade embargos, andother trade barriers;
30

• difficulties in attracting and retaining qualified personnel and managing foreign operations;
• competition from foreign companies;
• dependence upon foreign distributors and their sales channels;
• longer accounts receivable collection cycles and difficulties in collecting accounts receivable;
• less effective and less predictable protection and enforcement of our intellectual property;
• changes in the political or economic condition of a specific country or region, particularly inemerging markets;
• fluctuations in the value of foreign currency versus the U.S. dollar and the cost of currencyexchange;
• potentially adverse tax consequences; and
• cultural differences in the conduct of business.
Such factors could cause our future international sales to decline.
Our business practices in international markets are also subject to the requirements of the ForeignCorrupt Practices Act. If any of our employees are found to have violated these requirements, we andour employees could be subject to significant fines, criminal sanctions and other penalties.
Our international revenue is mostly denominated in U.S. dollars. As a result, fluctuations in thevalue of the U.S. dollar and foreign currencies may make our technology, products, and services moreexpensive for international customers, which could cause them to decrease their royalty obligations tous. Expenses for our subsidiaries are denominated in their respective local currencies. As a result, if theU.S. dollar weakens against the local currency, the translation of our foreign-currency-denominatedexpenses will result in higher operating expense without a corresponding increase in revenue.Significant fluctuations in the value of the U.S. dollar and foreign currencies could have a materialimpact on our consolidated financial statements. The main foreign currencies we encounter in ouroperations are the JPY, EUR, RMB, KRW, HKD, TWD, SGD and GBP. We do not currently engagein currency hedging activities to limit the risk of exchange rate fluctuations.
We have identified material weaknesses in our internal control over financial reporting, which may adverselyaffect investor confidence in us and, as a result, the value of our common stock.
We are required, pursuant to Section 404 of the Sarbanes-Oxley Act, to furnish a report bymanagement on, among other things, the effectiveness of our internal control over financial reporting.This assessment includes disclosure of any material weaknesses identified by our management in ourinternal control over financial reporting, as well as a statement that our independent registered publicaccounting firm has issued an attestation report on the effectiveness of our internal control overfinancial reporting.
Our management concluded that our internal control over financial reporting was ineffective as ofDecember 31, 2013 and 2012, because material weaknesses existed in our internal control over financialreporting related to the inadequate design of internal controls over the accounting for income taxesand for revenue under license agreements with non-standard financial terms. See Item 9A—Controlsand Procedures.
In order to remediate the material weakness in our internal control over financial reporting relatedto the accounting for income taxes, we implemented a plan to enhance our control procedures withrespect to the preparation and review of the income tax provision and the related deferred tax assetsand liabilities, including increasing the use of third party advisors with appropriate expertise to assistwith the preparation and review of the quarterly and annual income tax provision. In addition, in order
31

to remediate the material weakness in our internal control over financial reporting related to theaccounting for revenue under license agreements with non-standard financial terms, we implemented aplan to enhance our control procedures with respect to the identification and review of revenue underagreements with non-standard financial terms, including performing additional analysis of our licenseagreements to evaluate the non-standard financial terms and additional accounting research andpreparing detailed checklists to ensure that all agreements with non-standard financial terms aresufficiently identified and evaluated, and revenue is properly recognized.
If we are unable to effectively remediate these material weaknesses in a timely manner, or if weidentify one or more additional material weaknesses in the future, investors could lose confidence inthe accuracy and completeness of our financial reports, which could have a material adverse effect onthe price of our common stock.
Our multi-national legal structure is complex, which increases the risk of errors in financialreporting related to our accounting for income taxes. In the course of remediating the materialweakness, we may find additional errors in our accounting for income taxes or discover new facts thatcause us to reach different conclusions. In addition, given the complexity of certain of the Company’slicense agreements and the accounting standards governing revenue recognition related thereto, we mayfind additional errors in our accounting for revenue under license agreements with non-standardfinancial terms or discover new facts that cause us to reach different conclusions. This could result inadjustments that could have an adverse effect on our consolidated financial statements and the price ofour common stock.
Compliance with changing securities laws, regulations and financial reporting standards will increase ourcosts and pose challenges for our management team.
Changing laws, regulations and standards relating to corporate governance and public disclosure,including the Dodd-Frank Wall Street Reform and Consumer Protection Act, the Sarbanes-Oxley Actof 2002, and the rules and regulations promulgated thereunder have created uncertainty for publiccompanies and significantly increased the costs and risks associated with operating as a publicly tradedcompany in the U.S. Our management team will need to devote significant time and financial resourcesto comply with both existing and evolving standards for public companies, which will lead to increasedgeneral and administrative expenses and a diversion of management time and attention from revenuegenerating activities to compliance activities. Furthermore, with such uncertainties, we cannot assureyou that our system of internal control will be effective or satisfactory to our independent registeredpublic accounting firm. As a result, our financial reporting may not be timely or accurate and we maybe issued an adverse or qualified opinion by our independent registered public accounting firm. Ifreporting delays or material errors actually occur, we could be subject to sanctions or investigation byregulatory authorities, such as the SEC, which could adversely affect our financial results or result in aloss of investor confidence in the reliability of our financial information, which could materially andadversely affect the market price of our common stock.
Further, the SEC has passed, promulgated and proposed new rules on a variety of subjectsincluding the possibility that we would be required to adopt International Financial ReportingStandards (‘‘IFRS’’). In order to comply with IFRS requirements, we may have to add additionalaccounting staff, engage consultants or change our internal practices, standards and policies whichcould significantly increase our costs.
We believe that these new and proposed laws and regulations could make it more difficult for usto attract and retain qualified members of our Board of Directors, particularly to serve on our auditcommittee, and qualified executive officers.
32
Current and future governmental and industry standards may significantly limit our business opportunities.
Technology standards are important in the audio and video industry as they help to assurecompatibility across a system or series of products. Generally, standards adoption occurs on either amandatory basis, requiring a particular technology to be available in a particular product or medium, oran optional basis, meaning that a particular technology may be, but is not required to be, utilized. Forexample, both our digital multi-channel audio technology and Dolby’s have optional status in Blu-ray,while both our two-channel output and Dolby’s technologies have been selected as mandatory standardsin Blu-ray. However, if either or both of these standards are re-examined or a new standard isdeveloped, we may not be included as mandatory in any such new or revised standard which wouldcause revenue growth in that area of our business to be significantly lower than expected and couldhave a material adverse effect on our business.
Various national governments have adopted or are in the process of adopting standards for alldigital TV broadcasts, including cable, satellite, and terrestrial. In the U.S., Dolby’s audio technologyhas been selected as the sole, mandatory audio standard for terrestrial digital TV broadcasts. As aresult, the audio for all digital terrestrial TV broadcasts in the U.S. must include Dolby’s technologyand must exclude any other format, including ours. We do not know whether this standard will bereopened or amended. If it is not, our audio technology may never be included in that standard.Certain large and developing markets, such as China, have not fully developed their digital TVstandards. Our technology may or may not ultimately be included in these standards.
As new technologies and entertainment media emerge, new standards relating to thesetechnologies or media may develop. New standards may also emerge in existing markets that arecurrently characterized by competing formats, such as the market for PCs. We may not be successful inour efforts to include our technology in any such standards.
Our licensing of industry standard technologies can be subject to limitations that could adversely affect ourbusiness and prospects.
When a standards-setting body adopts our technologies as explicit industry standards, we generallymust agree to license such technologies on a fair, reasonable and non-discriminatory basis, which webelieve means that we treat similarly situated licensees similarly. In these situations, we may berequired to limit the royalty rates we charge for these technologies, which could adversely affect ourbusiness. Furthermore, we may have limited control over whom we license such technologies to, andmay be unable to restrict many terms of the license. From time to time, we may be subject to claimsthat our licenses of our industry standard technologies may not conform to the requirements of thestandards-setting body. Claimants in such cases could seek to restrict or change our licensing practicesor our ability to license our technologies in ways that could injure our reputation and otherwisematerially and adversely affect our business, operating results and prospects.
We have a limited operating history in certain new and evolving consumer electronics markets.
Our technologies have only recently been incorporated into certain markets, such as TVs, PCs, andmobile products. We do not have the same experience in these markets as in our traditional consumerelectronics business, nor do we have as much operating history as other companies, such as DolbyLaboratories, Inc. As a result, the demand for our technologies, products, and services and the incomepotential of these businesses is unproven. In addition, because our participation in these markets isrelatively new and rapidly evolving, we may have limited insight into trends that may emerge and affectour business. We may make errors in predicting and reacting to relevant business trends, which couldharm our business. Before investing in our common stock, you should consider the risks, uncertainties,and difficulties frequently encountered by companies in new and rapidly evolving markets such as ours.We may not be able to successfully address any or all of these risks.
33

Unanticipated changes in our tax provisions or adverse outcomes resulting from examination of our incometax returns could adversely affect our net income.
We are subject to income taxes in both the U.S. and foreign jurisdictions. Our effective income taxrates could in the future be adversely affected by changes in tax laws or interpretations of those taxlaws, by changes in the mix of earnings in countries with differing statutory tax rates, or by changes inthe valuation of our deferred tax assets and liabilities. Significant judgment is required in determiningour worldwide provision for income taxes. In the ordinary course of our business, there are manytransactions and calculations where the ultimate tax determination is uncertain. We may come underaudit by tax authorities. For instance, the Internal Revenue Service (‘‘IRS’’) is examining our 2009 to2011 federal income tax returns. The State of California is examining our 2009 and 2010 corporate taxreturns. Although we believe our tax estimates are reasonable, the final determination of tax audits andany related litigation could be materially different from our historical income tax provisions andaccruals. Based on the results of an audit or litigation, a material effect on our income tax provision,net income or cash flows in the period or periods for which that determination is made could result. Inaddition, changes in tax rules may adversely affect our future reported financial results or the way weconduct our business. We earn a significant amount of our operating income from outside the U.S., andany repatriation of funds currently held in foreign jurisdictions may result in additional tax expense. Inaddition, there have been proposals to change U.S. tax laws that would significantly impact how U.S.multinational corporations are taxed on foreign earnings. Although we cannot predict whether or inwhat form this proposed legislation will pass, if enacted, it could have a material adverse impact on ourtax expense and cash flows.
We incurred a significant amount of indebtedness in connection with the SRS acquisition. Our level ofindebtedness, and covenant restrictions under such indebtedness, could adversely affect our operations andliquidity.
We financed the cash consideration of the SRS acquisition through a combination of existing cashbalances, liquidated investments and a new credit facility, which we entered into on July 18, 2012. Thiscredit facility provides us with a $30.0 million revolving line of credit, with a five million sublimit forthe issuance of standby and commercial letters of credit, to use to finance permitted acquisitions andfor working capital and general corporate purposes.
Our increased indebtedness could adversely affect our operations and liquidity, by, among otherthings:
• making it more difficult for us to pay or refinance our debts as they become due during adverseeconomic and industry conditions because we may not have sufficient cash flows to make ourscheduled debt payments;
• causing us to use a larger portion of our cash flows to fund interest and principal payments,reducing the availability of cash to fund working capital and capital expenditures and otherbusiness activities;
• making it more difficult for us to take advantage of significant business opportunities, such asacquisition opportunities, and to react to changes in market or industry conditions; and
• limiting our ability to borrow additional monies in the future to fund working capital, capitalexpenditures and other general corporate purposes.
The terms of our indebtedness include certain reporting and financial covenants, as well as othercovenants, that, among other things, restrict our ability to: (i) dispose of assets, (ii) incur additionalindebtedness, (iii) incur guarantee obligations, (iv) prepay certain other indebtedness or amend otherfinancing arrangements, (v) pay dividends, (vi) create liens on assets, (vii) enter into sale and leasebacktransactions, (viii) make investments, loans or advances, (ix) make acquisitions, (x) engage in mergers
34

or consolidations, (xi) change the business conducted and (xii) engage in certain transactions withaffiliates. If we fail to comply with any of these covenants or restrictions, such failure may result in anevent of default, which if not cured or waived, could result in the lenders increasing the interest rate asof the date of default or accelerating the maturity of our indebtedness. If the maturity of ourindebtedness is accelerated, we may not have sufficient cash resources to satisfy our debt obligationsand such acceleration would adversely affect our business and financial condition. In addition, theindebtedness under our credit facility is secured by a security interest in substantially all of our tangibleand intangible assets and therefore, if we are unable to repay such indebtedness, the lenders couldforeclose on these assets, which would adversely affect our ability to operate our business.
Our future capital needs are uncertain and we may need to raise additional funds in the future, and suchfunds may not be available on acceptable terms or at all.
Our capital requirements will depend upon many factors, including:
• acceptance of, and demand for, our technologies, products and services;
• the costs of developing new technologies or products;
• the extent to which we invest in new technologies and research and development projects;
• the number and timing of acquisitions and other strategic transactions;
• the costs associated with our expansion, if any; and
• the costs of litigation and enforcement activities to defend our intellectual property.
In the future, we may need to raise additional funds, and such funds may not be available onfavorable terms, or at all, particularly given the continuing credit crisis and downturn in the overallglobal economy. Furthermore, if we issue equity or debt securities to raise additional funds, our existingstockholders may experience dilution, and the new equity or debt securities may have rights,preferences, and privileges senior to those of our existing stockholders. If we cannot raise funds onacceptable terms, or at all, we may not be able to develop or enhance our products and services,execute our business plan, take advantage of future opportunities, or respond to competitive pressuresor unanticipated customer requirements. This may materially harm our business, results of operations,and financial condition.
Natural or other disasters could disrupt our business and negatively impact our operating results andfinancial condition.
Natural or other disasters such as earthquakes, hurricanes, tsunamis or other adverse weather andclimate conditions, whether occurring in the U.S. or abroad, and the consequences and effects thereof,including energy shortages and public health issues, could disrupt our operations, or the operations ofour business partners and customers, or result in economic instability that may negatively impact ouroperating results and financial condition. Our corporate headquarters and many of our operations arelocated in California, a seismically active region, potentially exposing us to greater risk of naturaldisasters.
Our business and operations could suffer in the event of security breaches.
Attempts by others to gain unauthorized access to information technology systems, includingsystems designed and managed by third parties, are becoming more sophisticated and successful. Theseattempts can include introducing malware to computers and networks, impersonating authorized users,overloading systems and servers and data theft. While we seek to detect and investigate any securityissue, in some cases, we might be unaware of an incident or its magnitude and effects. The theft,unauthorized use or publication of our intellectual property and/or confidential business information
35
could harm our competitive position, reduce the value of our investment in research and developmentand other strategic initiatives or otherwise adversely affect our business. To the extent that any securitybreach results in inappropriate disclosure of our customers’ or licensees’ confidential information, wemay incur liability as a result. Further, disruptions to certain of our information technology systemscould have severe consequences to our business operations, including financial loss and reputationaldamage.
Risks Related to Our Common Stock
We expect that the price of our common stock will fluctuate substantially.
The market price of our common stock is likely to be highly volatile and may fluctuatesubstantially due to many factors, including:
• actual or anticipated fluctuations in our results of operations;
• market perception of our progress toward announced objectives;
• announcements of technological innovations by us or our competitors or technology standards;
• announcements of significant contracts by us or our competitors;
• changes in our pricing policies or the pricing policies of our competitors;
• developments with respect to intellectual property rights;
• the introduction of new products or product enhancements by us or our competitors;
• the commencement of or our involvement in litigation;
• resolution of significant litigation in a manner adverse to our business;
• our sale or purchase of common stock or other securities in the future;
• conditions and trends in technology industries;
• changes in market valuation or earnings of our competitors;
• the trading volume of our common stock;
• announcements of potential acquisitions;
• the adoption rate of new products incorporating our or our competitors’ technologies, includingBlu-ray Disc players;
• changes in the estimation of the future size and growth rate of our markets; and
• general economic conditions.
In addition, the stock market in general, and the NASDAQ Global Select Market and the marketfor technology companies in particular, has experienced extreme price and volume fluctuations thathave often been unrelated or disproportionate to the operating performance of those companies.Further, the market prices of securities of technology companies have been particularly volatile. Thesebroad market and industry factors may materially harm the market price of our common stock,regardless of our operating performance. In the past, following periods of volatility in the market priceof a company’s securities, securities class-action litigation has often been instituted against thatcompany. Such litigation, if instituted against us, could result in substantial costs and a diversion ofmanagement’s attention and resources.
36

Shares of our common stock are relatively illiquid.
As a result of our relatively small public float, our common stock may be less liquid than thecommon stock of companies with broader public ownership. Among other things, trading of a relativelysmall volume of our common shares may have a greater impact on the trading price for our sharesthan would be the case if our public float were larger.
Anti-takeover provisions under our charter documents and Delaware law could delay or prevent a change ofcontrol and could also limit the market price of our stock.
Our Restated Certificate of Incorporation and Restated Bylaws contain provisions that could delayor prevent a change of control of our company or changes in our Board of Directors that ourstockholders might consider favorable. Some of these provisions:
• authorize the issuance of preferred stock which can be created and issued by the Board ofDirectors without prior stockholder approval, with rights senior to those of the common stock;
• provide for a classified Board of Directors, with each director serving a staggered three-yearterm;
• prohibit stockholders from filling Board vacancies, calling special stockholder meetings, or takingaction by written consent; and
• require advance written notice of stockholder proposals and director nominations.
In addition, we are governed by the provisions of Section 203 of the Delaware General CorporateLaw, which may prohibit certain business combinations with stockholders owning 15% or more of ouroutstanding voting stock. These and other provisions in our Restated Certificate of Incorporation,Restated Bylaws and Delaware law could make it more difficult for stockholders or potential acquirersto obtain control of our Board or initiate actions that are opposed by the then-current Board, andcould delay or impede a merger, tender offer, or proxy contest involving our company. Any delay orprevention of a change of control transaction or changes in our Board could cause the market price ofour common stock to decline.
If securities or industry analysts publish inaccurate or unfavorable research about our business or if ouroperating results do not meet or exceed their projections, our stock price could decline.
The trading market for our common stock depends in part on the research and reports thatsecurities or industry analysts publish about us or our business. If one or more of the analysts whocover us or our industry downgrade our stock or the stock of other companies in our industry, orpublish inaccurate or unfavorable research about our business or industry, or if our operating results donot meet or exceed their projections, our stock price would likely decline. If one or more of theseanalysts cease coverage of our company or fail to publish reports on us regularly, demand for our stockcould decrease, which might cause our stock price and trading volume to decline.
37

Item 1B. Unresolved Staff Comments
None.
Item 2. Properties
Our corporate headquarters and principal office is located in Calabasas, California, where we ownreal property, which includes an approximately 89,000 square foot building. We lease smaller facilitiesin other locations including the U.S., Republic of Ireland, Hong Kong, China, the United Kingdom,Japan, South Korea, Taiwan and Singapore. We believe that our existing space is adequate for ourcurrent operations. We believe that suitable replacement and additional space will be available in thefuture on commercially reasonable terms.
Item 3. Legal Proceedings
In the ordinary course of our business, we actively pursue legal remedies to enforce ourintellectual property rights and to stop unauthorized use of our technology and trademarks.
We are not currently a party to any material legal proceedings. We may, however, become subjectto lawsuits from time to time in the course of our business.
Item 4. Mine Safety Disclosures
None.
38
PART II
Item 5. Market for Registrant’s Common Equity, Related Stockholder Matters and Issuer Purchasesof Equity Securities
PRICE RANGE OF COMMON STOCK
Our common stock is traded on the NASDAQ Global Select Market under the symbol ‘‘DTSI’’.The following table sets forth, for the periods indicated, the high and low sales prices for our commonstock as reported by the NASDAQ Global Select Market:
High Low
2012First Quarter . . . . . . . . . . . . . . . . . . . . . . . . . . . . . . . . . . . . . . . . $31.32 $24.44Second Quarter . . . . . . . . . . . . . . . . . . . . . . . . . . . . . . . . . . . . . . $32.00 $24.98Third Quarter . . . . . . . . . . . . . . . . . . . . . . . . . . . . . . . . . . . . . . . $27.04 $17.69Fourth Quarter . . . . . . . . . . . . . . . . . . . . . . . . . . . . . . . . . . . . . . $24.46 $13.902013First Quarter . . . . . . . . . . . . . . . . . . . . . . . . . . . . . . . . . . . . . . . . $20.74 $16.25Second Quarter . . . . . . . . . . . . . . . . . . . . . . . . . . . . . . . . . . . . . . $23.25 $15.35Third Quarter . . . . . . . . . . . . . . . . . . . . . . . . . . . . . . . . . . . . . . . $24.24 $19.61Fourth Quarter . . . . . . . . . . . . . . . . . . . . . . . . . . . . . . . . . . . . . . $24.65 $19.48
As of January 31, 2014, there were approximately 3,600 stockholders of record of our commonstock. We believe that the number of beneficial owners is substantially greater than the number ofrecord holders because a large portion of our common stock is held through brokerage firms in‘‘street name.’’
SALES OF UNREGISTERED SECURITIES
During the year ended December 31, 2013, we did not issue any securities that were not registeredunder the Securities Act of 1933, as amended.
39

25MAR201405563292
STOCK PERFORMANCE GRAPH
The following graph and table compares the cumulative total stockholder return on our commonstock to that of the NASDAQ Market Index and the Russell 2000 Index for the five fiscal year periodending December 31, 2013, the date of our fiscal year end. The following graph and table assumes thata $100 investment was made at the close of trading on December 31, 2008 in our common stock and ineach index, and that dividends, if any, were reinvested. The stock price performance shown on thegraph below should not be considered indicative of future price performance.
$300
$250
$200
DO
LL
AR
S
$150
$100
$50
$0
12/31/2008 12/31/2009 12/31/2010 12/31/201312/31/201212/31/2011
DTS, Inc. NASDAQ Market Index Russell 2000 Index
December 31, December 31, December 31, December 31, December 31, December 31,2008 2009 2010 2011 2012 2013
DTS, Inc. . . . . . . . . . $100.00 $186.43 $267.30 $148.45 $ 91.01 $130.30NASDAQ Market
Index . . . . . . . . . . . $100.00 $145.34 $171.70 $170.34 $200.57 $281.14Russell 2000 Index . . . $100.00 $127.17 $161.33 $154.60 $179.88 $249.71
DIVIDEND POLICY
We have never declared or paid any cash dividends on our common stock. We currently intend toretain all available funds to support our operations and to finance the growth and development of ourbusiness. We do not anticipate paying any cash dividends in the foreseeable future. Any futuredetermination relating to our dividend policy will be made at the discretion of our Board of Directorsand will depend on a number of factors, including our future earnings, capital requirements, financialcondition, contract restrictions, future prospects, and other factors as the Board of Directors may deemrelevant. In addition, the provisions of our loan agreement limit, among other things, our ability to paydividends. Refer to Note 9 of our consolidated financial statements, ‘‘Long-term Debt’’ for additionalinformation relating to the loan agreement.
40

ISSUER PURCHASES OF EQUITY SECURITIES
Stock repurchase activity during the quarter ended December 31, 2013 was as follows:
MaximumTotal Number Number
Total of Shares of Shares thatNumber Average Purchased as May Yet Be
of Shares Price Paid Part of Publicly Purchased UnderPeriod Purchased(1) per Share Announced Plan the Plan(2)
October 1, 2013 through October 31, 2013 . . . — — — 780,440
November 1, 2013 through November 30, 2013 678,286 $20.89 677,103 103,337
December 1, 2013 through December 31, 2013 103,337 $22.05 103,337 —
Total . . . . . . . . . . . . . . . . . . . . . . . . . . . . . . . 781,623 $21.04(3) 780,440 —
Notes:
(1) Consists of (i) shares repurchased in open market transactions pursuant to a Board of Directorsauthorization in February 2012 for us to repurchase up to two million shares of our common stockin the open market or in privately negotiated transactions, depending upon market conditions andother factors, and (ii) shares repurchased from employees and effectively retired to satisfy statutorywithholding requirements upon the vesting of restricted stock.
(2) On February 22, 2012, we announced a Board of Directors authorization for us to repurchase upto two million shares of our common stock in the open market or in privately negotiatedtransactions, depending upon market conditions and other factors.
(3) Represents weighted average price paid per share during the quarter ended December 31, 2013.
41
Item 6. Selected Financial Data
In the table below, we provide you with historical selected consolidated financial data of DTS, Inc.and its subsidiaries. We derived the following historical data from our audited consolidated financialstatements. It is important that you read the selected consolidated financial data set forth below inconjunction with our consolidated financial statements and related notes and ‘‘Management’sDiscussion and Analysis of Financial Condition and Results of Operations’’ included elsewhere in thisForm 10-K.
During the first quarter of 2007, DTS Digital Cinema’s assets and liabilities were classified as heldfor sale and its operations were reported as discontinued operations. As a result, operations of DTSDigital Cinema for 2010 and 2009 have been reflected as discontinued.
On July 5, 2012, we completed our acquisition of substantially all of the assets of Phorus, Inc. andPhorus, LLC, pursuant to an Asset Purchase Agreement. On July 20, 2012, we completed ouracquisition of SRS Labs, Inc.’s common stock. As a result, the net assets acquired and results ofoperations of these acquisitions have been included in our balance sheets and statements of operations,respectively, as of the aforementioned acquisition dates.
Our historical results are not necessarily indicative of the operating results that may be expected inthe future. We have described various risks and uncertainties that could affect future operating resultsunder the heading ‘‘Risk Factors’’ included elsewhere in this Form 10-K.
42
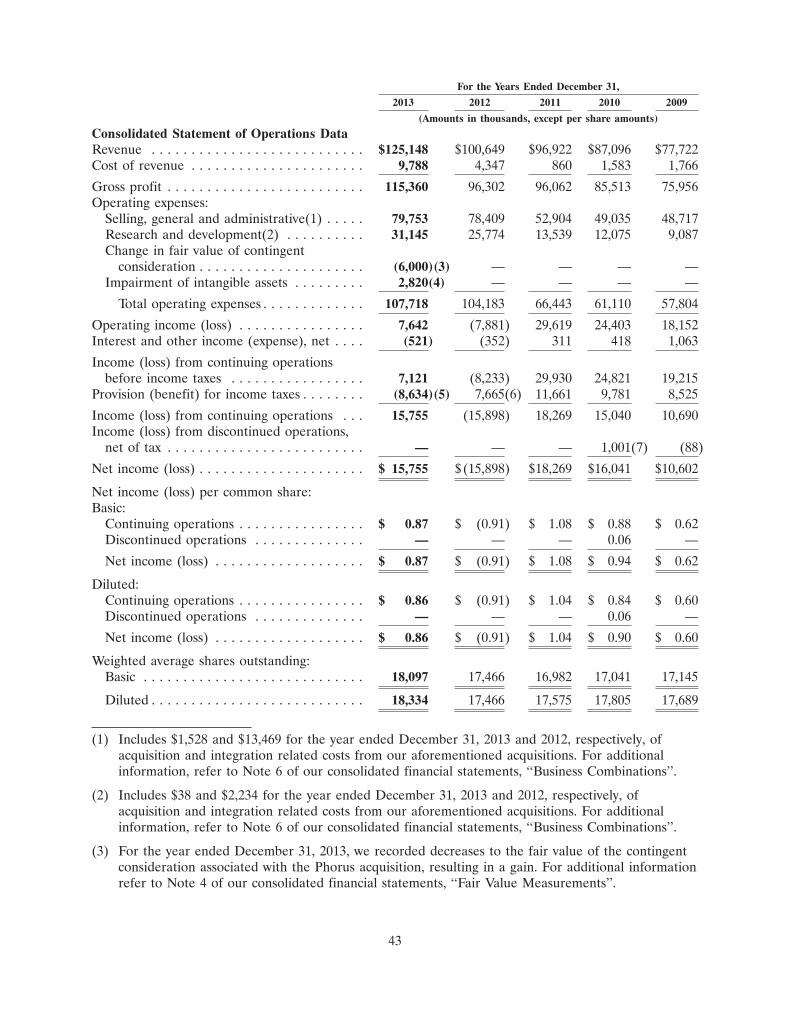
For the Years Ended December 31,
2013 2012 2011 2010 2009
(Amounts in thousands, except per share amounts)
Consolidated Statement of Operations DataRevenue . . . . . . . . . . . . . . . . . . . . . . . . . . . $125,148 $100,649 $96,922 $87,096 $77,722Cost of revenue . . . . . . . . . . . . . . . . . . . . . . 9,788 4,347 860 1,583 1,766
Gross profit . . . . . . . . . . . . . . . . . . . . . . . . . 115,360 96,302 96,062 85,513 75,956Operating expenses:
Selling, general and administrative(1) . . . . . 79,753 78,409 52,904 49,035 48,717Research and development(2) . . . . . . . . . . 31,145 25,774 13,539 12,075 9,087Change in fair value of contingent
consideration . . . . . . . . . . . . . . . . . . . . . (6,000)(3) — — — —Impairment of intangible assets . . . . . . . . . 2,820(4) — — — —
Total operating expenses . . . . . . . . . . . . . 107,718 104,183 66,443 61,110 57,804
Operating income (loss) . . . . . . . . . . . . . . . . 7,642 (7,881) 29,619 24,403 18,152Interest and other income (expense), net . . . . (521) (352) 311 418 1,063
Income (loss) from continuing operationsbefore income taxes . . . . . . . . . . . . . . . . . 7,121 (8,233) 29,930 24,821 19,215
Provision (benefit) for income taxes . . . . . . . . (8,634)(5) 7,665(6) 11,661 9,781 8,525
Income (loss) from continuing operations . . . 15,755 (15,898) 18,269 15,040 10,690Income (loss) from discontinued operations,
net of tax . . . . . . . . . . . . . . . . . . . . . . . . . — — — 1,001(7) (88)
Net income (loss) . . . . . . . . . . . . . . . . . . . . . $ 15,755 $(15,898) $18,269 $16,041 $10,602
Net income (loss) per common share:Basic:
Continuing operations . . . . . . . . . . . . . . . . $ 0.87 $ (0.91) $ 1.08 $ 0.88 $ 0.62Discontinued operations . . . . . . . . . . . . . . — — — 0.06 —
Net income (loss) . . . . . . . . . . . . . . . . . . . $ 0.87 $ (0.91) $ 1.08 $ 0.94 $ 0.62
Diluted:Continuing operations . . . . . . . . . . . . . . . . $ 0.86 $ (0.91) $ 1.04 $ 0.84 $ 0.60Discontinued operations . . . . . . . . . . . . . . — — — 0.06 —
Net income (loss) . . . . . . . . . . . . . . . . . . . $ 0.86 $ (0.91) $ 1.04 $ 0.90 $ 0.60
Weighted average shares outstanding:Basic . . . . . . . . . . . . . . . . . . . . . . . . . . . . 18,097 17,466 16,982 17,041 17,145
Diluted . . . . . . . . . . . . . . . . . . . . . . . . . . . 18,334 17,466 17,575 17,805 17,689
(1) Includes $1,528 and $13,469 for the year ended December 31, 2013 and 2012, respectively, ofacquisition and integration related costs from our aforementioned acquisitions. For additionalinformation, refer to Note 6 of our consolidated financial statements, ‘‘Business Combinations’’.
(2) Includes $38 and $2,234 for the year ended December 31, 2013 and 2012, respectively, ofacquisition and integration related costs from our aforementioned acquisitions. For additionalinformation, refer to Note 6 of our consolidated financial statements, ‘‘Business Combinations’’.
(3) For the year ended December 31, 2013, we recorded decreases to the fair value of the contingentconsideration associated with the Phorus acquisition, resulting in a gain. For additional informationrefer to Note 4 of our consolidated financial statements, ‘‘Fair Value Measurements’’.
43

(4) For the year ended December 31, 2013, we recorded an impairment charge relating to certainintangibles associated with Phrous. For additional information refer to Note 7 of our consolidatedfinancial statements, ‘‘Goodwill and Other Intangibles’’.
(5) Includes a $7,919 tax benefit as a result of a release of the valuation allowance on U.S. federaldeferred tax assets. For additional information, refer to Note 11 of our consolidated financialstatements, ‘‘Income Taxes’’.
(6) In 2012, we established a valuation allowance against our deferred tax assets as a result ofdetermining that it was more likely than not that our U.S. federal deferred tax assets would not berealized. For additional information, refer to Note 11 of our consolidated financial statements,‘‘Income Taxes’’.
(7) Includes proceeds from a settlement and release agreement, dated June 22, 2010, with DatasatDigital Entertainment, Inc., Beaufort International Group Plc and Datasat CommunicationsLimited (collectively the ‘‘Datasat Parties’’), providing that the Datasat Parties paid us $2,000 andpursuant to which the Datasat Parties would be released from the obligation to pay us any furtherconsideration associated with the purchase of our former digital cinema business on May 9, 2008.
As of December 31,
2013 2012 2011 2010 2009
(In thousands)
Consolidated Balance Sheet DataCash, cash equivalents, and short-term
investments . . . . . . . . . . . . . . . . . . . . . . . . $ 71,029 $ 72,045 $ 85,641 $ 96,131 $ 75,351Working capital . . . . . . . . . . . . . . . . . . . . . . . 71,553 67,169 90,891 95,394 83,725Total assets . . . . . . . . . . . . . . . . . . . . . . . . . . 241,798 247,059 159,470 172,295 154,218Total long-term liabilities . . . . . . . . . . . . . . . . 33,480 39,817 7,886 8,596 5,862Total stockholders’ equity . . . . . . . . . . . . . . . . 183,112 180,926 145,802 147,568 141,824
44

Item 7. Management’s Discussion and Analysis of Financial Condition and Results of Operations
In Management’s Discussion and Analysis of Financial Condition and Results of Operations, ‘‘we,’’‘‘us’’ and ‘‘our’’ refer to DTS, Inc. and its consolidated subsidiaries. References to ‘‘Notes’’ are Notesincluded in our Notes to Consolidated Financial Statements. The financial results for 2012 include SRSLabs, Inc. (‘‘SRS’’) and Phorus, Inc. and Phorus, LLC (collectively ‘‘Phorus’’) from the dates of theirrespective acquisition.
In addition to historical information, the following discussion contains forward-looking statements thatare subject to risks and uncertainties. Actual results may differ substantially from those referred to hereindue to a number of factors, including but not limited to risks described in the section entitled ‘‘Risk Factors’’and elsewhere in this Annual Report. Refer to ‘‘Forward-Looking Statements’’ for a further discussion.
You should read the following discussion and analysis of our financial condition and results ofoperations in conjunction with the consolidated financial statements and the Notes included elsewhere inthis Form 10-K.
Overview
We are a premier audio solutions provider for high-definition entertainment experiences—anytime,anywhere, on any device. We exist to make the world sound better. Our audio solutions are designed toenable recording, delivery and playback of simple, personalized, and immersive high-definition audiowhich are incorporated by hundreds of licensee customers around the world, into an array of consumerelectronics devices, including televisions (‘‘TVs’’), personal computers (‘‘PCs’’), smartphones, tablets,digital media players, video game consoles, Blu-ray Disc players, audio/video receivers (‘‘AVRs’’),soundbars, DVD based products, automotive audio systems, set-top-boxes (‘‘STBs’’), and home theatersystems.
We derive revenues from licensing our audio technologies, copyrights, trademarks, and know-howunder agreements with substantially all of the major consumer audio electronics manufacturers. Ourbusiness model typically provides for these manufacturers to pay us a per-unit amount for DTS-enabledproducts that they manufacture.
We actively engage in intellectual property compliance and enforcement activities focused onidentifying third parties who have either incorporated our technologies, copyrights, trademarks orknow-how without a license or who have under-reported the amount of royalties owed under licenseagreements with us. We continue to invest in our compliance and enforcement infrastructure to supportthe value of our intellectual property to us and our licensees and to improve the long-term realizationof revenues from our intellectual property. As a result of these activities, from time to time, werecognize royalty revenues that relate to consumer electronics manufacturing activities from priorperiods. These royalty recoveries may cause revenues to be higher than expected during a particularreporting period and may not occur in subsequent periods. While we consider such revenues to be apart of our normal operations, we cannot predict such recoveries or the amount or timing of suchrevenues.
Our cost of revenues consists primarily of amortization of acquired intangibles, and also includescosts for products and materials, and payments to third parties for copyrighted material.
Our selling, general and administrative expenses consist primarily of salaries and related benefitsand expenses for personnel engaged in sales and licensee support, as well as costs associated withpromotional and other selling and licensing activities. Selling, general and administrative expenses alsoinclude professional fees, facility-related expenses and other general corporate expenses, includingsalaries and related benefits and expenses for personnel engaged in corporate administration, finance,human resources, information systems and legal.
45
Our research and development costs consist primarily of salaries and related benefits and expensesfor research and development personnel, engineering consulting expenses associated with new productand technology development and quality assurance and testing costs. Research and development costsare expensed as incurred.
Acquisition of SRS
On July 20, 2012, we acquired SRS pursuant to the Agreement and Plan of Merger andReorganization, dated as of April 16, 2012 (the ‘‘Merger Agreement’’), by and among us, DTS MergerSub, Inc., our wholly owned subsidiary (‘‘Merger Sub’’), DTS LLC, a single member limited liabilitycompany and our wholly owned subsidiary (‘‘DTS LLC’’), and SRS. Pursuant to the MergerAgreement, Merger Sub was merged with and into SRS, with SRS surviving the merger as our whollyowned subsidiary (the ‘‘Merger’’). Immediately following the Merger, SRS was merged with and intoDTS LLC, with DTS LLC continuing as the surviving entity and our wholly owned subsidiary.
In connection with the Merger, we issued 2.3 million shares of our common stock and paid$66.9 million in cash to former SRS stockholders and paid $13.3 million in cash to former SRS equityaward holders. Aggregate consideration for this acquisition was valued at $124.8 million, based on a$19.32 per share closing price of our common stock on July 20, 2012.
Acquisition of Phorus’ Assets
On July 5, 2012, we acquired substantially all of the assets of Phorus pursuant to an AssetPurchase Agreement dated the same day (the ‘‘Asset Purchase Agreement’’). Pursuant to the terms ofthe Asset Purchase Agreement, we paid initial cash consideration of $3.0 million upon the closing ofthe acquisition, and may have been required to pay up to an additional $10.0 million in considerationsubject to the achievement of certain revenue milestones. In October 2013, the Asset PurchaseAgreement was amended to reduce the total potential contingent consideration to $2.0 million, and therevenue milestones were reduced to reflect changes made in the Phorus business model.
For additional information relating to the Merger and the Asset Purchase Agreement, refer toNote 6, ‘‘Business Combinations’’.
Executive Summary
Financial Highlights
• Revenues for the quarter and year ended December 31, 2013 were $37.1 million and$125.1 million, respectively, which are record quarterly and annual revenues for us.
• Revenues increased 24% for the year ended December 31, 2013, compared to the same prioryear period.
• Royalty recoveries from intellectual property compliance and enforcement activities increased$3.9 million for the year ended December 31, 2013, compared to the same prior year period.
• Royalties from network-connected markets increased 94% for the year ended December 31,2013, compared to the same prior year period.
Trends, Opportunities, and Challenges
Historically, our revenue has been primarily dependent upon the DVD and Blu-ray Disc basedhome theater markets. Because we are a mandatory technology in the Blu-ray standard, our revenuestream from this market is closely tracking the sales trend of Blu-ray equipped players, game consolesand PCs. However, the market for optical disc based media players, in general, has slowed in favor of agrowing trend toward network-based delivery of entertainment content to network-connected devices—
46

what we call the network-connected markets. In response to this shift in entertainment delivery andconsumption over the past several years, we have transitioned our primary focus to providingend-to-end audio solutions to the network-connected markets, and we believe that our mandatoryposition in the Blu-ray standard has given us the ability to extend the reach of our audio into thegrowing network-connected markets.
We have signed agreements with a number of network-connected digital TV, mobile device and PCmanufacturers to incorporate DTS audio solutions into their products. In 2012, we joined forces withDeluxe Digital Distribution to expand our presence in cloud-based content. In the second quarter of2013, we announced that Best Buy’s CinemaNow is pairing its movie and TV show libraries withpowerful DTS-HD surround sound. In July 2013, our DTS-HD codec was selected by ParamountPictures as a surround sound format for the release of its content in the UltraViolet Common FileFormat, which will further expand our presence in cloud-based content. In September 2013, weannounced that Elemental Technologies and castLabs will support live streaming of DTS-HD contentthrough the MPEG-DASH format, and that Digital Rapids will support the production of DTS-HDcontent in the HTTP Live Streaming (HLS) and Microsoft Smooth Streaming formats. To date, ourpremium audio technologies have been integrated into thousands of titles, and we are actively pursuingother partnerships to expand the integration of our premium audio technologies into streaming content.
One of the largest challenges we face is the growing consumer trend toward open platform, on-lineentertainment consumption and the need to constantly and rapidly evolve our technologies to addressthe emerging consumer electronics markets. We believe that although the trend has begun, anytransition to such open platform, on-line entertainment will take many years. Further, we believe thatthis trend demands that playback devices be capable of processing content originating in any form,whether optical disc based or on-line, which creates a substantial opportunity for our technologies toextend into network-connected products that may not have an optical disc drive. During the transitionperiod, we expect that optical disc based media will continue to contribute meaningfully to ourrevenues, while on-line entertainment formats will continue to grow and thrive.
Further, we currently face challenges regarding the impact of the ongoing global economicdownturn on consumer buying patterns. While we do not have visibility into the timing or extent of aneconomic recovery, we continue to remain optimistic that our revenues will continue to grow.
Critical Accounting Policies and Estimates
Management’s Discussion and Analysis of Financial Condition and Results of Operations are basedupon our consolidated financial statements, which have been prepared in accordance with accountingprinciples generally accepted in the United States of America, and pursuant to the rules andregulations of the SEC. The preparation of our consolidated financial statements requires us to makeestimates and judgments that affect the reported amounts of assets, liabilities, revenues and expenses,and the related disclosures of contingent assets and liabilities. On an ongoing basis, estimates andjudgments are evaluated, including those related to revenue recognition; valuations of goodwill, otherintangible assets and long-lived assets; fair value of contingent consideration; stock-based compensation;income taxes; and business combinations. These estimates and judgments are based on historicalexperience and on various other assumptions that we believe to be reasonable under the circumstances,which form the basis for our judgments about the carrying values of assets and liabilities that are notreadily apparent from other sources. By their nature, estimates are subject to an inherent degree ofuncertainty. Actual results may differ materially from these estimates.
We believe the following accounting policies and estimates are most critical to the understandingof our consolidated financial statements.
• Revenue Recognition. Revenues from arrangements involving license fees, up-front payments andmilestone payments, which are received or billable by us in connection with other rights and
47

services that represent continuing obligations of ours, are deferred until all of the elements havebeen delivered or until we have established objective and verifiable evidence of the fair value ofthe undelivered elements.
We actively police and enforce our intellectual property, and pursue third parties who utilize ourintellectual property without a license or who have under-reported the amount of royalties owedunder a license agreement with us. As a result of these activities, from time to time, we mayrecognize royalty revenues that relate to infringements that occurred in prior periods. Theseroyalty recoveries may cause revenues to be higher than expected during a particular reportingperiod and may not occur in subsequent periods. Differences between amounts initiallyrecognized and amounts subsequently audited or reported as an adjustment to those amountsdue from licensees, will be recognized in the period such adjustment is determined orcontracted, as appropriate, as a change in accounting estimate.
We make estimates and judgments when determining whether the collectibility of license feesreceivable from licensees is reasonably assured. We assess the collectibility of accrued licensefees based on a number of factors, including past transaction history with licensees and thecredit-worthiness of licensees. If it is determined that collection is not reasonably assured, therevenue is recognized when collectibility becomes reasonably assured, assuming all other revenuerecognition criteria have been met, which is generally upon receipt of cash. Managementestimates regarding collectibility impact the actual revenues recognized each period and thetiming of the recognition of revenues. Our assumptions and judgments regarding futurecollectibility could differ from actual events, thus materially impacting our consolidated financialstatements.
Revenues from licensing audio technology, trademarks, and know-how are generated fromlicensing agreements with consumer electronics products manufacturers that generally pay aper-unit license fee for products manufactured or shipped, as set forth in those licenseagreements. Licensees generally report manufacturing or shipping information within 30 to60 days after the end of the quarter in which such activity takes place. Consequently, werecognize revenue from these licensing agreements on a three-month lag basis, generally in thequarter following the quarter of manufacture or shipment, provided amounts are fixed ordeterminable and collection is reasonably assured, since we cannot reliably estimate the amountof revenue earned prior to our receipt of such reports. Use of this lag method allows for thereceipt of licensee royalty reports prior to the recognition of revenue.
Certain cash collections from per-unit licensing agreements acquired with SRS during the yearended December 31, 2012 were the result of product shipments prior to July 20, 2012, theacquisition date. Therefore, we did not recognize revenue from these per-unit licensingagreements and certain other licensing arrangements acquired with SRS during the year endedDecember 31, 2012. Accordingly, we have recognized revenue from per-unit licensing agreementsacquired with SRS that resulted from product shipments after our acquisition of SRS.
For certain licensing agreements, licensees pay a flat fee for the right to license certaintechnology over the contract term. Typically, the agreement stipulates a flat fee that correspondsto a minimum number of units or dollars, with additional per-unit fees for any units or dollarsexceeding the minimum. For these agreements, we have continuing obligations relating to otherrights and services provided over the term of the contract. As such, we recognize the minimumor flat fee amount on these agreements as revenue ratably over the duration of contract term asall contractual obligations are met. Consistent with the aforementioned policy for per-unitlicense fee agreements, we recognize revenue relating to any additional per-unit fees on aquarter lag basis, since we cannot reliably estimate the amount of revenue earned fromadditional units manufactured or shipped prior to the receipt of licensee reports.
48
• Goodwill, Other Intangible Assets and Long-Lived Assets. We evaluate the carrying value ofgoodwill and indefinite-lived intangibles for impairment on an annual basis as of October 31 ofeach year, or more frequently if events or circumstances indicate that the goodwill and otherintangibles might be impaired. We evaluate goodwill for impairment at the reporting unit level,which is identified based on our current organizational structure, availability of discrete financialinformation, and economic similarity of the components under our operating segment. Duringthe annual strategic planning process in the third quarter of 2013, we changed the businessmodel relating to Phorus resulting in the identification of the Phorus business as a separatereporting unit from the rest of DTS for the purpose of testing goodwill for impairment.Goodwill was reassigned to each reporting unit using the relative fair value approach. As a resultof revised forecasts developed during our annual strategic planning process and lower thanexpected historical results in the Phorus reporting unit, we concluded that there were indicationsof potential impairment of the goodwill and indefinite-lived intangibles attributable to thePhorus reporting unit during the third quarter of 2013. Therefore, we performed an interimimpairment test on the Phorus reporting unit. Subsequently, we performed our annualassessment of impairment for both reporting units.
Impairment of indefinite-lived intangibles is tested by estimating the fair value of the assets, andan impairment charge would be recorded to the extent that the carrying amount of such assetsexceeds the estimated fair value. Evaluation of the recoverability of goodwill includes valuationof the underlying reporting unit using fair value techniques, which may include both income andmarket approaches. If the carrying value of the reporting unit exceeds its estimated fair value, orif the reporting unit has a negative carrying value and we believe it is more likely than not that agoodwill impairment exists, we would proceed to estimate the fair value of the goodwill andcompare it to the carrying value to test for impairment and quantify an impairment charge, ifany. We would record an impairment charge in an amount equal to the excess of the carryingvalue of the goodwill over the estimated fair value. Goodwill impairment is measured subsequentto the completion of any impairment of all other intangible and long-lived assets associated withthe reporting unit.
We periodically assess potential impairments of other definite-lived intangibles and long-livedassets. An impairment review is performed whenever events or changes in circumstances indicatethat the carrying value may not be recoverable. Factors considered by us include, but are notlimited to, significant underperformance relative to expected historical or projected futureoperating results; significant changes in the manner of use of the acquired assets or projectedfuture operating results; significant changes in the strategy of our overall business; andsignificant negative industry or economic trends. Due to the aforementioned revised forecastsand the lower than expected historical results for the Phorus business, we also tested definite-lived intangibles associated with the Phorus reporting unit for impairment in the third quarter of2013.
If we are unable to finalize the results of impairment tests prior to the issuance of our financialstatements and an impairment charge is probable and can be reasonably estimated, we wouldrecognize our best estimate of the loss in our current period financial statements and disclosethat the amount is an estimate. We would then recognize any adjustments to that estimate insubsequent reporting periods, once we have finalized the results of the impairment tests.
For additional information refer to Notes 2 and 7, ‘‘Significant Accounting Policies’’ and‘‘Goodwill and Other Intangibles’’, respectively.
Significant judgments are required in assessing impairment of goodwill and other intangibles,which includes estimating future revenues, cash flows, determining appropriate discount andgrowth rates and other assumptions. Changes in these estimates and assumptions could
49

materially affect the amount of impairment charges, if any. The estimates used representmanagement’s best estimates, which we believe to be reasonable, but future declines in businessperformance may impair the recoverability of our goodwill, other intangibles and long-livedassets.
• Stock-based Compensation. Stock-based compensation charges for stock options are based uponthe fair value of each award on the date of grant using the Black-Scholes option pricing model.This model requires that we estimate a risk free interest rate, expected lives, dividend yield, andthe expected volatility of our stock. Additionally, we reduce stock-based compensation expensefor estimated forfeitures based on our historical experience. We estimate forfeitures at the timeof the grant and revise our estimate, if necessary, in subsequent periods if actual forfeituresdiffer from our estimate. We believe this to be a critical accounting estimate because if any ofthe estimates above require significant changes, these changes could result in fluctuatingexpenses that could have a material impact on our results of operations.
• Income Taxes. We must make estimates and judgments in determining income tax expense forfinancial statement purposes. These estimates and judgments occur in the calculation of certaintax assets and liabilities, which arise from differences in the timing of recognition of revenue andexpense for tax and financial statement purposes. Significant changes to these estimates mayresult in an increase or decrease to our tax provision in a subsequent period.
We must assess the likelihood that we will be able to utilize our deferred tax assets. Deferred taxassets are reduced by a valuation allowance, if, based upon the weight of available evidence, it ismore likely than not that we will not realize some portion or all of the deferred tax assets. Weconsider all available positive and negative evidence when assessing whether it is more likelythan not that deferred tax assets are recoverable. We consider evidence such as our pastoperating results, scheduled reversals of deferred tax liabilities, the existence of cumulative lossesin previous periods and our forecast of future taxable income. We believe this to be a criticalaccounting estimate, because when we establish or reduce the valuation allowance againstdeferred tax assets, our provision for income taxes will increase or decrease, which could have amaterial impact on our results of operations.
We have not provided for U.S. income or foreign withholding taxes on the undistributedearnings of our foreign subsidiaries, because we intend to reinvest such earnings indefinitely.Should we decide to remit this income to the U.S. in a future period, our provision for incometaxes may increase materially in the period that our intent changes.
Long-term deferred tax assets and other long-term liabilities, at December 31, 2013 and 2012,include unrecognized tax benefits of $9.7 million and $11.3 million, respectively, for bothdomestic and foreign issues. Inherent uncertainties exist in estimating accruals for uncertain taxpositions due to the progress of income tax audits and changes in tax law, both legislated andconcluded through the various jurisdictions’ tax court systems. Although the outcome of taxaudits is always uncertain, management believes that it has appropriate support for the positionstaken on its tax returns and that its annual tax provision includes amounts sufficient to pay anyassessments. Nonetheless, the amounts ultimately paid, if any, upon resolution of the issuesraised by the taxing authorities may differ materially from the amounts accrued.
• Business Combinations. We allocate the fair value of purchase consideration to the tangibleassets acquired, liabilities assumed and intangible assets acquired, including in-process researchand development (‘‘IPR&D’’), based on their estimated fair values. The excess of the fair valueof purchase consideration over the fair values of these identifiable assets and liabilities isrecorded as goodwill. We engage independent consultants to assist us in determining the fairvalues of assets acquired and liabilities assumed. Such valuations require management to make
50
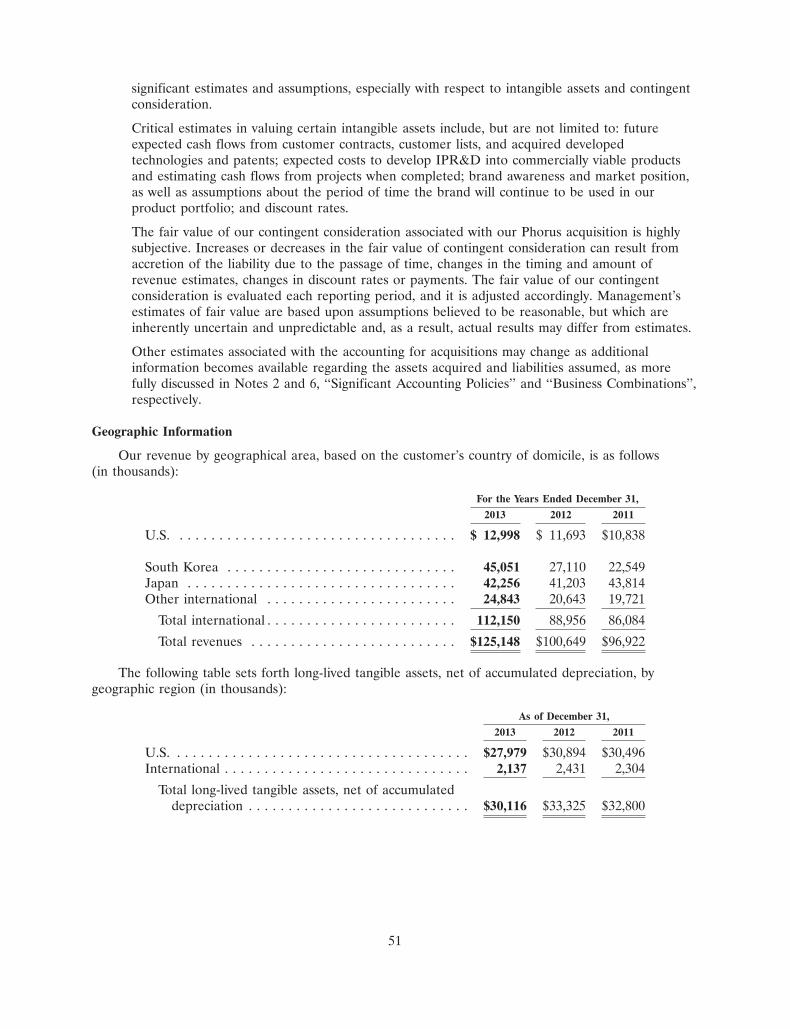
significant estimates and assumptions, especially with respect to intangible assets and contingentconsideration.
Critical estimates in valuing certain intangible assets include, but are not limited to: futureexpected cash flows from customer contracts, customer lists, and acquired developedtechnologies and patents; expected costs to develop IPR&D into commercially viable productsand estimating cash flows from projects when completed; brand awareness and market position,as well as assumptions about the period of time the brand will continue to be used in ourproduct portfolio; and discount rates.
The fair value of our contingent consideration associated with our Phorus acquisition is highlysubjective. Increases or decreases in the fair value of contingent consideration can result fromaccretion of the liability due to the passage of time, changes in the timing and amount ofrevenue estimates, changes in discount rates or payments. The fair value of our contingentconsideration is evaluated each reporting period, and it is adjusted accordingly. Management’sestimates of fair value are based upon assumptions believed to be reasonable, but which areinherently uncertain and unpredictable and, as a result, actual results may differ from estimates.
Other estimates associated with the accounting for acquisitions may change as additionalinformation becomes available regarding the assets acquired and liabilities assumed, as morefully discussed in Notes 2 and 6, ‘‘Significant Accounting Policies’’ and ‘‘Business Combinations’’,respectively.
Geographic Information
Our revenue by geographical area, based on the customer’s country of domicile, is as follows(in thousands):
For the Years Ended December 31,
2013 2012 2011
U.S. . . . . . . . . . . . . . . . . . . . . . . . . . . . . . . . . . . . $ 12,998 $ 11,693 $10,838
South Korea . . . . . . . . . . . . . . . . . . . . . . . . . . . . . 45,051 27,110 22,549Japan . . . . . . . . . . . . . . . . . . . . . . . . . . . . . . . . . . 42,256 41,203 43,814Other international . . . . . . . . . . . . . . . . . . . . . . . . 24,843 20,643 19,721
Total international . . . . . . . . . . . . . . . . . . . . . . . . 112,150 88,956 86,084
Total revenues . . . . . . . . . . . . . . . . . . . . . . . . . . $125,148 $100,649 $96,922
The following table sets forth long-lived tangible assets, net of accumulated depreciation, bygeographic region (in thousands):
As of December 31,
2013 2012 2011
U.S. . . . . . . . . . . . . . . . . . . . . . . . . . . . . . . . . . . . . . $27,979 $30,894 $30,496International . . . . . . . . . . . . . . . . . . . . . . . . . . . . . . . 2,137 2,431 2,304
Total long-lived tangible assets, net of accumulateddepreciation . . . . . . . . . . . . . . . . . . . . . . . . . . . . $30,116 $33,325 $32,800
51
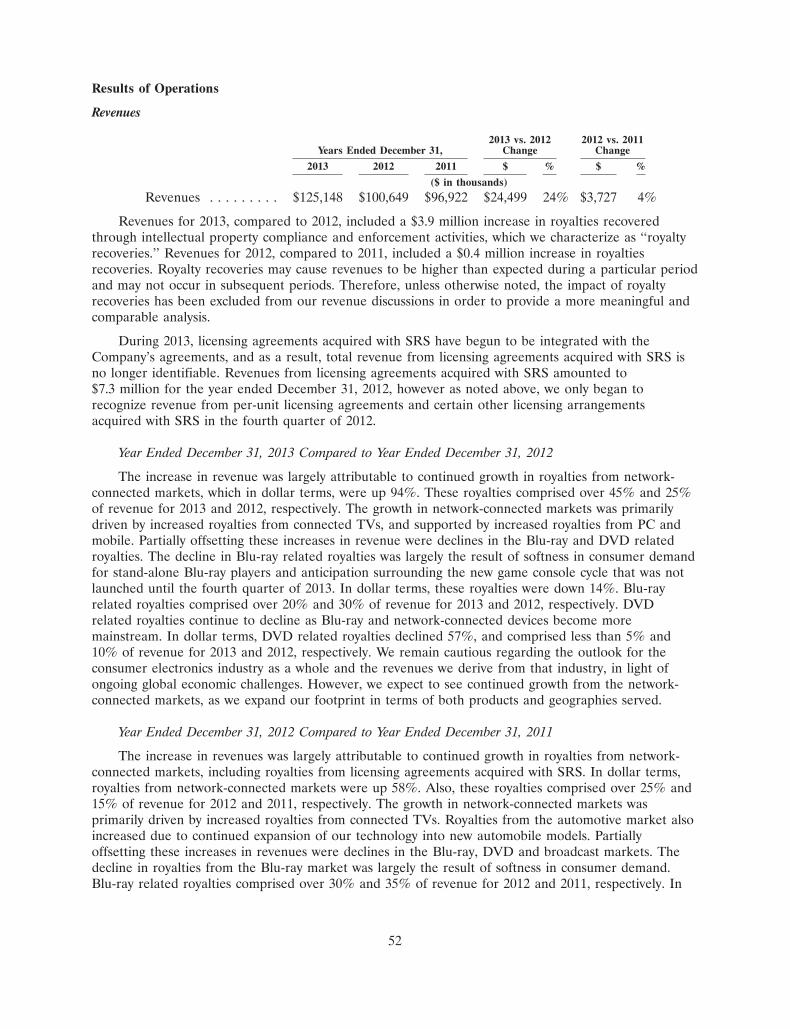
Results of Operations
Revenues
2013 vs. 2012 2012 vs. 2011Years Ended December 31, Change Change
2013 2012 2011 $ % $ %
($ in thousands)
Revenues . . . . . . . . . $125,148 $100,649 $96,922 $24,499 24% $3,727 4%
Revenues for 2013, compared to 2012, included a $3.9 million increase in royalties recoveredthrough intellectual property compliance and enforcement activities, which we characterize as ‘‘royaltyrecoveries.’’ Revenues for 2012, compared to 2011, included a $0.4 million increase in royaltiesrecoveries. Royalty recoveries may cause revenues to be higher than expected during a particular periodand may not occur in subsequent periods. Therefore, unless otherwise noted, the impact of royaltyrecoveries has been excluded from our revenue discussions in order to provide a more meaningful andcomparable analysis.
During 2013, licensing agreements acquired with SRS have begun to be integrated with theCompany’s agreements, and as a result, total revenue from licensing agreements acquired with SRS isno longer identifiable. Revenues from licensing agreements acquired with SRS amounted to$7.3 million for the year ended December 31, 2012, however as noted above, we only began torecognize revenue from per-unit licensing agreements and certain other licensing arrangementsacquired with SRS in the fourth quarter of 2012.
Year Ended December 31, 2013 Compared to Year Ended December 31, 2012
The increase in revenue was largely attributable to continued growth in royalties from network-connected markets, which in dollar terms, were up 94%. These royalties comprised over 45% and 25%of revenue for 2013 and 2012, respectively. The growth in network-connected markets was primarilydriven by increased royalties from connected TVs, and supported by increased royalties from PC andmobile. Partially offsetting these increases in revenue were declines in the Blu-ray and DVD relatedroyalties. The decline in Blu-ray related royalties was largely the result of softness in consumer demandfor stand-alone Blu-ray players and anticipation surrounding the new game console cycle that was notlaunched until the fourth quarter of 2013. In dollar terms, these royalties were down 14%. Blu-rayrelated royalties comprised over 20% and 30% of revenue for 2013 and 2012, respectively. DVDrelated royalties continue to decline as Blu-ray and network-connected devices become moremainstream. In dollar terms, DVD related royalties declined 57%, and comprised less than 5% and10% of revenue for 2013 and 2012, respectively. We remain cautious regarding the outlook for theconsumer electronics industry as a whole and the revenues we derive from that industry, in light ofongoing global economic challenges. However, we expect to see continued growth from the network-connected markets, as we expand our footprint in terms of both products and geographies served.
Year Ended December 31, 2012 Compared to Year Ended December 31, 2011
The increase in revenues was largely attributable to continued growth in royalties from network-connected markets, including royalties from licensing agreements acquired with SRS. In dollar terms,royalties from network-connected markets were up 58%. Also, these royalties comprised over 25% and15% of revenue for 2012 and 2011, respectively. The growth in network-connected markets wasprimarily driven by increased royalties from connected TVs. Royalties from the automotive market alsoincreased due to continued expansion of our technology into new automobile models. Partiallyoffsetting these increases in revenues were declines in the Blu-ray, DVD and broadcast markets. Thedecline in royalties from the Blu-ray market was largely the result of softness in consumer demand.Blu-ray related royalties comprised over 30% and 35% of revenue for 2012 and 2011, respectively. In
52
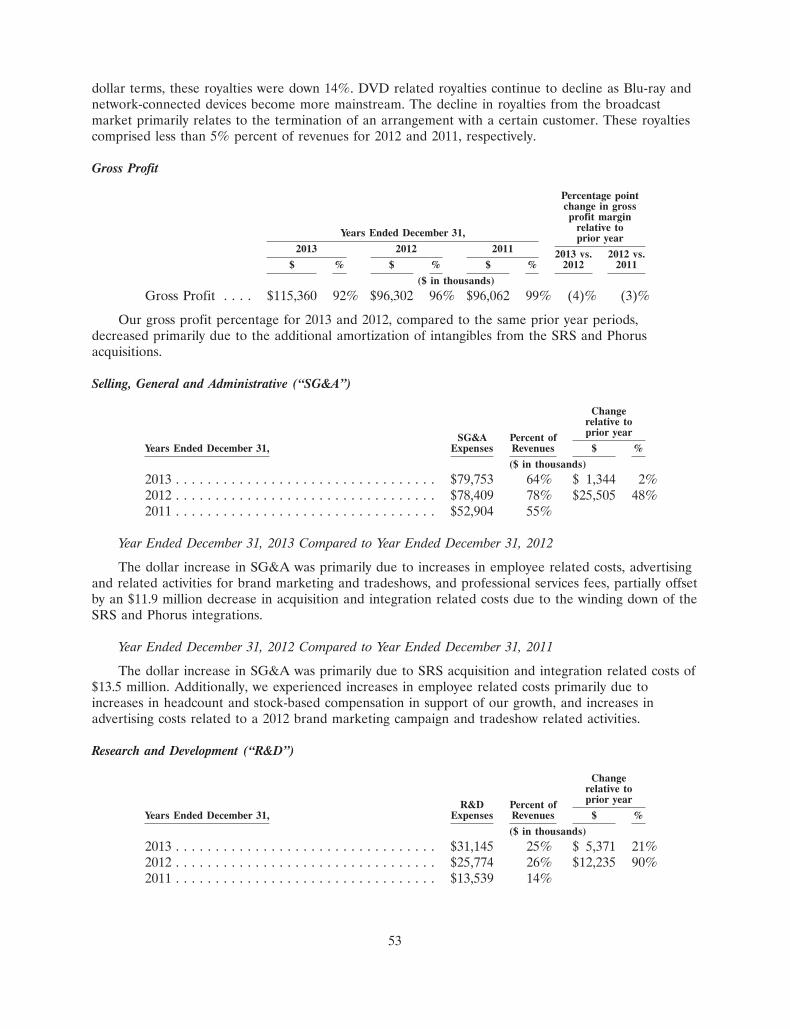
dollar terms, these royalties were down 14%. DVD related royalties continue to decline as Blu-ray andnetwork-connected devices become more mainstream. The decline in royalties from the broadcastmarket primarily relates to the termination of an arrangement with a certain customer. These royaltiescomprised less than 5% percent of revenues for 2012 and 2011, respectively.
Gross Profit
Percentage pointchange in grossprofit margin
relative toYears Ended December 31, prior year2013 2012 2011 2013 vs. 2012 vs.
$ % $ % $ % 2012 2011
($ in thousands)
Gross Profit . . . . $115,360 92% $96,302 96% $96,062 99% (4)% (3)%
Our gross profit percentage for 2013 and 2012, compared to the same prior year periods,decreased primarily due to the additional amortization of intangibles from the SRS and Phorusacquisitions.
Selling, General and Administrative (‘‘SG&A’’)
Changerelative toprior yearSG&A Percent of
Years Ended December 31, Expenses Revenues $ %
($ in thousands)
2013 . . . . . . . . . . . . . . . . . . . . . . . . . . . . . . . . . $79,753 64% $ 1,344 2%2012 . . . . . . . . . . . . . . . . . . . . . . . . . . . . . . . . . $78,409 78% $25,505 48%2011 . . . . . . . . . . . . . . . . . . . . . . . . . . . . . . . . . $52,904 55%
Year Ended December 31, 2013 Compared to Year Ended December 31, 2012
The dollar increase in SG&A was primarily due to increases in employee related costs, advertisingand related activities for brand marketing and tradeshows, and professional services fees, partially offsetby an $11.9 million decrease in acquisition and integration related costs due to the winding down of theSRS and Phorus integrations.
Year Ended December 31, 2012 Compared to Year Ended December 31, 2011
The dollar increase in SG&A was primarily due to SRS acquisition and integration related costs of$13.5 million. Additionally, we experienced increases in employee related costs primarily due toincreases in headcount and stock-based compensation in support of our growth, and increases inadvertising costs related to a 2012 brand marketing campaign and tradeshow related activities.
Research and Development (‘‘R&D’’)
Changerelative toprior yearR&D Percent of
Years Ended December 31, Expenses Revenues $ %
($ in thousands)
2013 . . . . . . . . . . . . . . . . . . . . . . . . . . . . . . . . . $31,145 25% $ 5,371 21%2012 . . . . . . . . . . . . . . . . . . . . . . . . . . . . . . . . . $25,774 26% $12,235 90%2011 . . . . . . . . . . . . . . . . . . . . . . . . . . . . . . . . . $13,539 14%
53

Year Ended December 31, 2013 Compared to Year Ended December 31, 2012
The dollar increase in R&D was primarily due to employee related costs, including ouracquisitions of SRS and Phorus in July 2012, and consultant related expenses to support our growth,partially offset by a $2.2 million decrease in acquisition and integration related costs due to the windingdown of the SRS and Phorus integrations.
Year Ended December 31, 2012 Compared to Year Ended December 31, 2011
The dollar increase in R&D was due to SRS acquisition and integration related costs of$2.2 million. Additionally, we experienced increases in employee related costs primarily due to increasesin headcount and stock-based compensation, and increases in consultant and travel related expenses tosupport our growth.
Change in Fair Value of Contingent Consideration
For the year ended December 31, 2013, we recorded decreases to the fair value of the contingentconsideration associated with the Phorus acquisition, resulting in a gain of $6.0 million recorded as aseparate line in the consolidated statements of operations. The change in the fair value was primarilydue to revised forecasts for the Phorus business and an amendment to the terms of the contingentconsideration arrangement resulting in lowered total potential consideration and revenue milestones.Considerable judgment is required in the fair value estimate, and the use of different assumptions inour valuation could result in materially different fair value estimates. We remeasure the contingentconsideration to the estimated fair value at each reporting period. For additional information refer toNote 4, ‘‘Fair Value Measurements’’.
Impairment of Intangible Assets
For the year ended December 31, 2013, we recorded an impairment charge of $2.8 million withinoperating expenses in the consolidated statements of operations. The impairment charge representedwrite-downs of the carrying values of certain indefinite-lived and definite-lived intangibles, which weredeemed to be fully or partially unrecoverable based on revised expected future cash flows. Significantjudgments are required in assessing impairment of intangibles, which includes estimating futurerevenues, cash flows, determining appropriate discount and growth rates and other assumptions.Changes in these estimates and assumptions could materially affect the amount of impairment charge.We periodically assess intangibles for impairment when events or changes in circumstances indicatesuch assets’ carrying value may not be recoverable. For additional information refer to Note 7,‘‘Goodwill and Other Intangibles’’.
Interest and Other Income (Expense), Net
Years Ended 2013 vs. 2012 2013 vs. 2011December 31, Change Change
2013 2012 2011 $ % $ %
($ in thousands)
Interest and other income (expense), net . . . . . . $(521) $(352) $311 $(169) (48)% $(663) (213)%
The decrease in interest and other income (expense), net, for 2013 and 2012, compared to thesame prior year periods, was primarily due to the effects of translation for certain foreign subsidiariesto the U.S. dollar or functional currency and interest expense associated with the credit facility that weentered into in July 2012.
54

Income Taxes
Years Ended December 31,
2013 2012 2011
($ in thousands)
Provision (benefit) for income taxes . . . . . . . . . . . . $(8,634) $7,665 $11,661Effective tax rate . . . . . . . . . . . . . . . . . . . . . . . . . . . (121)% (93)% 39%
The effective tax rate for 2013 differed from the U.S. statutory rate of 35% primarily due to therelease of the valuation allowance on U.S. federal deferred tax assets and the favorable settlement offederal and state tax audits.
The effective tax rate for 2012 differed from the U.S. statutory rate of 35% primarily due to stateincome taxes, the establishment of a valuation allowance against our deferred tax assets, IRS settlementof the 2007 tax audit, the effect of different tax rates in foreign jurisdictions, non-deductible transactioncosts in conjunction with the acquisition of SRS, and non-deductible stock-based compensation,partially offset by a decrease in the reserve for uncertain tax positions, and state R&D credits.
The effective tax rate for 2011 differed from the U.S. statutory rate of 35% primarily due to stateincome taxes, an increase in the reserve for uncertain tax positions, non-deductible stock-basedcompensation and the effect of different tax rates in foreign jurisdictions, partially offset by R&Dcredits.
Our rates have historically differed from statutory rates due to varying foreign income tax ratesand foreign withholding taxes, non-deductible stock-based compensation, and R&D credits. Due in partto the transfer of certain Japan and Taiwan intellectual property rights discussed in Note 11, ‘‘IncomeTaxes’’, we expect our annualized effective tax rate to be generally lower than the U.S. statutory ratefor the foreseeable future.
Liquidity and Capital Resources
At December 31, 2013, we had cash, cash equivalents, and short-term investments of $71.0 million,compared to $72.0 million at December 31, 2012. At December 31, 2013, $61.5 million of cash, cashequivalents, and short-term investments was held by our foreign subsidiaries. If these funds are neededfor our operations in the U.S., they would be subject to U.S. federal and state income taxes, lessapplicable foreign tax credits. However, our intent is to permanently reinvest funds outside of the U.S.and our current plans do not demonstrate a need to repatriate them to fund our U.S. operations.
Net cash provided by operating activities was $21.4 million, $14.8 million and $24.2 million for theyears ended December 31, 2013, 2012 and 2011, respectively. Cash flows from operating activities wereimpacted by income (loss) from operations, adjusted for non-cash items, including stock-basedcompensation, depreciation and amortization, and the effect of changes in working capital and otheroperating activities. The operating cash flows for the year ended December 31, 2013 were also largelyimpacted by the gain associated with the change in fair value of the contingent consideration liability,the loss associated with the impairment of certain intangibles, as well as the timing of payments forcertain liabilities. Further, under existing service arrangements, we may be obligated to pay up to$7.5 million over the next three years if certain milestones are achieved. The operating cash flows forthe year ended December 31, 2012 were impacted by an increase in deferred revenues and the timingof collections from accounts receivable. The operating cash flows for the year ended December 31,2011 were largely impacted by the recognition of certain deferred revenues, a reduction in our accrualfor certain incentive compensation costs, the timing of payments for certain liabilities and otherworking capital activities.
We typically use cash in investing activities primarily to purchase office equipment, fixtures,computer hardware and software, and engineering and certification equipment, for securing patent and
55

trademark protection for our proprietary technology and brand name, and to purchase investments suchas bank certificates of deposit and municipal bonds. Net cash provided by investing activities totaled$10.5 million for the year ended December 31, 2013, which primarily resulted from investmentmaturities net of purchases, partially offset by purchases of investments and property and equipment.Net cash used in investing activities totaled $29.2 million for the year ended December 31, 2012 andwere primarily payments related to the acquisition of SRS, partially offset by net proceeds frominvestment maturities and sales. Cash provided by investing activities totaled $10.5 million for the yearended December 31, 2011, and were primarily from investment maturities, net of purchases.
Net cash used in financing activities totaled $23.7 million for the year ended December 31, 2013,which were primarily purchases of treasury stock, partially offset by proceeds from the issuance ofcommon stock under stock-based compensation plans, including related tax benefits. Net cash providedby financing activities totaled $25.3 million for the year ended December 31, 2012, which resultedprimarily from a new credit facility and the recognition of certain windfall tax benefits, partially offsetby purchases of treasury stock. For the year ended December 31, 2011, cash used in financing activitieswas $29.5 million and primarily consisted of treasury stock purchases partially offset by proceeds fromthe issuance of common stock under our stock-based compensation plans, including related tax benefits.
Acquisitions
On July 20, 2012, we acquired SRS for an aggregate of $80.2 million in cash and 2.3 million sharesof our common stock. The purchase price was funded with our existing cash, liquidated investments,borrowings of $30.0 million under a credit facility described below and the issuance of common stockfrom treasury.
On July 5, 2012, we acquired substantially all of the assets of Phorus for initial cash considerationof $3.0 million. In connection with the amended contingent consideration arrangement related toPhorus, we now may be required to pay up to an additional $1.5 million in consideration subject to theachievement of certain revenue milestones. As of December 31, 2013, $0.5 million was paid out underthe amended contingent consideration arrangement.
For additional information, refer to Notes 6 and 10, ‘‘Business Combinations’’ and ‘‘Commitmentsand Contingencies,’’ respectively.
Credit Facility
In connection with the consummation of the Merger, we entered into a Loan Agreement, dated asof July 18, 2012 (the ‘‘Loan Agreement’’), between us and Union Bank, N.A., together with the otherlenders thereunder from time to time. The Loan Agreement provides us with a $30.0 million revolvingline of credit (the ‘‘Revolver’’), with a five million sublimit for the issuance of standby and commercialletters of credit, to use to finance permitted acquisitions and for working capital and general corporatepurposes. We may increase the Revolver by up to $20.0 million subject to certain conditions. Proceedsfrom the Revolver were used to finance the cash portion of the Merger consideration as mentionedabove. As of December 31, 2013, $30.0 million was outstanding under the Revolver. All advances underthe Revolver will become due and payable on July 18, 2015, or earlier in the event of a default. Weanticipate that repayment of the Revolver will be satisfied with our future available cash and cashequivalents and operating cash flows or by renewal of the credit facility. As of and during the yearended December 31, 2013, we were in compliance with all loan covenants. For additional informationrelating to the Loan Agreement, refer to Note 9, ‘‘Long-term Debt’’.
Repurchases of Common Stock
In May 2011, our Board of Directors authorized, subject to certain business and market conditions,the purchase of up to one million shares of our common stock in the open market or in privately
56

negotiated transactions. Through December 7, 2011, all shares of common stock under thisauthorization were repurchased for an aggregate cost of $32.3 million.
Subsequent to December 31, 2013, our Board of Directors authorized, subject to certain businessand market conditions, the purchase of up to two million shares of our common stock in the openmarket or in privately negotiated transactions. Through December 16, 2013, all shares of common stockunder this authorization were repurchased for an aggregate of $39.4 million.
In February 2014, our Board of Directors authorized, subject to certain business and marketconditions, the purchase of up to two million shares of our common stock in the open market or inprivately negotiated transactions.
As our investments matured in 2013, we focused our investment strategy in cash equivalents toprovide more liquidity and available cash to fund our repurchases of common stock, and we may usethis same strategy to fund future repurchases.
Working Capital and Capital Expenditure Requirements
We believe that our cash, cash equivalents, short-term investments and cash flows from operationswill be sufficient to satisfy our working capital and capital expenditure requirements for at least thenext twelve months. However, as a result our acquisition of SRS, we entered into a new credit facilityduring the third quarter of 2012 as noted above. Changes in our operating plans, including lower thananticipated revenues, increased expenses, acquisitions of businesses, products or technologies or otherevents, including those described in ‘‘Risk Factors’’ included elsewhere herein and in other filings, maycause us to seek additional debt or equity financing on an accelerated basis. Financing may not beavailable on acceptable terms, or at all, particularly given current economic conditions, including lack ofconfidence in the financial markets and limited availability of capital and demand for debt and equitysecurities. Our failure to raise capital when needed could negatively impact our growth plans and ourfinancial condition and results of operations. Additional equity financing may be dilutive to the holdersof our common stock and debt financing, if available, and may involve significant cash paymentobligations and financial or operational covenants that restrict our ability to operate our business.
Contractual Obligations and Commitments
Future payments due under long-term debt and non-cancelable lease obligations as ofDecember 31, 2013 were as follows (in thousands):
Payments due by period
Less than 1 - 3 3 - 5 More than1 year years years 5 years Total
Long-term debt . . . . . . . . . . . . . . $ — $30,000 $ — $ — $30,000Operating leases . . . . . . . . . . . . . $2,923 $ 4,032 $1,308 $1,228 $ 9,491
Purchase orders or contracts for the purchase of other goods and services are not included in thetable above. We are not able to determine the aggregate amount of such purchase orders thatrepresent contractual obligations, as purchase orders may represent authorizations to purchase ratherthan binding agreements. Our purchase orders are typically based on our current needs and aretypically fulfilled by our vendors within short time horizons.
As of December 31, 2013, our total amount of gross unrecognized tax benefits was $9.7 millionbefore netting with deferred tax assets for tax credit carryforwards and is considered a long-termobligation. We are currently unable to make reasonably reliable estimates of the periods of cashsettlements associated with these obligations.
57
Item 7A. Quantitative and Qualitative Disclosures About Market Risk
Market risk represents the risk of loss arising from adverse changes in market rates and foreignexchange rates.
Our interest rate risk relates primarily to interest income from investments and interest expense onour debt. Our interest income is sensitive to changes in the general level of U.S. interest rates,particularly since a significant portion of our investments were and may in the future be in short-termand long-term marketable securities, U.S. government securities and corporate bonds. Due to thenature and maturity of our short-term investments, we have concluded that there is no material marketrisk exposure to our principal at December 31, 2013. The average maturity of our investment portfoliois less than one year. As of December 31, 2013, a one percentage point change in interest rates forcash and investments throughout a one-year period would have an annual effect of approximately$0.7 million on our income before income taxes. As of December 31, 2013, a one percentage pointchange in interest rates for debt throughout a one-year period would have an immaterial annual effecton our consolidated statement of operations.
During the year ended December 31, 2013, we derived nearly 90% of our revenues from salesoutside the U.S. and maintain research, sales, marketing, or business development offices in severalforeign countries. Therefore, our results could be negatively affected by factors such as changes inforeign currency exchange rates, trade protection measures, longer accounts receivable collectionpatterns, and changes in regional or worldwide economic or political conditions. The risks of ourinternational operations are mitigated in part by the extent to which our revenues are denominated inU.S. dollars and, accordingly, we are not exposed to significant foreign currency risk on these items. Wedo have limited foreign currency risk on certain revenues and operating expenses such as salaries andoverhead costs of our foreign operations and a small amount of cash maintained by these operations.Revenues denominated in foreign currencies accounted for approximately 3% of total revenues during2013. Operating expenses, including cost of sales, for our foreign subsidiaries were approximately$24.0 million in 2013. Based upon these expenses for 2013, a 10% or greater change in foreign currencyrates throughout a one-year period could have a material impact on our income before income taxes.
Our international business is subject to risks, including, but not limited to, differing economicconditions, changes in political climate, differing tax structures, other regulations and restrictions, andforeign exchange rate volatility when compared to the U.S. dollar. Accordingly, our future results couldbe materially impacted by changes in these or other factors.
We are also affected by exchange rate fluctuations as the financial statements of our foreignsubsidiaries are translated into the U.S. dollar in consolidation. As exchange rates vary, these results,when translated, may vary from expectations and could adversely or positively impact overallprofitability. During 2013, the impact of foreign exchange rate fluctuations related to translation of ourforeign subsidiaries’ financial statements was immaterial to comprehensive income.
58
Item 8. Financial Statements and Supplementary Data
DTS, INC.INDEX TO CONSOLIDATED FINANCIAL STATEMENTS
Consolidated Financial Statements:Reports of Independent Registered Public Accounting Firm . . . . . . . . . . . . . . . . . . . . . . . . . . . . 60Consolidated Balance Sheets as of December 31, 2013 and 2012 . . . . . . . . . . . . . . . . . . . . . . . . 63Consolidated Statements of Operations for the years ended December 31, 2013, 2012 and 2011 . . 64Consolidated Statements of Comprehensive Income (Loss) for the years ended December 31,
2013, 2012 and 2011 . . . . . . . . . . . . . . . . . . . . . . . . . . . . . . . . . . . . . . . . . . . . . . . . . . . . . . . 65Consolidated Statements of Stockholders’ Equity for the years ended December 31, 2013, 2012
and 2011 . . . . . . . . . . . . . . . . . . . . . . . . . . . . . . . . . . . . . . . . . . . . . . . . . . . . . . . . . . . . . . . 66Consolidated Statements of Cash Flows for the years ended December 31, 2013, 2012 and 2011 . . 67Notes to Consolidated Financial Statements . . . . . . . . . . . . . . . . . . . . . . . . . . . . . . . . . . . . . . . 68Financial Statement Schedule:Schedule II—Valuation and Qualifying Accounts for the years ended December 31, 2013, 2012
and 2011 . . . . . . . . . . . . . . . . . . . . . . . . . . . . . . . . . . . . . . . . . . . . . . . . . . . . . . . . . . . . . . . 100
59

REPORT OF INDEPENDENT REGISTERED PUBLIC ACCOUNTING FIRM
Board of Directors and StockholdersDTS, Inc.
We have audited the accompanying consolidated balance sheets of DTS, Inc. (the ‘‘Company’’) asof December 31, 2013 and 2012, and the related consolidated statements of operations, comprehensiveincome (loss), stockholders’ equity, and cash flows for each of the three years in the period endedDecember 31, 2013. Our audits of the basic consolidated financial statements included the financialstatement schedule listed in the index appearing under Item 15(a)(2). These financial statements andfinancial statement schedule are the responsibility of the Company’s management. Our responsibility isto express an opinion on these financial statements and financial statement schedule based on ouraudits.
We conducted our audits in accordance with the standards of the Public Company AccountingOversight Board (United States). Those standards require that we plan and perform the audit to obtainreasonable assurance about whether the financial statements are free of material misstatement. Anaudit includes examining, on a test basis, evidence supporting the amounts and disclosures in thefinancial statements. An audit also includes assessing the accounting principles used and significantestimates made by management, as well as evaluating the overall financial statement presentation. Webelieve that our audits provide a reasonable basis for our opinion.
In our opinion, the consolidated financial statements referred to above present fairly, in allmaterial respects, the financial position of DTS, Inc. as of December 31, 2013 and 2012, and the resultsof its operations and its cash flows for each of the three years in the period ended December 31, 2013in conformity with accounting principles generally accepted in the United States of America. Also inour opinion, the related financial statement schedule, when considered in relation to the basicconsolidated financial statements taken as a whole, presents fairly, in all material respects, theinformation set forth therein.
We also have audited, in accordance with the standards of the Public Company AccountingOversight Board (United States), the Company’s internal control over financial reporting as ofDecember 31, 2013, based on criteria established in the 1992 Internal Control—Integrated Frameworkissued by the Committee of Sponsoring Organizations of the Treadway Commission (COSO), and ourreport dated March 20, 2014 expressed an adverse opinion.
/s/ GRANT THORNTON LLPIrvine, CaliforniaMarch 20, 2014
60

REPORT OF INDEPENDENT REGISTERED PUBLIC ACCOUNTING FIRMON INTERNAL CONTROL OVER FINANCIAL REPORTING
Board of Directors and StockholdersDTS, Inc.
We have audited the internal control over financial reporting of DTS, Inc. (the ‘‘Company’’) as ofDecember 31, 2013, based on criteria established in the 1992 Internal Control—Integrated Frameworkissued by the Committee of Sponsoring Organizations of the Treadway Commission (COSO). TheCompany’s management is responsible for maintaining effective internal control over financial reportingand for its assessment of the effectiveness of internal control over financial reporting, included in theaccompanying Management’s Report on Internal Control Over Financial Reporting (‘‘Management’sReport’’). Our responsibility is to express an opinion on the Company’s internal control over financialreporting based on our audit.
We conducted our audit in accordance with the standards of the Public Company AccountingOversight Board (United States). Those standards require that we plan and perform the audit to obtainreasonable assurance about whether effective internal control over financial reporting was maintainedin all material respects. Our audit included obtaining an understanding of internal control overfinancial reporting, assessing the risk that a material weakness exists, testing and evaluating the designand operating effectiveness of internal control based on the assessed risk, and performing such otherprocedures as we considered necessary in the circumstances. We believe that our audit provides areasonable basis for our opinion.
A company’s internal control over financial reporting is a process designed to provide reasonableassurance regarding the reliability of financial reporting and the preparation of financial statements forexternal purposes in accordance with generally accepted accounting principles. A company’s internalcontrol over financial reporting includes those policies and procedures that (1) pertain to themaintenance of records that, in reasonable detail, accurately and fairly reflect the transactions anddispositions of the assets of the company; (2) provide reasonable assurance that transactions arerecorded as necessary to permit preparation of financial statements in accordance with generallyaccepted accounting principles, and that receipts and expenditures of the company are being made onlyin accordance with authorizations of management and directors of the company; and (3) providereasonable assurance regarding prevention or timely detection of unauthorized acquisition, use, ordisposition of the company’s assets that could have a material effect on the financial statements.
Because of its inherent limitations, internal control over financial reporting may not prevent ordetect misstatements. Also, projections of any evaluation of effectiveness to future periods are subjectto the risk that controls may become inadequate because of changes in conditions, or that the degreeof compliance with the policies or procedures may deteriorate.
A material weakness is a deficiency, or combination of control deficiencies, in internal control overfinancial reporting, such that there is a reasonable possibility that a material misstatement of thecompany’s annual or interim financial statements will not be prevented or detected on a timely basis.The following material weaknesses have been identified and included in management’s assessment.
The Company identified a material weakness related to the inadequate design of internal controlsover the accounting for income taxes. In addition, the Company identified a material weakness relatedto the inadequate design of internal controls over financial reporting for revenue under licenseagreements with non-standard financial terms.
In our opinion, because of the effect of the material weaknesses described above on theachievement of the objectives of the control criteria, the Company has not maintained effective internalcontrol over financial reporting as of December 31, 2013, based on criteria established in the 1992Internal Control—Integrated Framework issued by COSO.
61

We also have audited, in accordance with the standards of the Public Company AccountingOversight Board (United States), the consolidated financial statements of the Company as of and forthe year ended December 31, 2013. The material weaknesses identified above were considered indetermining the nature, timing, and extent of audit tests applied in our audit of the 2013 consolidatedfinancial statements, and this report does not affect our report dated March 20, 2014, which expressedan unqualified opinion on those financial statements.
/s/ GRANT THORNTON LLPIrvine, CaliforniaMarch 20, 2014
62

DTS, INC.
CONSOLIDATED BALANCE SHEETS
(Amounts in thousands, except per share amounts)
As of December 31,
2013 2012
ASSETSCurrent assets:
Cash and cash equivalents . . . . . . . . . . . . . . . . . . . . . . . . . . . . . . . . . . . . . . . $ 66,025 $ 57,831Short-term investments . . . . . . . . . . . . . . . . . . . . . . . . . . . . . . . . . . . . . . . . . 5,004 14,214Accounts receivable, net of allowance for doubtful accounts of $1,388 and
$679 at December 31, 2013 and 2012, respectively . . . . . . . . . . . . . . . . . . . . 11,637 9,460Deferred income taxes . . . . . . . . . . . . . . . . . . . . . . . . . . . . . . . . . . . . . . . . . 5,787 1,998Prepaid expenses and other current assets . . . . . . . . . . . . . . . . . . . . . . . . . . . 5,480 4,875Income taxes receivable . . . . . . . . . . . . . . . . . . . . . . . . . . . . . . . . . . . . . . . . 2,826 5,107
Total current assets . . . . . . . . . . . . . . . . . . . . . . . . . . . . . . . . . . . . . . . . . . 96,759 93,485Property and equipment, net . . . . . . . . . . . . . . . . . . . . . . . . . . . . . . . . . . . . . . 30,116 33,325Intangible assets, net . . . . . . . . . . . . . . . . . . . . . . . . . . . . . . . . . . . . . . . . . . . . 50,225 61,400Goodwill . . . . . . . . . . . . . . . . . . . . . . . . . . . . . . . . . . . . . . . . . . . . . . . . . . . . . 48,418 48,418Deferred income taxes . . . . . . . . . . . . . . . . . . . . . . . . . . . . . . . . . . . . . . . . . . . 11,667 605Long-term investments . . . . . . . . . . . . . . . . . . . . . . . . . . . . . . . . . . . . . . . . . . . — 5,000Other assets . . . . . . . . . . . . . . . . . . . . . . . . . . . . . . . . . . . . . . . . . . . . . . . . . . 4,613 4,826
Total assets . . . . . . . . . . . . . . . . . . . . . . . . . . . . . . . . . . . . . . . . . . . . . . . . $241,798 $247,059
LIABILITIES AND STOCKHOLDERS’ EQUITYCurrent liabilities:
Accounts payable . . . . . . . . . . . . . . . . . . . . . . . . . . . . . . . . . . . . . . . . . . . . . $ 2,802 $ 2,796Accrued expenses . . . . . . . . . . . . . . . . . . . . . . . . . . . . . . . . . . . . . . . . . . . . . 12,142 15,861Deferred revenue . . . . . . . . . . . . . . . . . . . . . . . . . . . . . . . . . . . . . . . . . . . . . 10,262 7,659
Total current liabilities . . . . . . . . . . . . . . . . . . . . . . . . . . . . . . . . . . . . . . . . 25,206 26,316Long-term debt . . . . . . . . . . . . . . . . . . . . . . . . . . . . . . . . . . . . . . . . . . . . . . . . 30,000 30,000Other long-term liabilities . . . . . . . . . . . . . . . . . . . . . . . . . . . . . . . . . . . . . . . . 3,480 9,817Commitments and contingencies (Note 10)Stockholders’ equity:
Preferred stock—$0.0001 par value, 5,000 shares authorized at December 31,2013 and 2012; no shares issued and outstanding . . . . . . . . . . . . . . . . . . . . — —
Common stock—$0.0001 par value, 70,000 shares authorized at December 31,2013 and 2012; 20,972 and 20,710 shares issued at December 31, 2013 and2012, respectively; 17,279 and 18,208 shares outstanding at December 31,2013 and 2012, respectively . . . . . . . . . . . . . . . . . . . . . . . . . . . . . . . . . . . . 3 3
Additional paid-in capital . . . . . . . . . . . . . . . . . . . . . . . . . . . . . . . . . . . . . . . 224,971 213,787Treasury stock, at cost—3,693 and 2,502 at December 31, 2013 and 2012,
respectively . . . . . . . . . . . . . . . . . . . . . . . . . . . . . . . . . . . . . . . . . . . . . . . . (84,689) (59,848)Accumulated other comprehensive income . . . . . . . . . . . . . . . . . . . . . . . . . . . 747 659Retained earnings . . . . . . . . . . . . . . . . . . . . . . . . . . . . . . . . . . . . . . . . . . . . . 42,080 26,325
Total stockholders’ equity . . . . . . . . . . . . . . . . . . . . . . . . . . . . . . . . . . . . . 183,112 180,926
Total liabilities and stockholders’ equity . . . . . . . . . . . . . . . . . . . . . . . . . . $241,798 $247,059
See accompanying notes to consolidated financial statements.
63

DTS, INC.
CONSOLIDATED STATEMENTS OF OPERATIONS
(Amounts in thousands, except per share amounts)
For the Years Ended December 31,
2013 2012 2011
Revenue . . . . . . . . . . . . . . . . . . . . . . . . . . . . . . . . . . . . . . . . . . . . . . $125,148 $100,649 $96,922Cost of revenue . . . . . . . . . . . . . . . . . . . . . . . . . . . . . . . . . . . . . . . . 9,788 4,347 860
Gross profit . . . . . . . . . . . . . . . . . . . . . . . . . . . . . . . . . . . . . . . . . . . 115,360 96,302 96,062Operating expenses:
Selling, general and administrative . . . . . . . . . . . . . . . . . . . . . . . . . 79,753 78,409 52,904Research and development . . . . . . . . . . . . . . . . . . . . . . . . . . . . . . . 31,145 25,774 13,539Change in fair value of contingent consideration . . . . . . . . . . . . . . . (6,000) — —Impairment of intangible assets . . . . . . . . . . . . . . . . . . . . . . . . . . . 2,820 — —
Total operating expenses . . . . . . . . . . . . . . . . . . . . . . . . . . . . . . . 107,718 104,183 66,443
Operating income (loss) . . . . . . . . . . . . . . . . . . . . . . . . . . . . . . . . . . 7,642 (7,881) 29,619Interest and other income (expense), net . . . . . . . . . . . . . . . . . . . . . . (521) (352) 311
Income (loss) before income taxes . . . . . . . . . . . . . . . . . . . . . . . . . . . 7,121 (8,233) 29,930Provision (benefit) for income taxes . . . . . . . . . . . . . . . . . . . . . . . . . . (8,634) 7,665 11,661
Net income (loss) . . . . . . . . . . . . . . . . . . . . . . . . . . . . . . . . . . . . . . . $ 15,755 $(15,898) $18,269
Net income (loss) per common share:Basic . . . . . . . . . . . . . . . . . . . . . . . . . . . . . . . . . . . . . . . . . . . . . . $ 0.87 $ (0.91) $ 1.08
Diluted . . . . . . . . . . . . . . . . . . . . . . . . . . . . . . . . . . . . . . . . . . . . . $ 0.86 $ (0.91) $ 1.04
Weighted average shares outstanding:Basic . . . . . . . . . . . . . . . . . . . . . . . . . . . . . . . . . . . . . . . . . . . . . . 18,097 17,466 16,982
Diluted . . . . . . . . . . . . . . . . . . . . . . . . . . . . . . . . . . . . . . . . . . . . . 18,334 17,466 17,575
See accompanying notes to consolidated financial statements.
64

DTS, INC.
CONSOLIDATED STATEMENTS OF COMPREHENSIVE INCOME (LOSS)
(Amounts in thousands)
For the Years EndedDecember 31,
2013 2012 2011
Net income (loss) . . . . . . . . . . . . . . . . . . . . . . . . . . . . . . . . . . . . . . . . $15,755 $(15,898) $18,269Other comprehensive income (loss), net of tax:
Foreign currency translation adjustments, net . . . . . . . . . . . . . . . . . . 94 56 155Other, net . . . . . . . . . . . . . . . . . . . . . . . . . . . . . . . . . . . . . . . . . . . . (6) (41) (2)
Total comprehensive income (loss) . . . . . . . . . . . . . . . . . . . . . . . . . . . . $15,843 $(15,883) $18,422
See accompanying notes to consolidated financial statements.
65

DTS, INC.
CONSOLIDATED STATEMENTS OF STOCKHOLDERS’ EQUITY
(Amounts in thousands)
AccumulatedAdditional Other TotalCommon Stock Paid-in Treasury Comprehensive Retained Stockholders’
Shares Amount Capital Stock Income Earnings Equity
Balance at December 31, 2010 . . . . . . 17,325 $ 3 $180,708 $ (74,923) $491 $ 41,289 $147,568Exercise of options and related tax
benefit of $314 . . . . . . . . . . . . . 161 — 3,096 — — — 3,096Issuance of common stock under
employee stock purchase plan . . . 46 — 1,317 — — — 1,317Restricted stock award grants, net of
forfeitures and shares withheld fortaxes . . . . . . . . . . . . . . . . . . . . (29) — (1,585) — — — (1,585)
Restricted stock unit vesting . . . . . . 33 — — — — — —Stock-based compensation charge . . — — 9,283 — — — 9,283Stock repurchases . . . . . . . . . . . . . (1,000) — — (32,299) — — (32,299)Net income . . . . . . . . . . . . . . . . . — — — — — 18,269 18,269Other comprehensive income . . . . . — — — — 153 — 153
Balance at December 31, 2011 . . . . . . 16,536 3 192,819 (107,222) 644 59,558 145,802Exercise of options and related tax
benefit of $8,661 . . . . . . . . . . . . 78 — 9,432 — — — 9,432Issuance of common stock under
employee stock purchase plan . . . 70 — 1,205 — — — 1,205Restricted stock award forfeitures
and shares withheld for taxes . . . . (22) — (985) — — — (985)Restricted stock unit vesting . . . . . . 48 — — — — — —Stock-based compensation charge . . — — 11,316 — — — 11,316Stock issued as consideration for
business acquisition . . . . . . . . . . 2,307 — — 61,906 — (17,335) 44,571Stock repurchases . . . . . . . . . . . . . (809) — — (14,532) — — (14,532)Net loss . . . . . . . . . . . . . . . . . . . . — — — — — (15,898) (15,898)Other comprehensive income . . . . . — — — — 15 — 15
Balance at December 31, 2012 . . . . . . 18,208 3 213,787 (59,848) 659 26,325 180,926Exercise of options and related tax
shortfall of $2,090 . . . . . . . . . . . 27 — (1,673) — — — (1,673)Issuance of common stock under
employee stock purchase plan . . . 161 — 2,059 — — — 2,059Restricted stock award forfeitures
and shares withheld for taxes . . . . (8) — (929) — — — (929)Restricted stock unit vesting . . . . . . 82 — — — — — —Stock-based compensation charge . . — — 11,727 — — — 11,727Stock repurchases . . . . . . . . . . . . . (1,191) — — (24,841) — — (24,841)Net income . . . . . . . . . . . . . . . . . — — — — — 15,755 15,755Other comprehensive income . . . . . — — — — 88 — 88
Balance at December 31, 2013 . . . . . . 17,279 $ 3 $224,971 $ (84,689) $747 $ 42,080 $183,112
See accompanying notes to consolidated financial statements.
66
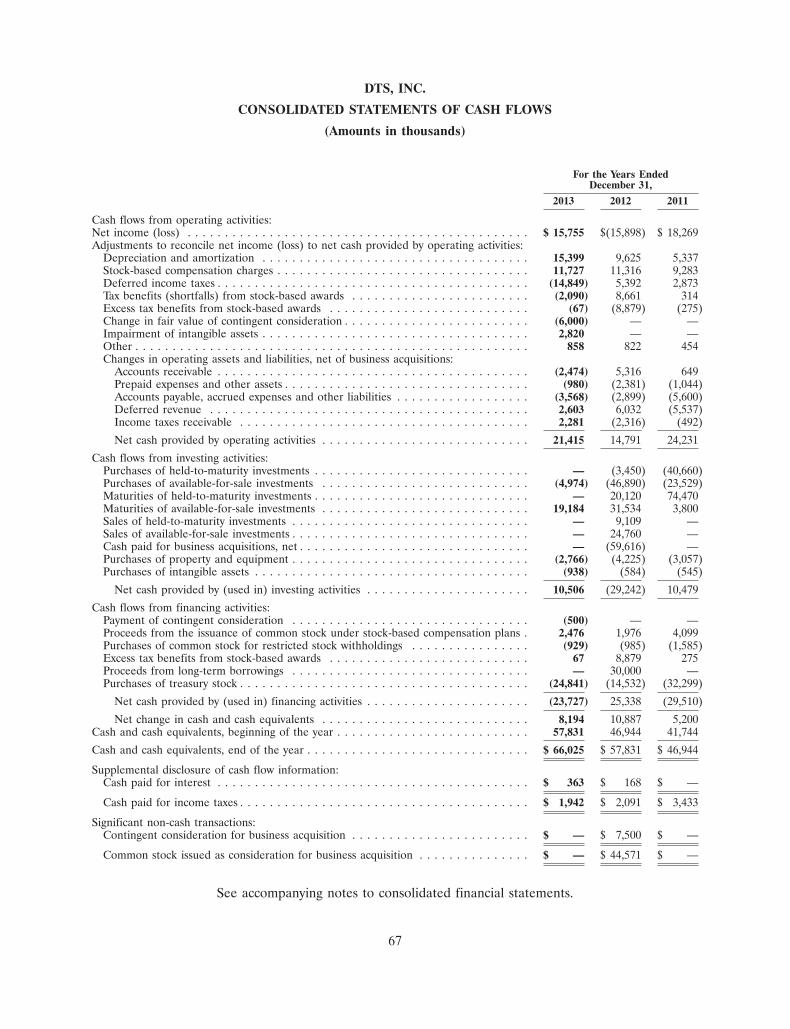
DTS, INC.
CONSOLIDATED STATEMENTS OF CASH FLOWS
(Amounts in thousands)
For the Years EndedDecember 31,
2013 2012 2011
Cash flows from operating activities:Net income (loss) . . . . . . . . . . . . . . . . . . . . . . . . . . . . . . . . . . . . . . . . . . . . . . $ 15,755 $(15,898) $ 18,269Adjustments to reconcile net income (loss) to net cash provided by operating activities:
Depreciation and amortization . . . . . . . . . . . . . . . . . . . . . . . . . . . . . . . . . . . . 15,399 9,625 5,337Stock-based compensation charges . . . . . . . . . . . . . . . . . . . . . . . . . . . . . . . . . . 11,727 11,316 9,283Deferred income taxes . . . . . . . . . . . . . . . . . . . . . . . . . . . . . . . . . . . . . . . . . . (14,849) 5,392 2,873Tax benefits (shortfalls) from stock-based awards . . . . . . . . . . . . . . . . . . . . . . . . (2,090) 8,661 314Excess tax benefits from stock-based awards . . . . . . . . . . . . . . . . . . . . . . . . . . . (67) (8,879) (275)Change in fair value of contingent consideration . . . . . . . . . . . . . . . . . . . . . . . . . (6,000) — —Impairment of intangible assets . . . . . . . . . . . . . . . . . . . . . . . . . . . . . . . . . . . . 2,820 — —Other . . . . . . . . . . . . . . . . . . . . . . . . . . . . . . . . . . . . . . . . . . . . . . . . . . . . . 858 822 454Changes in operating assets and liabilities, net of business acquisitions:
Accounts receivable . . . . . . . . . . . . . . . . . . . . . . . . . . . . . . . . . . . . . . . . . . (2,474) 5,316 649Prepaid expenses and other assets . . . . . . . . . . . . . . . . . . . . . . . . . . . . . . . . . (980) (2,381) (1,044)Accounts payable, accrued expenses and other liabilities . . . . . . . . . . . . . . . . . . (3,568) (2,899) (5,600)Deferred revenue . . . . . . . . . . . . . . . . . . . . . . . . . . . . . . . . . . . . . . . . . . . 2,603 6,032 (5,537)Income taxes receivable . . . . . . . . . . . . . . . . . . . . . . . . . . . . . . . . . . . . . . . 2,281 (2,316) (492)
Net cash provided by operating activities . . . . . . . . . . . . . . . . . . . . . . . . . . . . 21,415 14,791 24,231
Cash flows from investing activities:Purchases of held-to-maturity investments . . . . . . . . . . . . . . . . . . . . . . . . . . . . . — (3,450) (40,660)Purchases of available-for-sale investments . . . . . . . . . . . . . . . . . . . . . . . . . . . . (4,974) (46,890) (23,529)Maturities of held-to-maturity investments . . . . . . . . . . . . . . . . . . . . . . . . . . . . . — 20,120 74,470Maturities of available-for-sale investments . . . . . . . . . . . . . . . . . . . . . . . . . . . . 19,184 31,534 3,800Sales of held-to-maturity investments . . . . . . . . . . . . . . . . . . . . . . . . . . . . . . . . — 9,109 —Sales of available-for-sale investments . . . . . . . . . . . . . . . . . . . . . . . . . . . . . . . . — 24,760 —Cash paid for business acquisitions, net . . . . . . . . . . . . . . . . . . . . . . . . . . . . . . . — (59,616) —Purchases of property and equipment . . . . . . . . . . . . . . . . . . . . . . . . . . . . . . . . (2,766) (4,225) (3,057)Purchases of intangible assets . . . . . . . . . . . . . . . . . . . . . . . . . . . . . . . . . . . . . (938) (584) (545)
Net cash provided by (used in) investing activities . . . . . . . . . . . . . . . . . . . . . . 10,506 (29,242) 10,479
Cash flows from financing activities:Payment of contingent consideration . . . . . . . . . . . . . . . . . . . . . . . . . . . . . . . . (500) — —Proceeds from the issuance of common stock under stock-based compensation plans . 2,476 1,976 4,099Purchases of common stock for restricted stock withholdings . . . . . . . . . . . . . . . . (929) (985) (1,585)Excess tax benefits from stock-based awards . . . . . . . . . . . . . . . . . . . . . . . . . . . 67 8,879 275Proceeds from long-term borrowings . . . . . . . . . . . . . . . . . . . . . . . . . . . . . . . . — 30,000 —Purchases of treasury stock . . . . . . . . . . . . . . . . . . . . . . . . . . . . . . . . . . . . . . . (24,841) (14,532) (32,299)
Net cash provided by (used in) financing activities . . . . . . . . . . . . . . . . . . . . . . (23,727) 25,338 (29,510)
Net change in cash and cash equivalents . . . . . . . . . . . . . . . . . . . . . . . . . . . . 8,194 10,887 5,200Cash and cash equivalents, beginning of the year . . . . . . . . . . . . . . . . . . . . . . . . . . 57,831 46,944 41,744
Cash and cash equivalents, end of the year . . . . . . . . . . . . . . . . . . . . . . . . . . . . . . $ 66,025 $ 57,831 $ 46,944
Supplemental disclosure of cash flow information:Cash paid for interest . . . . . . . . . . . . . . . . . . . . . . . . . . . . . . . . . . . . . . . . . . $ 363 $ 168 $ —
Cash paid for income taxes . . . . . . . . . . . . . . . . . . . . . . . . . . . . . . . . . . . . . . . $ 1,942 $ 2,091 $ 3,433
Significant non-cash transactions:Contingent consideration for business acquisition . . . . . . . . . . . . . . . . . . . . . . . . $ — $ 7,500 $ —
Common stock issued as consideration for business acquisition . . . . . . . . . . . . . . . $ — $ 44,571 $ —
See accompanying notes to consolidated financial statements.
67

DTS, INC.
NOTES TO CONSOLIDATED FINANCIAL STATEMENTS
(Amounts in thousands, except per share data)
Note 1—The Company
DTS, Inc. (the ‘‘Company’’) is a leading provider of premier audio solutions that are incorporatedinto an array of consumer electronics devices by hundreds of licensee customers around the world. TheCompany’s audio technologies enable recording, delivery and playback of simple, personalized, andimmersive high-definition audio and are currently used in a variety of product applications, includingtelevisions (‘‘TVs’’), personal computers (‘‘PCs’’), smartphones, tablets, digital media players, videogame consoles, Blu-ray Disc players, audio/video receivers, soundbars, DVD based products, automotiveaudio systems, set-top-boxes, and home theater systems. In addition, the Company provides productsand services to motion picture studios, radio and TV broadcasters, game developers and other contentcreators to facilitate the inclusion of compelling, realistic DTS-encoded soundtracks in their content.The Company also provides a suite of audio processing technologies designed to enhance theentertainment experience for users of consumer electronics products subject to physical limitations,such as TVs, PCs and mobile electronics.
The Company commenced operations in 1990 as Digital Theater Systems Corporation(‘‘DTS Corp’’). In 1993, DTS Corp became the general partner of Digital Theater Systems, L.P., aDelaware limited partnership (‘‘the Partnership’’). In 1994, the Partnership formed DTSTechnology, LLC (‘‘DTS Technology’’) to develop audio technologies for the consumer electronics andother markets. In 1997, the Company completed a reorganization and tax-free exchange with thepredecessor entities and was incorporated in Delaware. In 2003, the Company completed its initialpublic offering for the sale of 4,091 shares of common stock at a price to the public of $17.00 pershare. In May 2005, the Company changed its name from Digital Theater Systems, Inc. to DTS, Inc.
Acquisitions of SRS Labs, Inc. and Phorus’ Assets
On July 20, 2012, the Company completed its acquisition of SRS Labs, Inc. (‘‘SRS’’), pursuant tothe Agreement and Plan of Merger and Reorganization, dated as of April 16, 2012 (the ‘‘MergerAgreement’’), by and among the Company, DTS Merger Sub, Inc., a wholly owned subsidiary of theCompany (‘‘Merger Sub’’), DTS LLC, a single member limited liability company and a wholly ownedsubsidiary of the Company (‘‘DTS LLC’’), and SRS. Pursuant to the Merger Agreement, Merger Subwas merged with and into SRS, with SRS surviving the merger as a wholly owned subsidiary of theCompany (the ‘‘Merger’’). Immediately following the Merger, SRS was merged with and intoDTS LLC, with DTS LLC continuing as the surviving entity and a wholly owned subsidiary of theCompany. During 2013, the Company finalized the purchase price accounting related to SRS, andretrospectively applied measurement period adjustments to the consolidated financial statements.
On July 5, 2012, the Company completed its acquisition of assets from Phorus, Inc. andPhorus, LLC (collectively ‘‘Phorus’’) pursuant to an Asset Purchase Agreement dated the same day(the ‘‘Asset Purchase Agreement’’). During 2013, the Company finalized the purchase price accountingrelated to Phorus.
For additional information, refer to Notes 2, 4 and 6, ‘‘Significant Accounting Policies’’, ‘‘FairValue Measurements’’ and ‘‘Business Combinations’’, respectively.
68

DTS, INC.
NOTES TO CONSOLIDATED FINANCIAL STATEMENTS (Continued)
(Amounts in thousands, except per share data)
Note 2—Significant Accounting Policies
Principles of Consolidation
The accompanying consolidated financial statements have been prepared in accordance withgenerally accepted accounting principles in the United States of America (‘‘U.S. GAAP’’) and pursuantto the rules and regulations of the Securities and Exchange Commission (‘‘SEC’’). The consolidatedfinancial statements include the accounts of the Company and its subsidiaries. The financial results for2012 include SRS and Phorus from the dates of their respective acquisition. All material intercompanyaccounts and transactions have been eliminated.
Use of Estimates
The preparation of financial statements in accordance with U.S. GAAP and pursuant to the rulesand regulations of the SEC requires management to make estimates and assumptions that affect thereported amounts of assets and liabilities, disclosure of contingent assets and liabilities at the date ofthe financial statements, and the reported amounts of revenues and expenses during the reportingperiod. On an ongoing basis, the Company evaluates its estimates and assumptions, including thoserelated to revenue recognition, allowance for doubtful accounts, valuation of goodwill, other intangibleassets, and long-lived assets, fair value of contingent consideration, stock-based compensation, incometaxes and business combinations. The Company bases its estimates on historical and anticipated results,trends and on various other assumptions that it believes are reasonable under the circumstances,including assumptions as to future events. These estimates form the basis for making assumptions aboutthe carrying values of assets and liabilities that are not readily apparent from other sources. By theirnature, estimates are subject to an inherent degree of uncertainty. Actual results could differ materiallyfrom those estimates.
Reclassifications
Certain prior period amounts have been reclassified to conform to current year presentation.
Cash Equivalents
The Company considers all short-term highly liquid investments with an original maturity ofthree months or less to be cash equivalents. Cash equivalents primarily consist of funds held in moneymarket accounts. Cash equivalents are stated at cost plus accrued interest, which approximates fairvalue.
Investments
The Company considers, at the time that they are purchased, investments with maturities greaterthan three months, but less than one year, to be short-term investments. Investments that havematurities of more than one year are classified as long-term investments. Investments are classified asavailable-for-sale and are reported at fair value with unrealized gains or losses, if any, reported, net oftax, in accumulated other comprehensive income. The cost of investments sold is based on the specificidentification method, and all income generated and realized gains or losses from investments arerecorded to interest and other income (expense), net.
69

DTS, INC.
NOTES TO CONSOLIDATED FINANCIAL STATEMENTS (Continued)
(Amounts in thousands, except per share data)
Note 2—Significant Accounting Policies (Continued)
The Company reviews its investments to identify and evaluate investments that have an indicationof possible impairment. Factors considered in determining whether a loss is temporary include thelength of time and extent to which fair value has been less than the cost basis, the financial conditionand near-term prospects of the investee, and the Company’s intent and ability to hold the investmentfor a period of time sufficient to allow for any anticipated recovery in market value. Credit losses andother-than-temporary impairments are declines in fair value that are not expected to recover and arecharged to interest and other income (expense), net.
Concentration of Business and Credit Risk
The Company markets its products and services to consumer electronics products manufacturers inthe U.S. and internationally. Although the Company is generally subject to the financial well-being ofthe consumer electronics industry, management does not believe that the Company is subject tosignificant credit risk with respect to trade accounts receivable. Additionally, the Company performsongoing credit evaluations of its customers and maintains allowances for potential credit losses which,when realized, have generally been within the range of management’s expectations.
Three customers accounted for 21%, 12% and 12%, respectively, of revenues for the year endedDecember 31, 2013. The revenue from one of the customers accounting for 12% of revenues for theyear ended December 31, 2013 exceeded 10% of revenues due to royalty recoveries. Two customersaccounted for 13% and 11%, respectively, of revenues for the year ended December 31, 2012. Twocustomers accounted for 16% and 12%, respectively, of revenues for the year ended December 31,2011.
One customer accounted for 51% of accounts receivable at December 31, 2013, that resultedlargely from royalty recoveries. One customer accounted for 10% of accounts receivable atDecember 31, 2012, that resulted from royalty recoveries.
The Company deposits its cash and cash equivalents in accounts with major financial institutionsworldwide. At times, such deposits may be in excess of insured limits. The Company’s investmentaccounts are with major financial institutions and include investment grade municipal securities andU.S. agency securities. The Company has not incurred any significant credit losses on its investments.
Allowance For Doubtful Accounts
The Company continually monitors customer payments and maintains a reserve for estimatedlosses resulting from its customers’ inability to make required payments. In determining the reserve, theCompany evaluates the collectibility of its accounts receivable based upon a variety of factors. In caseswhere the Company becomes aware of circumstances that may impair a specific customer’s ability tomeet its financial obligations, the Company records a specific allowance against amounts due. For allother customers, the Company recognizes allowances for doubtful accounts based on its historicalwrite-off experience in conjunction with the length of time the receivables are past due, customercreditworthiness, geographic risk and the current business environment. Actual future losses fromuncollectible accounts may differ from the Company’s estimates.
70
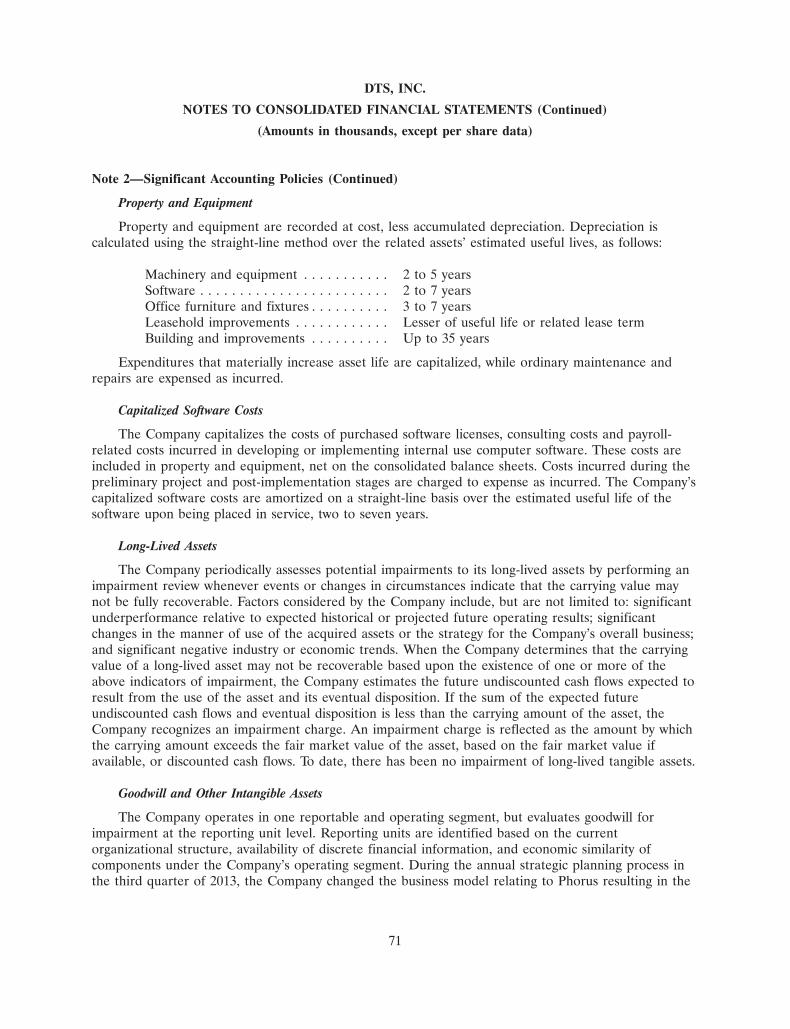
DTS, INC.
NOTES TO CONSOLIDATED FINANCIAL STATEMENTS (Continued)
(Amounts in thousands, except per share data)
Note 2—Significant Accounting Policies (Continued)
Property and Equipment
Property and equipment are recorded at cost, less accumulated depreciation. Depreciation iscalculated using the straight-line method over the related assets’ estimated useful lives, as follows:
Machinery and equipment . . . . . . . . . . . 2 to 5 yearsSoftware . . . . . . . . . . . . . . . . . . . . . . . . 2 to 7 yearsOffice furniture and fixtures . . . . . . . . . . 3 to 7 yearsLeasehold improvements . . . . . . . . . . . . Lesser of useful life or related lease termBuilding and improvements . . . . . . . . . . Up to 35 years
Expenditures that materially increase asset life are capitalized, while ordinary maintenance andrepairs are expensed as incurred.
Capitalized Software Costs
The Company capitalizes the costs of purchased software licenses, consulting costs and payroll-related costs incurred in developing or implementing internal use computer software. These costs areincluded in property and equipment, net on the consolidated balance sheets. Costs incurred during thepreliminary project and post-implementation stages are charged to expense as incurred. The Company’scapitalized software costs are amortized on a straight-line basis over the estimated useful life of thesoftware upon being placed in service, two to seven years.
Long-Lived Assets
The Company periodically assesses potential impairments to its long-lived assets by performing animpairment review whenever events or changes in circumstances indicate that the carrying value maynot be fully recoverable. Factors considered by the Company include, but are not limited to: significantunderperformance relative to expected historical or projected future operating results; significantchanges in the manner of use of the acquired assets or the strategy for the Company’s overall business;and significant negative industry or economic trends. When the Company determines that the carryingvalue of a long-lived asset may not be recoverable based upon the existence of one or more of theabove indicators of impairment, the Company estimates the future undiscounted cash flows expected toresult from the use of the asset and its eventual disposition. If the sum of the expected futureundiscounted cash flows and eventual disposition is less than the carrying amount of the asset, theCompany recognizes an impairment charge. An impairment charge is reflected as the amount by whichthe carrying amount exceeds the fair market value of the asset, based on the fair market value ifavailable, or discounted cash flows. To date, there has been no impairment of long-lived tangible assets.
Goodwill and Other Intangible Assets
The Company operates in one reportable and operating segment, but evaluates goodwill forimpairment at the reporting unit level. Reporting units are identified based on the currentorganizational structure, availability of discrete financial information, and economic similarity ofcomponents under the Company’s operating segment. During the annual strategic planning process inthe third quarter of 2013, the Company changed the business model relating to Phorus resulting in the
71

DTS, INC.
NOTES TO CONSOLIDATED FINANCIAL STATEMENTS (Continued)
(Amounts in thousands, except per share data)
Note 2—Significant Accounting Policies (Continued)
identification of the Phorus business as a separate reporting unit from the rest of the Company for thepurpose of testing goodwill for impairment. Goodwill was reassigned to each reporting unit using therelative fair value approach. The Company evaluates the carrying value of goodwill and indefinite-livedintangibles for impairment on an annual basis as of October 31 of each year, or more frequently ifevents or circumstances indicate that the goodwill and other intangibles might be impaired.
Impairment of indefinite-lived intangibles is tested by estimating the fair value of the assets, andan impairment charge would be recorded to the extent that the carrying amount of such assets exceedsthe estimated fair value. Evaluation of the recoverability of goodwill includes valuation of theunderlying reporting unit using fair value techniques, which may include both income and marketapproaches. If the carrying value of the reporting unit exceeds its estimated fair value, or if thereporting unit has a negative carrying value and the Company believes it is more likely than not that agoodwill impairment exists, the Company would proceed to estimate the fair value of the goodwill itselfand compare it to the carrying value to test for impairment and quantify an impairment charge, if any.The Company would record an impairment charge in an amount equal to the excess of the carryingvalue of the goodwill over the estimated fair value. Goodwill impairment is measured subsequent to thecompletion of any impairment of all other intangible and long-lived assets associated with the reportingunit.
The Company’s definite-lived intangibles principally consist of customer relationships, acquiredtechnology and developed patents and tradenames, which are being amortized over their respectiveestimated useful lives. The Company reviews such assets for impairment whenever events or changes incircumstances indicate an asset’s carrying value may not be recoverable. Factors considered include, butare not limited to, significant underperformance relative to expected historical or projected futureoperating results; significant changes in the manner of use of the acquired assets or projected futureoperating results; significant changes in the strategy of the overall business; and significant negativeindustry or economic trends. Recoverability of an intangible is measured by comparing its carryingamount to the expected future undiscounted cash flows that the asset is expected to generate. If it isdetermined that an asset is not recoverable, an impairment charge is recorded in the amount by whichthe carrying amount of the asset exceeds its fair value.
If the Company is unable to finalize the results of impairment tests prior to the issuance of thefinancial statements and an impairment charge is probable and can be reasonably estimated, theCompany recognizes its best estimate of the loss in the current period financial statements anddiscloses that the amount is an estimate. The Company would then recognize any adjustments to thatestimate in subsequent reporting periods, once the results of the impairment tests have been finalized.
Costs incurred in securing patents and trademarks and protecting the Company’s proprietarytechnology and brand name are capitalized. Patent and trademark costs are amortized over theirestimated useful lives, typically five and ten years, respectively. The amortization period commenceswhen the patent or trademark is issued.
For additional information refer to Note 7, ‘‘Goodwill and Other Intangibles’’.
72
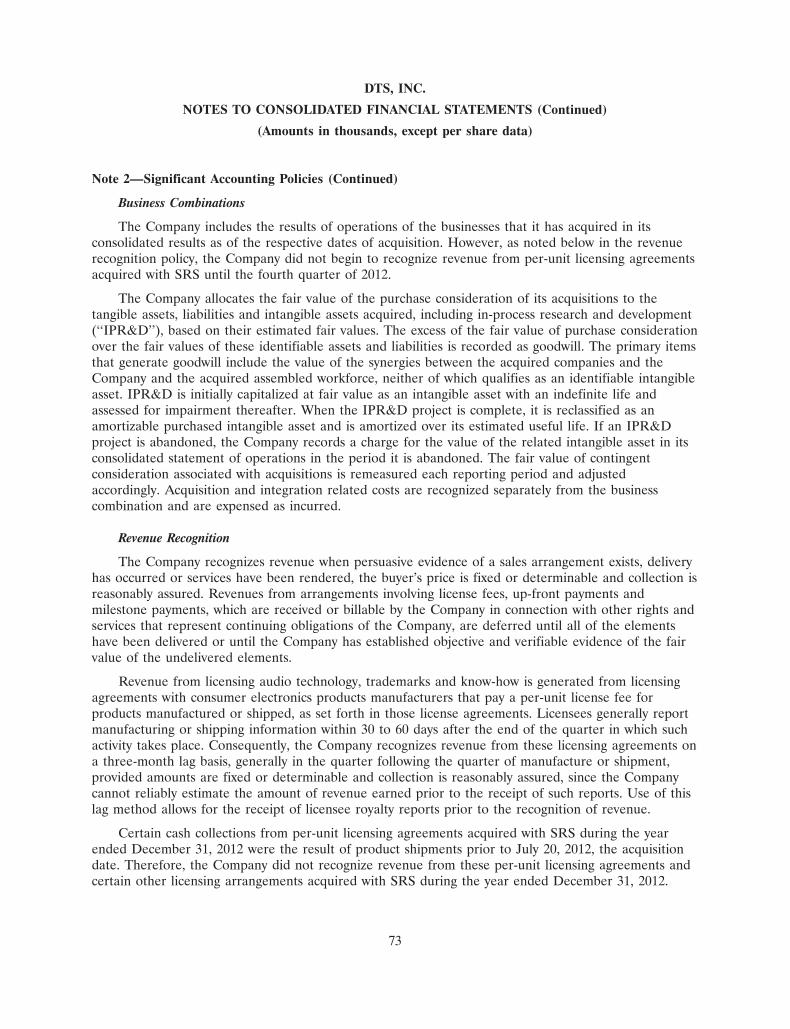
DTS, INC.
NOTES TO CONSOLIDATED FINANCIAL STATEMENTS (Continued)
(Amounts in thousands, except per share data)
Note 2—Significant Accounting Policies (Continued)
Business Combinations
The Company includes the results of operations of the businesses that it has acquired in itsconsolidated results as of the respective dates of acquisition. However, as noted below in the revenuerecognition policy, the Company did not begin to recognize revenue from per-unit licensing agreementsacquired with SRS until the fourth quarter of 2012.
The Company allocates the fair value of the purchase consideration of its acquisitions to thetangible assets, liabilities and intangible assets acquired, including in-process research and development(‘‘IPR&D’’), based on their estimated fair values. The excess of the fair value of purchase considerationover the fair values of these identifiable assets and liabilities is recorded as goodwill. The primary itemsthat generate goodwill include the value of the synergies between the acquired companies and theCompany and the acquired assembled workforce, neither of which qualifies as an identifiable intangibleasset. IPR&D is initially capitalized at fair value as an intangible asset with an indefinite life andassessed for impairment thereafter. When the IPR&D project is complete, it is reclassified as anamortizable purchased intangible asset and is amortized over its estimated useful life. If an IPR&Dproject is abandoned, the Company records a charge for the value of the related intangible asset in itsconsolidated statement of operations in the period it is abandoned. The fair value of contingentconsideration associated with acquisitions is remeasured each reporting period and adjustedaccordingly. Acquisition and integration related costs are recognized separately from the businesscombination and are expensed as incurred.
Revenue Recognition
The Company recognizes revenue when persuasive evidence of a sales arrangement exists, deliveryhas occurred or services have been rendered, the buyer’s price is fixed or determinable and collection isreasonably assured. Revenues from arrangements involving license fees, up-front payments andmilestone payments, which are received or billable by the Company in connection with other rights andservices that represent continuing obligations of the Company, are deferred until all of the elementshave been delivered or until the Company has established objective and verifiable evidence of the fairvalue of the undelivered elements.
Revenue from licensing audio technology, trademarks and know-how is generated from licensingagreements with consumer electronics products manufacturers that pay a per-unit license fee forproducts manufactured or shipped, as set forth in those license agreements. Licensees generally reportmanufacturing or shipping information within 30 to 60 days after the end of the quarter in which suchactivity takes place. Consequently, the Company recognizes revenue from these licensing agreements ona three-month lag basis, generally in the quarter following the quarter of manufacture or shipment,provided amounts are fixed or determinable and collection is reasonably assured, since the Companycannot reliably estimate the amount of revenue earned prior to the receipt of such reports. Use of thislag method allows for the receipt of licensee royalty reports prior to the recognition of revenue.
Certain cash collections from per-unit licensing agreements acquired with SRS during the yearended December 31, 2012 were the result of product shipments prior to July 20, 2012, the acquisitiondate. Therefore, the Company did not recognize revenue from these per-unit licensing agreements andcertain other licensing arrangements acquired with SRS during the year ended December 31, 2012.
73
DTS, INC.
NOTES TO CONSOLIDATED FINANCIAL STATEMENTS (Continued)
(Amounts in thousands, except per share data)
Note 2—Significant Accounting Policies (Continued)
Accordingly, the Company recognized revenue from per-unit licensing agreements acquired with SRSthat resulted from product shipments after the acquisition date.
For certain licensing agreements, licensees pay a flat fee for the right to license certain technologyover the contract term. Typically, the agreement stipulates a flat fee that corresponds to a minimumnumber of units or dollars, with additional per-unit fees for any units or dollars exceeding theminimum. For these agreements, the Company has continuing obligations relating to other rights andservices provided over the term of the contract. As such, the Company recognizes the minimum or flatfee amount on these agreements as revenue ratably over the duration of contract term as allcontractual obligations are met. Consistent with the aforementioned policy for per-unit license feeagreements, the Company recognizes revenue relating to any additional per-unit fees on a quarter lagbasis, since the Company cannot reliably estimate the amount of revenue earned from additional unitsmanufactured or shipped prior to the receipt of licensee reports.
The Company actively polices and enforces its intellectual property, and pursues third parties whoutilize its intellectual property without a license or who have under-reported the amount of royaltiesowed under a license agreement with it. As a result of these activities, from time to time, the Companymay recognize royalty revenues that relate to infringements that occurred in prior periods. Theseroyalty recoveries may cause revenues to be higher than expected during a particular reporting periodand may not occur in subsequent periods. Differences between amounts initially recognized andamounts subsequently audited or reported as an adjustment to those amounts due from licensees, willbe recognized in the period such adjustment is determined or contracted, as appropriate.
Deferred revenues arise primarily from payments for licensing audio technology received inadvance of the culmination of the earnings process. Deferred revenues will be recognized as revenue infuture periods when the applicable revenue recognition criteria are met. Typically, deferred revenuesarise from flat fee arrangements that allow licensees to manufacture an unlimited number of units overa specified term, and accordingly, these deferred revenues will be recognized as revenue ratably overthe term of the arrangement.
Licensing revenue is recognized gross of withholding taxes that are remitted by the Company’slicensees directly to their local tax authorities. For the years ended December 31, 2013, 2012 and 2011,withholding taxes were $5,610, $4,970, and $5,537, respectively.
Research and Development (‘‘R&D’’) Costs
The Company conducts its R&D internally and expenses are primarily comprised of the followingtypes of costs incurred in performing research and development activities: salaries and benefits, relatedemployee expenses, allocated overhead, contract services, and consultants. R&D costs are expensed asincurred.
Foreign Currency Translation
The functional currency of one of the Company’s wholly-owned subsidiaries is the currency of theprimary economic environment in which it operates. The assets and liabilities of this wholly-ownedsubsidiary are translated at the prevailing rate of exchange at the balance sheet date, while the resultsof operations are translated at the average exchange rate in effect for the period. The translation
74
DTS, INC.
NOTES TO CONSOLIDATED FINANCIAL STATEMENTS (Continued)
(Amounts in thousands, except per share data)
Note 2—Significant Accounting Policies (Continued)
adjustments resulting from translating the functional currency into U.S. dollars have been deferred as acomponent of accumulated other comprehensive income in stockholders’ equity.
The functional currency of the Company’s other wholly-owned subsidiaries is the U.S. dollar andaccordingly, nonmonetary balance sheet accounts are remeasured with the appropriate historical rates.All other balance sheet accounts are translated at the prevailing rate of exchange at the balance sheetdate, while the results of operations are translated at the average exchange rate in effect for the period.The gains and losses resulting from this remeasurement and translation are reflected in thedetermination of net income (loss).
To date, annual foreign currency translation adjustments, gains and losses have not beensignificant.
Comprehensive Income (Loss)
Comprehensive income (loss) includes all changes in stockholders’ equity during a period fromnon-owner sources. To date, accumulated other comprehensive income is comprised mostly of foreigncurrency translation.
Advertising Expenses
Advertising and promotional costs are expensed as incurred and amounted to $4,408, $3,584, and$2,957 for the years ended December 31, 2013, 2012 and 2011, respectively.
Treasury Stock
Repurchased shares of the Company’s common stock are held as treasury shares until they arereissued or retired. When the Company reissues treasury stock, and the proceeds from the sale exceedthe average price that was paid by the Company to acquire the shares, the Company records suchexcess as an increase in additional paid-in capital. Conversely, if the proceeds from the sale are lessthan the average price the Company paid to acquire the shares, the Company records such differenceas a decrease in additional paid-in capital to the extent of increases previously recorded, with thebalance recorded as a decrease in retained earnings.
Restricted Stock Withholdings
The Company issues restricted stock units as part of its equity incentive plans. For a majority ofthe restricted stock granted, the number of shares released on the date the restricted stock vests is netof the statutory withholding requirements that the Company pays to the appropriate taxing authoritieson behalf of its employees. The shares repurchased to satisfy the statutory withholding requirementsare immediately and effectively retired.
Income Taxes
The Company utilizes the asset and liability method of accounting for income taxes. Under thismethod, the deferred tax assets and liabilities are measured each year based on the difference betweenthe financial statement and tax basis of assets and liabilities at the applicable enacted tax rates. The
75

DTS, INC.
NOTES TO CONSOLIDATED FINANCIAL STATEMENTS (Continued)
(Amounts in thousands, except per share data)
Note 2—Significant Accounting Policies (Continued)
deferred tax provision is the result of changes in the deferred tax assets and liabilities. The Companyrecognizes interest and penalties related to income taxes in the provision for income taxes.Additionally, a valuation allowance is recorded for that portion of deferred tax assets for which it ismore likely than not that the assets will not be realized. In assessing the need for a valuationallowance, the Company considers all available positive and negative evidence, including scheduledreversals of deferred tax liabilities, projected future taxable income, tax planning strategies and recentfinancial performance. The Company believes it is more likely than not that its forecasted income,including income generated as a result of a tax planning strategy transacted on January 1, 2014, will besufficient to realize the deferred tax assets. In the event that all or part of the deferred tax assets aredetermined not to be realizable in the future, an adjustment to the valuation allowance may benecessary. A valuation allowance adjustment would be recorded in the provision for income taxes in theperiod such determination is made.
Fair Value of Financial Instruments
The carrying amount of cash equivalents, short-term investments, accounts receivable, accountspayable and accrued liabilities approximates fair value due to the short-term nature of theseinstruments. Long-term debt approximates fair value due to the variable rate nature of the debt.
Recent Accounting Pronouncement
In July 2013, the Financial Accounting Standards Board issued Accounting Standards Update(‘‘ASU’’) 2013-11, ‘‘Income Taxes (Topic 740): Presentation of an Unrecognized Tax Benefit When aNet Operating Loss Carryforward, a Similar Tax Loss, or a Tax Credit Carryforward Exists.’’ Thisstandard provides guidance regarding when an unrecognized tax benefit should be classified as areduction to a deferred tax asset or when it should be classified as a liability in the consolidatedbalance sheet. This ASU is effective prospectively for fiscal years, and interim periods within thoseyears, beginning after December 15, 2013. Early adoption and retrospective application is permitted.The Company is evaluating the potential impact of this adoption on its consolidated financialstatements.
76
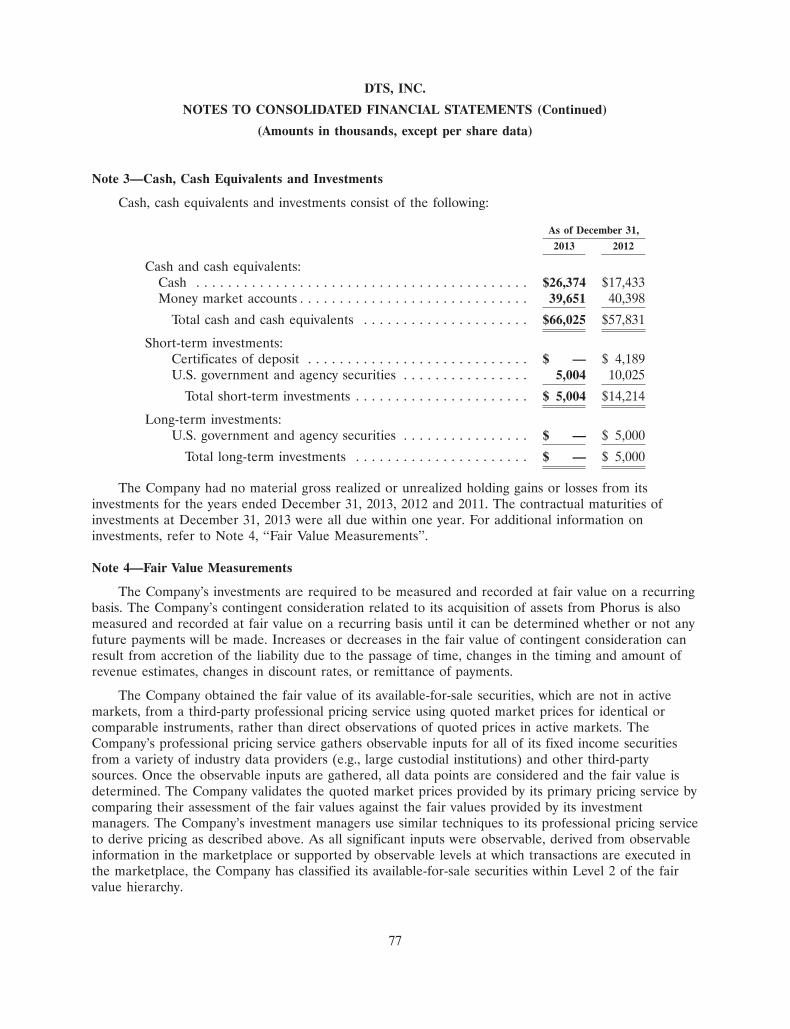
DTS, INC.
NOTES TO CONSOLIDATED FINANCIAL STATEMENTS (Continued)
(Amounts in thousands, except per share data)
Note 3—Cash, Cash Equivalents and Investments
Cash, cash equivalents and investments consist of the following:
As of December 31,
2013 2012
Cash and cash equivalents:Cash . . . . . . . . . . . . . . . . . . . . . . . . . . . . . . . . . . . . . . . . . . $26,374 $17,433Money market accounts . . . . . . . . . . . . . . . . . . . . . . . . . . . . . 39,651 40,398
Total cash and cash equivalents . . . . . . . . . . . . . . . . . . . . . $66,025 $57,831
Short-term investments:Certificates of deposit . . . . . . . . . . . . . . . . . . . . . . . . . . . . $ — $ 4,189U.S. government and agency securities . . . . . . . . . . . . . . . . 5,004 10,025
Total short-term investments . . . . . . . . . . . . . . . . . . . . . . $ 5,004 $14,214
Long-term investments:U.S. government and agency securities . . . . . . . . . . . . . . . . $ — $ 5,000
Total long-term investments . . . . . . . . . . . . . . . . . . . . . . $ — $ 5,000
The Company had no material gross realized or unrealized holding gains or losses from itsinvestments for the years ended December 31, 2013, 2012 and 2011. The contractual maturities ofinvestments at December 31, 2013 were all due within one year. For additional information oninvestments, refer to Note 4, ‘‘Fair Value Measurements’’.
Note 4—Fair Value Measurements
The Company’s investments are required to be measured and recorded at fair value on a recurringbasis. The Company’s contingent consideration related to its acquisition of assets from Phorus is alsomeasured and recorded at fair value on a recurring basis until it can be determined whether or not anyfuture payments will be made. Increases or decreases in the fair value of contingent consideration canresult from accretion of the liability due to the passage of time, changes in the timing and amount ofrevenue estimates, changes in discount rates, or remittance of payments.
The Company obtained the fair value of its available-for-sale securities, which are not in activemarkets, from a third-party professional pricing service using quoted market prices for identical orcomparable instruments, rather than direct observations of quoted prices in active markets. TheCompany’s professional pricing service gathers observable inputs for all of its fixed income securitiesfrom a variety of industry data providers (e.g., large custodial institutions) and other third-partysources. Once the observable inputs are gathered, all data points are considered and the fair value isdetermined. The Company validates the quoted market prices provided by its primary pricing service bycomparing their assessment of the fair values against the fair values provided by its investmentmanagers. The Company’s investment managers use similar techniques to its professional pricing serviceto derive pricing as described above. As all significant inputs were observable, derived from observableinformation in the marketplace or supported by observable levels at which transactions are executed inthe marketplace, the Company has classified its available-for-sale securities within Level 2 of the fairvalue hierarchy.
77
DTS, INC.
NOTES TO CONSOLIDATED FINANCIAL STATEMENTS (Continued)
(Amounts in thousands, except per share data)
Note 4—Fair Value Measurements (Continued)
The initial fair value of contingent consideration was determined at the date of acquisition, and itwas subject to the achievement of certain revenue milestones over a three and a half year period fromthe date of the Phorus asset acquisition. The Company used the income approach, which included ananalysis of the cash flows and risks associated with achieving such cash flows, to value the contingentconsideration based on two scenarios. One scenario was a risk neutral analysis and utilized a discountrate of 4%. The second scenario utilized was not a risk neutral analysis and utilized a discount rate of13%. At December 31, 2012, there were no material changes to the fair value of contingentconsideration or assumptions used since the date of acquisition. In the third quarter of 2013, theCompany recorded a gain of $5,300 in the consolidated statement of operations resulting from adecrease in the estimated fair value of the contingent consideration.
In October 2013, the Asset Purchase Agreement was amended to reduce the total potentialcontingent consideration to $2,000, and the revenue milestones were reduced to reflect changes madeby the Company in the Phorus business model. Under the amendment, contingent consideration of$500 could be due and payable at the end of 2013 and 2014, and $1,000 could be due and payable atthe end of 2015. In the fourth quarter of 2013, the first milestone was achieved and consideration of$500 was paid. As of December 31, 2013, the Company measured the fair value of the remainingcontingent consideration based on the amended terms. The Company used an income approach, basedon an updated analysis of cash flows in a non-risk neutral scenario, which utilized a discount rate of17%. As a result of the amended terms and the other assumptions noted, the Company adjusted thefair value of the contingent consideration to $1,000 as of December 31, 2013, and recognized a gain of$700 in the consolidated statement of operations in the fourth quarter of 2013, resulting in a total gainof $6,000 for the year ended December 31, 2013. Considerable judgment is required in the assumptionsused in fair value measurements. Accordingly, use of different assumptions, such as significant increasesor decreases in estimated revenues, cash flows or the discount rate, could result in materially differentfair value estimates.
For additional information on contingent consideration, refer to Notes 6 and 10, ‘‘BusinessCombinations’’ and ‘‘Commitments and Contingencies’’, respectively.
78

DTS, INC.
NOTES TO CONSOLIDATED FINANCIAL STATEMENTS (Continued)
(Amounts in thousands, except per share data)
Note 4—Fair Value Measurements (Continued)
The Company’s financial assets and liabilities, measured at fair value on a recurring basis, were asfollows:
Fair Value Measurements at ReportingDate Using
QuotedPrices in
Active SignificantMarkets for Other Significant
Identical Observable UnobservableAssets Inputs Inputs
Assets (Liabilities) Total (Level 1) (Level 2) (Level 3)
As of December 31, 2013U.S. government and agency securities . . . . . . . . . . . $ 5,004 $— $ 5,004 $ —Contingent consideration(1) . . . . . . . . . . . . . . . . . . . $ (1,000) $— $ — $(1,000)
As of December 31, 2012Certificates of deposit . . . . . . . . . . . . . . . . . . . . . . . $ 4,189 $— $ 4,189 $ —U.S. government and agency securities . . . . . . . . . . . $15,025 $— $15,025 $ —Contingent consideration(2) . . . . . . . . . . . . . . . . . . . $ (7,500) $— $ — $(7,500)
(1) As of December 31, 2013, $400 and $600 were classified in accrued expenses and other long-termliabilities, respectively, on the consolidated balance sheet.
(2) As of December 31, 2012, $2,200 and $5,300 were classified in accrued expenses and otherlong-term liabilities, respectively, on the consolidated balance sheet.
The following table summarizes the changes in the fair value of assets (liabilities) categorized asLevel 3:
Balance at December 31, 2012 . . . . . . . . . . . . . . . . . . . . . . . . . . . . . . . . . $(7,500)Payment of contingent consideration . . . . . . . . . . . . . . . . . . . . . . . . . . . . . 500Change in fair value of contingent consideration(1) . . . . . . . . . . . . . . . . . . 6,000
Balance at December 31, 2013 . . . . . . . . . . . . . . . . . . . . . . . . . . . . . . . . . $(1,000)
(1) This change is reflected within operating expenses in the consolidated statement ofoperations.
79

DTS, INC.
NOTES TO CONSOLIDATED FINANCIAL STATEMENTS (Continued)
(Amounts in thousands, except per share data)
Note 5—Property and Equipment
Property and equipment consist of the following:
As of December 31,
2013 2012
Land . . . . . . . . . . . . . . . . . . . . . . . . . . . . . . . . . . . . . . . . . . . $ 6,600 $ 6,600Building and improvements . . . . . . . . . . . . . . . . . . . . . . . . . . 21,433 21,342Machinery and equipment . . . . . . . . . . . . . . . . . . . . . . . . . . . 5,264 4,629Office furniture and fixtures . . . . . . . . . . . . . . . . . . . . . . . . . . 7,560 6,824Leasehold improvements . . . . . . . . . . . . . . . . . . . . . . . . . . . . 4,409 4,030Software . . . . . . . . . . . . . . . . . . . . . . . . . . . . . . . . . . . . . . . . 6,738 6,568
52,004 49,993Less: Accumulated depreciation . . . . . . . . . . . . . . . . . . . . . . . (21,888) (16,668)
Property and equipment, net . . . . . . . . . . . . . . . . . . . . . . . . $ 30,116 $ 33,325
Depreciation expense was $5,550, $4,833, and $3,965 for the years ended December 31, 2013, 2012and 2011, respectively.
Note 6—Business Combinations
Acquisition of SRS
On July 20, 2012, the Company completed its acquisition of SRS, which was accounted for usingthe acquisition method of accounting. Aggregate consideration for this Merger was valued at $124,785.The preliminary allocation of the purchase price was prepared by the Company, based in part onpreliminary estimates and valuations of independent consultants. The Company completed the finalallocation of the purchase price related to SRS in 2013.
During the year ended December 31, 2013, the Company recognized adjustments to the fair valueof certain assets acquired and liabilities assumed. The effect of these adjustments on the preliminarypurchase price allocation was an increase in accounts receivable of $2,550, an increase in prepaidexpenses and other current assets of $303, a decrease in goodwill of $2,896, a decrease in deferred taxassets of $25, an increase in accounts payable of $25, and a decrease in accrued expenses of $93. The
80
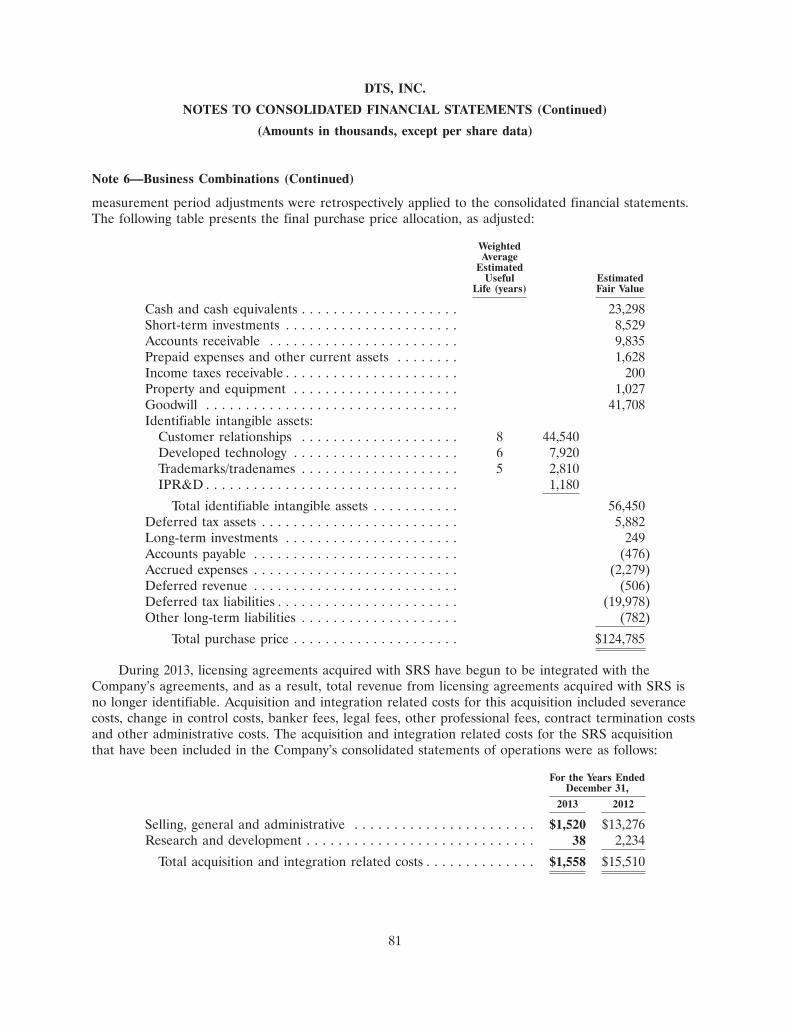
DTS, INC.
NOTES TO CONSOLIDATED FINANCIAL STATEMENTS (Continued)
(Amounts in thousands, except per share data)
Note 6—Business Combinations (Continued)
measurement period adjustments were retrospectively applied to the consolidated financial statements.The following table presents the final purchase price allocation, as adjusted:
WeightedAverage
EstimatedUseful Estimated
Life (years) Fair Value
Cash and cash equivalents . . . . . . . . . . . . . . . . . . . . 23,298Short-term investments . . . . . . . . . . . . . . . . . . . . . . 8,529Accounts receivable . . . . . . . . . . . . . . . . . . . . . . . . 9,835Prepaid expenses and other current assets . . . . . . . . 1,628Income taxes receivable . . . . . . . . . . . . . . . . . . . . . . 200Property and equipment . . . . . . . . . . . . . . . . . . . . . 1,027Goodwill . . . . . . . . . . . . . . . . . . . . . . . . . . . . . . . . 41,708Identifiable intangible assets:
Customer relationships . . . . . . . . . . . . . . . . . . . . 8 44,540Developed technology . . . . . . . . . . . . . . . . . . . . . 6 7,920Trademarks/tradenames . . . . . . . . . . . . . . . . . . . . 5 2,810IPR&D . . . . . . . . . . . . . . . . . . . . . . . . . . . . . . . . 1,180
Total identifiable intangible assets . . . . . . . . . . . 56,450Deferred tax assets . . . . . . . . . . . . . . . . . . . . . . . . . 5,882Long-term investments . . . . . . . . . . . . . . . . . . . . . . 249Accounts payable . . . . . . . . . . . . . . . . . . . . . . . . . . (476)Accrued expenses . . . . . . . . . . . . . . . . . . . . . . . . . . (2,279)Deferred revenue . . . . . . . . . . . . . . . . . . . . . . . . . . (506)Deferred tax liabilities . . . . . . . . . . . . . . . . . . . . . . . (19,978)Other long-term liabilities . . . . . . . . . . . . . . . . . . . . (782)
Total purchase price . . . . . . . . . . . . . . . . . . . . . $124,785
During 2013, licensing agreements acquired with SRS have begun to be integrated with theCompany’s agreements, and as a result, total revenue from licensing agreements acquired with SRS isno longer identifiable. Acquisition and integration related costs for this acquisition included severancecosts, change in control costs, banker fees, legal fees, other professional fees, contract termination costsand other administrative costs. The acquisition and integration related costs for the SRS acquisitionthat have been included in the Company’s consolidated statements of operations were as follows:
For the Years EndedDecember 31,
2013 2012
Selling, general and administrative . . . . . . . . . . . . . . . . . . . . . . . $1,520 $13,276Research and development . . . . . . . . . . . . . . . . . . . . . . . . . . . . . 38 2,234
Total acquisition and integration related costs . . . . . . . . . . . . . . $1,558 $15,510
81
DTS, INC.
NOTES TO CONSOLIDATED FINANCIAL STATEMENTS (Continued)
(Amounts in thousands, except per share data)
Note 6—Business Combinations (Continued)
Acquisition of Phorus’ Assets
On July 5, 2012, the Company acquired substantially all of the assets of Phorus. This AssetPurchase was accounted for using the acquisition method of accounting. The preliminary allocation ofthe purchase price was prepared by the Company, based in part on preliminary estimates andvaluations of independent consultants. The final allocation of the purchase price was completed in2013, resulting in no adjustments.
The Company paid initial cash consideration of $3,000, including a $300 holdback for potentialindemnification matters, upon the closing of the acquisition, and it would have been required to pay upto an additional $10,000 in consideration subject to the achievement of certain revenue milestones. InOctober 2013, the Asset Purchase Agreement was amended to reduce the total potential contingentconsideration to $2,000, and the revenue milestones were reduced to reflect changes made by theCompany in the Phorus business model. For additional information on contingent consideration, referto Note 4, ‘‘Fair Value Measurements’’.
Acquisition and integration related costs for this acquisition totaled $8 and $193 for the yearended December 31, 2013 and 2012, respectively, and were included in the Company’s consolidatedstatement of operations within selling, general and administrative expenses. These costs included legalfees, other professional fees and other administrative costs.
Note 7—Goodwill and Other Intangibles
Due to revised forecasts developed during our annual strategic planning process in the thirdquarter of 2013 and lower than expected historical results, the Company tested definite-lived intangiblesassociated with the Phorus reporting unit for impairment as of September 30, 2013. The Company useda discounted cash flow method to estimate the fair value of the definite-lived intangibles andrecognized an impairment charge for the amount that the carrying amount exceeded the fair value ofsuch assets. Based on results of the test, the Company recorded an impairment charge of $2,460 withinoperating expenses in the consolidated statement of operations for the year ended December 31, 2013,consisting of $2,304 and $156 in write-downs of existing technology and non-compete agreements,respectively.
As a result of the aforementioned revised forecasts and lower than expected historical results, theCompany concluded that there were indications of potential impairment of the goodwill and indefinite-lived intangibles attributable to the Phorus reporting unit during the third quarter of 2013. Therefore,the Company conducted an interim impairment test of goodwill and indefinite-lived intangiblesassociated with the Phorus reporting unit as of September 30, 2013. The Company used a discountedcash flow method to estimate the fair value of the indefinite-lived intangibles and recognized animpairment charge for the amount that the carrying amount of the assets exceeded the fair value ofsuch assets. Based on results of the test, the Company recorded an impairment charge for IPR&D of$360 within operating expenses in the consolidated statement of operations for the year endedDecember 31, 2013.
For the goodwill impairment test as of September 30, 2013, the Phorus reporting unit had negativecarrying value, and thus the Company performed a qualitative assessment and determined that it wasmore likely than not that a goodwill impairment existed due to the revised forecasts and lower than
82

DTS, INC.
NOTES TO CONSOLIDATED FINANCIAL STATEMENTS (Continued)
(Amounts in thousands, except per share data)
Note 7—Goodwill and Other Intangibles (Continued)
expected historical results. As such, the Company proceeded to step two of the goodwill impairmenttest, whereby an impairment charge would be recognized to the extent that the carrying value ofgoodwill associated with the Phorus reporting unit exceeded the estimated fair value. The Companyestimated the fair value of the goodwill as the difference between the estimated fair value of thereporting unit and the estimated fair values of the individual assets and liabilities. The Companyestimated the fair value of the reporting unit using both the income and market approaches, includinga discounted cash flow method, and estimated that the fair value of goodwill associated with the Phorusreporting unit substantially exceeded the carrying value. As such, the Company did not recognize animpairment charge on the Phorus goodwill.
Additionally, in the fourth quarter of 2013, the Company performed its annual assessment ofgoodwill impairment for both the Phorus reporting unit and the rest of the Company as of October 31,2013. Based on the assessments, no goodwill impairment was identified. To date, there has been noimpairment of goodwill.
The following table summarizes the changes in goodwill:
Goodwill
Balance at December 31, 2011 . . . . . . . . . . . . . . . . . . . . . . . . . . . . . . . . . $ 1,257Increase in goodwill related to acquisitions . . . . . . . . . . . . . . . . . . . . . . . . 51,174Preliminary purchase price allocation adjustments, net . . . . . . . . . . . . . . . . (1,117)Measurement period adjustments applied retrospectively, net . . . . . . . . . . . (2,896)
Balance at December 31, 2012 and 2013 . . . . . . . . . . . . . . . . . . . . . . . . . . $48,418
The following table summarizes the Company’s other intangible assets:
As of December 31, 2013 As of December 31, 2012
Weighted Net NetAverage Gross Accumulated Carrying Gross Accumulated Carrying
Life (Years) Amount(1) Amortization Amount Amount Amortization Amount
Existing technology . . . . . . . . . . 6 $16,763 $ (8,193) $ 8,570 $17,918 $ (5,651) $12,267Customer relationships . . . . . . . . 8 45,590 (8,792) 36,798 45,590 (3,074) 42,516Non-compete . . . . . . . . . . . . . . 2 384 (350) 34 540 (131) 409Tradename . . . . . . . . . . . . . . . . 5 3,000 (1,002) 1,998 3,000 (440) 2,560Patents . . . . . . . . . . . . . . . . . . . 5 3,036 (953) 2,083 2,170 (779) 1,391Trademarks . . . . . . . . . . . . . . . . 10 669 (297) 372 598 (251) 347
Total amortizable intangibleassets . . . . . . . . . . . . . . . . . 69,442 (19,587) 49,855 69,816 (10,326) 59,490
IPR&D . . . . . . . . . . . . . . . . . . . 370 — 370 1,910 — 1,910
Total intangible assets . . . . . . . $69,812 $(19,587) $50,225 $71,726 $(10,326) $61,400
(1) Includes write-downs of $2,304 for existing technology, $156 for non-compete, and $360 forIPR&D, which are reflected within operating expenses in the consolidated statement of operationsfor the year ended December 31, 2013.
83

DTS, INC.
NOTES TO CONSOLIDATED FINANCIAL STATEMENTS (Continued)
(Amounts in thousands, except per share data)
Note 7—Goodwill and Other Intangibles (Continued)
The following table summarizes amortization of intangibles included in the Company’sconsolidated statements of operations:
For the Years EndedDecember 31,
2013 2012 2011
Cost of revenue(1) . . . . . . . . . . . . . . . . . . . . . . . . . . . . . $8,848 $4,151 $ 731Operating expenses . . . . . . . . . . . . . . . . . . . . . . . . . . . . . 1,001 641 641
Total amortization of intangible assets . . . . . . . . . . . . . $9,849 $4,792 $1,372
(1) Includes amortization of $588 for the year ended December 31, 2013 associated withcertain service arrangements classified as other assets on the consolidated balance sheet.
The Company expects the future amortization of intangible assets held at December 31, 2013 to beas follows:
EstimatedAmortization
Years Ending December 31, Expense
2014 . . . . . . . . . . . . . . . . . . . . . . . . . . . . . . . . . . . . . . . . . . . . . . . . . . $ 9,0472015 . . . . . . . . . . . . . . . . . . . . . . . . . . . . . . . . . . . . . . . . . . . . . . . . . . 8,9962016 . . . . . . . . . . . . . . . . . . . . . . . . . . . . . . . . . . . . . . . . . . . . . . . . . . 8,2932017 . . . . . . . . . . . . . . . . . . . . . . . . . . . . . . . . . . . . . . . . . . . . . . . . . . 7,9322018 . . . . . . . . . . . . . . . . . . . . . . . . . . . . . . . . . . . . . . . . . . . . . . . . . . 6,8062019 and thereafter . . . . . . . . . . . . . . . . . . . . . . . . . . . . . . . . . . . . . . . 8,781
Total . . . . . . . . . . . . . . . . . . . . . . . . . . . . . . . . . . . . . . . . . . . . . . . . $49,855
Note 8—Accrued Expenses
Accrued expenses consist of the following:
As of December 31,
2013 2012
Accrued payroll and related benefits . . . . . . . . . . . . . . . . . . . . . $ 9,073 $ 9,810Contingent consideration(1) . . . . . . . . . . . . . . . . . . . . . . . . . . . 400 2,200Other . . . . . . . . . . . . . . . . . . . . . . . . . . . . . . . . . . . . . . . . . . . 2,669 3,851
Total accrued expenses . . . . . . . . . . . . . . . . . . . . . . . . . . . . . $12,142 $15,861
(1) For additional information, refer to Notes 4, 6, and 10, ‘‘Fair Value Measurements’’,‘‘Business Combinations’’, and ‘‘Commitments and Contingencies’’, respectively.
84
DTS, INC.
NOTES TO CONSOLIDATED FINANCIAL STATEMENTS (Continued)
(Amounts in thousands, except per share data)
Note 9—Long-term Debt
On July 18, 2012, the Company entered into a Loan Agreement (the ‘‘Loan Agreement’’), betweenthe Company and Union Bank, N.A. (‘‘Union Bank’’), together with the other lenders thereunder fromtime to time (collectively, the ‘‘Lenders’’). The Loan Agreement provides the Company with a $30,000revolving line of credit (the ‘‘Revolver’’), with a $5,000 sublimit for the issuance of standby andcommercial letters of credit, to use to finance permitted acquisitions and for working capital andgeneral corporate purposes. The Company may increase the Revolver by up to $20,000 subject tocertain conditions. As of December 31, 2013 and 2012, $30,000 was outstanding under the Revolver.
Amounts borrowed under the Revolver bear interest, at the option of the Company, at either(i) LIBOR (as defined in the Loan Agreement) plus 1.0% or (ii) the higher of (a) the rate of interestmost recently announced by Union Bank as its prime rate or (b) the Federal Funds Rate plus 0.50%.Pursuant to the Loan Agreement, the Company is required to pay an annual commitment fee of 0.25%on the unused portion of the Revolver.
The Company’s ability to borrow amounts under the Revolver is conditioned upon its compliancewith specified covenants, including certain reporting covenants and financial covenants that require theCompany to maintain a (i) minimum rolling four quarter adjusted EBITDA of $32,000, (ii) maximumleverage ratio, defined as funded debt divided by adjusted EBITDA, not to exceed 1.50 to 1.00 and(iii) minimum liquidity amount of $30,000. In addition, the Loan Agreement contains covenants thatrestrict, among other things, the Company’s ability to dispose of property, enter into mergers,acquisitions or other business combination transactions, grant liens, pay dividends and make certainother restricted payments.
The Loan Agreement contains customary events of default. All advances under the Revolver willbecome due and payable on July 18, 2015, or earlier in the event of a default. Accordingly, theRevolver has been classified as a long-term liability on the consolidated balance sheet. Upon theoccurrence and during the continuance of an event of default, the Lenders may declare all outstandingamounts under the Revolver immediately due and payable, and may terminate commitments to makeany additional advances thereunder.
Union Bank and its affiliates may in the future perform, for the Company and its affiliates, variouscommercial banking, investment banking, financial advisory or other services, for which they may in thefuture receive customary compensation and expense reimbursement.
In connection with the Loan Agreement, the Company and all of its U.S. subsidiaries, entered intoa security agreement with Union Bank as agent for the Lenders pursuant to which the Company andits U.S. subsidiaries granted the Lenders a first priority perfected security interest in (i) all theirrespective current and later acquired tangible and intangible assets in current and future domesticsubsidiaries and (ii) up to 65% of the stock of the Company’s current and future foreign subsidiaries tosecure amounts borrowed under the Revolver.
85
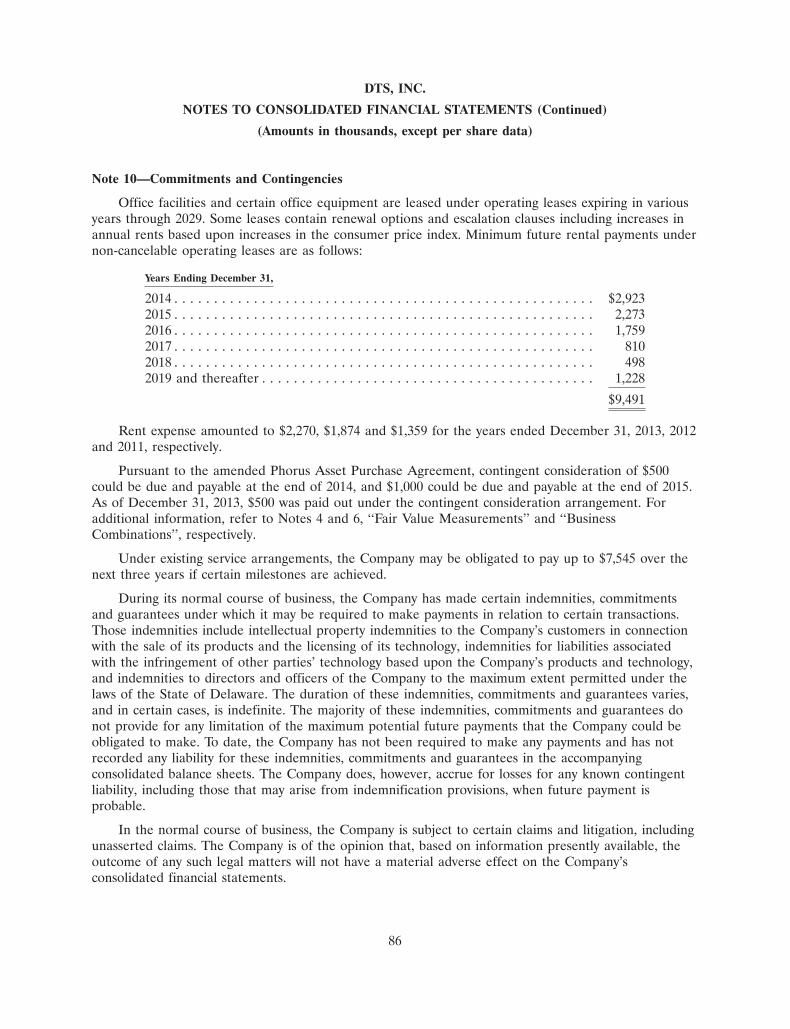
DTS, INC.
NOTES TO CONSOLIDATED FINANCIAL STATEMENTS (Continued)
(Amounts in thousands, except per share data)
Note 10—Commitments and Contingencies
Office facilities and certain office equipment are leased under operating leases expiring in variousyears through 2029. Some leases contain renewal options and escalation clauses including increases inannual rents based upon increases in the consumer price index. Minimum future rental payments undernon-cancelable operating leases are as follows:
Years Ending December 31,
2014 . . . . . . . . . . . . . . . . . . . . . . . . . . . . . . . . . . . . . . . . . . . . . . . . . . . . . $2,9232015 . . . . . . . . . . . . . . . . . . . . . . . . . . . . . . . . . . . . . . . . . . . . . . . . . . . . . 2,2732016 . . . . . . . . . . . . . . . . . . . . . . . . . . . . . . . . . . . . . . . . . . . . . . . . . . . . . 1,7592017 . . . . . . . . . . . . . . . . . . . . . . . . . . . . . . . . . . . . . . . . . . . . . . . . . . . . . 8102018 . . . . . . . . . . . . . . . . . . . . . . . . . . . . . . . . . . . . . . . . . . . . . . . . . . . . . 4982019 and thereafter . . . . . . . . . . . . . . . . . . . . . . . . . . . . . . . . . . . . . . . . . . 1,228
$9,491
Rent expense amounted to $2,270, $1,874 and $1,359 for the years ended December 31, 2013, 2012and 2011, respectively.
Pursuant to the amended Phorus Asset Purchase Agreement, contingent consideration of $500could be due and payable at the end of 2014, and $1,000 could be due and payable at the end of 2015.As of December 31, 2013, $500 was paid out under the contingent consideration arrangement. Foradditional information, refer to Notes 4 and 6, ‘‘Fair Value Measurements’’ and ‘‘BusinessCombinations’’, respectively.
Under existing service arrangements, the Company may be obligated to pay up to $7,545 over thenext three years if certain milestones are achieved.
During its normal course of business, the Company has made certain indemnities, commitmentsand guarantees under which it may be required to make payments in relation to certain transactions.Those indemnities include intellectual property indemnities to the Company’s customers in connectionwith the sale of its products and the licensing of its technology, indemnities for liabilities associatedwith the infringement of other parties’ technology based upon the Company’s products and technology,and indemnities to directors and officers of the Company to the maximum extent permitted under thelaws of the State of Delaware. The duration of these indemnities, commitments and guarantees varies,and in certain cases, is indefinite. The majority of these indemnities, commitments and guarantees donot provide for any limitation of the maximum potential future payments that the Company could beobligated to make. To date, the Company has not been required to make any payments and has notrecorded any liability for these indemnities, commitments and guarantees in the accompanyingconsolidated balance sheets. The Company does, however, accrue for losses for any known contingentliability, including those that may arise from indemnification provisions, when future payment isprobable.
In the normal course of business, the Company is subject to certain claims and litigation, includingunasserted claims. The Company is of the opinion that, based on information presently available, theoutcome of any such legal matters will not have a material adverse effect on the Company’sconsolidated financial statements.
86

DTS, INC.
NOTES TO CONSOLIDATED FINANCIAL STATEMENTS (Continued)
(Amounts in thousands, except per share data)
Note 11—Income Taxes
U.S. and foreign income (loss) before income taxes and details of the provision (benefit) forincome taxes were as follows:
For the Years EndedDecember 31,
2013 2012 2011
U.S. . . . . . . . . . . . . . . . . . . . . . . . . . . . . . . . . . . . $(18,019) $(22,498) $ 7,667Foreign . . . . . . . . . . . . . . . . . . . . . . . . . . . . . . . . . 25,140 14,265 22,263
Income (loss) before income taxes . . . . . . . . . . . . . . $ 7,121 $ (8,233) $29,930
Current:Federal . . . . . . . . . . . . . . . . . . . . . . . . . . . . . . . . $ (1,135) $ (2,289) $ 610State . . . . . . . . . . . . . . . . . . . . . . . . . . . . . . . . . . 19 (1,080) 179Foreign . . . . . . . . . . . . . . . . . . . . . . . . . . . . . . . . 7,331 5,642 7,999
Total current . . . . . . . . . . . . . . . . . . . . . . . . . . 6,215 2,273 8,788
Deferred:Federal . . . . . . . . . . . . . . . . . . . . . . . . . . . . . . . . (13,301) 2,974 2,435State . . . . . . . . . . . . . . . . . . . . . . . . . . . . . . . . . . (1,133) 971 724Foreign . . . . . . . . . . . . . . . . . . . . . . . . . . . . . . . . (415) 1,447 (286)
Total deferred . . . . . . . . . . . . . . . . . . . . . . . . . (14,849) 5,392 2,873
Provision (benefit) for income taxes . . . . . . . . . . . . . $ (8,634) $ 7,665 $11,661
87
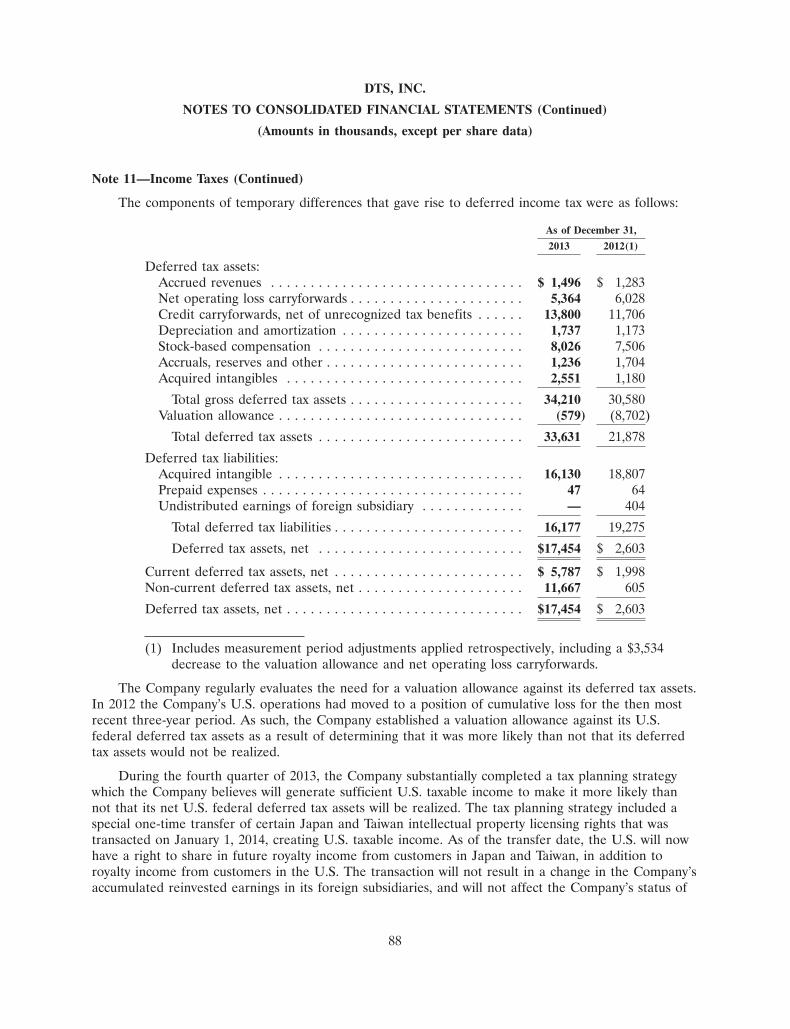
DTS, INC.
NOTES TO CONSOLIDATED FINANCIAL STATEMENTS (Continued)
(Amounts in thousands, except per share data)
Note 11—Income Taxes (Continued)
The components of temporary differences that gave rise to deferred income tax were as follows:
As of December 31,
2013 2012(1)
Deferred tax assets:Accrued revenues . . . . . . . . . . . . . . . . . . . . . . . . . . . . . . . . $ 1,496 $ 1,283Net operating loss carryforwards . . . . . . . . . . . . . . . . . . . . . . 5,364 6,028Credit carryforwards, net of unrecognized tax benefits . . . . . . 13,800 11,706Depreciation and amortization . . . . . . . . . . . . . . . . . . . . . . . 1,737 1,173Stock-based compensation . . . . . . . . . . . . . . . . . . . . . . . . . . 8,026 7,506Accruals, reserves and other . . . . . . . . . . . . . . . . . . . . . . . . . 1,236 1,704Acquired intangibles . . . . . . . . . . . . . . . . . . . . . . . . . . . . . . 2,551 1,180
Total gross deferred tax assets . . . . . . . . . . . . . . . . . . . . . . 34,210 30,580Valuation allowance . . . . . . . . . . . . . . . . . . . . . . . . . . . . . . . (579) (8,702)
Total deferred tax assets . . . . . . . . . . . . . . . . . . . . . . . . . . 33,631 21,878
Deferred tax liabilities:Acquired intangible . . . . . . . . . . . . . . . . . . . . . . . . . . . . . . . 16,130 18,807Prepaid expenses . . . . . . . . . . . . . . . . . . . . . . . . . . . . . . . . . 47 64Undistributed earnings of foreign subsidiary . . . . . . . . . . . . . — 404
Total deferred tax liabilities . . . . . . . . . . . . . . . . . . . . . . . . 16,177 19,275
Deferred tax assets, net . . . . . . . . . . . . . . . . . . . . . . . . . . $17,454 $ 2,603
Current deferred tax assets, net . . . . . . . . . . . . . . . . . . . . . . . . $ 5,787 $ 1,998Non-current deferred tax assets, net . . . . . . . . . . . . . . . . . . . . . 11,667 605
Deferred tax assets, net . . . . . . . . . . . . . . . . . . . . . . . . . . . . . . $17,454 $ 2,603
(1) Includes measurement period adjustments applied retrospectively, including a $3,534decrease to the valuation allowance and net operating loss carryforwards.
The Company regularly evaluates the need for a valuation allowance against its deferred tax assets.In 2012 the Company’s U.S. operations had moved to a position of cumulative loss for the then mostrecent three-year period. As such, the Company established a valuation allowance against its U.S.federal deferred tax assets as a result of determining that it was more likely than not that its deferredtax assets would not be realized.
During the fourth quarter of 2013, the Company substantially completed a tax planning strategywhich the Company believes will generate sufficient U.S. taxable income to make it more likely thannot that its net U.S. federal deferred tax assets will be realized. The tax planning strategy included aspecial one-time transfer of certain Japan and Taiwan intellectual property licensing rights that wastransacted on January 1, 2014, creating U.S. taxable income. As of the transfer date, the U.S. will nowhave a right to share in future royalty income from customers in Japan and Taiwan, in addition toroyalty income from customers in the U.S. The transaction will not result in a change in the Company’saccumulated reinvested earnings in its foreign subsidiaries, and will not affect the Company’s status of
88

DTS, INC.
NOTES TO CONSOLIDATED FINANCIAL STATEMENTS (Continued)
(Amounts in thousands, except per share data)
Note 11—Income Taxes (Continued)
being permanently reinvested in its foreign subsidiaries. As a result of the U.S. taxable income createdby this tax planning strategy, the Company has concluded that it is more likely than not that the U.S.federal valuation allowance is not necessary. Accordingly, the Company released all of the U.S. federalvaluation allowance against net U.S. federal deferred tax assets resulting in a $7,919 increase in the2013 benefit for income taxes.
The intellectual property rights transferred on January 1, 2014 will not result in a change in theCompany’s accumulated reinvested earnings in its foreign subsidiaries, and thus no deferred tax liabilitywas required to be recorded in 2013. As a result, the financial statement impact of the transfer will bereflected in the Company’s income tax provision for the quarter ending March 31, 2014 as a taxexpense, net of foreign tax credits, offset by the establishment of a deferred tax asset related to futuretax deductions under Section 197 of the Internal Revenue Code (‘‘IRC’’).
As of December 31, 2013, the Company had approximately $29,943 in tax loss carryforwards.These tax loss carryforwards consist of federal and state net operating losses of $14,574 and $15,369,respectively, and begin to expire in 2022 and 2018, respectively. Included in these tax loss carryforwardsare stock-based compensation deductions that, when fully utilized, reduce cash income taxes and willresult in a financial statement income tax benefit of $1,465. The future income tax benefit, if realized,will be recorded to additional paid-in capital on the consolidated balance sheet. The Company followsthe with-and-without approach for determining when the stock-based compensation deductions areconsidered realized. As of December 31, 2013, the Company had foreign tax credit carryforwards of$15,745, which begin to expire in 2015, and R&D and other credits of $6,043, which begin to expire in2019. Utilization of certain federal tax loss carryforwards and credit carryforwards are subject to anannual limitation under IRC Section 382.
The income tax provision (benefit) excludes the current year income tax deductions related to theissuance of common stock from the exercise of stock options for which no compensation expense wasrecorded for accounting purposes or for which the income tax deduction exceeded the expenserecorded for accounting purposes.
89

DTS, INC.
NOTES TO CONSOLIDATED FINANCIAL STATEMENTS (Continued)
(Amounts in thousands, except per share data)
Note 11—Income Taxes (Continued)
The provision (benefit) for income taxes differs from the amount obtained by applying the federalstatutory income tax rate to income (loss) before income taxes as follows:
For the Years EndedDecember 31,
2013 2012 2011
Statutory federal rate . . . . . . . . . . . . . . . . . . . . . . . . . 35.0% 35.0% 35.0%State income taxes, net . . . . . . . . . . . . . . . . . . . . . . . . (5.5) (2.1) 1.8Effect of varying foreign rates . . . . . . . . . . . . . . . . . . . (96.5) 50.1 (17.8)Foreign withholding taxes . . . . . . . . . . . . . . . . . . . . . . 78.8 (60.2) 18.3Unremitted earnings of foreign subsidiary . . . . . . . . . . . (3.4) (9.7) —Non-deductible transaction costs . . . . . . . . . . . . . . . . . — (13.8) —Non-deductible meals and entertainment . . . . . . . . . . . 1.0 (0.6) 0.1Stock-based compensation expense . . . . . . . . . . . . . . . . 7.0 (7.6) 1.5Research and development credits . . . . . . . . . . . . . . . . (11.9) — (1.0)Unrecognized tax benefits . . . . . . . . . . . . . . . . . . . . . . 8.0 38.3 0.9Tax audit settlements . . . . . . . . . . . . . . . . . . . . . . . . . . (11.6) (108.9) —Deferred tax asset adjustment . . . . . . . . . . . . . . . . . . . (12.0) 3.6 —Valuation allowance . . . . . . . . . . . . . . . . . . . . . . . . . . (111.2) (16.4) —Other . . . . . . . . . . . . . . . . . . . . . . . . . . . . . . . . . . . . . 1.1 (0.8) 0.2
Effective tax rate . . . . . . . . . . . . . . . . . . . . . . . . . . . . (121.2)% (93.1)% 39.0%
The Company has not provided for U.S. income taxes or foreign withholding taxes in its effectivetax rate on approximately $58,756 of undistributed earnings of foreign subsidiaries as of December 31,2013. It is not practicable to calculate the unrecognized deferred tax liability on the unremittedearnings. The Company intends to reinvest these earnings indefinitely in operations outside of the U.S.,and accordingly, no deferred tax liability has been established relative to these earnings.
As of December 31, 2013 and 2012, the Company’s uncertain tax positions were $9,701 and$11,279, respectively, which were recorded in long-term deferred tax assets and other long-termliabilities. These amounts include $121 and $222, respectively, for accrued interest. The decrease inunrecognized tax benefits during the year ended December 31, 2013 was primarily attributable to areduction of tax reserves from tax audits that were effectively settled, partially offset by uncertain taxpositions relating to transfer pricing positions taken with respect to the Company’s foreign subsidiariesand the California franchise tax sourcing methodology. These unrecognized tax benefits would affectthe Company’s effective tax rate if recognized. The Company believes that it has adequately providedfor all tax positions based on its assessment of many factors, including past experience andinterpretations of tax law applied to the facts of each matter. However, due to inherent uncertainties inestimating accruals for uncertain tax positions, amounts asserted by tax authorities could be materiallydifferent than the amounts accrued by the Company. Accordingly, the Company’s provision on federal,state and foreign tax-related matters to be recorded in the future may change as revised estimates aremade or the underlying matters are settled or otherwise resolved. As of December 31, 2013, theCompany does not believe that its estimates, as otherwise provided for, on such tax positions willsignificantly increase or decrease within the next twelve months.
90

DTS, INC.
NOTES TO CONSOLIDATED FINANCIAL STATEMENTS (Continued)
(Amounts in thousands, except per share data)
Note 11—Income Taxes (Continued)
The following is a reconciliation of the unrecognized tax benefits.
UnrecognizedTax Benefits
Balance at January 1, 2011 . . . . . . . . . . . . . . . . . . . . . . . . . . . . . . . . . $ 7,205Additions for tax positions of prior years . . . . . . . . . . . . . . . . . . . . . . . 240Additions for tax positions of the current year . . . . . . . . . . . . . . . . . . . 1,277Settlements . . . . . . . . . . . . . . . . . . . . . . . . . . . . . . . . . . . . . . . . . . . . (1,459)
Balance at December 31, 2011 . . . . . . . . . . . . . . . . . . . . . . . . . . . . . . 7,263Additions for tax positions of prior years . . . . . . . . . . . . . . . . . . . . . . . 6,868Additions for tax positions of the current year . . . . . . . . . . . . . . . . . . . 427Settlements . . . . . . . . . . . . . . . . . . . . . . . . . . . . . . . . . . . . . . . . . . . . (3,501)
Balance at December 31, 2012 . . . . . . . . . . . . . . . . . . . . . . . . . . . . . . 11,057Additions for tax positions of prior years . . . . . . . . . . . . . . . . . . . . . . . 100Additions for tax positions of the current year . . . . . . . . . . . . . . . . . . . 804Settlements . . . . . . . . . . . . . . . . . . . . . . . . . . . . . . . . . . . . . . . . . . . . (2,135)Lapse of applicable statutes . . . . . . . . . . . . . . . . . . . . . . . . . . . . . . . . (246)
Balance at December 31, 2013 . . . . . . . . . . . . . . . . . . . . . . . . . . . . . . $ 9,580
The Company may, from time to time, be assessed interest or penalties by major tax jurisdictions,although any such assessments historically have been minimal and immaterial to the Company’sconsolidated financial statements.
The Company, or one of its subsidiaries, files income tax returns in the U.S. and other foreignjurisdictions. With few exceptions, the Company is no longer subject to U.S. federal income taxexaminations by tax authorities for the years prior to 2009. The Internal Revenue Service (‘‘IRS’’) isexamining the Company’s 2009 to 2011 federal income tax returns, including certain prior periodcarryforwards. In addition, the California Franchise Tax Board is conducting a state tax examination forthe years 2009 to 2010. Judgment is required in determining the consolidated provision for incometaxes as the Company considers its worldwide taxable earnings and the impact of the audit processconducted by various tax authorities. The final outcome of tax audits by any foreign jurisdictions, theIRS and various state governments could differ materially from that which is reflected in theconsolidated financial statements.
91
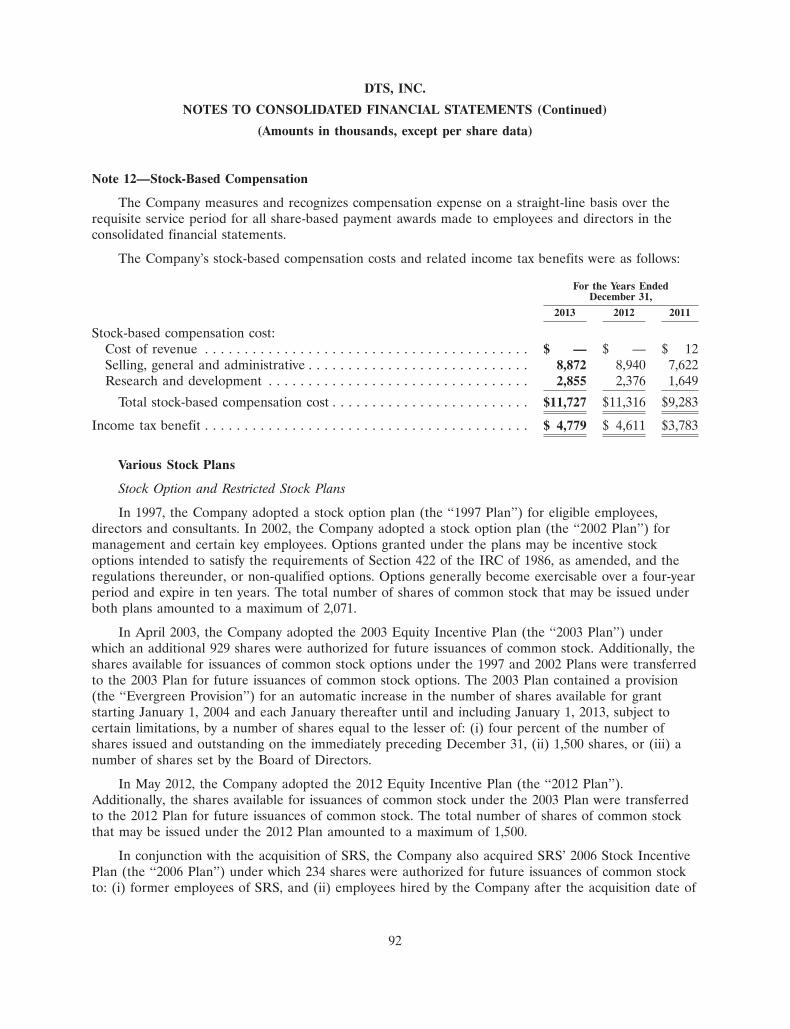
DTS, INC.
NOTES TO CONSOLIDATED FINANCIAL STATEMENTS (Continued)
(Amounts in thousands, except per share data)
Note 12—Stock-Based Compensation
The Company measures and recognizes compensation expense on a straight-line basis over therequisite service period for all share-based payment awards made to employees and directors in theconsolidated financial statements.
The Company’s stock-based compensation costs and related income tax benefits were as follows:
For the Years EndedDecember 31,
2013 2012 2011
Stock-based compensation cost:Cost of revenue . . . . . . . . . . . . . . . . . . . . . . . . . . . . . . . . . . . . . . . . . $ — $ — $ 12Selling, general and administrative . . . . . . . . . . . . . . . . . . . . . . . . . . . . 8,872 8,940 7,622Research and development . . . . . . . . . . . . . . . . . . . . . . . . . . . . . . . . . 2,855 2,376 1,649
Total stock-based compensation cost . . . . . . . . . . . . . . . . . . . . . . . . . $11,727 $11,316 $9,283
Income tax benefit . . . . . . . . . . . . . . . . . . . . . . . . . . . . . . . . . . . . . . . . . $ 4,779 $ 4,611 $3,783
Various Stock Plans
Stock Option and Restricted Stock Plans
In 1997, the Company adopted a stock option plan (the ‘‘1997 Plan’’) for eligible employees,directors and consultants. In 2002, the Company adopted a stock option plan (the ‘‘2002 Plan’’) formanagement and certain key employees. Options granted under the plans may be incentive stockoptions intended to satisfy the requirements of Section 422 of the IRC of 1986, as amended, and theregulations thereunder, or non-qualified options. Options generally become exercisable over a four-yearperiod and expire in ten years. The total number of shares of common stock that may be issued underboth plans amounted to a maximum of 2,071.
In April 2003, the Company adopted the 2003 Equity Incentive Plan (the ‘‘2003 Plan’’) underwhich an additional 929 shares were authorized for future issuances of common stock. Additionally, theshares available for issuances of common stock options under the 1997 and 2002 Plans were transferredto the 2003 Plan for future issuances of common stock options. The 2003 Plan contained a provision(the ‘‘Evergreen Provision’’) for an automatic increase in the number of shares available for grantstarting January 1, 2004 and each January thereafter until and including January 1, 2013, subject tocertain limitations, by a number of shares equal to the lesser of: (i) four percent of the number ofshares issued and outstanding on the immediately preceding December 31, (ii) 1,500 shares, or (iii) anumber of shares set by the Board of Directors.
In May 2012, the Company adopted the 2012 Equity Incentive Plan (the ‘‘2012 Plan’’).Additionally, the shares available for issuances of common stock under the 2003 Plan were transferredto the 2012 Plan for future issuances of common stock. The total number of shares of common stockthat may be issued under the 2012 Plan amounted to a maximum of 1,500.
In conjunction with the acquisition of SRS, the Company also acquired SRS’ 2006 Stock IncentivePlan (the ‘‘2006 Plan’’) under which 234 shares were authorized for future issuances of common stockto: (i) former employees of SRS, and (ii) employees hired by the Company after the acquisition date of
92

DTS, INC.
NOTES TO CONSOLIDATED FINANCIAL STATEMENTS (Continued)
(Amounts in thousands, except per share data)
Note 12—Stock-Based Compensation (Continued)
SRS, July 20, 2012. At the acquisition date of SRS, all outstanding equity awards under the 2006 Planwere tendered for cash.
Stock Options
The fair value of each employee option grant was estimated on the date of the grant using theBlack-Scholes option pricing model with the following weighted average key assumptions:
Years EndedDecember 31,
2013 2012 2011
Risk free interest rate . . . . . . . . . . . . . . . . . . . . . . . . . . . . . . 0.7% 0.6% 1.7%Expected lives (years) . . . . . . . . . . . . . . . . . . . . . . . . . . . . . . . 4.2 4.0 3.9Dividend yield . . . . . . . . . . . . . . . . . . . . . . . . . . . . . . . . . . . . 0% 0% 0%Expected volatility . . . . . . . . . . . . . . . . . . . . . . . . . . . . . . . . . 44% 49% 49%
The dividend yield was not calculated because the Company does not currently expect to pay adividend. The expected life of the options granted was derived from the historical activity of theCompany’s options and represented the period of time that options granted were expected to beoutstanding. The expected volatility was based on the historical volatility of the Company’s commonstock. The risk-free interest rate was the average interest rates of U.S. government bonds ofcomparable term to the options on the dates of the option grants.
There were 724, 924 and 299 options granted during the years ended December 31, 2013, 2012 and2011, respectively. The weighted-average grant-date fair value of options granted during the yearsended December 31, 2013, 2012 and 2011 was $7.24, $10.25 and $17.68, respectively. Compensationexpense for stock options was $5,507, $5,153 and $4,004 for the years ended December 31, 2013, 2012and 2011, respectively.
The following table summarizes stock option activity:
Weighted-Weighted- AverageAverage Remaining Aggregate
Number of Exercise Contractual Intrinsicoptions Price Life (Years) Value
Options outstanding at December 31, 2012 . . . . . . . . . . . . 2,691 $25.86Granted . . . . . . . . . . . . . . . . . . . . . . . . . . . . . . . . . . . 724 20.22Exercised . . . . . . . . . . . . . . . . . . . . . . . . . . . . . . . . . . . (27) 15.40Expired or cancelled . . . . . . . . . . . . . . . . . . . . . . . . . . (69) 27.54
Options outstanding at December 31, 2013 . . . . . . . . . . . . 3,319 $24.68 6.5 $7,999
Options exercisable at December 31, 2013 . . . . . . . . . . . . 1,833 $24.24 4.9 $5,171
The aggregate intrinsic value of options exercised during the years ended December 31, 2013, 2012and 2011 was $152, $1,399 and $3,911, respectively. As of December 31, 2013, total remaining unearned
93

DTS, INC.
NOTES TO CONSOLIDATED FINANCIAL STATEMENTS (Continued)
(Amounts in thousands, except per share data)
Note 12—Stock-Based Compensation (Continued)
compensation related to unvested stock options was approximately $9,804, which will be amortized overthe weighted-average remaining service period of 1.6 years.
Restricted Stock
Compensation expense on restricted stock awards and units was $3,529, $3,669 and $3,272 for theyears ended December 31, 2013, 2012 and 2011, respectively. The following table summarizes restrictedstock activity:
Weighted-Average
Number of Grant-DateShares Fair Value
Unvested stock at December 31, 2012 . . . . . . . . . . . . . . . . . . 382 $28.12Granted . . . . . . . . . . . . . . . . . . . . . . . . . . . . . . . . . . . . . . 91 19.95Vested . . . . . . . . . . . . . . . . . . . . . . . . . . . . . . . . . . . . . . . (142) 27.26Forfeited . . . . . . . . . . . . . . . . . . . . . . . . . . . . . . . . . . . . . (25) 27.06
Unvested stock at December 31, 2013 . . . . . . . . . . . . . . . . . . 306 $26.14
As of December 31, 2013, total remaining unearned compensation related to restricted stock was$5,245, which will be amortized over the weighted-average remaining service period of 1.5 years.
Market Stock Units
On February 27, 2011, the Compensation Committee of the Board of Directors of the Companyapproved market stock unit agreements (‘‘MSU Agreements’’) for the grant of certain performance-based equity awards under the Company’s 2003 Plan.
Pursuant to the MSU Agreements, units payable in shares of common stock (the ‘‘Units’’) wouldvest based on the attainment of certain performance criteria regarding both the Company’s totalshareholder return and the performance of the Company as measured against the performance of theNASDAQ Composite Total Return Index (‘‘NASDAQ’’ or ‘‘XCMP’’) over a 3-year performance period.This 3-year performance period began on January 1, 2011 and ended on December 31, 2013. In orderfor the Units to vest, the Company was required to satisfy a vesting threshold, defined as the Companyachieving a total shareholder return equal to the greater of (i) 15% adjusted for inflation (using theConsumer Price Index); and (ii) 20% over the performance period.
If this vesting threshold was satisfied, the number of Units that vest would be determined bycomparing the Company’s performance to the performance of the NASDAQ for the performanceperiod. If the Company’s performance was 20% greater than the return for the NASDAQ, then the‘‘baseline’’ number of Units would vest. If the Company’s performance exceeded this baseline level ofperformance, then a greater number of Units would vest on a 2.5:1 basis for each percentage point thatthe Company’s performance was above 20% greater than the performance of the NASDAQ. Themaximum number of Units that may vest was equal to 200% of each individual’s baseline number ofUnits.
94

DTS, INC.
NOTES TO CONSOLIDATED FINANCIAL STATEMENTS (Continued)
(Amounts in thousands, except per share data)
Note 12—Stock-Based Compensation (Continued)
If the Company outperformed the NASDAQ by more than 10%, but less than 20%, then thenumber of baseline Units that vest would be determined by reducing the baseline number for eachindividual on a 5:1 basis for the first five percentage points that the Company’s performance was lessthan 20% greater than the performance of the NASDAQ and on a 15:1 basis for the next fivepercentage points that the Company’s performance was less than 15% greater than the performance ofthe NASDAQ, such that if the Company outperformed NASDAQ by 10% or less, the number of Unitsthat vest would be zero.
If a ‘‘fundamental transaction’’ (as defined in the 2003 Plan, as amended) occurred prior to theend of the 3-year performance period, the performance period would end as of the consummation ofthe fundamental transaction and the pro rata portion of the Units, if any, that vest under the formulaedescribed above would immediately vest, with the remainder of such Units vesting ratably over theremainder of the 3-year period (with accelerated vesting if a grantee was terminated without ‘‘cause’’ orquits with ‘‘good reason’’ after the fundamental transaction).
Since the vesting of these performance-based equity awards was subject to market conditions, theseawards were measured on the date of grant using the Monte Carlo simulation model. The Monte Carlosimulation model utilized multiple input variables that determined the probability of satisfying themarket conditions stipulated in the award grant and calculated the fair market value for theperformance units granted. The Monte Carlo simulation model also used stock price volatility andother variables to estimate the probability of satisfying the market conditions and the resulting fairvalue of the award.
The Company granted 199 Units on February 27, 2011, which had an aggregate grant-date fairvalue of $5,287. Since February 27, 2011, the Company did not grant any additional Units, and 5 Unitswere forfeited in 2012. The aggregate grant-date fair value for these awards was recognized ascompensation expense on a straight-line basis over the requisite service period, which began on thedate of grant and ended on December 31, 2013. Compensation expense on shares of market stock unitswas $1,820, $1,826 and $1,509 for the years ended December 31, 2013, 2012 and 2011, respectively. Asof December 31, 2013, the performance criteria were not met and the remaining 194 Unitsautomatically expired.
Employee Stock Purchase Plan
On April 17, 2003, the Company adopted the 2003 Employee Stock Purchase Plan and the 2003Foreign Subsidiary Employee Stock Purchase Plan, under which, subject to certain limitations, theinitial aggregate number of shares of stock that may be issued is 500, with a provision (the ‘‘EvergreenProvision’’) that provides for an automatic increase in the number of shares available for issuance onJanuary 1, 2004 and each January 1 thereafter until and including January 1, 2013 by the lesser of:(i) 500 shares, (ii) one percent of the number of shares of all classes of common stock of the Companyoutstanding on that date, or (iii) a lesser amount determined by the Board of Directors.
On November 13, 2012, the Company amended and restated the 2003 Employee Stock PurchasePlan, renamed the 2013 Employee Stock Purchase Plan, and amended and restated the 2003 ForeignSubsidiary Employee Stock Purchase Plan, renamed the 2013 Foreign Subsidiary Employee StockPurchase Plan (collectively ‘‘ESPP’’). Both plans were approved by the stockholders of the Company at
95

DTS, INC.
NOTES TO CONSOLIDATED FINANCIAL STATEMENTS (Continued)
(Amounts in thousands, except per share data)
Note 12—Stock-Based Compensation (Continued)
the annual meeting on June 6, 2013. Subject to certain limitations, the aggregate number of shares ofstock that may be issued under both plans is 750. Under the ESPP, each eligible employee mayauthorize payroll deductions of up to 15% of their compensation to purchase shares of the Company’scommon stock on two purchase dates during the second and fourth quarter of each year. Each offeringperiod has a 24-month duration with purchase periods of six month intervals. The purchase price pershare for the common stock is equal to 85% of the lower of the closing market price per share of theCompany’s common stock on (i) the participant’s entry date into the two-year offering period, or(ii) the end of each six-month purchase period within the offering period. The ESPP has a two-yearlook-back feature, whereby the offering period resets if the fair value of the Company’s common stockon the first day of any purchase period is less than that on the original offering date. Each eligibleemployee’s purchases are subject to a maximum of $25 in fair market value in any calendar year or2.5 shares on any single purchase date.
The fair values were estimated at the date of grant using the Black-Scholes option pricing modelwith the following weighted average key assumptions:
Years EndedDecember 31,
2013 2012 2011
Risk free interest rate . . . . . . . . . . . . . . . . . . . . . . . . . . . . . . 0.2% 0.2% 0.1%Expected lives (years) . . . . . . . . . . . . . . . . . . . . . . . . . . . . . . . 1.2 0.7 0.7Dividend yield . . . . . . . . . . . . . . . . . . . . . . . . . . . . . . . . . . . . 0% 0% 0%Expected volatility . . . . . . . . . . . . . . . . . . . . . . . . . . . . . . . . . 52% 61% 45%
The dividend yield was not calculated because the Company does not currently expect to pay adividend. The expected life represented the service period. The expected volatility was based on thehistorical volatility of the Company’s common stock. The risk-free interest rate was the average interestrates of U.S. government bonds of comparable term to the service period.
Compensation expense under the ESPP was $871, $668 and $498 for the years endedDecember 31, 2013, 2012 and 2011, respectively.
Note 13—Defined Contribution Plan
The Company has savings and investment plans, including a savings plan that qualifies as a definedcontribution plan under Section 401(k) of the IRC. The Company allows eligible employees to allocateup to 100% of the participant’s eligible compensation, or 20% of the participant’s eligible compensationif defined as a Highly Compensated Participant under Section 414(q) of the IRC through payrolldeductions. All regular full-time employees on the U.S. payroll of the Company are eligible toparticipate in the plan. The Company provides a discretionary match of up to 100% of the first 4% ofsalary contributed to the plan and may match up to 6% of salary if certain financial targets are met. In2010, the Company adopted a Roth 401(k) option. For the years ended December 31, 2013, 2012 and2011, the costs of these matching contributions were $859, $656 and $577, respectively.
96

DTS, INC.
NOTES TO CONSOLIDATED FINANCIAL STATEMENTS (Continued)
(Amounts in thousands, except per share data)
Note 14—Stock Repurchase Plans
In May 2011, the Company’s Board of Directors authorized, subject to certain business and marketconditions, the purchase of up to 1,000 shares of the Company’s common stock in the open market orin privately negotiated transactions. Through the fourth quarter of 2011, the Company repurchased allshares of common stock under this authorization for an aggregate of $32,299.
In February 2012, the Company’s Board of Directors authorized, subject to certain business andmarket conditions, the purchase of up to 2,000 shares of the Company’s common stock in the openmarket or in privately negotiated transactions. Through the fourth quarter of 2013, the Companyrepurchased all shares of its common stock under this authorization for an aggregate of $39,374.
All shares repurchased under these authorizations were accounted for as treasury stock.
Subsequent to December 31, 2013, the Company’s Board of Directors authorized, subject tocertain business and market conditions, the purchase of up to 2,000 shares of the Company’s commonstock in the open market or in privately negotiated transactions.
Note 15—Segment and Geographic Information
The Company operates as a single reportable segment on an enterprise-wide basis. The Companygenerates revenue by licensing its technologies to consumer electronics manufacturers.
The Company’s revenue by geographical area, based on the customer’s country of domicile, was asfollows:
For the Years Ended December 31,
2013 2012 2011
U.S. . . . . . . . . . . . . . . . . . . . . . . . . . . . . . . . . . . . $ 12,998 $ 11,693 $10,838
South Korea . . . . . . . . . . . . . . . . . . . . . . . . . . . . . 45,051 27,110 22,549Japan . . . . . . . . . . . . . . . . . . . . . . . . . . . . . . . . . . 42,256 41,203 43,814Other international . . . . . . . . . . . . . . . . . . . . . . . . 24,843 20,643 19,721
Total international . . . . . . . . . . . . . . . . . . . . . . . . 112,150 88,956 86,084
Total revenues . . . . . . . . . . . . . . . . . . . . . . . . . . $125,148 $100,649 $96,922
The following table sets forth long-lived tangible assets, net of accumulated depreciation, bygeographic region:
As of December 31,
2013 2012
U.S. . . . . . . . . . . . . . . . . . . . . . . . . . . . . . . . . . . . . . . . . . . . . $27,979 $30,894International . . . . . . . . . . . . . . . . . . . . . . . . . . . . . . . . . . . . . . 2,137 2,431
Total long-lived tangible assets, net of accumulateddepreciation . . . . . . . . . . . . . . . . . . . . . . . . . . . . . . . . . . . $30,116 $33,325
97

DTS, INC.
NOTES TO CONSOLIDATED FINANCIAL STATEMENTS (Continued)
(Amounts in thousands, except per share data)
Note 16—Net Income (Loss) Per Share
Basic net income (loss) per common share is calculated by dividing net income (loss) by theweighted average number of common shares outstanding during the period. Diluted net income percommon share is calculated by dividing net income (loss) by the sum of the weighted average numberof common shares outstanding plus the dilutive effect of outstanding stock options, unvested restrictedstock and ESPP using the treasury stock method. Due to the net loss for the year ended December 31,2012, all potential common shares are excluded from the diluted shares outstanding for that period.
The following table sets forth the computation of basic and diluted net income (loss) per share:
For the Years Ended December 31,
2013 2012 2011
Numerator:Net income (loss) . . . . . . . . . . . . . . . . . . . . . . . . . . . . . . . . . . . . . . $15,755 $(15,898) $18,269
Denominator:Weighted average shares outstanding . . . . . . . . . . . . . . . . . . . . . . . . 18,097 17,466 16,982Effect of dilutive securities:
Common stock options . . . . . . . . . . . . . . . . . . . . . . . . . . . . . . . . . 153 — 494Restricted stock . . . . . . . . . . . . . . . . . . . . . . . . . . . . . . . . . . . . . . 67 — 97ESPP . . . . . . . . . . . . . . . . . . . . . . . . . . . . . . . . . . . . . . . . . . . . . 17 — 2
Diluted shares outstanding . . . . . . . . . . . . . . . . . . . . . . . . . . . . . . . . 18,334 17,466 17,575
Basic net income (loss) per common share . . . . . . . . . . . . . . . . . . . . . . $ 0.87 $ (0.91) $ 1.08
Diluted net income (loss) per common share . . . . . . . . . . . . . . . . . . . . $ 0.86 $ (0.91) $ 1.04
Anti-dilutive shares excluded from the determination of diluted netincome (loss) per share . . . . . . . . . . . . . . . . . . . . . . . . . . . . . . . . . . 3,163 2,697 442
98

DTS, INC.
NOTES TO CONSOLIDATED FINANCIAL STATEMENTS (Continued)
(Amounts in thousands, except per share data)
Note 17—Selected Quarterly Data (Unaudited)
For the Quarter Ended
Mar. 31, June 30, Sep. 30, Dec. 31,
2013Revenues . . . . . . . . . . . . . . . . . . . . . . . . . . . . . . . . . . . . . . $32,728 $27,188 $ 28,159 $37,073Gross profit . . . . . . . . . . . . . . . . . . . . . . . . . . . . . . . . . . . . $30,406 $24,776 $ 25,726 $34,452
Net income (loss) . . . . . . . . . . . . . . . . . . . . . . . . . . . . . . . . $ (1,532) $(2,027) $ 1,988(1) $17,326(2)Basic earnings (loss) per share . . . . . . . . . . . . . . . . . . . . . . $ (0.08) $ (0.11) $ 0.11 $ 0.98Diluted earnings (loss) per share . . . . . . . . . . . . . . . . . . . . . $ (0.08) $ (0.11) $ 0.11 $ 0.96
2012(3)Revenues . . . . . . . . . . . . . . . . . . . . . . . . . . . . . . . . . . . . . . $26,885 $21,754 $ 22,235 $29,775Gross profit . . . . . . . . . . . . . . . . . . . . . . . . . . . . . . . . . . . . $26,691 $21,560 $ 20,130 $27,921
Net income (loss) . . . . . . . . . . . . . . . . . . . . . . . . . . . . . . . . $ 4,045 $ (755) $(19,086) $ (102)Basic earnings (loss) per share . . . . . . . . . . . . . . . . . . . . . . $ 0.25 $ (0.05) $ (1.04) $ (0.01)Diluted earnings (loss) per share . . . . . . . . . . . . . . . . . . . . . $ 0.24 $ (0.05) $ (1.04) $ (0.01)
(1) Includes an impairment charge of $2,820 relating to certain intangibles. For additional information,refer to Note 7, ‘‘Goodwill and Other Intangibles’’. Also, includes a recorded gain of $5,300 withinoperating expenses relating to changes in the fair value of contingent consideration. For additionalinformation, refer to Note 4, ‘‘Fair Value Measurements’’.
(2) Includes a $7,919 tax benefit as a result of a release of the valuation allowance on U.S. federaldeferred tax assets. For additional information, refer to Note 11, ‘‘Income Taxes’’. Also, includes arecorded gain of $700 within operating expenses relating to changes in the fair value of contingentconsideration. For additional information, refer to Note 4, ‘‘Fair Value Measurements’’.
(3) During the quarter ended September 30, 2012, the Company acquired SRS and Phorus. Foradditional information, refer to Note 6, ‘‘Business Combinations’’.
Note 18—Related Party Transaction
The Company leased the former offices of SRS in Santa Ana, California from Daimler CommercePartners, L.P., the general partner of which is Conifer Investments, Inc. (‘‘Conifer’’). The soleshareholders of Conifer are Thomas C.K. Yuen, a former member of the Company’s Board ofDirectors, and his spouse, Misako Yuen, as co-trustees of the Thomas Yuen Family Trust. Mr. andMrs. Yuen also serve as the executive officers of Conifer. The Company believes the terms andconditions of these leases were competitive based on a review of similar properties in the area withsimilar terms and conditions. On July 18, 2013, Mr. Yuen resigned from the Board of Directors due topersonal reasons. There was no disagreement between Mr. Yuen and the Company relative to hisresignation. Related party rent expense for these offices was $193 and $157 for the years endedDecember 31, 2013 and 2012, respectively.
99
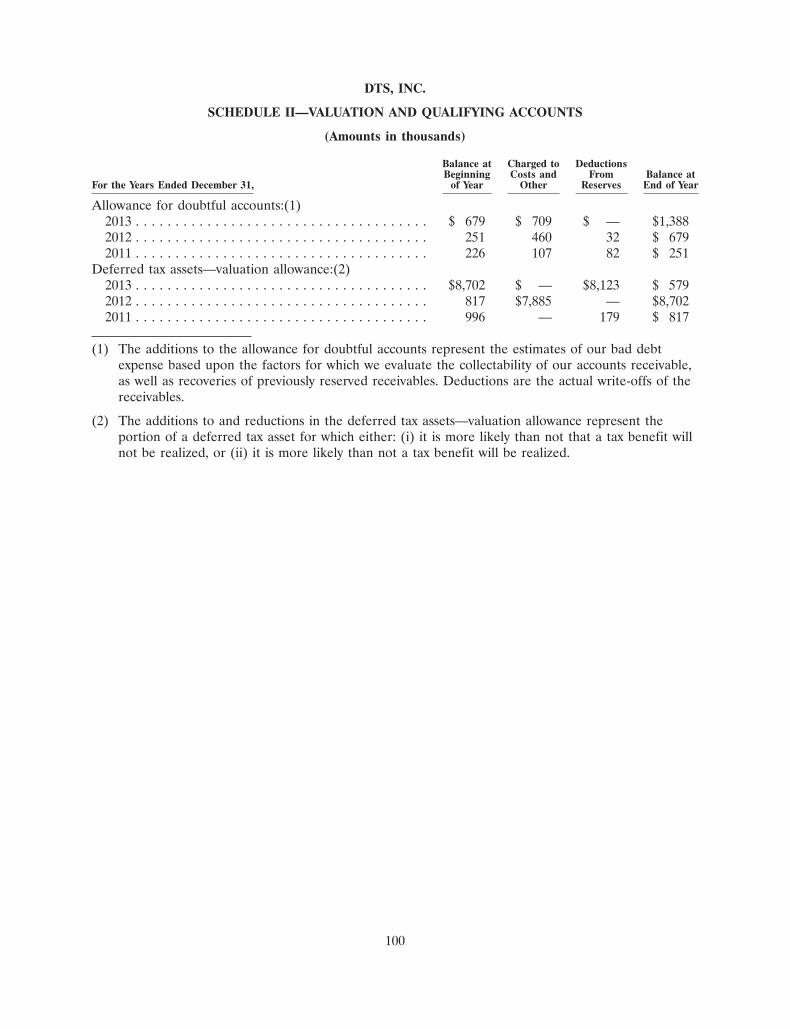
DTS, INC.
SCHEDULE II—VALUATION AND QUALIFYING ACCOUNTS
(Amounts in thousands)
Balance at Charged to DeductionsBeginning Costs and From Balance at
For the Years Ended December 31, of Year Other Reserves End of Year
Allowance for doubtful accounts:(1)2013 . . . . . . . . . . . . . . . . . . . . . . . . . . . . . . . . . . . . . $ 679 $ 709 $ — $1,3882012 . . . . . . . . . . . . . . . . . . . . . . . . . . . . . . . . . . . . . 251 460 32 $ 6792011 . . . . . . . . . . . . . . . . . . . . . . . . . . . . . . . . . . . . . 226 107 82 $ 251
Deferred tax assets—valuation allowance:(2)2013 . . . . . . . . . . . . . . . . . . . . . . . . . . . . . . . . . . . . . $8,702 $ — $8,123 $ 5792012 . . . . . . . . . . . . . . . . . . . . . . . . . . . . . . . . . . . . . 817 $7,885 — $8,7022011 . . . . . . . . . . . . . . . . . . . . . . . . . . . . . . . . . . . . . 996 — 179 $ 817
(1) The additions to the allowance for doubtful accounts represent the estimates of our bad debtexpense based upon the factors for which we evaluate the collectability of our accounts receivable,as well as recoveries of previously reserved receivables. Deductions are the actual write-offs of thereceivables.
(2) The additions to and reductions in the deferred tax assets—valuation allowance represent theportion of a deferred tax asset for which either: (i) it is more likely than not that a tax benefit willnot be realized, or (ii) it is more likely than not a tax benefit will be realized.
100
Item 9. Changes in and Disagreements With Accountants on Accounting and Financial Disclosure
None.
Item 9A. Controls and Procedures
Disclosure Controls and Procedures
The Company’s management is responsible for establishing and maintaining adequate internalcontrol over financial reporting. As of the end of the period covered by this report, the Company’smanagement with the participation of the Chief Executive Officer and Chief Financial Officer carriedout an evaluation of the effectiveness of the Company’s disclosure controls and procedures (as suchterm is defined in Rules 13a-15(e) and 15d-15(e) of the Exchange Act). Based upon this evaluation, theCompany’s Chief Executive Officer and Chief Financial Officer concluded that the Company’sdisclosure controls and procedures were not effective as of December 31, 2013 as a result of thematerial weaknesses described below.
Management’s Report on Internal Control Over Financial Reporting
The Company’s management is responsible for establishing and maintaining adequate internalcontrol over financial reporting, as defined in Exchange Act Rules 13a-15(f) or 15d-15(f). TheCompany’s internal control over financial reporting is designed to provide reasonable assuranceregarding the reliability of financial reporting and the preparation of consolidated financial statementsfor external purposes, in accordance with generally accepted accounting principles, and includes policiesand procedures that: (1) pertain to the maintenance of records that in reasonable detail accurately andfairly reflect the Company’s transactions and dispositions of assets, (2) provide reasonable assurancethat transactions are recorded as necessary to permit preparation of consolidated financial statementsin accordance with generally accepted accounting principles, and that the Company’s receipts andexpenditures are being made only in accordance with authorizations of the Company’s management anddirectors, and (3) provide reasonable assurance regarding prevention or timely detection ofunauthorized acquisition, use or disposition of the Company’s assets that could have a material effecton the consolidated financial statements.
The Company’s management, with the participation of the Company’s Chief Executive Officer andChief Financial Officer, evaluated the effectiveness of our internal control over financial reporting as ofDecember 31, 2013 based on the criteria set forth in the 1992 Internal Control—Integrated Frameworkissued by the Committee of Sponsoring Organizations of the Treadway Commission. Based on thisevaluation, we concluded that the Company’s internal control over financial reporting was ineffective asof December 31, 2013 because material weaknesses existed in the Company’s internal control overfinancial reporting related to the inadequate design of internal controls over the accounting for incometaxes and for revenue under license agreements with non-standard financial terms, as further describedbelow. A material weakness is a deficiency, or a combination of deficiencies, in internal control overfinancial reporting, such that there is a reasonable possibility that a material misstatement of ourconsolidated financial statements will not be prevented or detected on a timely basis.
As previously reported in our Annual Report on Form 10-K for the fiscal year endedDecember 31, 2012 and in our subsequent Quarterly Reports on Form 10-Q, we identified a materialweakness in our internal control over financial reporting related to the inadequate design of internalcontrols over the accounting for income taxes. Specifically, our controls were not effectively designed asthey relate to our preparation and review of the income tax provision and the related deferred taxassets and liabilities, including those arising from our 2012 acquisition of SRS Labs, Inc. andwithholding taxes on certain undistributed earnings from China.
101

In addition, as previously reported in our Form 10-Q for the quarter ended September 30, 2013,we identified a material weakness in internal control over financial reporting related to the inadequatedesign of internal controls over the accounting for revenue under license agreements with non-standardfinancial terms, which existed as of December 31, 2012. Specifically, our controls over the evaluation ofnon-standard financial terms and conditions contained in certain of the Company’s license agreementswere not effective to ensure that revenue under these agreements was sufficiently analyzed andrecorded. Although this deficiency did not lead to material adjustments to revenue, we determined thatdeficiencies in the control processes in the accounting for revenue under such license agreements, inthe aggregate, constituted a material weakness because these control deficiencies could have resulted ina material misstatement of revenue.
Grant Thornton LLP, the Company’s independent registered public accounting firm, has issued anattestation report on the Company’s internal control over financial reporting, which is included hereinin Item 8.
Remediation Plan. We are implementing a remediation plan that was initiated in the first quarterof 2013 to enhance our control procedures with respect to the preparation and review of the incometax provision and the related deferred tax assets and liabilities, including increasing the use of thirdparty advisors with appropriate expertise to assist with the preparation and review of the quarterly andannual income tax provision.
In the fourth quarter of 2013, we initiated a plan to enhance our control procedures with respectto the identification and review of revenue under license agreements with non-standard financial terms,including performing additional analysis of our license agreements to evaluate the non-standardfinancial terms, additional accounting research, preparing detailed checklists to ensure that allagreements with non-standard financial terms are sufficiently identified and evaluated, and revenue isproperly recognized.
We expect that our remediation efforts, including design, implementation and testing will continuethroughout fiscal year 2014. The material weaknesses will not be considered remediated until ourcontrols are operational for a period of time, tested, and management concludes that these controls areoperating effectively.
Limitations on the Effectiveness of Controls. Because of its inherent limitations, internal controlover financial reporting may not prevent or detect misstatements. Also, projections of any evaluation ofeffectiveness to future periods are subject to the risk that controls may become inadequate because ofchanges in conditions, or that the degree of compliance with the policies or procedures maydeteriorate.
Changes in Internal Control Over Financial Reporting
We are committed to the ongoing remediation efforts to address the material weaknesses describedabove. These remediation efforts are intended to both address the identified material weaknesses andto enhance our overall financial control environment.
Other than the ongoing remediation efforts described above, there have been no changes in ourinternal control over financial reporting during the quarter ended December 31, 2013 that havematerially affected, or are reasonably likely to materially affect, our internal control over financialreporting.
Item 9B. Other Information
None.
102
PART III
Item 10. Directors, Executive Officers and Corporate Governance
The information concerning our executive officers to be included under the caption ‘‘ExecutiveOfficers and Significant Employees’’ in our proxy statement relating to our 2014 annual meeting ofstockholders to be filed by us with the Securities and Exchange Commission no later than 120 daysafter the close of our fiscal year ended December 31, 2013 (the ‘‘Proxy Statement’’) is incorporatedherein by reference.
The information concerning our directors to be included in the Proxy Statement under the caption‘‘Election of Directors’’ is incorporated herein by reference.
The information to be included in the Proxy Statement under the caption ‘‘Section 16(a) BeneficialOwnership Reporting Compliance’’ is incorporated herein by reference.
The information concerning our code of ethics and code of conduct to be included in the ProxyStatement under the caption ‘‘Governance of the Company’’ is incorporated herein by reference.
Item 11. Executive Compensation
The information to be included in the Proxy Statement under the captions ‘‘ExecutiveCompensation and Related Information,’’ ‘‘Compensation Discussion and Analysis,’’ ‘‘Compensation ofDirectors’’ and ‘‘Report of the Compensation Committee’’ is incorporated herein by reference.
Item 12. Security Ownership of Certain Beneficial Owners and Management and Related StockholderMatters
The information to be included in the Proxy Statement under the captions ‘‘Equity CompensationPlan Information’’ and ‘‘Security Ownership of Certain Beneficial Owners and Management’’ isincorporated herein by reference.
Item 13. Certain Relationships and Related Transactions, and Director Independence
The information concerning certain relationships and related transactions to be included in theProxy Statement under the caption ‘‘Certain Relationships and Related Transactions’’ is incorporatedherein by reference. The information concerning director independence to be included in the ProxyStatement under the caption ‘‘Governance of the Company’’ is incorporated herein by reference.
Item 14. Principal Accountant Fees and Services
The information concerning principal accounting fees and services to be included in the ProxyStatement under the caption ‘‘Ratification of Independent Registered Public Accountants’’ isincorporated herein by reference.
103

PART IV
Item 15. Exhibits and Financial Statement Schedules
Financial statements and schedules required by this Item are included in Item 8 of Part II of thisreport.
Refer to the ‘‘Exhibit Index’’ immediately following the signature page, which is incorporatedherein by reference.
104

SIGNATURES
Pursuant to the requirements of Section 13 or 15(d) of the Securities Exchange Act of 1934, theregistrant has duly caused this report to be signed on its behalf by the undersigned, thereunto dulyauthorized, on this 20th day of March, 2014.
DTS, INC.
By: /s/ JON E. KIRCHNER
Jon E. KirchnerChairman and Chief Executive Officer
Pursuant to the requirements of the Securities Exchange Act of 1934, this report has been signedbelow by the following persons on behalf of the registrant and in the capacities and on the datesindicated.
Signature Title(s) Date
/s/ JON E. KIRCHNER Chairman, Chief Executive Officer, and March 20, 2014Director (principal executive officer)Jon E. Kirchner
Executive Vice President, Finance and/s/ MELVIN L. FLANIGANChief Financial Officer (principal March 20, 2014
Melvin L. Flanigan financial and accounting officer)
/s/ JOERG D. AGINLead Independent Director March 20, 2014
Joerg D. Agin
/s/ CRAIG S. ANDREWSDirector March 20, 2014
Craig S. Andrews
/s/ L. GREGORY BALLARDDirector March 20, 2014
L. Gregory Ballard
/s/ BRADFORD D. DUEADirector March 20, 2014
Bradford D. Duea
/s/ V. SUE MOLINADirector March 20, 2014
V. Sue Molina
/s/ RONALD N. STONEDirector March 20, 2014
Ronald N. Stone
105

DTS, INC.EXHIBIT INDEX
Filed with Incorporated by ReferenceExhibit thisNumber Exhibit Title Form 10-K Form File No. Date Filed
2.1 Agreement and Plan of Merger 8-K 000-50335-12764511 4/17/2012and Reorganization, dated as ofApril 16, 2012, by and amongDTS, Inc., DTS Merger Sub,Inc, DTS LLC, andSRS Labs, Inc.
2.2 Voting Agreement, dated as of 8-K 000-50335-12764511 4/17/2012April 16, 2012, by and amongDTS, Inc., Mr. Thomas C. K.Yuen, Misako Yuen, TheThomas and Misako YuenFamily Foundation, andThomas Yuen Family Trust
2.3 Amendment No. 1 to Voting 13D 005-49103-12784432 4/26/2012Agreement, dated April 26,2012, by and among DTS, Inc.,Mr. Thomas C. K. Yuen,Misako Yuen, The Thomas andMisako Yuen FamilyFoundation, and Thomas YuenFamily Trust
3.1 Composite Certificate of 10-K 000-50335-13698275 3/18/2013Incorporation
3.2 Amended and Restated Bylaws 8-K 000-50335-14704082 3/19/2014
4.1 Specimen Common Stock S-1/A-1 333-104761-03734287 6/5/2003Certificate
10.1* 1997 Stock Option Plan S-1 333-104761-03665001 4/25/2003
10.2* Form of Incentive Stock Option S-1 333-104761-03665001 4/25/2003Agreement for grants under the1997 Stock Option Plan
10.3* Form of Nonqualified Stock S-1 333-104761-03665001 4/25/2003Option Agreement for grantsunder the 1997 Stock OptionPlan
10.4* 2002 Stock Option Plan S-1 333-104761-03665001 4/25/2003
10.5* Form of Incentive Stock Option S-1 333-104761-03665001 4/25/2003Agreement for grants under the2002 Stock Option Plan
106

Filed with Incorporated by ReferenceExhibit thisNumber Exhibit Title Form 10-K Form File No. Date Filed
10.6* Form of Non-qualified Stock S-1 333-104761-03665001 4/25/2003Option Agreement for grantsunder the 2002 Stock OptionPlan
10.7* 2003 Equity Incentive Plan, as 10-Q 000-50335-101172804 11/8/2010amended on May 9, 2005,May 15, 2008, February 19, 2009,February 15, 2010, June 3, 2010and October 8, 2010
10.8* Form of Grant of Stock Option S-1/A-1 333-104761-03734287 6/5/2003under 2003 Equity IncentivePlan
10.9* Form of Option Exercise and S-1/A-1 333-104761-03734287 6/5/2003Stock Purchase Agreementunder 2003 Equity IncentivePlan
10.10* Form of Restricted Stock Grant S-1/A-1 333-104761-03734287 6/5/2003Notice under 2003 EquityIncentive Plan
10.11* Form of Restricted Stock Grant 10-Q 000-50335-061017963 8/9/2006Notice and Restricted StockAgreement under 2003 EquityIncentive Plan (for annualnon-employee director grants)
10.12* Form of Restricted Stock Grant 10-Q 000-50335-061017963 8/9/2006Notice and Restricted StockAgreement under 2003 EquityIncentive Plan (for employeeand consultant grants)
10.13* Form of Restricted Stock Unit 10-Q 000-50335-10816984 5/10/2010Grant Notice and RestrictedStock Unit Agreement under2003 Equity Incentive Plan
10.14* 2003 Employee Stock Purchase S-1/A-1 333-104761-03734287 6/5/2003Plan
10.15* 2003 Foreign Subsidiary S-1/A-1 333-104761-03734287 6/5/2003Employee Stock Purchase Plan
10.16* Description of acceleration of 8-K 000-50335-051222387 11/23/2005vesting of certain unvested stockoptions
107

Filed with Incorporated by ReferenceExhibit thisNumber Exhibit Title Form 10-K Form File No. Date Filed
10.17* Executive Employment 8-K 000-50335-11631546 2/23/2011Agreement by and between theRegistrant and Jon Kirchner,dated February 17, 2011
10.18* Form of Indemnification S-1 333-104761-03665001 4/25/2003Agreement between theRegistrant and its directors
10.19* Form of Indemnification S-1 333-104761-03665001 4/25/2003Agreement between theRegistrant and its officers
10.20* Form of Market Stock Unit 10-Q 000-50335-11823912 5/9/2011Agreement under 2003 EquityIncentive Plan (forJon Kirchner)
10.21* Form of Market Stock Unit 10-Q 000-50335-11823912 5/9/2011Agreement under 2003 EquityIncentive Plan (for executivesother than Jon Kirchner)
10.22* Employment Agreement, dated 10-Q 000-50335-111017706 8/8/2011May 12, 2011, betweenDTS, Inc. and Melvin L.Flanigan
10.23* Employment Agreement, dated 10-Q 000-50335-111017706 8/8/2011May 12, 2011, betweenDTS, Inc. and Frederick L.Kitson
10.24* Employment Agreement, dated 10-Q 000-50335-111017706 8/8/2011May 12, 2011, betweenDTS, Inc. and Brian D. Towne
10.25* Employment Agreement, dated 10-Q 000-50335-111017706 8/8/2011May 12, 2011, betweenDTS, Inc. and Blake A. Welcher
10.26* Form of Director Confidentiality 8-K 000-50335-11847230 5/16/2011Agreement
10.27* Employment Agreement, dated 10-K 000-50335-12662201 3/2/2012March 1, 2012, betweenDTS, Inc. and Patrick J. Watson
10.28* 2012 Equity Incentive Plan S-8 333-181447-12846445 5/15/2012
10.29* Form of Notice of Grant of S-8 333-181447-12846445 5/15/2012Stock Option under 2012 EquityIncentive Plan
108
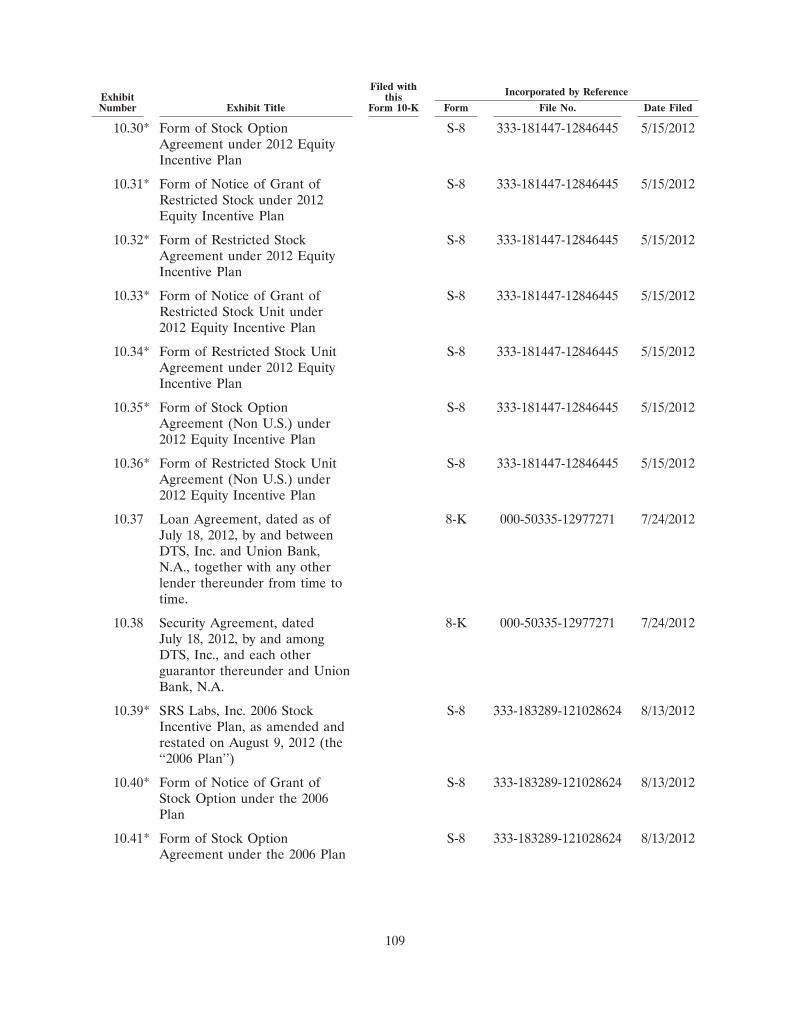
Filed with Incorporated by ReferenceExhibit thisNumber Exhibit Title Form 10-K Form File No. Date Filed
10.30* Form of Stock Option S-8 333-181447-12846445 5/15/2012Agreement under 2012 EquityIncentive Plan
10.31* Form of Notice of Grant of S-8 333-181447-12846445 5/15/2012Restricted Stock under 2012Equity Incentive Plan
10.32* Form of Restricted Stock S-8 333-181447-12846445 5/15/2012Agreement under 2012 EquityIncentive Plan
10.33* Form of Notice of Grant of S-8 333-181447-12846445 5/15/2012Restricted Stock Unit under2012 Equity Incentive Plan
10.34* Form of Restricted Stock Unit S-8 333-181447-12846445 5/15/2012Agreement under 2012 EquityIncentive Plan
10.35* Form of Stock Option S-8 333-181447-12846445 5/15/2012Agreement (Non U.S.) under2012 Equity Incentive Plan
10.36* Form of Restricted Stock Unit S-8 333-181447-12846445 5/15/2012Agreement (Non U.S.) under2012 Equity Incentive Plan
10.37 Loan Agreement, dated as of 8-K 000-50335-12977271 7/24/2012July 18, 2012, by and betweenDTS, Inc. and Union Bank,N.A., together with any otherlender thereunder from time totime.
10.38 Security Agreement, dated 8-K 000-50335-12977271 7/24/2012July 18, 2012, by and amongDTS, Inc., and each otherguarantor thereunder and UnionBank, N.A.
10.39* SRS Labs, Inc. 2006 Stock S-8 333-183289-121028624 8/13/2012Incentive Plan, as amended andrestated on August 9, 2012 (the‘‘2006 Plan’’)
10.40* Form of Notice of Grant of S-8 333-183289-121028624 8/13/2012Stock Option under the 2006Plan
10.41* Form of Stock Option S-8 333-183289-121028624 8/13/2012Agreement under the 2006 Plan
109

Filed with Incorporated by ReferenceExhibit thisNumber Exhibit Title Form 10-K Form File No. Date Filed
10.42* Form of Notice of Grant of S-8 333-183289-121028624 8/13/2012Restricted Stock Unit under the2006 Plan
10.43* Form of Restricted Stock Unit S-8 333-183289-121028624 8/13/2012Agreement under the 2006 Plan
10.44* Form of Stock Option S-8 333-183289-121028624 8/13/2012Agreement (Non U.S.) underthe 2006 Plan
10.45* Form of Restricted Stock Unit S-8 333-183289-121028624 8/13/2012Agreement (Non U.S.) underthe 2006 Plan
10.46* Employment Agreement, dated 10-Q 000-50335-13824975 5/8/2013April 1, 2013, between DTS, Inc.and Kris M. Graves
10.47* 2013 Employee Stock Purchase S-8 333-190677-131044650 8/16/2013Plan, as amended and restatedeffective November 31, 2012
10.48* 2013 Foreign Subsidiary S-8 333-190677-131044650 8/16/2013Employee Stock Purchase Plan,as amended and restatedeffective November 31, 2012
10.49* Form of 2014 Executive XIncentive Compensation Plan
21.1 List of all subsidiaries of the XRegistrant
23.1 Consent of independent Xregistered public accounting firm
31.1 Certification of Chief Executive XOfficer pursuant toRule 13a-14(a)/15d-14(a) of theSecurities Exchange Act of 1934,as amended
31.2 Certification of Chief Financial XOfficer pursuant toRule 13a-14(a)/15d-14(a) of theSecurities Exchange Act of 1934,as amended
110

Filed with Incorporated by ReferenceExhibit thisNumber Exhibit Title Form 10-K Form File No. Date Filed
32.1‡ Certification of the Chief XExecutive Officer pursuant toRule 13a-14(b) of the SecuritiesExchange Act of 1934, asamended, and 18 U.S.C.section 1350
32.2‡ Certification of the Chief XFinancial Officer pursuant toRule 13a-14(b) of the SecuritiesExchange Act of 1934, asamended, and 18 U.S.C.section 1350
101.INS XBRL Instance Document X
101.SCH XBRL Taxonomy Extension XSchema Document
101.CAL XBRL Taxonomy Extension XCalculation Linkbase Document
101.DEF XBRL Extension Definition X
101.LAB XBRL Taxonomy Extension XLabel Linkbase Document
101.PRE XBRL Taxonomy Extension XPresentation Linkbase Document
* Indicates management contract, arrangement or compensatory plan.
‡ This certification is being furnished solely to accompany this report pursuant to 18 U.S.C. 1350,and is not being filed for purposes of Section 18 of the Securities Exchange Act of 1934, and is notto be incorporated by reference into any filing of the Company, whether made before or after thedate hereof, regardless of any general incorporation language in such filing.
111