dual enrollment and postescondary outcomes areas of the report 3 ... arts and literature 20% ......
TRANSCRIPT
1
Georgia Dual Enrollment and
Postsecondary Outcomes
A Snapshot from 2008-2016
November 9, 2017

Background
2
• Dual enrollment provides opportunities for Georgia high
school students to take postsecondary courses and earn
concurrent credit toward both a high school diploma and a
college degree.
• While other states have examined the postsecondary outcomes
of dual enrollment students, Georgia has not done so.
• The creation of GA-AWARDS allows longitudinal research on
dual enrollment outcomes in ways not previously possible.
Dual Enrollment and Postsecondary Outcomes
November 9, 2017

Key Areas of the Report
3
• Using GA-AWARDS, this report shows dual enrollment
trends from 2008 to 2016 in the following areas:
• Participation
• Course completion
• Course-taking
• High school graduation of dual enrollees
• Postsecondary enrollment, and
• Postsecondary credentials
Data Sources: GSFC, TCSG, USG, GICA, GaDOE
GICA = Georgia Independent Colleges Association
Dual Enrollment and Postsecondary Outcomes
November 9, 2017

Important Notes about the Data
4
Definitions
• To count as dual enrollee, students had to have a dual enrollment
record in GSFC or a postsecondary institution (USG, TCSG, or
GICA) and be simultaneously enrolled in a public K-12 school.
• To count as a dual enrollment course completer, dual enrollees had
to earn at least one credit. These students were tracked
longitudinally for the report (not those who attempted but did not
complete courses).
Dual Enrollment and Postsecondary Outcomes
November 9, 2017

Important Notes about the Data
5
Limitations
• Only postsecondary institutions that report data to GA-AWARDS are
included.
• Seven private colleges and Georgia Military College did not
share data with GA-AWARDS at time of this report (these
students make up 3-5% of dual enrollment students each year)
• Private school and homeschool dual enrollees are excluded.
• GA-AWARDS does not yet include 2016-2017 data, so this report
does not include any trends through last academic year.
Dual Enrollment and Postsecondary Outcomes
November 9, 2017

Dual Enrollment History and Participation
6Dual Enrollment and Postsecondary Outcomes
November 9, 2017
10,5839,494
8,558 8,819 8,438
10,945
13,608
17,661
23,693
0
5,000
10,000
15,000
20,000
25,000
2007-08 2008-09 2009-10 2010-11 2011-12 2012-13 2013-14 2014-15 2015-16
Academic Year
Number of Public School Students Participating in Dual Enrollment
HB 186 creates
streamlined DE policies
and allows K-12
schools to retain FTE
funding.
HB 149 creates
Move On When
Ready Program for
full-time DE
students.
The Great Recession
begins.
The CCRPI, the
state's accountability
system, includes dual
enrollment measure
for the first time.
SB 2 and 132 collapse
dual enrollment into one
program and create new
high school diploma
option.
181%
increase
from
2011-12
to
2015-16
7Dual Enrollment and Postsecondary Outcomes
November 9, 2017
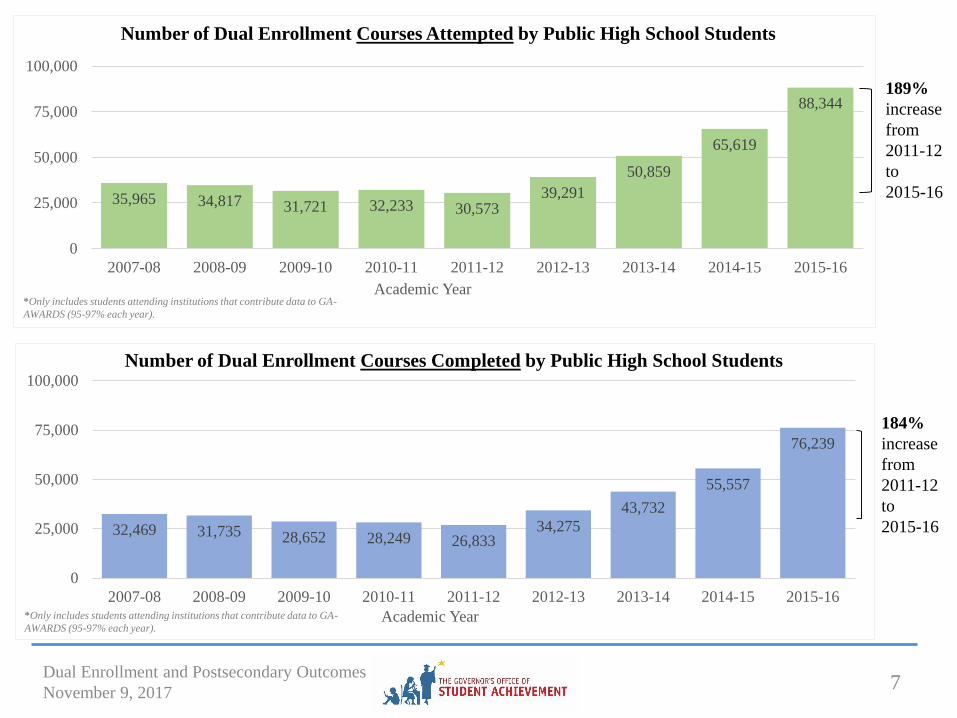
35,965 34,817 31,721 32,233 30,57339,291
50,859
65,619
88,344
0
25,000
50,000
75,000
100,000
2007-08 2008-09 2009-10 2010-11 2011-12 2012-13 2013-14 2014-15 2015-16
Academic Year
Number of Dual Enrollment Courses Attempted by Public High School Students
*Only includes students attending institutions that contribute data to GA-
AWARDS (95-97% each year).
32,469 31,735 28,652 28,249 26,83334,275
43,732
55,557
76,239
0
25,000
50,000
75,000
100,000
2007-08 2008-09 2009-10 2010-11 2011-12 2012-13 2013-14 2014-15 2015-16
Academic Year
Number of Dual Enrollment Courses Completed by Public High School Students
*Only includes students attending institutions that contribute data to GA-
AWARDS (95-97% each year).
189%
increase
from
2011-12
to
2015-16
184%
increase
from
2011-12
to
2015-16

8Dual Enrollment and Postsecondary Outcomes
November 9, 2017
61.5%
62.0%
62.6%
64.1%
61.6%
60.6%
59.2%
57.1%
56.3%
38.5%
38.0%
37.4%
35.9%
38.4%
39.4%
40.8%
42.9%
43.7%
2015-16
2014-15
2013-14
2012-13
2011-12
2010-11
2009-10
2008-09
2007-08
Dual Enrollment Trends by Gender
Percent of Courses Attempted by Females Percent of Courses Attempted by Males
Female students were more likely to participate in dual enrollment.
(Statewide high school enrollment was split evenly between males and
females)

9Dual Enrollment and Postsecondary Outcomes
November 9, 2017
28%
27%
25%
26%
27%
33%
34%
34%
34%
7%
6%
7%
6%
5%
4%
4%
3%
3%
58%
60%
61%
61%
61%
56%
56%
59%
59%
4%
4%
4%
4%
4%
4%
4%
3%
2%
3%
3%
3%
3%
2%
2%
2%
2%
2%
2015-16
2014-15
2013-14
2012-13
2011-12
2010-11
2009-10
2008-09
2007-08
Dual Enrollment Trends by Race/EthnicityBlack Hispanic White Asian Others
38%
38%
38%
38%
39%
39%
39%
40%
40%
13%
12%
11%
10%
10%
10%
9%
8%
7%
43%
43%
44%
45%
45%
45%
46%
47%
47%
4%
4%
4%
4%
3%
3%
3%
3%
3%
3%
3%
3%
3%
3%
3%
3%
3%
2%
2015-16
2014-15
2013-14
2012-13
2011-12
2010-11
2009-10
2008-09
2007-08
Public High School Enrollment Trends by Race/EthnicityBlack Hispanic White Asian Others
White students were overrepresented in dual enrollment courses relative to all high
school students, while black and Hispanic students were underrepresented.

10Dual Enrollment and Postsecondary Outcomes
November 9, 2017
51.6%
47.4%
45.8%
38.1%
38.7%
41.7%
42.5%
41.4%
38.5%
48.4%
52.6%
54.2%
61.9%
61.3%
58.3%
57.5%
58.6%
61.5%
2015-16
2014-15
2013-14
2012-13
2011-12
2010-11
2009-10
2008-09
2007-08
Dual Enrollment Trends by Free/Reduced Price Lunch StatusPercent of Courses Attempted by FRL Percent of Courses Attempted by Non-FRL
57.9%
57.2%
55.6%
52.6%
52.8%
50.3%
49.2%
45.9%
43.7%
42.1%
42.8%
44.4%
47.4%
47.2%
49.7%
50.8%
54.1%
56.3%
2015-16
2014-15
2013-14
2012-13
2011-12
2010-11
2009-10
2008-09
2007-08
Public High School Enrollment Trends by Free/Reduced Lunch StatusPercent FRL Percent Non-FRL
Low-income students were underrepresented in dual enrollment courses, but this gap
narrowed as enrollment grew over the last four years (some of this change may be due to
increase in schoolwide free lunch participation in some schools).

11Dual Enrollment and Postsecondary Outcomes
November 9, 2017
Social Studies
21%
English/Language
Arts and
Literature
20%
Mathematics
15%
Career/Tech/
Maintenance/Industry
10%
Health Science
& Services
9%
Science
7%
Criminal Justice/ Human
Services
4%
Business/ Management/
Marketing
3%
Communication/
Journalism
2%
World
Languages
2%
All Others
7%
What Courses Did 2016 Public School Dual Enrollment Students Take?
88,344courses
• Nearly two-thirds of dual
enrollment courses were
in the four core subject
areas.
• Career/Tech/Maintenance/
Industry courses made up
10% of courses taken.

12Dual Enrollment and Postsecondary Outcomes
November 9, 2017
2,108
3,000
3,670
6,023
7,423
8,344
13,213
17,893
18,881
0 5,000 10,000 15,000 20,000
Communication/Journalism
Business/Management/Marketing
Criminal Justice/Human Services
Science
Health Science and Services
Career/Tech/Maintenance/Industry
Mathematics
English/Language Arts and Literature
Social Studies
Trends in the 10 Most Common Dual Enrollment Courses
2016
2012
2008
• The increase in the count of core subject courses outpaced other subject areas.
• Career/Tech/Maintenance/Industry course enrollment dropped significantly
between 2008 and 2012, likely due to a lack of funding for dual enrollment
technical college courses. The courses increased from 2012 to 2016 but are still
below 2008 levels.
13Dual Enrollment and Postsecondary Outcomes
November 9, 2017
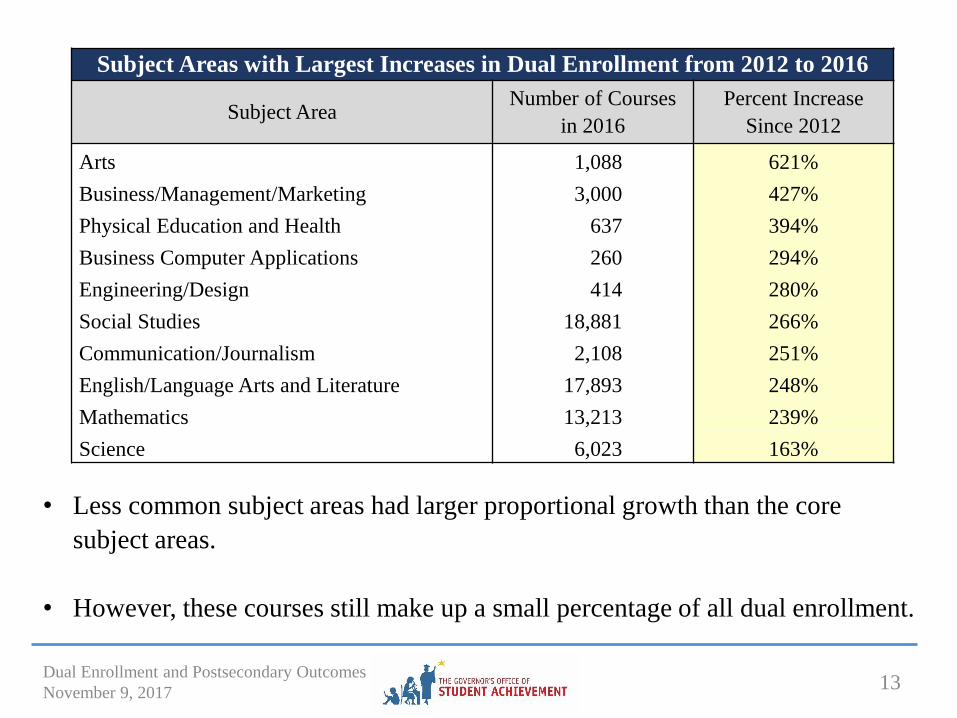
Subject Areas with Largest Increases in Dual Enrollment from 2012 to 2016
Subject AreaNumber of Courses
in 2016
Percent Increase
Since 2012
Arts 1,088 621%
Business/Management/Marketing 3,000 427%
Physical Education and Health 637 394%
Business Computer Applications 260 294%
Engineering/Design 414 280%
Social Studies 18,881 266%
Communication/Journalism 2,108 251%
English/Language Arts and Literature 17,893 248%
Mathematics 13,213 239%
Science 6,023 163%
• Less common subject areas had larger proportional growth than the core
subject areas.
• However, these courses still make up a small percentage of all dual enrollment.
14Dual Enrollment and Postsecondary Outcomes
November 9, 2017
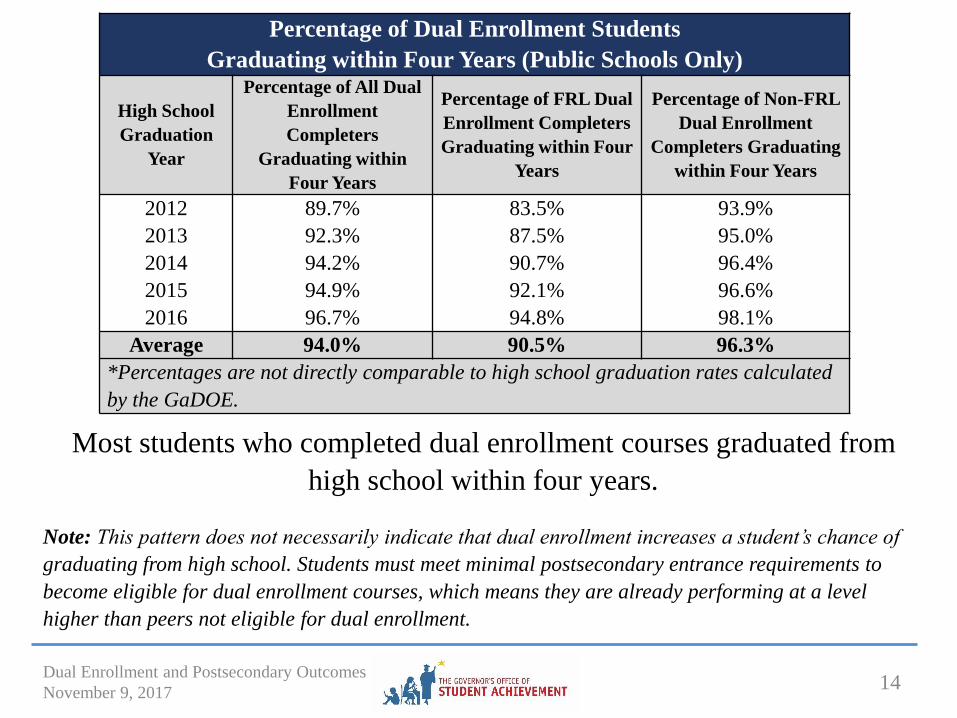
Percentage of Dual Enrollment Students
Graduating within Four Years (Public Schools Only)
High School
Graduation
Year
Percentage of All Dual
Enrollment
Completers
Graduating within
Four Years
Percentage of FRL Dual
Enrollment Completers
Graduating within Four
Years
Percentage of Non-FRL
Dual Enrollment
Completers Graduating
within Four Years
2012 89.7% 83.5% 93.9%
2013 92.3% 87.5% 95.0%
2014 94.2% 90.7% 96.4%
2015 94.9% 92.1% 96.6%
2016 96.7% 94.8% 98.1%
Average 94.0% 90.5% 96.3%
*Percentages are not directly comparable to high school graduation rates calculated
by the GaDOE.
Most students who completed dual enrollment courses graduated from
high school within four years.
Note: This pattern does not necessarily indicate that dual enrollment increases a student’s chance of
graduating from high school. Students must meet minimal postsecondary entrance requirements to
become eligible for dual enrollment courses, which means they are already performing at a level
higher than peers not eligible for dual enrollment.

15Dual Enrollment and Postsecondary Outcomes
November 9, 2017
1 to 5
12%
6 to 10
40%11 to 15
25%
16 to 20
8%
21 to 30
11%
31 to 40
2%
41+
2%
Credits Earned by High School Graduates
Who Participate in Dual Enrollment
High School
Graduates
Between 2012
and 2016
• More than half of
graduates earned 10 or
fewer credit hours.
• 25% of graduates earned
between 11 and 15
credits, roughly
equivalent to a semester
of full-time study.
• Only 4% earned more
than 30 credit hours.

16Dual Enrollment and Postsecondary Outcomes
November 9, 2017
57%
55%
55%
55%
53%
50%
48%
48%
11%
12%
14%
13%
14%
18%
19%
18%
6%
6%
6%
5%
5%
4%
4%
4%
10%
10%
10%
11%
9%
8%
9%
9%
10%
12%
11%
11%
12%
13%
13%
15%
7%
5%
5%
5%
6%
7%
7%
6%
2015
2014
2013
2012
2011
2010
2009
2008
Hig
h S
cho
ol
Gra
du
atin
g C
lass
Postsecondary Enrollment Trends of Public High School Graduates
Who Earned Dual Enrollment Credit*Enrolled in Georgia public college/university Enrolled in Georgia public technical college
Enrolled in Georgia private college/university Enrolled in college/university outside of Georgia
Working in Georgia, not enrolled in college Unknown
• Between 2008 and 2015, an increasing percentage of dual enrollment participants
enrolled in Georgia public colleges/universities. While the percentage of Georgia
public technical colleges enrollees decreased, actual numbers of dual enrollment
students in technical colleges have still increased since 2012.*Enrollment within one year of graduating from high school.

17Dual Enrollment and Postsecondary Outcomes
November 9, 2017
41%
43%
43%
44%
45%
45%
46%
46%
8%
9%
9%
8%
9%
10%
11%
10%
5%
6%
6%
6%
5%
5%
5%
5%
10%
10%
10%
10%
10%
9%
9%
10%
21%
21%
20%
18%
18%
17%
16%
18%
15%
11%
13%
13%
14%
14%
14%
12%
2015
2014
2013
2012
2011
2010
2009
2008
Hig
h S
cho
ol
Gra
du
atin
g C
lass
Postsecondary Enrollment Trends of
Statewide Public High School Graduates*Enrolled in Georgia public college/university Enrolled in Georgia public technical college
Enrolled in Georgia private college/university Enrolled in college/university outside of Georgia
Working in Georgia, not enrolled in college Unknown
• In the class of 2015, 83% of high school graduates who participated in dual
enrollment were enrolled in some form of postsecondary within a year of
graduating, compared to 64% of all high school graduates.
• This gap widened steadily since the class of 2008.
*Enrollment within one year of graduating from high school.

18Dual Enrollment and Postsecondary Outcomes
November 9, 2017
48%
29%
6%
11%
33%
70%
27%
24%
16%
14%
14%
8%
Within
6 Years
Within
4 Years
Within
2 Years
Postsecondary Progression of Dual Enrollment Students
after High School GraduationEarned Postsecondary Credential Enrolled in Postsecondary Working without Postsecondary Credential or Enrollment Unknown
36%
17%
2%
13%
35%
62%
31%
29%
21%
21%
20%
14%
Within
6 Years
Within
4 Years
Within
2 Years
Postsecondary Progression of Statewide Students
after High School Graduation
Earned Postsecondary Credential Enrolled in Postsecondary Working without Postsecondary Credential or Enrollment Unknown
Dual enrollment participants were more likely to earn a postsecondary credential
within two, four, and six years compared to statewide high school graduates.

Summary of Findings
19
• Dual enrollment participation increased sharply from 2012 to 2016.
• Most students who completed dual enrollment courses graduated
from high school within four years, regardless of free/reduced
lunch status.
• When compared to statewide high school graduates, students who
completed dual enrollment courses were more likely to:
• Enroll in postsecondary coursework within a year of
graduation, and
• Earn a postsecondary credential within six years.
Note: More rigorous research is needed to determine how much of
these trends are caused by students participating in dual enrollment
and how much reflect the characteristics of the dual enrollment
students compared to those who do not participate.
Dual Enrollment and Postsecondary Outcomes
November 9, 2017

Questions?
20
The full report is posted on GOSA’s Research
Page later this month.
http://gosa.georgia.gov/research
Dual Enrollment and Postsecondary Outcomes
November 9, 2017

21
Supplementary Charts/Information
Dual Enrollment and Postsecondary Outcomes
November 9, 2017

Dual Enrollment Programs Prior to 2015 Senate Bill 132
22
The Accel Program—Used lottery funds to pay for dual enrollment courses that were part of core
graduation requirements (English/Language Arts, Mathematics, Social Studies, Science, and Foreign
Languages). Between 2008 and 2015, credit hours counted against a student’s HOPE scholarship credit
hour eligibility in some years but not in others. In 2011, the funding source was moved from lottery funds
to state funds.
Move on When Ready—Open to 11th and 12th grade students who enrolled full-time (12 or more semester
credit hours) in postsecondary institutions. The program was funded through the student’s allocation of
state K-12 FTE funding. MOWR credit hours did not count against the HOPE Scholarship credit hour
eligibility.
The HOPE Grant—Provided non-need based assistance to Georgia residents seeking technical certificates
or diplomas from TCSG and USG eligible postsecondary institutions. For dual enrollment, the Hope Grant
Program covered most of the cost of attending and was funded with lottery funds. Between 2008 and 2015,
credit hours counted against a student’s HOPE scholarship credit hour eligibility in some years but not in
others. After the 2015 changes, the HOPE grant still exists for postsecondary students seeking technical
certificates and diplomas, but it is not a dual enrollment program.
A small subset of students also earned dual enrollment credit through Early College, Gateway to College,
and Residential Programs.
Dual Enrollment and Postsecondary Outcomes
November 9, 2017

23Dual Enrollment and Postsecondary Outcomes
November 9, 2017
Subject Areas 2007-08 2011-12 2015-16 Total
2008 to 2012
Percent
Increase
2012 to 2016
Percent
Increase Trend
Arts 290 151 1,088 1,529 -48% 621%
Business/Management/Marketing 2,038 569 3,000 5,607 -72% 427%
Physical Education and Health 321 129 637 1,087 -60% 394%
Business Computer Applications 831 66 260 1,157 -92% 294%
Engineering/Design 375 109 414 898 -71% 280%
Social Studies 2,994 5,165 18,881 27,040 73% 266%
Communication/Journalism 385 600 2,108 3,093 56% 251%
English/Language Arts and Literature 4,025 5,136 17,893 27,054 28% 248%
Mathematics 2,033 3,902 13,213 19,148 92% 239%
Science 1,319 2,287 6,023 9,629 73% 163%
World Languages 395 648 1,593 2,636 64% 146%
Other/General 1,616 544 1,297 3,457 -66% 138%
Criminal Justice/Human Services 1,647 1,610 3,670 6,927 -2% 128%
Education 1,059 445 975 2,479 -58% 119%
Career/Tech/Maintenance/Industry 9,514 3,851 8,344 21,709 -60% 117%
Computer Science and Information Technology 2,308 889 1,494 4,691 -61% 68%
Health Science and Services 4,655 4,420 7,423 16,498 -5% 68%
Remedial/Support Courses 160 52 31 243 -68% -40%
Grand Total 35,965 30,573 88,344 154,882 146% 189%
Total Dual Enrollment Courses Attempted by Subject Area in 2008, 2012, and 2016