dubai real estate investment: a predictive and time series
TRANSCRIPT

Rochester Institute of Technology Rochester Institute of Technology
RIT Scholar Works RIT Scholar Works
Theses
5-2021
Dubai Real Estate Investment: A Predictive and Time Series Dubai Real Estate Investment: A Predictive and Time Series
Analysis Analysis
Nikhil Krishna [email protected]
Follow this and additional works at: https://scholarworks.rit.edu/theses
Recommended Citation Recommended Citation Krishna, Nikhil, "Dubai Real Estate Investment: A Predictive and Time Series Analysis" (2021). Thesis. Rochester Institute of Technology. Accessed from
This Master's Project is brought to you for free and open access by RIT Scholar Works. It has been accepted for inclusion in Theses by an authorized administrator of RIT Scholar Works. For more information, please contact [email protected].
i
Dubai Real Estate Investment: A
Predictive and Time Series Analysis by
Nikhil Krishna
A Capstone Submitted in Partial Fulfilment of the Requirements for the
Degree of Master of Science in Professional Studies:
Data Analytics
Department of Graduate Programs & Research
Rochester Institute of Technology
RIT Dubai
May 2021

ii
RIT
Master of Science in Professional Studies:
Data Analytics
Graduate Capstone Approval
Student Name: Nikhil Krishna
Student UID: 364001159
Graduate Capstone Title: Dubai Real Estate Investment: A Predictive and Time
Series Analysis
Graduate Capstone Committee:
Name: Dr. Sanjay Modak Date:
Chair of committee
Name: Dr. Ehsan Warriach Date:
Member of committee/Mentor

3
Acknowledgements
To begin with I would like to thank my parents for their belief and support in order for my
successful completion of this program. Their constant encouragement and advice helped me
to think outside the box and better understand my goals towards success.
I would also like to thank Dr. Sanjay and his department for introducing this program in this
region, as it opens doors to several opportunities considering the growing demand in the
field of Data Science. Along with the department, I would also like to extend my gratitude to
the staff members of RIT, who helped in making a seamless shift from regular classes to
online sessions during such unprecedented times.
I extend my heartfelt thanks to Dr. Ehsan for his persistent advice and guidance throughout
graduate study at RIT and especially as a mentor for my successful completion of this
capstone. Apart from his mentorship, he has been a great guide to know more about the field
of Data Analytics and Business Intelligence.

4
Table of Contents Acknowledgements ............................................................................................................... 3
Abstract ................................................................................................................................ 5
1. Statement of the Problem ............................................................................................... 6
2. Background of the Problem ............................................................................................... 7
3. Project Definition and Goals.............................................................................................. 8
4. Literature Review .............................................................................................................. 9
5. Methodology Used .......................................................................................................... 14
Data Analytics Tools and Software .................................................................................. 15
Data Analysis models ...................................................................................................... 15
6. Sources of Data ............................................................................................................... 17
7. Analysis .......................................................................................................................... 18
7.1 EXPLORATORY DATA ANALYSIS ...................................................................... 18
7.1.1 Transaction Dataset ............................................................................................. 18
7.1.2 Freehold Sales Rental Dataset ............................................................................. 20
7.1.3 Residential Sales Index Dataset ........................................................................... 21
7.1.4 Properties Dataset ................................................................................................ 23
7.2 VISUALIZATION .................................................................................................... 25
Visualization 1: Yearly Property Sales ......................................................................... 25
Visualization 2: Average Property Price per Area......................................................... 25
Visualization 3: Dubai Freehold Property Sales based on number of bedrooms ............ 26
Visualization 4: Average Price per Sqft and Number of Bedrooms ............................... 27
7.3 WEBSITE FOR DATA VISULIZATION AND MODELLING ................................ 27
7.4 PREDICTIVE ANALYSIS ........................................................................................ 28
7.5 TIME SERIES ANALYSIS ....................................................................................... 30
Step 1: Visualize the time series data............................................................................ 30
Step 2: Decompose the Data ......................................................................................... 32
Step 3: Check for stationarity ....................................................................................... 34
Step 4: Making dataset stationary through Detrending and De-seasonalization ............. 36
Step 5: Plot the Correlation and Auto Correlation Charts .............................................. 38
Step 6: Construct Time-series models .......................................................................... 40
8. Results ............................................................................................................................ 47
9. Conclusions and Future Work ......................................................................................... 49
10. Bibliography ................................................................................................................. 50
11. Appendix....................................................................................................................... 52
5
Abstract
The capstone aims to provide real estate investors suitable portfolios for investment in Dubai,
considering maximum return on investment as per their investment goals. CRISP-DM
methodology was used as it is a structured approach for planning a data mining project. The
datasets from Dubai Land Department, RERA and Property Finder was used to conduct
Exploratory Analysis, Predictive Analysis using Linear Regression, Random Forest
Regression, Decision Tree Regression, Gradient Boost Regression and Time Series analysis
using Exponential Smoothing, Holt forecasting, Holt Winter Method, ARIMA and SARIMA.
To facilitate investors in easily searching for suitable portfolio to invest in based on their
preference, a web platform has been designed. This platform also provides the option of
using Predictive Analysis for estimating the returns. The best result for Predictive Analysis
was provided by Gradient Boost Regression and for Time Series Analysis was provided by
SARIMA model as the dataset includes seasonality.
Key Words
CRISP-DM, Exploratory Analysis, Predictive Analysis, Regression Models, Time Series
Analysis, Simple Exponential Smoothing (SES), Holts Forecasting, ARIMA, SARIMA

6
1. Statement of the Problem
Dubai attracts numerous local and international real estate investors through its freehold
policies, new visa regulations and state-of-the art infrastructure. An investor will find a
plethora of Dubai real estate data available from different sources but most of the time it does
not give useful insights about a good return on their real estate investment. This forces them
to get advice and support of real estate agents who mostly have their personal agenda and not
necessarily give advice on the interests of the investor. Besides there is no transparency on
the kind of analysis they do to recommend portfolio to a real estate investor. As a result, the
project aims to create a data driven model and a responsive website to suggest suitable
investment portfolio in creating a greater transparency and to build trust among real estate
investors.

7
2. Background of the Problem Real estate markets are highly volatile and subject to various risks which makes it
challenging for real estate investors to evaluate whether a real estate portfolio is good for
investment or not. Overtime there has been a surge in the number of online platforms that
lists the available property units, buildings and lands for sale and/or rent. Such platforms
have been an eyeopener for investors as they started to notice the variation in the per square
feet pricing for similar properties in the same locality.
There are multiple factors that determine the current price of any property, which will be
difficult for an investor to figure out all at once. Due to these, there are two main challenges
that investors face. The first one is to determine the most appropriate current price for a
property. And second, is to determine the future value of the property after a certain period of
time, considering the various factors that are expected such as area value, neighboring
developments, risks, market cycle.

8
3. Project Definition and Goals
The project aims to provide Dubai Real Estate investors an insight on the real estate market
trends and help them identify suitable investment portfolio for real estate investment
considering the price forecast and real estate market cycle. A website is designed to assist
investors in identifying suitable portfolio for investment visualizing the demand in different
areas in Dubai. The predictive analytics would provide an estimate of the predicted price of
property based on the parameters chosen by investors. The time series analysis would provide
an insight on the market cycle by considering the seasonality of the property sales over the
last one decade.

9
4. Literature Review
Over the years, Dubai has been a great example to the world on the endless number of
possibilities in terms of infrastructure, jobs and investment opportunities. In less than three
decades, Dubai has transformed itself from a land of desert to a city with the greatest number
of skyscrapers, including the world’s tallest. Due to such reasons, Dubai has turned out to be
one of the main tourist hub spots in the world and attracts international population for jobs
and investments. Of all types on investments, real estate investments gained momentum
when Dubai introduced “Law No. (7) of 2006 Concerning Real Property Registration in the
Emirate of Dubai” (Dubai Land Department, 2013).
For any investor, it is highly important to understand the real estate market trends to make
appropriate decisions. A real estate market analysis would be helpful in minimizing risks and
maximizing opportunities for not just the investors but also for developers, lenders, and other
stakeholders in the sector (Brett & Schmitz, 2009). Although market studies are filled with
data, the challenge is in interpreting the data which requires specialized skills. Along with
that, drawing useful conclusions by harnessing the huge volume of data quickly using
suitable data modeling tools to produce actionable insights is more of an art than a science.
For a long time real estate decisions were based on a combination of intuition and traditional
retrospective data which is now transformed by the use of new variables that help to assess a
location’s future risk and opportunities (Gabriel Morgan Asaftei et al., 2018).
To provide an effective analysis of the real estate data Li et al. (2016) developed a
visualization platform to assist users in understanding the real estate market; visually
compare properties/suburbs that satisfy their requirements and preferences. This exploratory
analysis, provides a personalized overview at different granularities of details, of various
properties.
At the time of investment, valuation of property is critical to estimate the cost of a property.
Commonly, a real estate valuation is done by comparing similar structures, cost and yield
analysis. Hromada (2016) proposed an innovative method named “historical market price”,
that uses mathematics, statistical and database-founded algorithms for valuation. The method
10
takes into consideration historical market price, index of detrition, index of constructional
and technical augmentation of real estate and index of price level change in a given location
and for a given category of real estate to precisely deduce current real estate value.
Hedonic regression model routed to microeconomic foundations, is highly recommended for
real estate pricing as it helps to estimate quality-adjusted price indices using regression
techniques (Sopranzetti, 2015). The paper examines three specific hedonic specifications: the
linear, semi-log, and Box-Cox transformed hedonic models and applies them to real estate
data for price estimation. Hedonic regression model is based on attributes such as property
view, size, number of bedrooms and other important features in a property that have an
impact on its value (Dubai Land Department & Property Finder, 2020). The hedonic price
regressions have mainly been used for inference on the contrary machine learning when
applied to big data has the potential to use it for both inference and prediction (Pérez-Rave et
al., 2019). However, when it comes to big data analysis there are a range of other regression
models like Linear Regression, Random Forest Regression, Decision Tree Regression and
Gradient Boost Regression.
For an investor to make efficient decision on investment, there is a need to have a suitable
platform that includes all relevant features from data analysis, visualization to suitable
recommendations. Rab (2018) developed a python web tool that is capable of analyzing
property investments. The tools were built using data mining techniques to determine prices
for properties, and return on investment.
One of the most challenging tasks for any investor would be to assess the return on
investment which is greatly influenced by how our economy works on a macro and micro
level and the market cycle (Brumer, 2019). A market cycle has four phases- recovery,
expansion, hyper-supply and recession.
• The recovery phase comes soon after recession when there is low demand for
housing and high vacancy rates. This is a great time to invest in properties as the
property values and interest rates are low and there exists chances of additional
discounts. All these greatly mitigates purchase risks. However, due to excess vacancy
rates rental rates are often low in this period which would impact returns.
• During expansion phase there is more confidence in the market as the GDP would
stabilize back to normal levels, there will be steady growth jobs, there is balance in
11
supply and demand, growth in the rental rates, and beginning of new construction.
The risk could be higher chances of overextending with leverage and incurring higher
debt. Investments primarily made predicating price appreciation could be in trouble as
prices are typically on the higher end of the cycle. On the contrary, if the goal is to
hold the property for long term, the property will remain profitable throughout future
cycles.
• At hyper-supply phase, there will be tipping point from a balanced supply and
demand to oversupply leading to drop in the price of property. Subsequently,
construction slows due to high market inventory and rental rates remain high though
the demand decreases. The risk is that it is difficult to time the market perfectly. Many
times, investors are in a rush to sell the property before there is a decline in the price.
• The recession phase is the most difficult phase that results due to over-inflated
growth. An investor may only sell property at a rock bottom price when there is not
enough capital reserves or liquidity.
Considering that there are diverse unpredictable factors that contribute to the price variation
of real estate, even in a transparent mature market, forecasting real estate cycles is not
straight forward. Dubai’s real estate market is still young, maturing and increasingly
transparent and unique in terms of its demand and supply dynamics. This makes forecasting
real estate market cycle even more challenging. Though debatable, between the years 2006-
2018 it is considered that Dubai has seen two cycles, the first cycle from 2006-2011 which
was prematurely disrupted by the 2008 global economic downturn. Later in 2012, we can see
that the second cycle began by an initial recovery of 5% followed by an upswing in price
growth by an unsustainable 34% in just one year. This prompted government to take
measures, doubling registration fees and capping mortgage LTVs (loan-to-value) to cool a
potential overheating. Figure 1 illustrates the average residential prices and performance in
Dubai during the period 2006-2018.

12
Figure 1 Dubai Average Residential Process and Performance [Source: Arabian Business]
These market cycles can be better studied using time series analysis and it will help to
forecast property sales price more precisely. One of the most basic methods of describing the
series of data, is to check whether it is stationary or non-stationary. The sales price is non-
stationary data which means the price can sharply increase at the time of turbulence (bubble)
and thereafter gradually decrease (Kulesza & Belej, 2015). Additionally, some datasets have
trends and some have seasonality. Holt's model or linear exponential smoothing with two
parameters is commonly used model for forecasting data with trend (“HOLT’S Forecasting
Model,” 2006). An extensions of Holt’s model is Holt’s Winter method with both additive
and multiplicative seasonality to forecast quarterly visitor nights in Australia spent by
international tourists (Hyndman & Athanasopoulos, 2018). This can be helpful is estimating
the price of property considering seasonality. Literatures suggest that the
in a study conducted by Soy Temür, Akgün and Temür (2019), they suggest ARIMA (Auto
Regressive Integrated Moving Average) models are applied to predict future values of
various time series data such as house prices, electricity prices, sugar prices, stock quotes,
wind speeds, water quality etc. as it can help to understand the dynamics of a given
application. The applied time series for predicting housing sales in Turkey using ARIMA (as
liner model), LSTM (Long Short-Term Memory as nonlinear model) and the hybrid model.
When MAPE (Mean Absolute

13
Percentage Error) and MSE (Mean Squared Error) accuracy measurement results were
compared, the best result was obtained by the hybrid model. In another study conducted by
Moro, Weise and Bornia (2020), they suggest that a combined model of SARIMA (Seasonal
Auto Regressive Integrated Moving Average) model (2,0,0)(2,0,0)12 and MLP/RNA
(12,10,1), provided better performance, with a Root Mean Square Error ( RMSE) of 368.74,
MAPE of 19.2%.
There are various performance metrics error measurement tools are used for evaluation of
results obtained using a range of data analytics models. According to Botchkarev (2018),
three metrics are most popularly used in a timeline of 25 years: mean square error (MSE) (or
root MSE (RMSE)), mean absolute error (MAE) and mean absolute percentage error
(MAPE). Dataset may have outliers that impact the quality of results. MSE takes these
outliers into account whereas MAE could be considered when the outlier residuals won’t
contribute as much to the total error as MSE. The MAPE is the percentage equivalent of
MAE that makes adjustments in the MAE original formula to convert everything into
percentages. RMSE would be suitable of this project as it would not be apt to ignore the
influence of outliers in the real estate dataset.
The literature review provided an insight on the various approaches commonly adopted in the
real estate industry and to plan & identify a suitable approach for this project.

14
5. Methodology Used
CRISP-DM (CRoss Industrial Standard Process for Data Mining) methodology will be used
for this project because it outlines key processes for carrying out a data mining project (Wirth
& Hipp, 2000).
a) Business understanding – At the outset, the aim is to get an overview of the real estate
industry and challenges faced by investors in identifying suitable portfolio for investment.
Literature review helps to get a good understanding of the real estate business in Dubai to
determine the project goals and objectives, identify source of datasets and define project
deliverables. Moreover, this phase helps to create a project plan to achieve these targets.
b) Data understanding – The datasets that has been gathered from Dubai Pulse about Dubai
Land Department and RERA needs to be studied to identify on how it will fit the above-
mentioned objectives. After collecting the data, data needs to be explored to identify relevant
details for the project and the quality of the data should be verified. As the existing datasets
was insufficient to achieve the objective, an additional dataset was gathered from Kaggle &
Property Finder.
c) Data preparation – This was a time-consuming phase as the selected datasets and its
fields had to be cleaned before they can be used. As there were multiple datasets available
from Dubai Pulse, the rationale for inclusion and exclusion of relevant dataset had to be
prepared. The identified datasets had both English and Arabic details and some of the fields
were empty. As a result, suitable cleaning techniques were used in order to generate optimum
result. For integrating the datasets, the common fields between datasets that can be used to
join two or more data sets were identified. Based on the requirement, the data was formatted.
c) Modeling – In this phase, the analysis was done using the selected modelling techniques
which includes Linear Regression, Random Forest Regression, Decision Tree Regression and
Gradient Boost Regression for Predictive Analysis, whereas for Time Series analysis they
include Exponential Smoothing, Holt Forecasting, Holt Winter Method, ARIMA and
SARIMA. Test design will be prepared, then the model will be built.
d) Evaluation – Once the models were built, they were tested using the test data before
getting to the deployment phase. As the final results were satisfactory, the potential models
were finalized based on their level of accuracy.
e) Deployment – In the final phase, the selected models has been deployed on to the web
platform.

15
Data Analytics Tools and Software Among the various data analytical, for this study, I have used Python and R Code both of
which are open-source programming language extensively used in data analytics and data
science projects. While, Python has emerged as one of the most flexible tools in performing
analytics and displaying outcomes using various visualization techniques and data models, R
is mostly used for statistical computing and graphs. RStudio was used as an Integrated
Development Environment (IDE) as it supports both Python and R. One of the key benefits
of using RStudio is that we can generate rmd (R MarkDown) files that is convenient for
report writing. Pandas Profiling tool of Python is an excellent tool that was used for
evaluating the data quality. However, RStudio does not support Pandas Profiling and the
results could not be displayed in the IDE. Hence, I used Jupiter Notebook to obtaining the
results of Pandas Profiling. It is yet another easy to use and it does execute codes, with no
form of added configuration required. Finally, the website was developed using Python
Steamlit for visualization and predictive analysis. Streamlit is again an open-source app
framework used for Machine Learning and Data Science that helps create beautiful data apps
with minimal effort.
Data Analysis models The statistical models that can be used for analysis using Python programming language are
vast. Although considering the key areas of focus, i.e., real estate market and investors, the
data analysis models to be used for this study were classified into two broad categories-
Predictive Analysis and Time Series Analysis.
Predictive Analysis
a. Linear Regression though old, is a useful tool for predicting a quantitative response and
still uses as it follows a simple approach, and modern-day methods are generalizations or
extensions of linear regression (James et al., 2015).
b. Decision Tree Regression uses segmentation approach typically with the mean or the
mode of the training observations to identify the region to which it belongs. The splitting
rules used to segment the predictor space are summarized as a tree; hence, known as
decision tree methods.

16
c. Random Forest Regression methodology uses a tree-based machine learning algorithm
that leverages the power of multiple decision trees for making decisions. Hence, the
outcome is more inclusive. In the dataset that we have, if decision tree model is used then
the chances of getting a reasonable sale price will be low if the property is with low
quality and is unfurnished. Whereas, when random forest regression is used then the
chances of getting a reasonably good sales price for such properties is high as the decision
is based on the outcomes of multiple decision trees.
d. Gradient Boost Regression uses a tree-based approach for solving prediction problems
in both classification and regression domains. Gradient-boosted models is widely used
considering its accuracy and efficiency. To obtain a sufficiently optimal solution, it uses
successive steps in the learning process and reduces the number of iterations.
Time Series Analysis: Five time series analysis models were used to understand the past real
estate market behavior to analyze future trends.
a. Simple Exponential Smoothing (SES) is a time series forecasting method for univariate
data without a trend or seasonality. Generally, datasets consist of two distinct
components: signal and noise. Smoothing is a technique that separates the signal and the
noise as much as possible and the smoother acts as a filter to obtain rather more accurate
estimate for the signal (Montgomery, Jennings and Kulahci, 2008). Based on the analysis
of whether the time series data has stationarity, this method would be chosen for the
appropriate variables..
b. Holt Forecasting Method is an extension of the Simple Exponential Smoothing of the
Simple Exponential Smoothing methods which does not adequately model trends.
However, Holt’s Linear Trend Method also knows as Double Exponential Smoothing
adds a second single exponential smoothing model to capture the trend.
c. Holt Winter Method is used for three aspects of the time series: a typical value
(average), a slope (trend) over time, and a cyclical repeating pattern (seasonality) for
forecasting. This in more comprehensive as compared to Holt forecasting method.
d. Autoregressive Integrated Moving Average (ARIMA) model can be applied to non-
stationary time series as well by applying finite differencing of the data point for
autocorrection and making the dataset stationary. ARIMA is a non- seasonal model.
e. Seasonal Autoregressive Integrated Moving Average (SARIMA) model is related to
ARIMA, as the difference between the two is that SARIMA supports the inclusion of
seasonality parameter.

17
6. Sources of Data
For this project secondary data was collected from DubaiPulse- Dubai Land Department,
RERA (Dubaipulse, 2021). As it is a Dubai government website, it is a reliable source of
information. Two datasets- Transaction.csv and Residential_sales _index.csv were identified
to be relevant for this project. Both datasets mainly consist of quantitative data and the
purpose of the project is to use it for time series analysis. Other potential datasets considered
initially from the Dubai Pulse were Units.csv, Building.csv, Projects.csv, Valuation.csv.
Though Units.csv and Building.csv have extensive details such as number of bedrooms, car
parks, built up area, building levels, whether the property includes offices, swimming pools
etc. the most critical information for this project i.e., the sale price and the rental price was
missing; hence had to exclude. Later Projects.csv, Valuation.csv datasets were also excluded
as it did prove to help in achieving the project objectives.
The second source of data is Property Finder which is a popular property website who has
collaborated with the Dubai Land Department to produce monthly report named MO’ASHER
Dubai House Price Index. By considering the credibility of the source, relevant data were
scraped from the Property Finder website to generate Freehold_sales_rental.csv dataset. The
benefit of this dataset is that it included the names of the area that is commonly known by
general public e.g. Downtown Dubai, Dubai Marina, Arabian Ranches etc. Additionally, this
dataset includes the sales and rental price for bedrooms from studio to five bedrooms in each
area. This will be helpful to estimate the trends in each area for apartments and villas using
time series analysis. Another plus point of this dataset is that the sales and rental prices are
average transaction value rather than the asking price. However, for less than 1% data, the
transaction values were missing that was substituted with asking price values.
The fourth dataset namely Properties_data.csv was collected from Kaggle. It has vital details
related to freehold property transactions including sale price, bedroom, availability of
balcony, close-set wardrobe, quality of construction, does it include maids’ room, latitude
and longitude etc. This provides a good insight on the overall freehold property trends; hence
considered for the project.
All these datasets required cleaning and preparation before it could be used for analysis. To
get more insight of the quality of the datasets an exploratory data analysis was conducted.

18
7. Analysis
7.1 EXPLORATORY DATA ANALYSIS
The need for suitable fields and relevance of each data set for the project was evaluated using
the Pandas Profiling tool of Python. It proved to be very comprehensive in evaluating the
data quality. The different data quality dimensions used for evaluation are Completeness,
Conformity, Consistency, Accuracy, Duplicacy and Integrity.
7.1.1 Transaction Dataset
Of the 21 columns available in the dataset, 5 variables have values in Arabic and the
remaining are in English from which 9 potential variables that was initially recognized to be
useful for the analysis were identified. Figure 2 illustrates the summary of the same as
derived from Pandas Profiling.
Figure 2 Overview of Transaction Dataset [Source: Author]
The dataset contains 72,757 rows wherein instance_date and area_name_en shows high
cardinality. As we can see, instance_date has 6384 distinct values and area_name_en has 245
distinct values. The dataset has 21.4% missing values which is too high and will not help to
draw any valid conclusions.
Figure 3 providers greater insight on the quality of data. We can see that rent_value and
meter_rent_price which are crucial information for this project has 96.1% missing value and
cannot be considered for the study. This led to the conclusion that this dataset will not be

19
sufficient to determine the return on investment that requires both sale price and rent value in
a specific locality as per the number of bedrooms. Another drawback with this dataset was
that the area names are not the names that are commonly known to general public, but instead
they were the official land areas.
We can see actual_cost is highly correlated with rent_value and meter_sale_price with
meter_rent_price. Figure 4 helped to further analyze correlations. This correlation is further
established in the Pearson's r correlation diagram in Figure 4. The Pearson's correlation
coefficient (r) is a measure of linear correlation between two variables. As the value of r for
rent_value and actual cost is close to 1, it indicates total positive linear correlation.
Additionally, we can see low positive correlation between actual_cost and rent_value to
procedure area.
Figure 3 Data Quality of Transaction Dataset [Source: Author]

20
Figure 4 Correlation diagram of Transaction dataset [Source: Author]
7.1.2 Freehold Sales Rental Dataset
This dataset was included due to the limitations of the transaction dataset. This is a clean
dataset with no duplication and <0.1% missing values
Figure 5 Overview of Sales Rental Price Dataset [Source: Author]

21
Figure 6 Data summary of Sales and Rental Price Dataset [ Source: Author]
Sale_Price, Price_per_sqft and Rent shows high cardinality that should not impact the
analysis as these are mostly rounded up transaction values. One of the interesting details is
that Palm Jumeriah followed by Dubai Silicon Oasis and Jumeirah Village Circle has more
variety of property offerings like apartments, villas and range of bedrooms from studio to five
bedrooms. There are more 3 and 4 bedrooms followed by two, single and studio bedrooms.
Here zero refers to studio apartment; hence not a matter of concern.
7.1.3 Residential Sales Index Dataset
As time series analysis is the main focus of the project, Residential Sales Index is an
important dataset which includes the monthy sales index of both villa and apartment between
2011 and 2021. The live dataset includes the sales index of the most recent month. The
dataset has 19 columns of which 7 relevant columns were included for the study.

22
Figure 7 Overview of Residential Sales Index Dataset [ Source: Author]
As the dataset contains unique value for each month since 2011, the number of observations
is limited to 120. Figure 8 shows that first_date_of_month is a unique value.
Figure 8 Data Quality of Residential Sales Index [Source: Author]

23
Figure 9 Correlation Diagram of Residential Dataset [Source: Author]
From Figure 8 and Figure 9, we conclude that there is strong correlation between monthly
sales index of villa and flat/apartment with the monthly price index of villas and
flat/apartment as the Pearson’s r value is close to 1. Since we propose to study the sales of
both villa and apartment separately all_monthly_price_index and all_monthly_index were
excluded.
7.1.4 Properties Dataset
The last dataset holds the details of freehold properties with 1905 observations.
Figure 10 Overview of Freehold Property Dataset [Source: Author]

24
Figure 11 Correlation Diagram of Freehold Property Dataset [ Source: Author]
The meaningful conclusion that we can draw from Figure 11, is that price_per_sqft has
positive correlation with size_in_sqft. In other words, as size increases price per sqft also
increases. Another key observation is that the price_per_sqft is also positively correlated with
the neighborhood. Another key observation is that the size_per_sqft and price_per_sqft are
positively skewed.
Figure 12 Data Summary of Freehold Property [Source: Author]
25
7.2 VISUALIZATION Further to the exploratory data analysis, additional visualizations are included to interpret
results from the graphs produced.
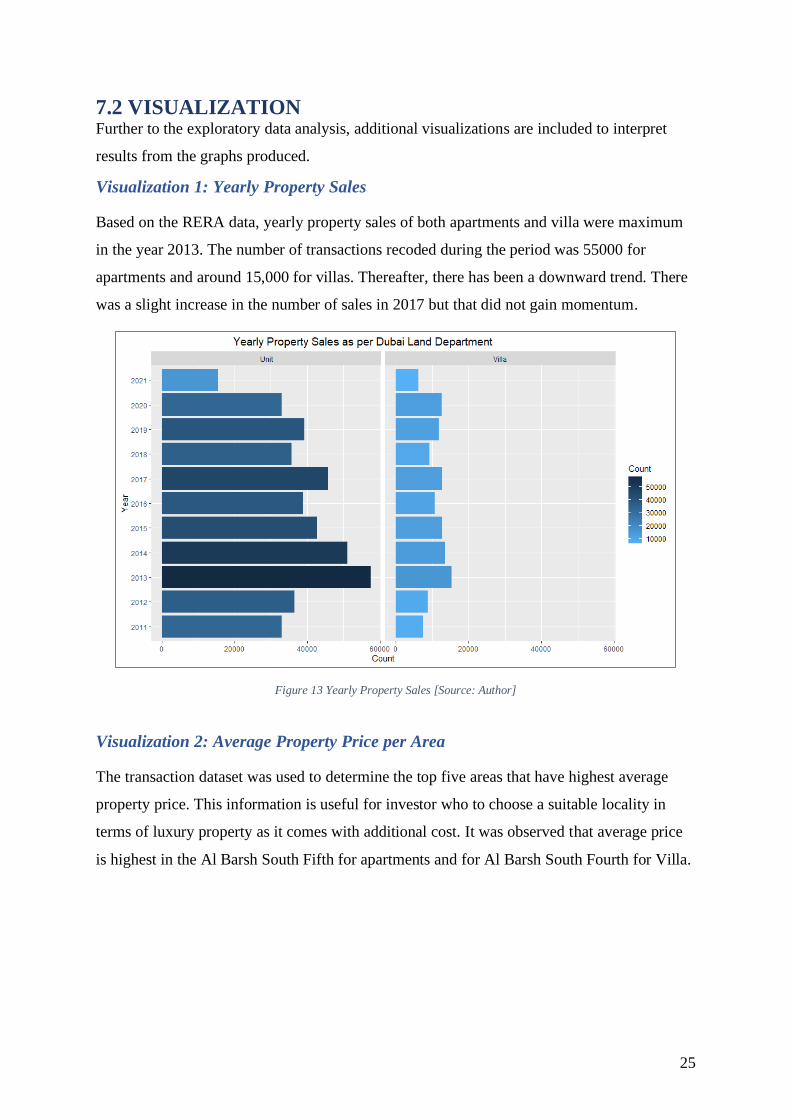
Visualization 1: Yearly Property Sales
Based on the RERA data, yearly property sales of both apartments and villa were maximum
in the year 2013. The number of transactions recoded during the period was 55000 for
apartments and around 15,000 for villas. Thereafter, there has been a downward trend. There
was a slight increase in the number of sales in 2017 but that did not gain momentum.
Figure 13 Yearly Property Sales [Source: Author]
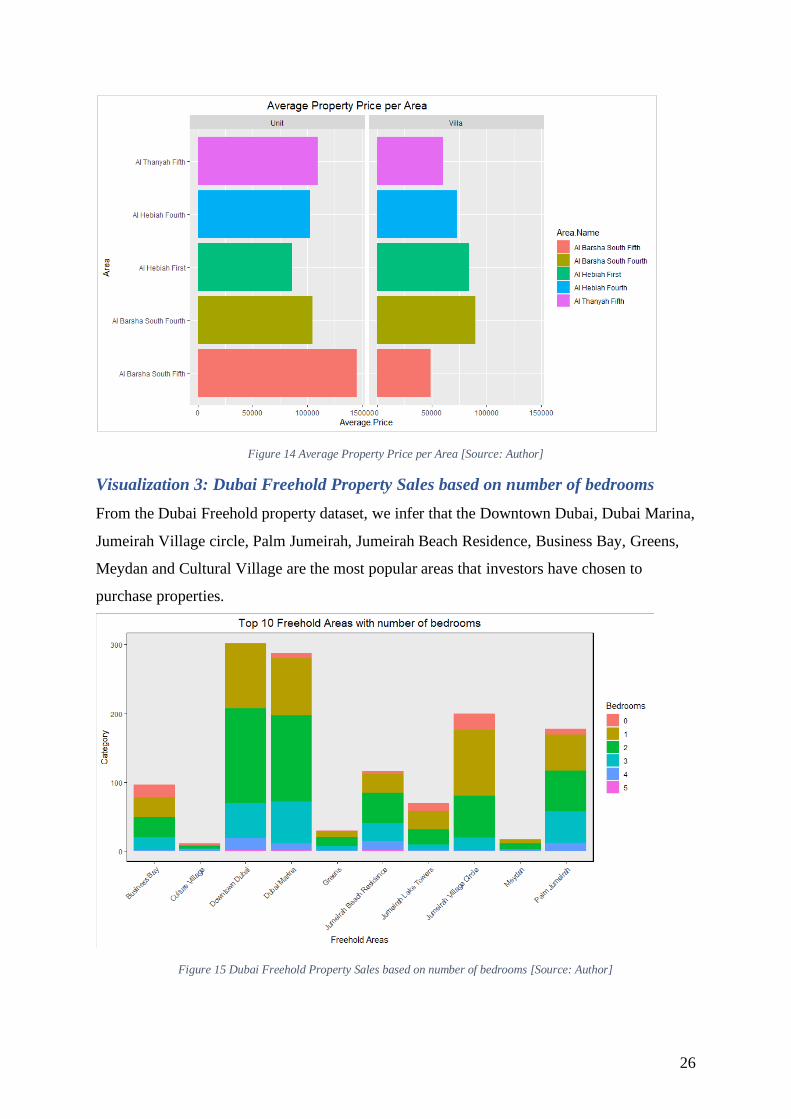
Visualization 2: Average Property Price per Area
The transaction dataset was used to determine the top five areas that have highest average
property price. This information is useful for investor who to choose a suitable locality in
terms of luxury property as it comes with additional cost. It was observed that average price
is highest in the Al Barsh South Fifth for apartments and for Al Barsh South Fourth for Villa.
26
Figure 14 Average Property Price per Area [Source: Author]
Visualization 3: Dubai Freehold Property Sales based on number of bedrooms
From the Dubai Freehold property dataset, we infer that the Downtown Dubai, Dubai Marina,
Jumeirah Village circle, Palm Jumeirah, Jumeirah Beach Residence, Business Bay, Greens,
Meydan and Cultural Village are the most popular areas that investors have chosen to
purchase properties.
Figure 15 Dubai Freehold Property Sales based on number of bedrooms [Source: Author]

27
Downtown Dubai tops the list with maximum number of investors choosing to invest in two-
bedroom apartments. In Jumeriah Village circle more one-bedroom apartments were sold
compared to two-bedroom.
Visualization 4: Average Price per Sqft and Number of Bedrooms
Another useful insight that was produced using the freehold property data set was the average
price per sqft in different areas and the number of sales transactions. It was observed that the
maximum numbers of two- bedroom and single-bedroom apartments were sold. The most
prominent place that investors have chosen for investment are Downtown Dubai followed by
Dubai Marina, Jumeirah Village Circle.
Figure 16 Average Price per Sqft and Number of Bedrooms [Source: Author]
7.3 WEBSITE FOR DATA VISULIZATION AND
MODELLING
The website was developed using Python Streamlit. To run the Streamlit file, need to
navigate to the script folder of python installation and type streamlit run [filename]. Once the
website is hosted, a suitable link will be added. The website is designed to help investors
select their preferred options like investment amount, number of bedrooms and quality of
construction to retrieve the list of all properties that fulfil the criteria. The map provides the
illustration of the areas where such properties are concentrated.

28
Figure 17 Webpage of Investment Choices [ Source: Author]
7.4 PREDICTIVE ANALYSIS
In this project, the main focus is to help investors identify the most accurate return on the
investment. Regression analysis is a reliable method for this as it helps to identify variables
that may impact on a topic of interest, in our case it is the sales price of the property. Four
prominent regression analysis models were considered for prediction: Linear Regression,
Decision Tree Regression, Random Forest Regression and Gradient Boost Regression.
Though technically Gradient Boost Regression is better than the rest, the best model can be
only as good as the variables measured by the study. Through the website, the investors are
given three variables to select: the size of the apartment in sqft, the preferred number of
bedrooms, the quality of the property to determine the predicted price value. As we know that
high quality property always comes with additional cost. However, the quality of
construction may or may not be a considerable factor when it comes to selling the property.

29
Also, the quality may or may not be a significant factor for getting an increased rent as there
are other factors that drive the rental price.
Another parameter for determining the best model for prediction, is the accuracy of the
predicted value further to the review of different performance metric measures, root-mean-
square error (RMSE) was identified to be suitable for this project. Besides it has the same
units as the quantity plotted on the vertical axis.
For the selected values as shown in Figure 18, we can see that Gradient Boosting Regression
models provides the best RMSE result compared to other models in terms of prediction
accuracy. The users have the option of picking the test data sample size between 5%-50%.
The RMSE Price is lowest for Gradient Boosting Regression Model with a value of AED
226,428.56. Hence, the predicted sale price is AED 887,037.68.
Figure 18 Webpage of Predictive Analysis Results [ Source: Author]
The second-best result is produced for Random Forest Regression with an RMSE price of
AED 232,703.97 which is way better than Decision Tree model results with a RMSE price of
AED 266,885.37. The rationale for this is that unlike Decision Tree Model, Random Forest
Regression Model leverages the power of multiple decision trees for making decisions which

30
helps to improve results. The results of both Linear Regression and Dummy Regressor which
is based on mean value is poor with RSME price of AED 253,950.19 AED 254,165.17. Even
though normalization was set to true for Linear Regression, that would have improved results
compared to a non-normalized dataset; however, the result is not as competitive as other
models.
7.5 TIME SERIES ANALYSIS
A time series analysis focuses on a series of data points ordered in time. For this project, two
time-series datasets that captures the real estate property sales and rent price are used. The
first dataset obtained from the Dubai Pulse provides the sales index for flats/apartments and
villa from 2011-2021. The second dataset scraped from the property finder website contains
the actual monthly average sale price, price per sqft and rental price of apartments and villas
with varying number of bedrooms from the prominent freehold properties that is covered in
four zones of the Dubai 2040 urban master plan project.
Time-series analysis of these two vital datasets will play a huge role in helping real estate
investors and advisers to understand and forecast data patterns, other phenomena, and results
to drive better investment decisions.
Step 1: Visualize the time series data
As it is easier to see a general trend using the mean, graphs that were plotted using original
data with monthly values (blue line) and the quarterly average resampled data orange dots.
By changing the ‘Q’ (or ‘Quarterly’) within y.resample(‘Q’), the plot was created for the
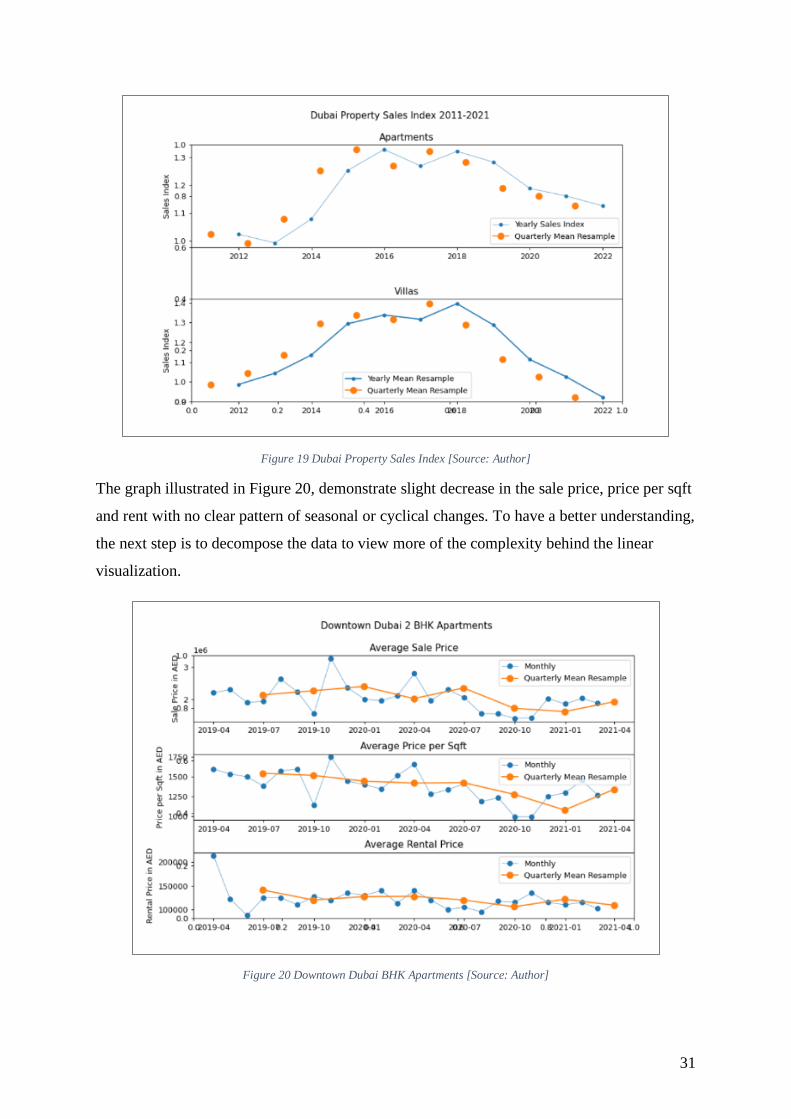
mean different aggregate dates. Figure 19 shows that the sales index maps to the second
market cycle between 2012 to 2021. Apartment sales peaked in 2016 and villa sales peaked
in 2018. Thereafter we can observe a downward trend with the lowest sales in 2020 when the
whole world went on total lockdown for over six months in different time periods when
COVID-19 pandemic exploded.
31
Figure 19 Dubai Property Sales Index [Source: Author]
The graph illustrated in Figure 20, demonstrate slight decrease in the sale price, price per sqft
and rent with no clear pattern of seasonal or cyclical changes. To have a better understanding,
the next step is to decompose the data to view more of the complexity behind the linear
visualization.
Figure 20 Downtown Dubai BHK Apartments [Source: Author]

32
Step 2: Decompose the Data
Decomposing of data into observed, trended, seasonal and residual was achieved using a
Python function called Seasonal Decompose within the statsmodels package. Figure 21 and
22 illustrate the observed value, trend, seasonal and residual for apartment and villa dataset.
In both trends are similar to observed values and there is influence of seasonality. Residuals
generally represents the error and determined by finding the difference between the observed
value with the corresponding fitted value. The results show high residual for selected years.
Figure 21 Monthly sales index of apartment [Source: Author]
Figure 22 Monthly sales index of Villa [Source: Author]
33
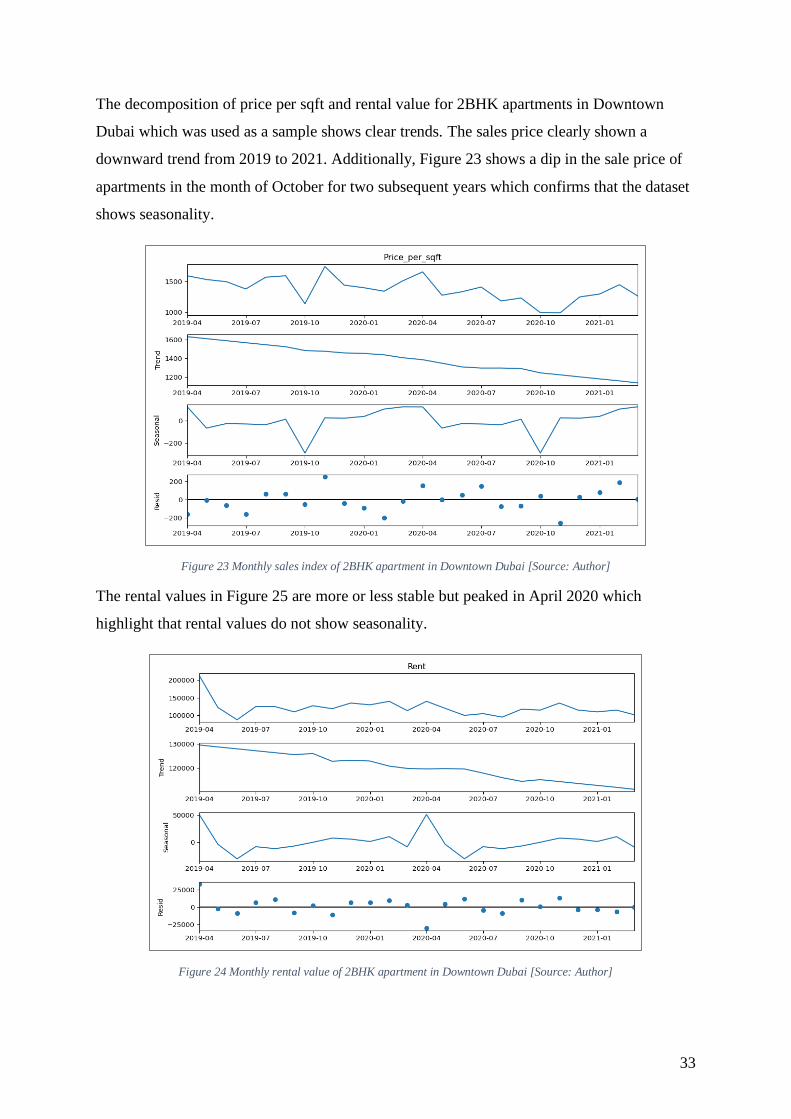
The decomposition of price per sqft and rental value for 2BHK apartments in Downtown
Dubai which was used as a sample shows clear trends. The sales price clearly shown a
downward trend from 2019 to 2021. Additionally, Figure 23 shows a dip in the sale price of
apartments in the month of October for two subsequent years which confirms that the dataset
shows seasonality.
Figure 23 Monthly sales index of 2BHK apartment in Downtown Dubai [Source: Author]
The rental values in Figure 25 are more or less stable but peaked in April 2020 which
highlight that rental values do not show seasonality.
Figure 24 Monthly rental value of 2BHK apartment in Downtown Dubai [Source: Author]
34
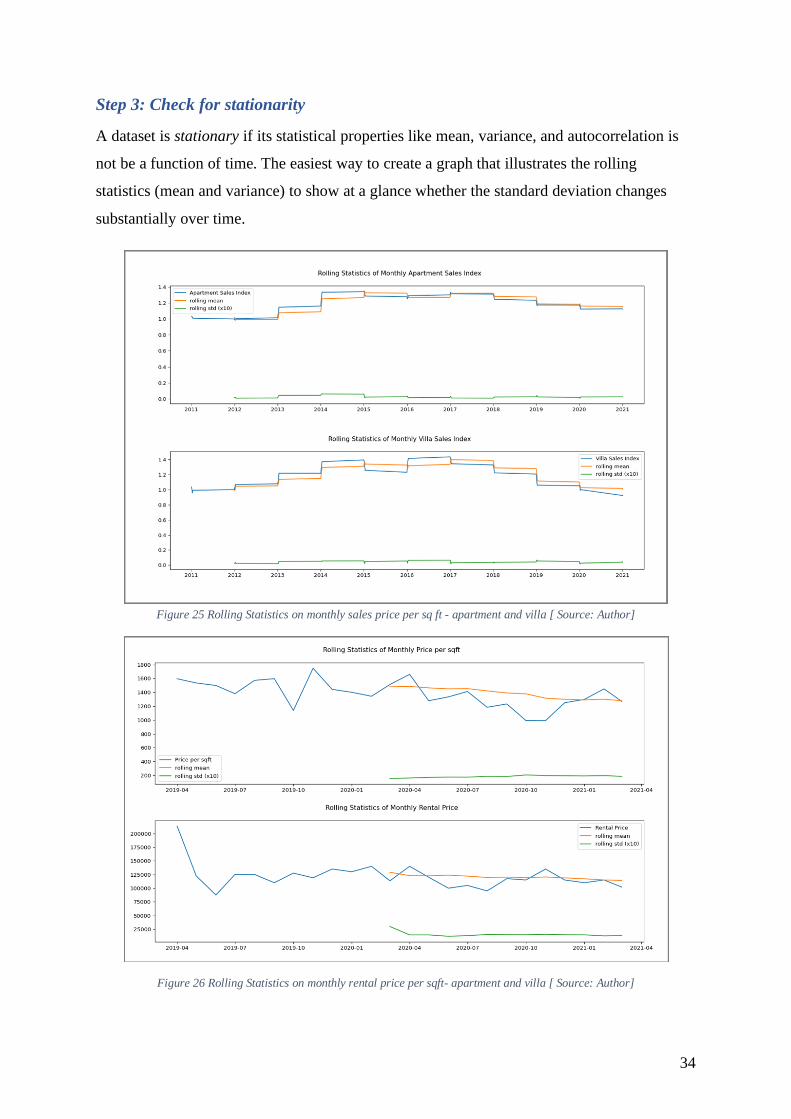
Step 3: Check for stationarity
A dataset is stationary if its statistical properties like mean, variance, and autocorrelation is
not be a function of time. The easiest way to create a graph that illustrates the rolling
statistics (mean and variance) to show at a glance whether the standard deviation changes
substantially over time.
Figure 25 Rolling Statistics on monthly sales price per sq ft - apartment and villa [ Source: Author]
Figure 26 Rolling Statistics on monthly rental price per sqft- apartment and villa [ Source: Author]

35
The graphs in Figure 25 and Figure 26 shows that sales index values are close to rolling mean
and has low rolling standard deviation. Low values of rolling standard deviation indicates
that markets are stable. So low standard deviation readings are normal typically tend to come
before significant upward changes in price.
There are multiple tests that can be used to check stationarity such as ADF (Augmented
Dicky Fuller Test), KPSS, PP (Phillips-Perron test). Here ADF test was used as it is most
commonly used to test stationarity.
To identify the nature of data, null hypothesis was used
#H0: It is non-stationary
#H1: It is stationary
The null hypothesis (H0) is considered when data is not stationary and the alternate
hypothesis (H1) that data is stationary. The results are detailed below.

36
As the results shows that, sales index for both apartment, villa and price per sqft are non-
stationary but the rental price is stationary. Therefore, the next step is to make the non-
stationary dataset stationary.
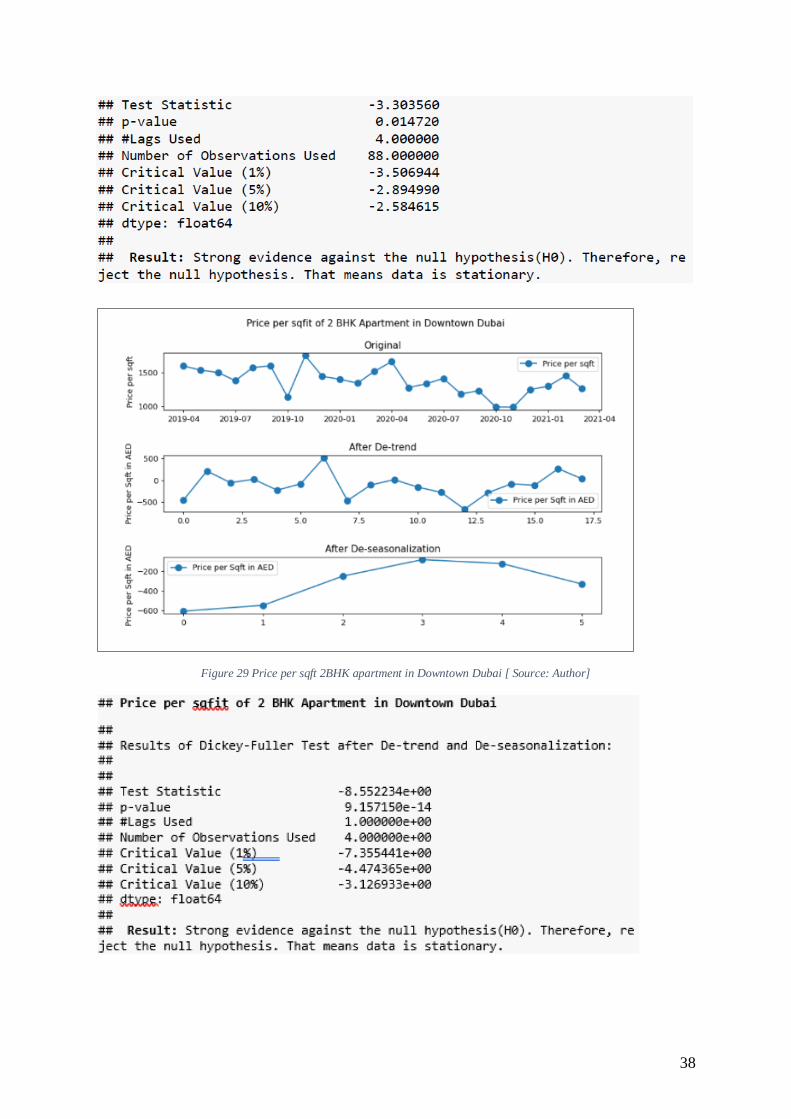
Step 4: Making dataset stationary through Detrending and De-seasonalization
Python ADF test was extended for de-trending and de-seasonalization.
Figure 27 Detrending and differentiation od apartment sales index [Source: Author]

37
Figure 28 Figure 27 Detrending and differentiation od villa sales index [Source: Author]
Orange lines represent villa and blue line represent apartments.
38
Figure 29 Price per sqft 2BHK apartment in Downtown Dubai [ Source: Author]

39
Step 5: Plot the Correlation and Auto Correlation Charts
Next using seasonal first difference technique and autocorrection with a lag of 20, the sales
price was made stationary.
Figure 30 Seasonal First Difference [ Source: Author]
Figure 31 Autocorrection of Sales Price [ Source: Author]

40
Figure 32 Partial and Auto-correction [Source: Author]
Step 6: Construct Time-series models
In machine learning the original dataset is split into two - training data and testing data to fit
the model on the train data, in order to make predictions on the test data. In time series
machine learning analysis, the observations are not independent; hence, cannot split the data
randomly but usually split observations along with the sequences.
In this process, if proper care in not taken in considering the homogeneity of the data, there is
a possibility that the model is overfitted or underfitted. Both of these are not good because
they affect the predictability of the model. To overcome this, K-Fold cross validation method
was used wherein the dataset is split into k subsets, and train on k-1 one of those subsets. The
last subset is then used for testing. This can then be repeated for each of the subsets. We then
average the model against each of the folds and then finalizes the model. Finally, the model
was tested again against the test set.
The monthly sales index of apartment is analyses using five time series analysis models.

41
6.1 Simple Exponential Smoothing (SES)
This model is suitable for time series data that do not show trends or seasonal components.
The visualization result of SES forecast model display the difference between the auto-
optimized α and the specified α=0.9. The value of α has to be between 0 and 1. It is apparent
from the graph that SES will predict a flat forecasted line as it uses weighted averages. The
RMSE for both is 0.9. Generally, time series data demonstrate some kind of trend or
seasonality; hence, this model can provide a baseline for comparison. The forecasted sales
index for apartments is 1.25.
Figure 33 Simple Exponential Smoothing (SES) [Source: Author]
6.2 Holt’s Forecasting Model
Holt’s is a linear exponential smoothing model applied for forecasting data with trend using
two-parameter model. The trend is updated over time through the second equation. The
difference between the last two smoothed values is used to express the trend. In our case, the
RMSE for both Linear and exponential trend is the same.
42
Figure 34 Holt's Forecasting [Source: Author]
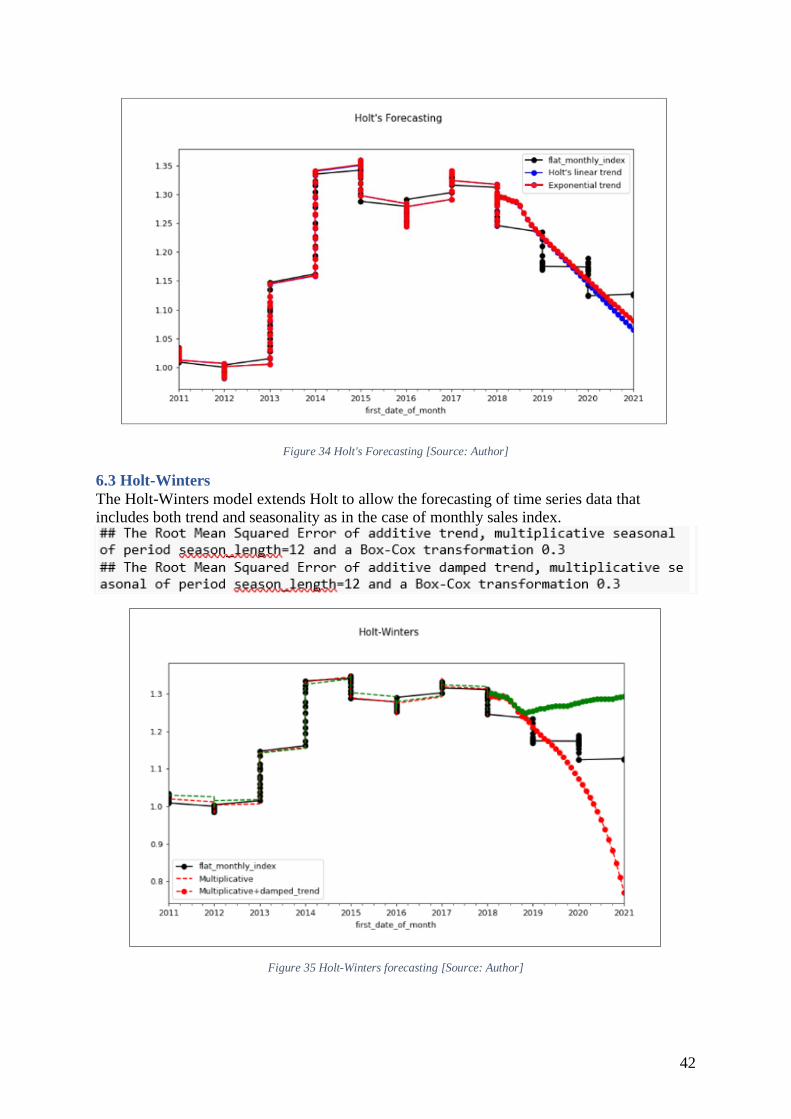
6.3 Holt-Winters
The Holt-Winters model extends Holt to allow the forecasting of time series data that
includes both trend and seasonality as in the case of monthly sales index.
Figure 35 Holt-Winters forecasting [Source: Author]

43
The seasonality is set to 12 months to see the variations over a year. Figure 35 shows that the
Holt-Winters model fits the actual data well though forecast starts to drop off towards the
end. However, the RMSE is not better than the results of SES model.
6.4 ARIMA
As discussed, the exponential smoothing models use weighted averages of past observations
to forecast new values. However, Auto-Regressive Integrated Moving Average (ARIMA)
models look at differences between values in the time series and used autocorrelations or
serial correlations in the data. ARIMA is a widely used statistical model for time series
forecasting. It considers three parameters:
For the monthly sales index of apartment, the p,d,q values of ARIMA is identified to be
(1,1,1) with an AIC value of -607.497. The lower the value of AIC, the better the result.
Figure 36 ARIMA [Source: Author]
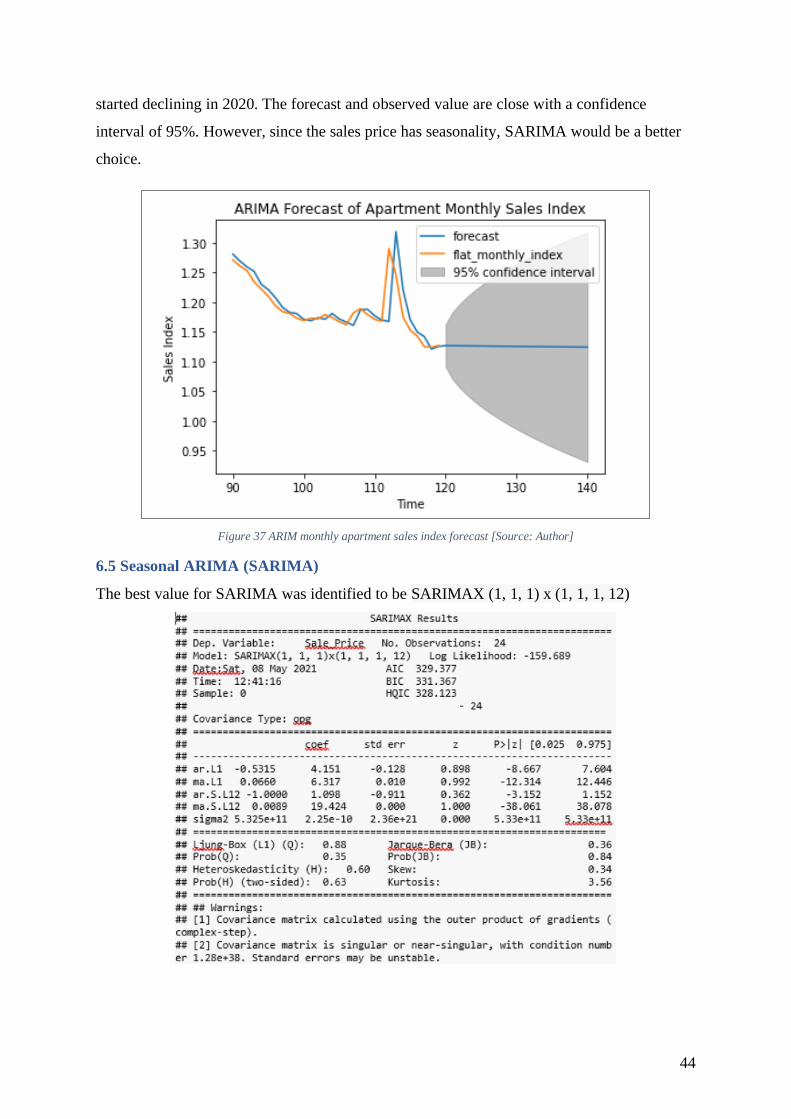
From Figure 37, it is evident that of the 120 observations available for the period Jan 2011 till
March 2021, in early 2019, there was a sharp upward trend in the sales index, which then
44
started declining in 2020. The forecast and observed value are close with a confidence
interval of 95%. However, since the sales price has seasonality, SARIMA would be a better
choice.
Figure 37 ARIM monthly apartment sales index forecast [Source: Author]
6.5 Seasonal ARIMA (SARIMA)
The best value for SARIMA was identified to be SARIMAX (1, 1, 1) x (1, 1, 1, 12)
45
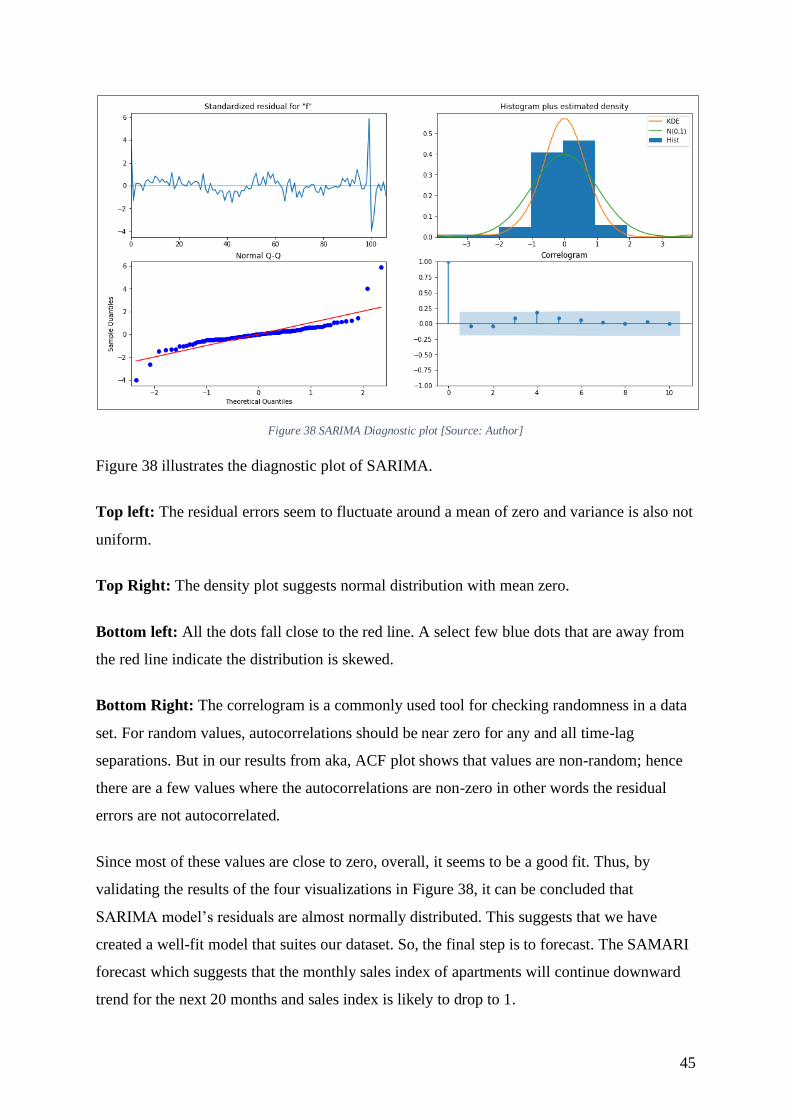
Figure 38 SARIMA Diagnostic plot [Source: Author]
Figure 38 illustrates the diagnostic plot of SARIMA.
Top left: The residual errors seem to fluctuate around a mean of zero and variance is also not
uniform.
Top Right: The density plot suggests normal distribution with mean zero.
Bottom left: All the dots fall close to the red line. A select few blue dots that are away from
the red line indicate the distribution is skewed.
Bottom Right: The correlogram is a commonly used tool for checking randomness in a data
set. For random values, autocorrelations should be near zero for any and all time-lag
separations. But in our results from aka, ACF plot shows that values are non-random; hence
there are a few values where the autocorrelations are non-zero in other words the residual
errors are not autocorrelated.
Since most of these values are close to zero, overall, it seems to be a good fit. Thus, by
validating the results of the four visualizations in Figure 38, it can be concluded that
SARIMA model’s residuals are almost normally distributed. This suggests that we have
created a well-fit model that suites our dataset. So, the final step is to forecast. The SAMARI
forecast which suggests that the monthly sales index of apartments will continue downward
trend for the next 20 months and sales index is likely to drop to 1.
46
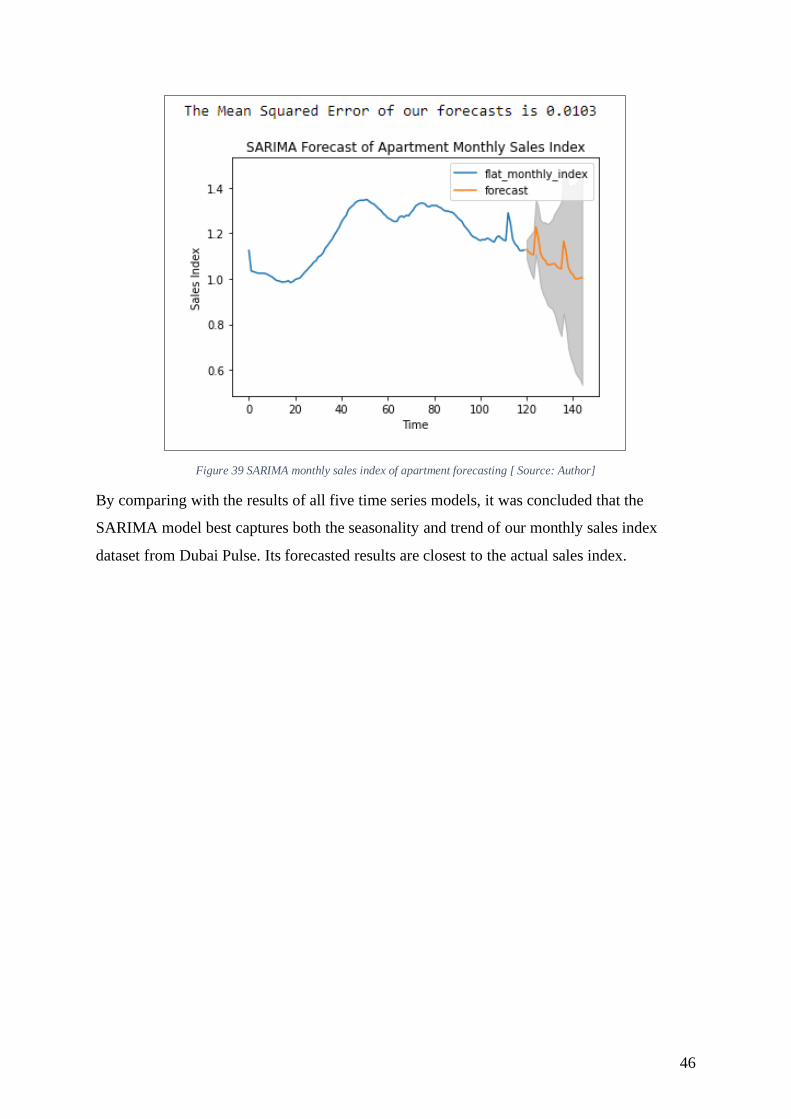
Figure 39 SARIMA monthly sales index of apartment forecasting [ Source: Author]
By comparing with the results of all five time series models, it was concluded that the
SARIMA model best captures both the seasonality and trend of our monthly sales index
dataset from Dubai Pulse. Its forecasted results are closest to the actual sales index.

47
8. Results The objective of the project is to help investors identify suitable portfolio and take informed
decision considering the Dubai Real Estate market trends. For making suitable
recommendations a series of exploratory, predictive and time series analysis were conducted
using both python and r programing and data modeling techniques. Though RStudio was
predominantly used for visualization and data modeling, there were instances when certain
features didn’t work. One of the most prominent instances was in the case of Pandas Profiling
where in an alternate IDC, Jupiter Notebook, was used for conducting exploratory studies on
the datasets.
According to the exploratory data analysis, residential sales index dataset obtained from
Dubai Pulse was comprehensive; however, the transaction dataset available had incomplete
data. It was identified that rent value and rent price per sq meter which are crucial
information for this project had 96.1% missing values. Besides, Unit and Building dataset
retrieved from Dubai Pulse did not prove to be useful for the study and had to be dropped.
This impacted the smooth flow of the project and an alternate dataset that included both the
sales and rental values had to be obtained from Property finder and Kaggle. Since Dubai
Pulse is a Smart Dubai government portal, firstly, it would be great if the government would
ensure in improving the quality of the open dataset that could stimulate more research in this
field to analyze and forecast real estate trends in Dubai. Secondly, the names of the regions if
mapped to the common names will help common people understand more easily.
The analysis shows that the top ten Dubai freehold areas chosen by investors are Downtown
Dubai, Dubai Marina, Jumeirah Village circle, Palm Jumeirah, Jumeirah Beach Residence,
Business Bay, Greens, Meydan and Cultural Village. While Downtown Dubai sees a higher
sale in two-bedroom apartments, on the contrary, Jumeriah Village Circle has a higher sale in
one-bedroom apartments. However, in general people invest mostly on one-bedroom and
two-bedroom properties compared to studio or three and more bedroom properties. It was
also observed that average price of property is highest in the Al Barsha South Fifth for
apartments and in Al Barsha South Fourth for Villas.
Predictive Analysis data analytical models were used to predict the sale price of the property
based on three variables – size of the property in sqft, number of bedrooms (studio, one, two,
three, four, five and six) and quality of construction (low, medium and high). Gradient

48
Boosting Regression models produced the best RMSE result compared to other models in
terms of prediction accuracy. The RMSE Price is lowest for Gradient Boosting Regression
Model with a value of AED 226,428.56. The predicted sale price for the selected option was
comparatively less when compared to Linear Regression. However, this was ignored as the
RMSE price of Linear Regression was higher. The Random Forest Regression RMSE price
was better than Decision Tree model as unlike Decision Tree Model, Random Forest
Regression Model leverages the power of multiple decision trees for making decisions. The
Linear Regression though simple, demonstrated high RSME price value and hence not
considered. Of all of the five Predictive Analysis models, as literature suggests, Gradient
Boost Regression Model produced good result. The predictive analysis helped in determining
the price more precisely.
This project also utilized the potential of Time Series analysis for forecasting the trend of
apartment and villa sales and assessing the future market cycle. Both sales index and sales
price showed seasonality whereas rental values were stationary. The Simple Exponential
Smoothing (SES) model produced the smallest RMSE error (0.09) compared to Holt Winter
(0.30). However, since sales index dataset includes trends and seasonality which is not
considered by SES, it was not considered reliable. In many business cases where longer-term
forecasting with more nuanced visualizations is needed, the SARIMA model is preferred.
ARIMA and SARIMA models were used to forecast out of sample predictions. As ARIMA
does not take into account seasonality, the forecasted sales price is a constant value and does
not vary with time. However, SARIMA produced a well-fitted model with least RMSE error
value of 0.0103 compared to other four models. Additionally, the visualization of SARIMA
illustrates that the sales index for apartments is in the downward trend for the next 20 months.
The results helped to extend the results from previous study on market cycle. Thus, it was
concluded based on the outcomes of SAMIRA that the end of the second market cycle of the
Dubai Real Estate will last till 2022. The third market cycle is likely to start after that.

49
9. Conclusions and Future Work
As we have identified during literature review that the Dubai Real Estate Market had gone
through two market cycles, first between 2006-2011 and the second from 2013 – 2018.
However, this study confirms that the second market cycle got extended and the time series
forecast suggest that it will continue in the recession phase until first quarter of 2022. The
most significant factor for this extension of market cycle is the outbreak of COVID-19.
Hence, it is a good time for investment as investors can get a good return on investment if
they sell their property during the expansion phase of the third market cycle that would start
in 2022.
The current study provides a good insight on the Dubai Real Estate Market trends. For this
study, four different datasets were considered to cover the wider aspect of real estate scenario
in Dubai. However, I would like to extend the current study by focusing on the comparison of
the apartment, villa, office space in different localities in Dubai to draw more specific details
for each locality. Additionally, I would like to explore if a hybrid model of ARIMA (Auto
Regressive Integrated Moving Average as linear model) and LSTM (Long Short-Term
Memory as nonlinear model) can provide a better result for time series analysis as suggested
in the literature. By improving the rigor in the statistical results, the current study would be
good for publication.

50
10. Bibliography Botchkarev, A. (2018). Performance Metrics (Error Measures) in Machine Learning
Regression, Forecasting and Prognostics: Properties and Typology.
Brett, D. L., & Schmitz, A. (2009). Real Estate Market Analysis - Methods and Case Studies (Second).
Brumer, L. (2019). Understanding Real Estate Cycles To Find Profitable Investments. Millionacres. https://www.fool.com/millionacres/real-estate-market/articles/understanding-real-estate-cycles-find-profitable-investments-any-market/
Dubai Land Department. (2013). Dubai Real Estate Legislation.
Dubai Land Department, & Property Finder. (2020). MO’ASHER: The Official Sales Price Index for the Emirate of Dubai.
Dubaipulse. (2021). Datalist - Transactions. https://www.dubaipulse.gov.ae/organisation/dld/service/dld-transactions
Gabriel Morgan Asaftei, S. D., Means, J., & Sanghvi, A. (2018). Getting ahead of the market: How big data is transforming real estate.
HOLT’S Forecasting Model. (2006). In Encyclopedia of Production and Manufacturing Management (pp. 274–274). Springer US. https://doi.org/10.1007/1-4020-0612-8_409
Hromada, E. (2016). Real estate valuation using data mining software. Procedia Engineering- ScienceDirect, 164, 284–291.
Hyndman, R. J., & Athanasopoulos, G. (2018). Forecasting: Principles and Practice (2nd ed). https://otexts.com/fpp2/
James, G., Witten, D., Hastie, T., & Tibshirani, R. (2015). An Introduction to Statistical Learning with Applications in R. Springer.
Kulesza, S., & Belej, M. (2015). Descriptive analysis of nonstationarity of the time series on real estate market. ProQuest. https://www-proquest-com.ezproxy.rit.edu/docview/2363754443?pq-origsite=summon
Li, M., Bao, Z., Sellis, T., & Yan, S. (2016). Visualization-Aided Exploration of the Real Estate Data. Databases Theory and Applications, 435–439. https://doi.org/10.1007/978-3-319-46922-5_34
MONTGOMERY, D. C., JENNINGS, C. L., & KULAHCI, M. (2008). Introduction to Time Series Analysis and Forecasting. Wiley.
Moro, M. F., Weise, A. D., & Bornia, A. C. (2020). Model hybrid for sales forecast for the housing market of São Paulo. Real Estate Management and Valuation, 28(3), 45–64. https://doi.org/10.1515/remav-2020-0023
Pérez-Rave, J. I., Correa-Morales, J. C., & González-Echavarría, F. (2019). A machine learning approach to big data regression analysis of real estate prices for inferential and predictive purposes. Journal of Property Research, 36(1), 59–96. https://doi.org/10.1080/09599916.2019.1587489
Rab, J. (2018). Automating Real Estate Investment Analysis: Python Web Scraping Bot. Towards Data Science. https://towardsdatascience.com/automating-real-estate-investment-analysis-d2b07395833b

51
Sopranzetti, B. J. (2015). Hedonic regression models. In Handbook of Financial Econometrics and Statistics (pp. 2119–2134). Springer New York. https://doi.org/10.1007/978-1-4614-7750-1_78
Soy Temür, A., Akgün, M., & Temür, G. (2019). Predicting housing sales in turkey using arima, lstm and hybrid models. Journal of Business Economics and Management, 20(5), 920–938. https://doi.org/10.3846/jbem.2019.10190
Wirth, R., & Hipp, J. (2000). CRISP-DM: Towards a Standard Process Model for Data Mining. Proceedings of the 4th International Conference on the Practical Applications of Knowledge Discovery and Data Mining.
52
11. Appendix
Figure 1 Dubai Average Residential Process and Performance [Source: Arabian Business] . 12
Figure 2 Overview of Transaction Dataset [Source: Author] ............................................... 18
Figure 3 Data Quality of Transaction Dataset [Source: Author] ........................................... 19
Figure 4 Correlation diagram of Transaction dataset [Source: Author] ................................ 20
Figure 5 Overview of Sales Rental Price Dataset [Source: Author] ...................................... 20
Figure 6 Data summary of Sales and Rental Price Dataset [ Source: Author] ....................... 21
Figure 7 Overview of Residential Sales Index Dataset [ Source: Author] ............................. 22
Figure 8 Data Quality of Residential Sales Index [Source: Author]...................................... 22
Figure 9 Correlation Diagram of Residential Dataset [Source: Author] ................................ 23
Figure 10 Overview of Freehold Property Dataset [Source: Author] .................................... 23
Figure 11 Correlation Diagram of Freehold Property Dataset [ Source: Author] .................. 24
Figure 12 Data Summary of Freehold Property [Source: Author] ........................................ 24
Figure 13 Yearly Property Sales [Source: Author] ............................................................... 25
Figure 14 Average Property Price per Area [Source: Author] .............................................. 26
Figure 15 Dubai Freehold Property Sales based on number of bedrooms [Source: Author] .. 26
Figure 16 Average Price per Sqft and Number of Bedrooms [Source: Author] .................... 27
Figure 17 Webpage of Investment Choices [ Source: Author] ............................................. 28
Figure 18 Webpage of Predictive Analysis Results [ Source: Author] ................................. 29
Figure 19 Dubai Property Sales Index [Source: Author] ...................................................... 31
Figure 20 Downtown Dubai BHK Apartments [Source: Author] ......................................... 31
Figure 21 Monthly sales index of apartment [Source: Author] ............................................ 32
Figure 22 Monthly sales index of Villa [Source: Author]..................................................... 32
Figure 23 Monthly sales index of 2BHK apartment in Downtown Dubai [Source: Author] . 33
Figure 24 Monthly rental value of 2BHK apartment in Downtown Dubai [Source: Author] 33
Figure 25 Rolling Statistics on monthly sales price per sq ft - apartment and villa [ Source:
Author] ............................................................................................................................... 34
Figure 26 Rolling Statistics on monthly rental price per sqft- apartment and villa [ Source:
Author] ............................................................................................................................... 34
Figure 27 Detrending and differentiation od apartment sales index [Source: Author] ........... 36
Figure 28 Figure 27 Detrending and differentiation od villa sales index [Source: Author] ... 37
Figure 29 Price per sqft 2BHK apartment in Downtown Dubai [ Source: Author] ............... 38
Figure 30 Seasonal First Difference [ Source: Author]......................................................... 39
Figure 31 Autocorrection of Sales Price [ Source: Author] .................................................. 39
Figure 32 Partial and Auto-correction [Source: Author] ...................................................... 40
Figure 33 Simple Exponential Smoothing (SES) [Source: Author] ...................................... 41
Figure 34 Holt's Forecasting [Source: Author] ..................................................................... 42
Figure 35 Holt-Winters forecasting [Source: Author] .......................................................... 42
Figure 36 ARIMA [Source: Author] .................................................................................... 43
Figure 37 ARIM monthly apartment sales index forecast [Source: Author] ......................... 44
Figure 38 SARIMA Diagnostic plot [Source: Author] ......................................................... 45
Figure 39 SARIMA monthly sales index of apartment forecasting [ Source: Author] .......... 46