dubai real estate market overview - q3...
TRANSCRIPT
Dubai Real Estate Market Overview
Q3 2013
Dubai

Macroeconomic overview
2
Indicator 2011 2012 2013 (f)
United Arab Emirates
Population (millions) 8.9 9.2 9.3
Real GDP Growth (Y-o-Y) 3.9% 4.4% 3.7%
Consumer Price Index (% change) 0.9% 0.7% 1.5%
Real Estate Mortgage Loans (millions AED) 161,500 159,800 n/a
Dubai
Population (millions) 2.0 2.1 2.2
Real GDP Growth (Y-o-Y) 3.7% 4.4% 4.1%
Inflation (% Change) 0.5% -1.7% n/a
Sources: IHS Global Insights (August 2013); UAE Central Bank; Dubai Statistics Center 2013
e: estimated f:forecasted

Market highlights – Q3 2013
• The Dubai economy is expected to maintain its strong growth rate and expand at more than 4% in 2013. The strong economic performance remains supported by the growth of sectors such as hospitality, trade, transportation and logistics, in addition to the recovery of the construction and real estate segments.
• The business outlook remains optimistic with the Department of Economic Development‟s Business Confidence Index (BCI), reaching 120.7 points in the second quarter of 2013, an increase of 14.6 points over the same period in 2012. According to the survey, more than 83% of firms expect either stability or increased sales volumes while an increasing number of companies are planning to invest in expansion, recruitment and technology upgrades.
• The only significant commercial transaction in Q3 was an office building in TECOM. There remains however an active residential investment market across Dubai. We have also noted growing interest from Kuwaiti investment firms in all asset classes of the Dubai real estate market.
• The office leasing market witnessed slower activity in Q3 due to the summer period and the month of Ramadan. While demand continues to improve in the prime locations and some new areas, the high level of supply remains the main obstacle to a healthy broad-based recovery.
• The residential market continues to experience a broad-based recovery,
with prices and rental values picking up in the secondary and more
affordable locations, while the primary areas are now seeing slower paces
of growth.
• Activity in the retail market was quiet in Q3 due to the summer period.
However, as demand remains strong and retailers are upbeat, the sector is
expected to end the year on a strong note in both its primary and
secondary segments.
• The hotel sector has continued its strong performance, on the back of the
booming tourism and aviation industries. Year-to-date (YTD) occupancy
rates have risen to 79% while YTD Average Daily Rates (ADRs) are also
higher at USD 235. A number of hotels are due to open in the short run but
the sector is expected to maintain its positive performance
• The industrial market continues to perform well overall. Demand has
started to shift to the newer areas in the south of Dubai, which are
witnessing strong growth and are benefiting from well developed
infrastructure, good connectivity, proximity to major infrastructure projects,
as well as better quality products.
3
All sectors of the Dubai real estate market maintained their positive performance during the seasonally quieter
summer months. The retail, hotel and industrial segments continue to experience solid growth. The recovery of
the office sector remains more selective and concentrated in the prime segment with the large level of supply
and high overall vacancy rates depressing rental pressure elsewhere. The broad based recovery in the
residential sector is seeing prices and rents increase across most areas, but there are signs that the rate of
increase is slowing in some high end locations.
Talking points – Q3 2013
4
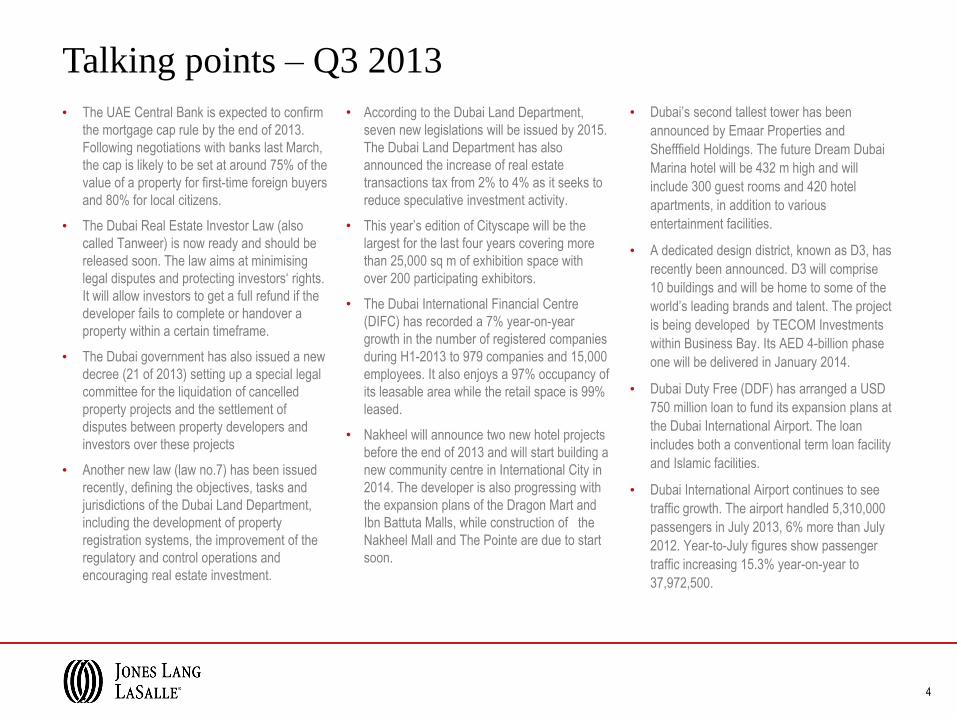
• The UAE Central Bank is expected to confirm
the mortgage cap rule by the end of 2013.
Following negotiations with banks last March,
the cap is likely to be set at around 75% of the
value of a property for first-time foreign buyers
and 80% for local citizens.
• The Dubai Real Estate Investor Law (also
called Tanweer) is now ready and should be
released soon. The law aims at minimising
legal disputes and protecting investors„ rights.
It will allow investors to get a full refund if the
developer fails to complete or handover a
property within a certain timeframe.
• The Dubai government has also issued a new
decree (21 of 2013) setting up a special legal
committee for the liquidation of cancelled
property projects and the settlement of
disputes between property developers and
investors over these projects
• Another new law (law no.7) has been issued
recently, defining the objectives, tasks and
jurisdictions of the Dubai Land Department,
including the development of property
registration systems, the improvement of the
regulatory and control operations and
encouraging real estate investment.
• Dubai‟s second tallest tower has been
announced by Emaar Properties and
Shefffield Holdings. The future Dream Dubai
Marina hotel will be 432 m high and will
include 300 guest rooms and 420 hotel
apartments, in addition to various
entertainment facilities.
• A dedicated design district, known as D3, has
recently been announced. D3 will comprise
10 buildings and will be home to some of the
world‟s leading brands and talent. The project
is being developed by TECOM Investments
within Business Bay. Its AED 4-billion phase
one will be delivered in January 2014.
• Dubai Duty Free (DDF) has arranged a USD
750 million loan to fund its expansion plans at
the Dubai International Airport. The loan
includes both a conventional term loan facility
and Islamic facilities.
• Dubai International Airport continues to see
traffic growth. The airport handled 5,310,000
passengers in July 2013, 6% more than July
2012. Year-to-July figures show passenger
traffic increasing 15.3% year-on-year to
37,972,500.
• According to the Dubai Land Department,
seven new legislations will be issued by 2015.
The Dubai Land Department has also
announced the increase of real estate
transactions tax from 2% to 4% as it seeks to
reduce speculative investment activity.
• This year‟s edition of Cityscape will be the
largest for the last four years covering more
than 25,000 sq m of exhibition space with
over 200 participating exhibitors.
• The Dubai International Financial Centre
(DIFC) has recorded a 7% year-on-year
growth in the number of registered companies
during H1-2013 to 979 companies and 15,000
employees. It also enjoys a 97% occupancy of
its leasable area while the retail space is 99%
leased.
• Nakheel will announce two new hotel projects
before the end of 2013 and will start building a
new community centre in International City in
2014. The developer is also progressing with
the expansion plans of the Dragon Mart and
Ibn Battuta Malls, while construction of the
Nakheel Mall and The Pointe are due to start
soon.
5
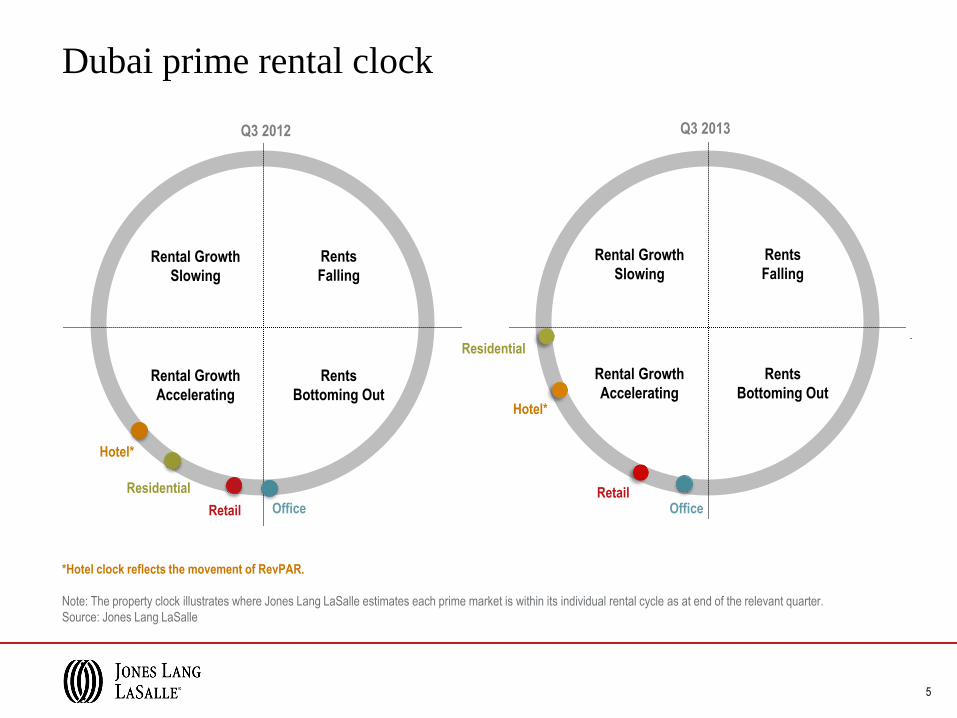
Dubai prime rental clock
*Hotel clock reflects the movement of RevPAR.
Note: The property clock illustrates where Jones Lang LaSalle estimates each prime market is within its individual rental cycle as at end of the relevant quarter.
Source: Jones Lang LaSalle
Q3 2012 Q3 2013
Rental Growth
Slowing
Rents
Falling
Rental Growth
Accelerating
Rents
Bottoming Out
Office Retail
Hotel*
Residential
Rental Growth
Slowing
Rents
Falling
Rental Growth
Accelerating
Rents
Bottoming Out
Office Retail
Hotel*
Residential

Dubai office market overview

Office supply
• The total office stock within areas monitored by JLL is estimated at 7.2
million sq m at the end of Q3 2013. Around 45,000 sq m of office space
entered the market in the last quarter, with the major completions being
“48 Burj Gate” on Sheikh Zayed Road and the API Trio Tower in Al
Barsha.
• According to developers, around 245,000 sq m will be delivered in the
last quarter of the year. However, much of the announced new supply
might be postponed to 2014 and beyond.
• As of Q3 2013, the CBD (ie DIFC, Burj Downtown and SZR) represents
less than 20% of the existing stock while areas such as Business Bay
(14%) and JLT (13.5%) are accounting for larger proportions of the
current office space.
Source: Jones Lang LaSalle, Q3 2013
• Around 1.2 million sq m of office space is expected to enter the market
by 2016, reflecting the strong supply pipeline. However, as the delivery
of this extra space may further exacerbate the current supply-demand
imbalance, some of the proposed projects might be delayed.
• Business Bay accounts for the majority of the future supply. The area is
expected to see an additional 713,000 sq m of office space by 2016
(equivalent to 58% of the total upcoming supply) including towers such
as The Burlington, Bay View, Bay Gate and Tamani Art offices. Other
locations that will see new office supply are JLT (10%), Dubai World
Central (7%), Dubai Investment Park (6%), the Greens (5%) and DTCD
(4%).
7
Breakdown of Expected Completions (2013-2016)
by Sub Market
Source: Jones Lang LaSalle, Q3 2013
Dubai Office Stock (2011 – 2016)
6.3 6.9 7.2 7.5 8.1 8.4
0.2 0.6
0.3 0.1
0
1
2
3
4
5
6
7
8
9
2011 2012 2013 2014 2015 2016
Tot
al S
tock
(m
illio
n sq
m)
Completed Stock Future Supply
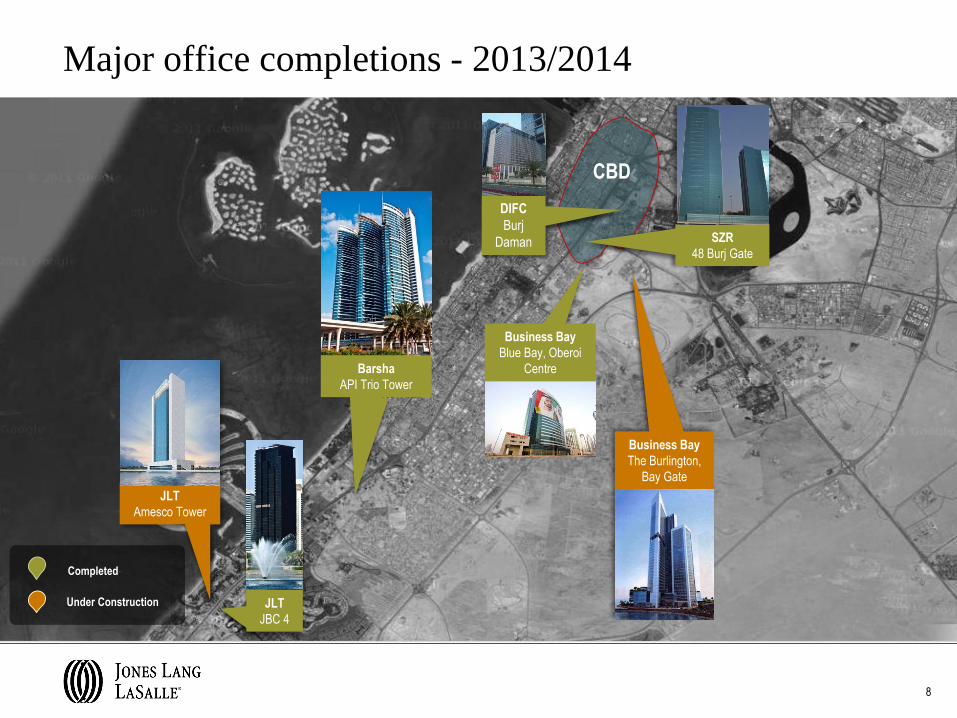
CBD
8
Business Bay
The Burlington,
Bay Gate
DIFC
Burj
Daman
JLT
JBC 4
Major office completions - 2013/2014
Under Construction
Completed
JLT
Amesco Tower
Barsha
API Trio Tower
SZR
48 Burj Gate
Business Bay
Blue Bay, Oberoi
Centre

Office demand • The improvement in the Dubai
economy has resulted in an increased
demand for office space. However, the
recovery in demand remains counter -
balanced by the high level of supply
entering the market.
• Demand remains focused on high
quality space in prime locations such
as SZR, Downtown and TECOM A & B
• “Flight to quality” continues to be
noticeable with further relocations
taking place from the older and
secondary areas towards the prime
and newer locations.
• The market continues to suffer from a
shortage of large units of high quality
office space suitable for global
occupiers
• “Built-to-suit” options are therefore still
being considered, especially by large
occupiers in search of 5,000 sq m of
office space or more.
• Large companies are also becoming
increasingly sensitive to sustainability
issues and there has been an
increasing demand for LEED certified
buildings with some corporates
mandating this for all future office
space.
• Other factors influencing occupiers‟
choice include:
- Congestion and traffic
- Availability of parking space
- Proximity to a metro station
• Single ownership buildings continue to
account for the majority of the existing
supply and most of the current
demand; while strata projects remain
less popular, especially amongst large
global companies. Despite being
growing commercial locations, many
buildings in Business Bay and JLT will
not appeal to some occupiers due to
their strata status.
• Landlords are becoming more bullish in
the most prime locations, being less
flexible on rents and reducing rent-free
periods. Landlords in secondary
locations remain flexible in order to
attract tenants and to fill their buildings.
• Vacancy rates within the CBD
remained high at around 30% as the
take up remains counterbalanced by
the new supply entering the market.
Source: Jones Lang LaSalle, Q3 2013
9
Examples of recent deals
Industry Area Acquired
Location Comment
(sq m)
Banking 10,000 Bur Dubai Renewal
Oil & Gas 6,000 DIFC Acquisition
Hotelier 3,000 Dubai Renewal
IT 1,200 Downtown Acquisition
Digital Imaging 500 Barsha Acquisition
IT 300 Media City Acquisition
Finance 200 DIFC Acquisition
Rental performance
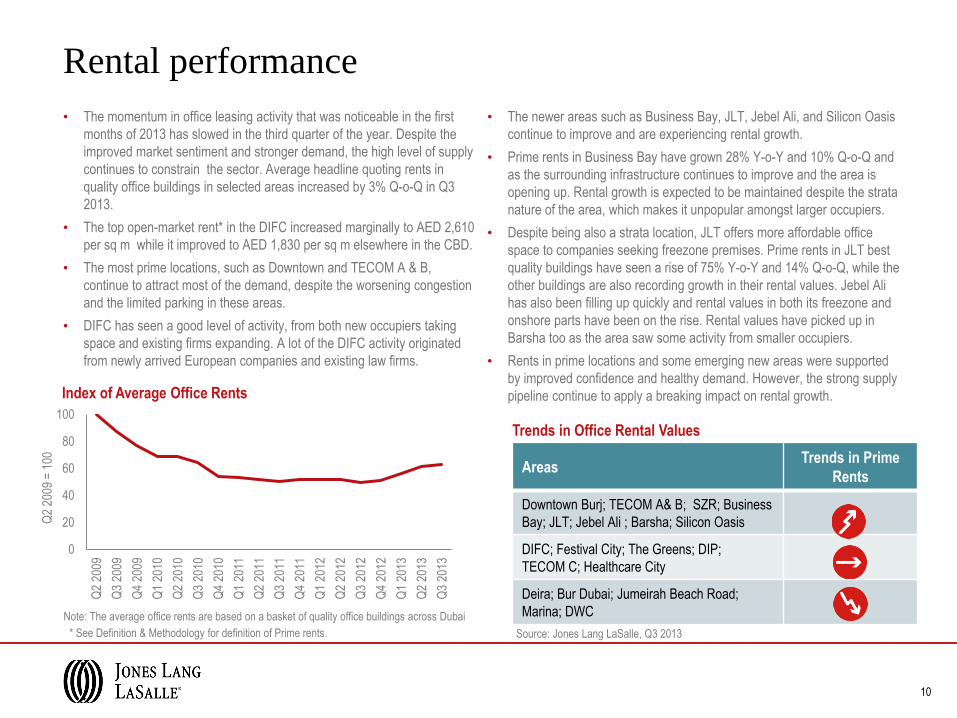
• The momentum in office leasing activity that was noticeable in the first
months of 2013 has slowed in the third quarter of the year. Despite the
improved market sentiment and stronger demand, the high level of supply
continues to constrain the sector. Average headline quoting rents in
quality office buildings in selected areas increased by 3% Q-o-Q in Q3
2013.
• The top open-market rent* in the DIFC increased marginally to AED 2,610
per sq m while it improved to AED 1,830 per sq m elsewhere in the CBD.
• The most prime locations, such as Downtown and TECOM A & B,
continue to attract most of the demand, despite the worsening congestion
and the limited parking in these areas.
• DIFC has seen a good level of activity, from both new occupiers taking
space and existing firms expanding. A lot of the DIFC activity originated
from newly arrived European companies and existing law firms.
• The newer areas such as Business Bay, JLT, Jebel Ali, and Silicon Oasis
continue to improve and are experiencing rental growth.
• Prime rents in Business Bay have grown 28% Y-o-Y and 10% Q-o-Q and
as the surrounding infrastructure continues to improve and the area is
opening up. Rental growth is expected to be maintained despite the strata
nature of the area, which makes it unpopular amongst larger occupiers.
• Despite being also a strata location, JLT offers more affordable office
space to companies seeking freezone premises. Prime rents in JLT best
quality buildings have seen a rise of 75% Y-o-Y and 14% Q-o-Q, while the
other buildings are also recording growth in their rental values. Jebel Ali
has also been filling up quickly and rental values in both its freezone and
onshore parts have been on the rise. Rental values have picked up in
Barsha too as the area saw some activity from smaller occupiers.
• Rents in prime locations and some emerging new areas were supported
by improved confidence and healthy demand. However, the strong supply
pipeline continue to apply a breaking impact on rental growth.
* See Definition & Methodology for definition of Prime rents. Source: Jones Lang LaSalle, Q3 2013
10
Note: The average office rents are based on a basket of quality office buildings across Dubai
Index of Average Office Rents
Trends in Office Rental Values
Areas Trends in Prime
Rents
Downtown Burj; TECOM A& B; SZR; Business
Bay; JLT; Jebel Ali ; Barsha; Silicon Oasis
DIFC; Festival City; The Greens; DIP;
TECOM C; Healthcare City
Deira; Bur Dubai; Jumeirah Beach Road;
Marina; DWC
0
20
40
60
80
100
Q2
2009
Q3
2009
Q4
2009
Q1
2010
Q2
2010
Q3
2010
Q4
2010
Q1
2011
Q2
2011
Q3
2011
Q4
2011
Q1
2012
Q2
2012
Q3
2012
Q4
2012
Q1
2013
Q2
2013
Q3
2013
Q2
2009
= 1
00
Indicator Level Comment / Outlook
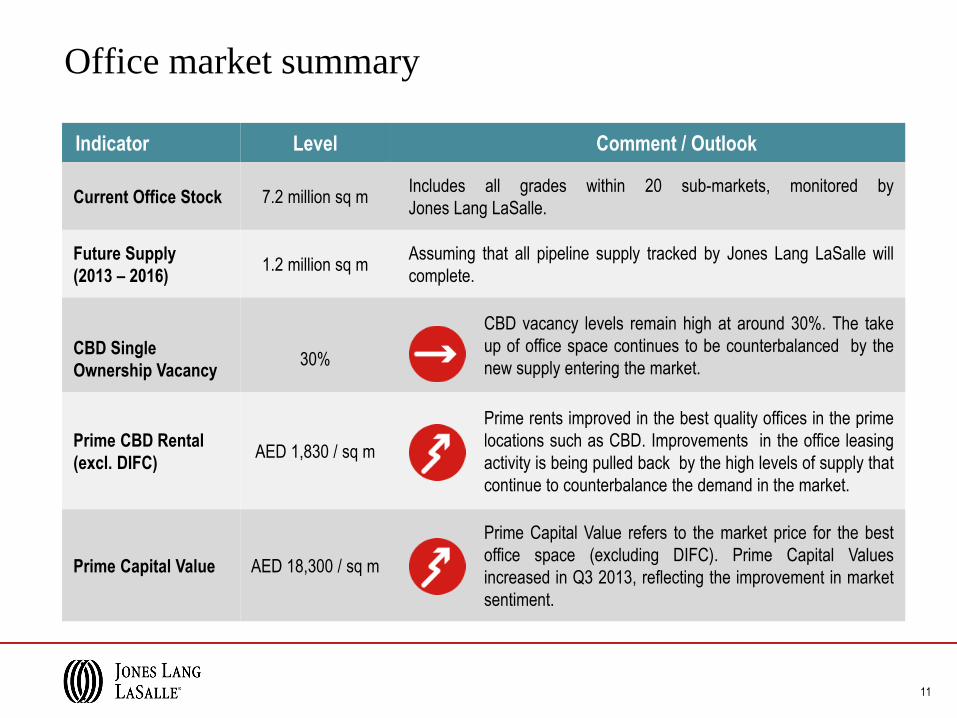
Current Office Stock 7.2 million sq m Includes all grades within 20 sub-markets, monitored by
Jones Lang LaSalle.
Future Supply
(2013 – 2016) 1.2 million sq m
Assuming that all pipeline supply tracked by Jones Lang LaSalle will
complete.
CBD Single
Ownership Vacancy
30%
CBD vacancy levels remain high at around 30%. The take
up of office space continues to be counterbalanced by the
new supply entering the market.
Prime CBD Rental
(excl. DIFC) AED 1,830 / sq m
Prime rents improved in the best quality offices in the prime
locations such as CBD. Improvements in the office leasing
activity is being pulled back by the high levels of supply that
continue to counterbalance the demand in the market.
Prime Capital Value AED 18,300 / sq m
Prime Capital Value refers to the market price for the best
office space (excluding DIFC). Prime Capital Values
increased in Q3 2013, reflecting the improvement in market
sentiment.
Office market summary
11
Dubai residential market overview
341 355 364 373 394
9 21 15
0
100
200
300
400
500
2011 2012 2013 2014 2015
Completed Stock Future Supply
Residential supply
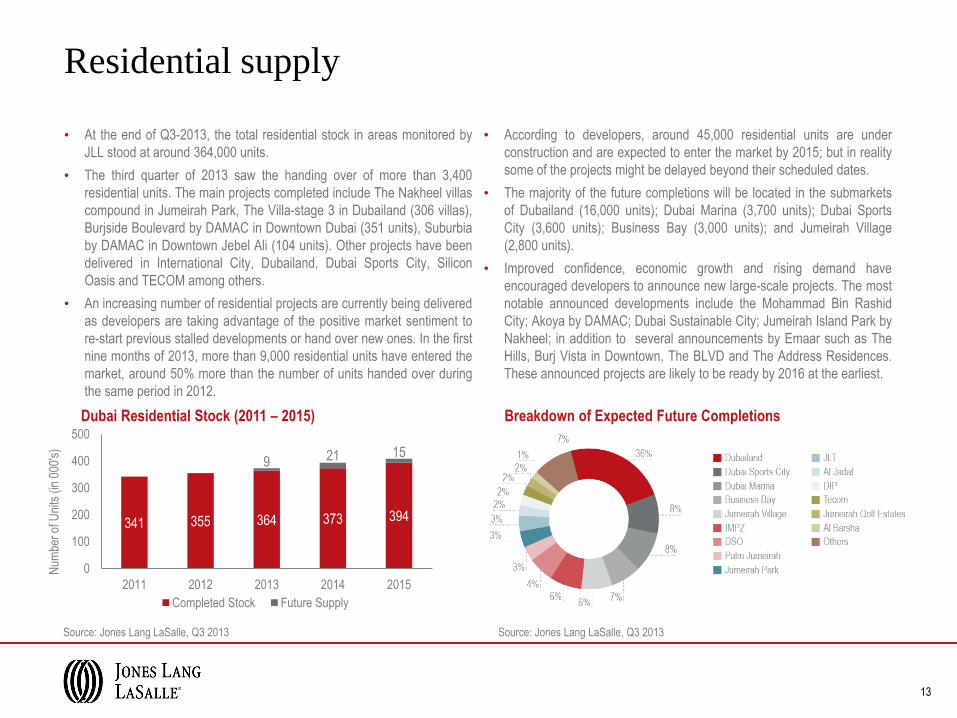
• At the end of Q3-2013, the total residential stock in areas monitored by
JLL stood at around 364,000 units.
• The third quarter of 2013 saw the handing over of more than 3,400
residential units. The main projects completed include The Nakheel villas
compound in Jumeirah Park, The Villa-stage 3 in Dubailand (306 villas),
Burjside Boulevard by DAMAC in Downtown Dubai (351 units), Suburbia
by DAMAC in Downtown Jebel Ali (104 units). Other projects have been
delivered in International City, Dubailand, Dubai Sports City, Silicon
Oasis and TECOM among others.
• An increasing number of residential projects are currently being delivered
as developers are taking advantage of the positive market sentiment to
re-start previous stalled developments or hand over new ones. In the first
nine months of 2013, more than 9,000 residential units have entered the
market, around 50% more than the number of units handed over during
the same period in 2012.
• According to developers, around 45,000 residential units are under
construction and are expected to enter the market by 2015; but in reality
some of the projects might be delayed beyond their scheduled dates.
• The majority of the future completions will be located in the submarkets
of Dubailand (16,000 units); Dubai Marina (3,700 units); Dubai Sports
City (3,600 units); Business Bay (3,000 units); and Jumeirah Village
(2,800 units).
• Improved confidence, economic growth and rising demand have
encouraged developers to announce new large-scale projects. The most
notable announced developments include the Mohammad Bin Rashid
City; Akoya by DAMAC; Dubai Sustainable City; Jumeirah Island Park by
Nakheel; in addition to several announcements by Emaar such as The
Hills, Burj Vista in Downtown, The BLVD and The Address Residences.
These announced projects are likely to be ready by 2016 at the earliest.
Source: Jones Lang LaSalle, Q3 2013 Source: Jones Lang LaSalle, Q3 2013
13
Breakdown of Expected Future Completions Dubai Residential Stock (2011 – 2015)
Num
ber
of U
nits
(in
000
's)

14
Silicon Oasis
Silicon Gate 1,
City Oasis
Major residential completions - 2013/2014
Under Construction
Completed
Dubailand
Platinum 1 & 2
Downtown Dubai
Burjside Boulevard
Jumeirah Village
Knightsbridge Courts
Jumeirah Park
Villas
Dubai Sports City
Elite 6, Mediterranean
Building
0
20
40
60
80
100
120
Feb
200
9
Apr
200
9
Jun
2009
Aug
200
9
Oct
200
9
Dec
200
9
Feb
201
0
Apr
201
0
Jun
2010
Aug
201
0
Oct
201
0
Dec
201
0
Feb
201
1
Apr
201
1
Jun
2011
Aug
201
1
Oct
201
1
Dec
201
1
Feb
201
2
Apr
201
2
Jun
2012
Aug
201
2
Oct
201
2
Dec
201
2
Feb
201
3
Apr
201
3
Jun
2013
Aug
201
3
Residential General Residential Apartment Residential Villa
0
100
200
300
400
500
600
Feb
200
8
Apr
200
8
Jun
2008
Aug
200
8
Oct
200
8
Dec
200
8
Feb
200
9
Apr
200
9
Jun
2009
Aug
200
9
Oct
200
9
Dec
200
9
Feb
201
0
Apr
201
0
Jun
2010
Aug
201
0
Oct
201
0
Dec
201
0
Feb
201
1
Apr
201
1
Jun
2011
Aug
201
1
Oct
201
1
Dec
201
1
Feb
201
2
Apr
201
2
Jun
2012
Aug
201
2
Oct
201
2
Dec
201
2
Feb
201
3
Apr
201
3
Jun
2013
Aug
201
3
Residential General Residential Apartment Residential Villa
Residential performance
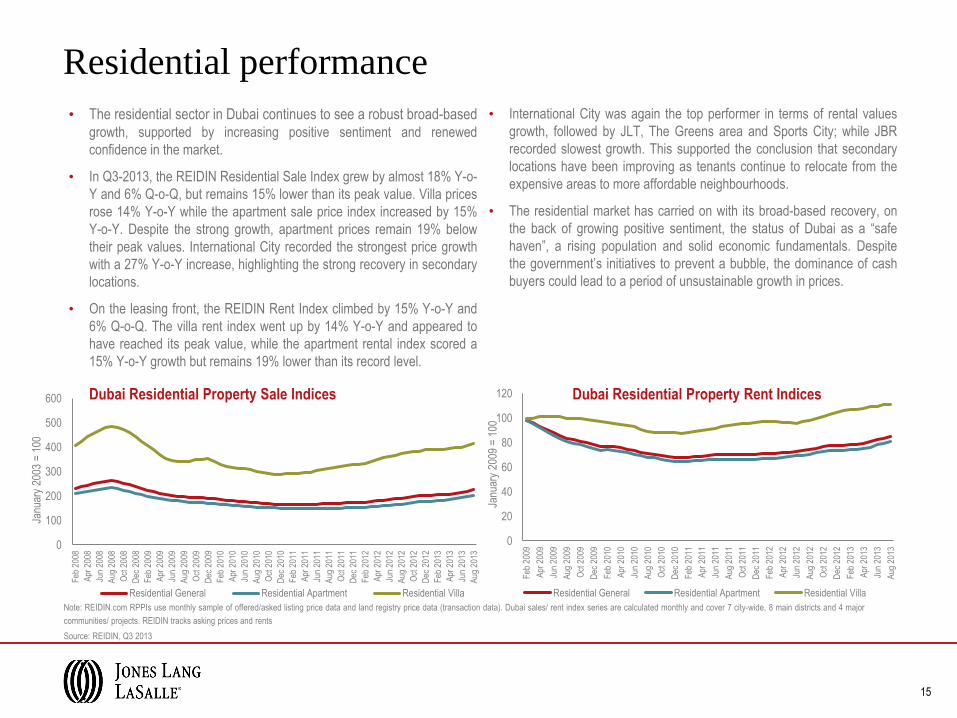
• The residential sector in Dubai continues to see a robust broad-based growth, supported by increasing positive sentiment and renewed
confidence in the market.
• In Q3-2013, the REIDIN Residential Sale Index grew by almost 18% Y-o-
Y and 6% Q-o-Q, but remains 15% lower than its peak value. Villa prices
rose 14% Y-o-Y while the apartment sale price index increased by 15%
Y-o-Y. Despite the strong growth, apartment prices remain 19% below
their peak values. International City recorded the strongest price growth
with a 27% Y-o-Y increase, highlighting the strong recovery in secondary
locations.
• On the leasing front, the REIDIN Rent Index climbed by 15% Y-o-Y and
6% Q-o-Q. The villa rent index went up by 14% Y-o-Y and appeared to
have reached its peak value, while the apartment rental index scored a
15% Y-o-Y growth but remains 19% lower than its record level.
• International City was again the top performer in terms of rental values
growth, followed by JLT, The Greens area and Sports City; while JBR
recorded slowest growth. This supported the conclusion that secondary
locations have been improving as tenants continue to relocate from the
expensive areas to more affordable neighbourhoods.
• The residential market has carried on with its broad-based recovery, on
the back of growing positive sentiment, the status of Dubai as a “safe
haven”, a rising population and solid economic fundamentals. Despite
the government‟s initiatives to prevent a bubble, the dominance of cash
buyers could lead to a period of unsustainable growth in prices.
Note: REIDIN.com RPPIs use monthly sample of offered/asked listing price data and land registry price data (transaction data). Dubai sales/ rent index series are calculated monthly and cover 7 city-wide, 8 main districts and 4 major
communities/ projects. REIDIN tracks asking prices and rents
Source: REIDIN, Q3 2013
15
Dubai Residential Property Sale Indices Dubai Residential Property Rent Indices
Janu
ary
2003
= 1
00
Janu
ary
2009
= 1
00

Residential market summary
Indicator Level Comment/Outlook
Current Residential Stock 364,000 Around 3,400 units were added to Dubai‟s residential stock inventory
in Q3 2013.
Future Supply (2013 – 2015) 45,000
Assuming that all supply tracked by Jones Lang LaSalle will
complete. In reality, some of the proposed projects may be delayed
beyond their scheduled date.
Apartment Rent
Asking rents went up by 15% Y-o-Y. The recovery is being more
broad-based with the secondary and more affordable areas growing
at faster pace than the prime locations
Apartment Sale Price
Asking apartment sale prices went up by 20% Y-o-Y. Sale prices in
the well established areas are growing at a slower pace but
accelerating in the secondary areas.
Villa Rent
Villa rents have increased by 14% Y-o-Y. Asking rents for villas in the
secondary and more affordable locations have been increasing,
sometimes at a faster rate than in the well established areas.
Villa Sale Price Asking prices for villas have increased by 11% Y-o-Y but overall
prices are growing at a decelerating rate.
Note: Direction arrows are based on the performance of the REIDIN monthly index.
16

Dubai retail market overview
Retail mall supply
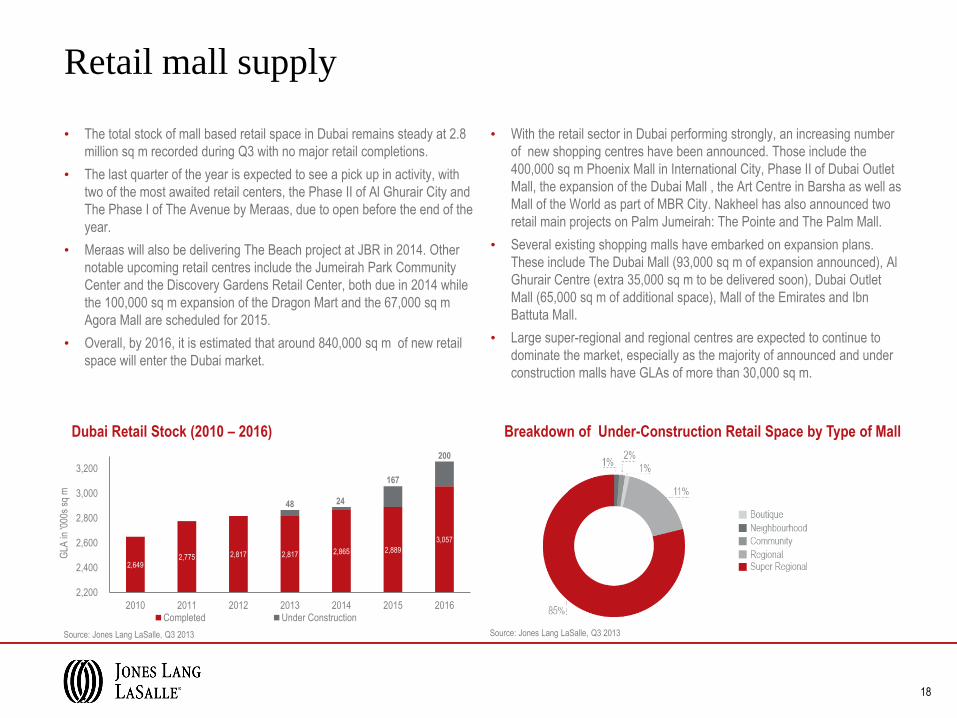
• The total stock of mall based retail space in Dubai remains steady at 2.8
million sq m recorded during Q3 with no major retail completions.
• The last quarter of the year is expected to see a pick up in activity, with
two of the most awaited retail centers, the Phase II of Al Ghurair City and
The Phase I of The Avenue by Meraas, due to open before the end of the
year.
• Meraas will also be delivering The Beach project at JBR in 2014. Other
notable upcoming retail centres include the Jumeirah Park Community
Center and the Discovery Gardens Retail Center, both due in 2014 while
the 100,000 sq m expansion of the Dragon Mart and the 67,000 sq m
Agora Mall are scheduled for 2015.
• Overall, by 2016, it is estimated that around 840,000 sq m of new retail
space will enter the Dubai market.
• With the retail sector in Dubai performing strongly, an increasing number
of new shopping centres have been announced. Those include the
400,000 sq m Phoenix Mall in International City, Phase II of Dubai Outlet
Mall, the expansion of the Dubai Mall , the Art Centre in Barsha as well as
Mall of the World as part of MBR City. Nakheel has also announced two
retail main projects on Palm Jumeirah: The Pointe and The Palm Mall.
• Several existing shopping malls have embarked on expansion plans.
These include The Dubai Mall (93,000 sq m of expansion announced), Al
Ghurair Centre (extra 35,000 sq m to be delivered soon), Dubai Outlet
Mall (65,000 sq m of additional space), Mall of the Emirates and Ibn
Battuta Mall.
• Large super-regional and regional centres are expected to continue to
dominate the market, especially as the majority of announced and under
construction malls have GLAs of more than 30,000 sq m.
Source: Jones Lang LaSalle, Q3 2013 Source: Jones Lang LaSalle, Q3 2013
18
Dubai Retail Stock (2010 – 2016) Breakdown of Under-Construction Retail Space by Type of Mall
2,649 2,775 2,817 2,817 2,865 2,889
3,057
48 24
167
200
2,200
2,400
2,600
2,800
3,000
3,200
2010 2011 2012 2013 2014 2015 2016
GLA
in '0
00s
sq m
Completed Under Construction

19
Downtown Dubai
Dubai Mall - Phase 2
Al Wasl
The Avenue
Al Barsha
Outlet Village
JBR
The Beach
International City
Dragon Mart -
Phase 2
Expected major retail projects
Deira
Al Ghurair Centre -
Phase 2
Under Construction

Rental performance – Estimated Rental Value (ERV)
• The retail market in Dubai has witnessed a slow third quarter due to the
Eid break and summer holidays. However, activity is expected to pick up
in the last months of 2013 as demand continues to be buoyant and
retailers remain quite upbeat.
• Due to the quiet summer months, the top open market net rent for a
notional standard shop in prime super regional centres has remained
unchanged in Q3 2013 at around AED 5,700 per sq m.
• The Primary Super Regional Malls continue to be very popular amongst
both residents and tourists; while the smaller community and
neighbourhood centres have been performing better, supported by
stronger demand from a growing resident population.
• The rising confidence and purchasing power in Dubai have also resulted
in more demand for premium brands, a segment that was severely hit
during the previous crisis.
• With retailers struggling to find quality locations and the large primary
malls largely full, there has been a growing demand for “street shops”. A
clear example is the increasing number of F&B units opening on the
Sheikh Mohammed Bin Rashid Boulevard in Downtown.
• The overall retail market in Dubai continues to perform well, supported
by positive sentiment, solid economic fundamentals, a growing tourism
industry and a rising number of residents. We expect leasing activity to
accelerate over the next 6 months.
Note: Chart shows mid-point ERV for an in-line store in a basket of Primary and Secondary Super Regional shopping
malls. The rent quoted reflects a notional “standard” line store unit of 100 sq m.
Source: Jones Lang LaSalle, Q3 2013
AED / sq m Q3 2013
Primary Secondary
Super Regional 4,300-5,700 1,000-2,400
Regional 1,350-2,700 970-1,900
Community 1,300-2,400 1,100-1,350
Neighbourhood 2,450-2,700 1,100
Convenience 1,500-1,900 1,300-1,400
20
Note: Based on a basket of malls of different size. (See definitions for further details)
0
1,000
2,000
3,000
4,000
5,000
6,000
Q1
2009
Q2
2009
Q3
2009
Q4
2009
Q1
2010
Q2
2010
Q3
2010
Q4
2010
Q1
2011
Q2
2011
Q3
2011
Q4
2011
Q1
2012
Q2
2012
Q3
2012
Q4
2012
Q1
2013
Q2
2013
Q3
2013
Dubai Retail Rents (Q1 2009 – Q3 2013)
Primary Secondary
AE
D /
sq m

Retail sector summary
Indicator Level Comment / Outlook
Current Retail Space (GLA) 2,817,000 sq m No major additions to the mall based retail space in Q3 2013.
Future Supply (2013 – 2016) 839, 500 sq m
The main upcoming retail completions for the last quarter of
2013 will be Phase I of the Avenue by Meraas and Phase II of
Al Ghurair Center. Other large-scale retail projects to be
delivered thereafter include The Beach Mall, The Dragon Mart
expansion and the Agora Mall.
Average Retail Rents in
Primary Malls
Average Retail Rents in
Secondary Malls
AED 5,000 / sq m
AED 1,725 / sq m
Rents of prime units in better performing centers have
remained unchanged in Q3 2013. Primary as well as
the newest secondary malls are expected to see rental
growth in 2014.
Average Regional Mall
Vacancy 13%
Citywide retail vacancy has remained unchanged at
13% in Q3 2013. Vacancy rates are expected to drop
in the coming months as leasing activity increases.
21

Dubai hotel market overview

23
Hotel supply
• The third quarter of 2013 saw some notable openings on Palm
Jumeirah, such as the Sofitel and the Anantara. The Conrad Dubai,
located on Sheikh Zayed Road, was also another new entrant to the
market.
• The main openings scheduled for the end of 2013 include the Novotel
Al Barsha and the expansion of the Millennium Airport.
• During the third quarter of 2013, several new hotel developments
were announced such as an hotel on JBR, two hotels by MAF
attached to their malls – Deira City Centre and Mall of Emirates, the
Dream Hotel in Marina and TRYP by Wyndham in TECOM. Some of
these new projects represent the entry of new brands and operators
into the Dubai hospitality market.
• A number of existing hotels are undergoing renovation and
refurbishment plans. The Sheraton on the Creek, has closed for a
complete renovation while the Ritz Carlton on JBR has shut down its
old wing. Habtoor Grand has recently reopened 320 refurbished
rooms in its two towers. Many hotels are also revamping specific
areas, particularly the food and beverage facilities.
• Dubai Department of Tourism and Commerce Marketing (DTCM)
have announced the Vision 2020 for the tourism sector with an
ambitious objective of achieving 20 million tourists by 2020. The
hospitality supply and tourism projects planned for the next 7 – 8
years are expected to be aligned to this goal.
Source: Jones Lang LaSalle, Q3 2013
Dubai Hotel Stock (2012 – 2015)
No.
of R
oom
s
57,345 59,380 60,900
65,600
1,520
4,700
3,600
35,000
40,000
45,000
50,000
55,000
60,000
65,000
70,000
2012 2013F 2014F 2015F
Current Supply Future Additions
23
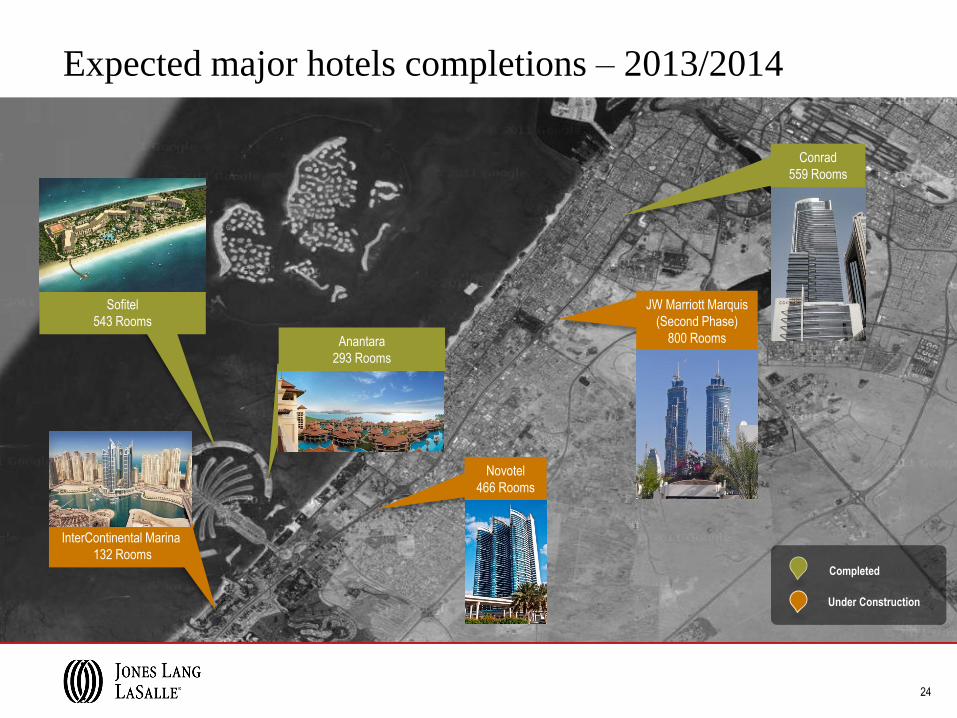
24
Sofitel
543 Rooms
JW Marriott Marquis
(Second Phase)
800 Rooms
Expected major hotels completions – 2013/2014
Under Construction
Completed
InterContinental Marina
132 Rooms
Conrad
559 Rooms
Anantara
293 Rooms
Novotel
466 Rooms
25
Source: STR Global
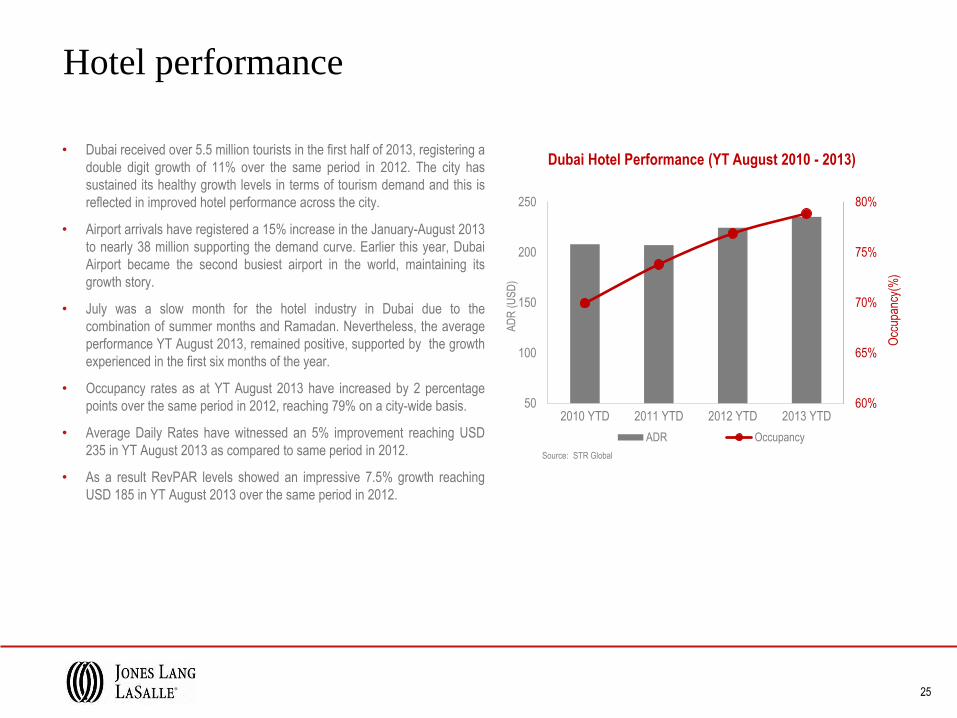
Dubai Hotel Performance (YT August 2010 - 2013) • Dubai received over 5.5 million tourists in the first half of 2013, registering a
double digit growth of 11% over the same period in 2012. The city has
sustained its healthy growth levels in terms of tourism demand and this is
reflected in improved hotel performance across the city.
• Airport arrivals have registered a 15% increase in the January-August 2013
to nearly 38 million supporting the demand curve. Earlier this year, Dubai
Airport became the second busiest airport in the world, maintaining its
growth story.
• July was a slow month for the hotel industry in Dubai due to the
combination of summer months and Ramadan. Nevertheless, the average
performance YT August 2013, remained positive, supported by the growth
experienced in the first six months of the year.
• Occupancy rates as at YT August 2013 have increased by 2 percentage
points over the same period in 2012, reaching 79% on a city-wide basis.
• Average Daily Rates have witnessed an 5% improvement reaching USD
235 in YT August 2013 as compared to same period in 2012.
• As a result RevPAR levels showed an impressive 7.5% growth reaching
USD 185 in YT August 2013 over the same period in 2012.
Hotel performance
60%
65%
70%
75%
80%
50
100
150
200
250
2010 YTD 2011 YTD 2012 YTD 2013 YTD
Occ
upan
cy(%
)
AD
R (
US
D)
ADR Occupancy
25

26
Hotel market summary
Indicator Level Comment / Outlook
Current Hotel Supply 59,380 rooms
The third quarter of 2013 witnessed the addition of two resorts on
Palm Jumeirah – Sofitel and Anantara as well as the Conrad
Dubai on Sheikh Zayed Road.
Future Supply (2013 - 2015) 9,800 rooms
Major openings scheduled for 2014 include the Four Seasons,
InterContinental Marina, second tower of J W Marriott Marquis
and Marriott Al Jadaf amongst others.
2013 YTD Occupancy 79% Increase in YTD levels of occupancy with resurgence witnessed
across all sub-markets.
2013 YTD ADR USD 235 As a result of resurgence in occupancy and ADRs; RevPAR levels
have a notable increase by 7.5% on a city-wide average basis.
26
Dubai industrial market overview

Industrial supply & demand
28
• The industrial sector in Dubai has maintained its healthy growth and
strong performance in Q3 2013.
• The growth of the industrial sector is mainly supported by the economic
growth of Dubai, the “safe haven” status of the Emirate and the positive
atmosphere surrounding the Expo 2020 bid.
• The industrial sector in Dubai is also benefiting from the well-developed
infrastructure in the Emirate and the rising aviation industry.
• The strength of the aviation sector can be highlighted by the following
facts:
• Dubai International Airport is now the world‟s second busiest airport
by passenger traffic. Year to July passenger traffic reached
37,972,500, 15.3% more than the same period in 2012. Dubai
International is also working to increase its capacity
• The new Al Maktoum International Airport is anticipated to be the
largest in the world. It will have capacity for 160 million passengers
and 12 million tons of cargo per year. The airport will start
passenger flights by the end of October.
• Emirates Airlines continues to prove itself as a world leading airline.
In 2012, the airline carried around 39 million passengers and 1.8
million tonnes of cargo.
• The Dubai ports have also been contributing strongly to the growth of the
industrial sector:
• Jebel Ali sea port opened its third terminal that will increase its
capacity to 19 million TEU* a year. By 2014 Jebel Ali is expected to
be the biggest port in the Middle East
• DP World handled 26.6 million TEU across its global portfolio in the
first half of 2013.
• On the back of the growth in the aviation sector and the position of Dubai
as a trading hub, DAFZA announced a 44% increase in demand for space
in H1 2013. DAFZA noted an 11% y-o-y growth in expansion applications
from existing tenants. European and American companies constitute 40%
of DAFZA‟s tenants.
• DAFZA has been named the Middle East Free Zone of the Future 2013/14
by FDI magazine
*TEU - Twenty-foot equivalent units

Industrial supply & demand
29
Overview of some of the main industrial areas in Dubai
Area Age Land Area (sq m) Regulatory Status Selected tenants
Traditional
Areas
Al Quoz 1973 18,500,000 Onshore Fedex, Mercedes-Benz
Al Qusais 5,450,000 Onshore Maxell, Sabco
Umm Ramool 3,900,000
Onshore
Al Futtaim, Al Ghurair Group, Al Habtoor
Leighton
Ras Al Khor 1976 12,000,000
Onshore
Aramex, Total, Unilever, Easa Saleh
Al Gurg Group
Free Zone
Areas
JAFZA 1985 JAFZA North - 45,000,000
JAFZA South- 35,000,000 Offshore
DHL, Danube, LG, Kenwood, Heinz, Kraft,
Mars, P&G
DAFZA 1996 2,000,000 Offshore Clarins, Rolls-Royce, National Foods
Products Company
Dubai World Central 2009 105,000,000
Free Zone Areas –
Logistics and
Aviation City only
Dnata, RSA, Caliper
New
Onshore
Areas
Jebel Ali Industrial
Area
21,240,000
Onshore Landmark Group, Jumbo, Bridgestone,
Dubai Investment Park 1997 16,500,000
Onshore Paris Group, Drake & Scull
Dubai Industrial City 2004 52,000,000 Onshore Nestle, Baker Hugues
Industrial supply & demand
30
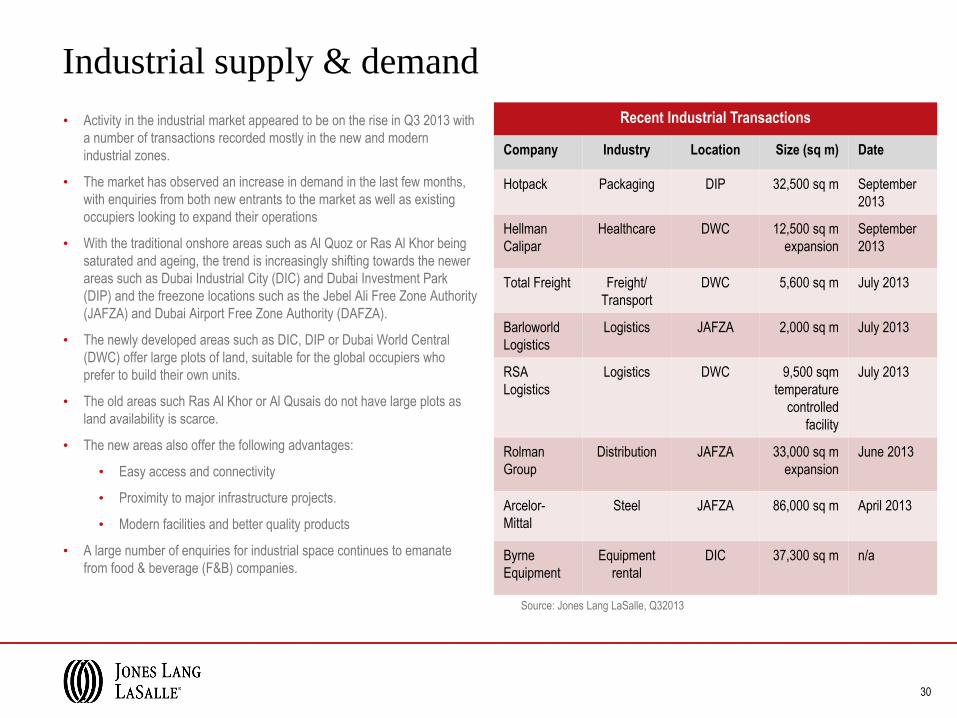
• Activity in the industrial market appeared to be on the rise in Q3 2013 with
a number of transactions recorded mostly in the new and modern
industrial zones.
• The market has observed an increase in demand in the last few months,
with enquiries from both new entrants to the market as well as existing
occupiers looking to expand their operations
• With the traditional onshore areas such as Al Quoz or Ras Al Khor being
saturated and ageing, the trend is increasingly shifting towards the newer
areas such as Dubai Industrial City (DIC) and Dubai Investment Park
(DIP) and the freezone locations such as the Jebel Ali Free Zone Authority
(JAFZA) and Dubai Airport Free Zone Authority (DAFZA).
• The newly developed areas such as DIC, DIP or Dubai World Central
(DWC) offer large plots of land, suitable for the global occupiers who
prefer to build their own units.
• The old areas such Ras Al Khor or Al Qusais do not have large plots as
land availability is scarce.
• The new areas also offer the following advantages:
• Easy access and connectivity
• Proximity to major infrastructure projects.
• Modern facilities and better quality products
• A large number of enquiries for industrial space continues to emanate
from food & beverage (F&B) companies.
Recent Industrial Transactions
Company Industry Location Size (sq m) Date
Hotpack Packaging DIP 32,500 sq m September
2013
Hellman
Calipar
Healthcare DWC 12,500 sq m
expansion
September
2013
Total Freight Freight/
Transport
DWC 5,600 sq m July 2013
Barloworld
Logistics
Logistics JAFZA 2,000 sq m July 2013
RSA
Logistics
Logistics DWC 9,500 sqm
temperature
controlled
facility
July 2013
Rolman
Group
Distribution JAFZA 33,000 sq m
expansion
June 2013
Arcelor-
Mittal
Steel JAFZA 86,000 sq m April 2013
Byrne
Equipment
Equipment
rental
DIC 37,300 sq m n/a
Source: Jones Lang LaSalle, Q32013
30
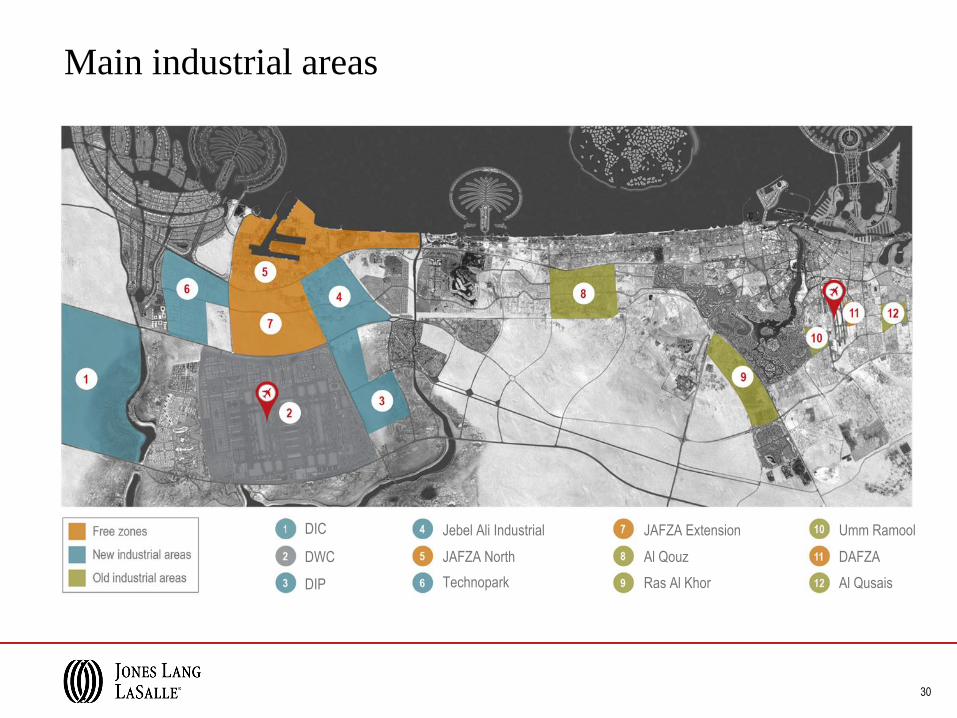
Main industrial areas
DIC
DWC
DIP Technopark
JAFZA North
Jebel Ali Industrial JAFZA Extension Umm Ramool
Al Qouz DAFZA
Ras Al Khor Al Qusais

32
Industrial performance
• The industrial sector is considered one of Dubai‟s most resilient real
estate markets, with rates remaining stable due to the lack of speculation
in the market.
• Rental rates in completed industrial units in Dubai currently vary
significantly from one area to another, with no real standardization of
logistics facilities.
• The older areas have maintained their average rents of AED 300 – 550
per sq m, due to their proximity to local markets, despite the poor quality
of their stock and the relatively underdeveloped infrastructure systems.
Completed units in newer but more peripheral locations (such as DIC
and DIP) have started to offer higher average rents as they are seeing
increasing demand.
• The free zone areas of Jebel Ali and Dubai Airport command a higher
average of between AED 350 – 800 per sq m for completed
warehousing units
• Demand is starting to shift towards those areas offering better quality
products, well developed infrastructure and access to ports and/or
airports (e.g. DIC, DIP, JAFZA). Al Maktoum International Airport will
start transforming into an integrated logistics platform over time,
increasing the attraction of industrial areas to the south of Dubai.
• The industrial market has been much less cyclical than other sectors
over recent years and continues to be dominated by long term
commitments to single tenants.
Area Unit Lease
AED / sq m / p.a.
Lease term
Older Onshore Areas 300-550 Annual
Newer Onshore areas (excl.
Freezone areas)
200-400 3-5-10 years (DIC)
1 year (DIP)
Freezone areas 350-800
(DAFZA rates 600-800)
1- 2 years
Area Land Lease
AED / sq m / p.a
Older Onshore Areas 50-80
Newer Onshore areas (excl.
Free Zone areas) 40-80
Free Zone areas 20-80 (JAFZA)
40-100 (DAFZA)
Warehouse rents
Land lease sales
Source: Jones Lang LaSalle, Q32013
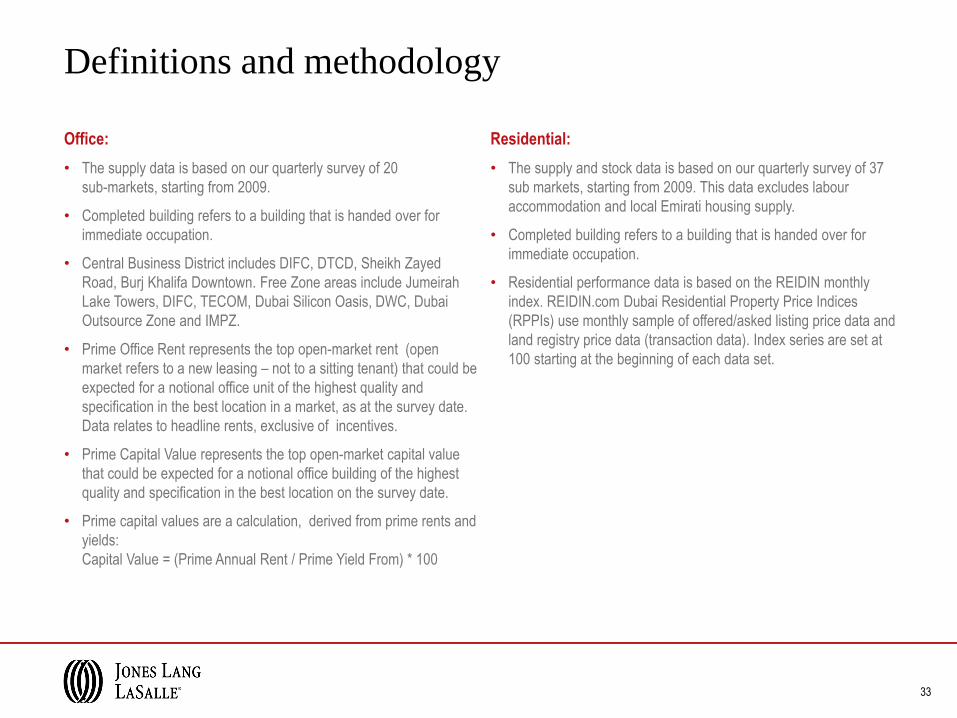
Definitions and methodology
Office:
• The supply data is based on our quarterly survey of 20
sub-markets, starting from 2009.
• Completed building refers to a building that is handed over for
immediate occupation.
• Central Business District includes DIFC, DTCD, Sheikh Zayed
Road, Burj Khalifa Downtown. Free Zone areas include Jumeirah
Lake Towers, DIFC, TECOM, Dubai Silicon Oasis, DWC, Dubai
Outsource Zone and IMPZ.
• Prime Office Rent represents the top open-market rent (open
market refers to a new leasing – not to a sitting tenant) that could be
expected for a notional office unit of the highest quality and
specification in the best location in a market, as at the survey date.
Data relates to headline rents, exclusive of incentives.
• Prime Capital Value represents the top open-market capital value
that could be expected for a notional office building of the highest
quality and specification in the best location on the survey date.
• Prime capital values are a calculation, derived from prime rents and
yields:
Capital Value = (Prime Annual Rent / Prime Yield From) * 100
Residential:
• The supply and stock data is based on our quarterly survey of 37
sub markets, starting from 2009. This data excludes labour
accommodation and local Emirati housing supply.
• Completed building refers to a building that is handed over for
immediate occupation.
• Residential performance data is based on the REIDIN monthly
index. REIDIN.com Dubai Residential Property Price Indices
(RPPIs) use monthly sample of offered/asked listing price data and
land registry price data (transaction data). Index series are set at
100 starting at the beginning of each data set.
33
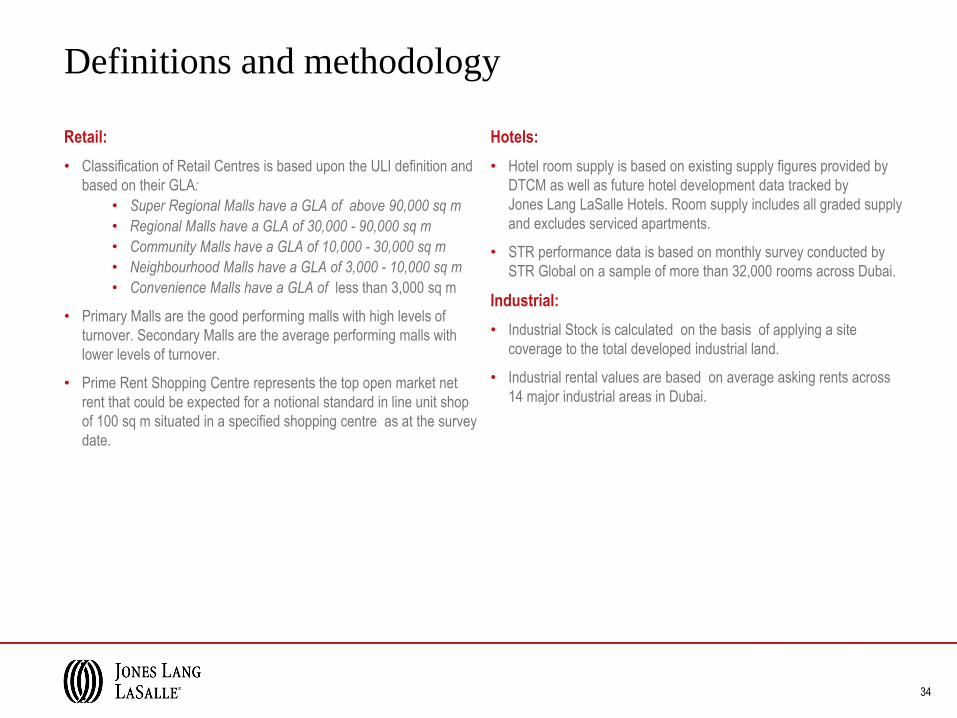
Retail:
• Classification of Retail Centres is based upon the ULI definition and
based on their GLA:
• Super Regional Malls have a GLA of above 90,000 sq m
• Regional Malls have a GLA of 30,000 - 90,000 sq m
• Community Malls have a GLA of 10,000 - 30,000 sq m
• Neighbourhood Malls have a GLA of 3,000 - 10,000 sq m
• Convenience Malls have a GLA of less than 3,000 sq m
• Primary Malls are the good performing malls with high levels of
turnover. Secondary Malls are the average performing malls with
lower levels of turnover.
• Prime Rent Shopping Centre represents the top open market net
rent that could be expected for a notional standard in line unit shop
of 100 sq m situated in a specified shopping centre as at the survey
date.
Hotels:
• Hotel room supply is based on existing supply figures provided by
DTCM as well as future hotel development data tracked by
Jones Lang LaSalle Hotels. Room supply includes all graded supply
and excludes serviced apartments.
• STR performance data is based on monthly survey conducted by
STR Global on a sample of more than 32,000 rooms across Dubai.
Industrial:
• Industrial Stock is calculated on the basis of applying a site
coverage to the total developed industrial land.
• Industrial rental values are based on average asking rents across
14 major industrial areas in Dubai.
34
Definitions and methodology
Dana Williamson
Head of Agency
MENA
Chiheb Ben-Mahmoud
Head of Hotels & Hospitality
MENA
Andrew Williamson
Head of Retail
MENA
Michael Heitmann
National Director, Industrial
MENA
Craig Plumb
Head of Research
MENA
Cynthia Nasseh
Senior Research Analyst
MENA
www.jll–mena.com
COPYRIGHT © JONES LANG LASALLE IP, INC. 2013
This publication is the sole property of Jones Lang LaSalle IP, Inc. and must not be copied, reproduced or transmitted in any form or by any means, either in whole or in part, without the prior
written consent of Jones Lang LaSalle IP, Inc. The information contained in this publication has been obtained from sources generally regarded to be reliable. However, no representation is
made, or warranty given, in respect of the accuracy of this information. We would like to be informed of any inaccuracies so that we may correct them. Jones Lang LaSalle does not accept
any liability in negligence or otherwise for any loss or damage suffered by any party resulting from reliance on this publication.
Contacts:
twitter.com/
JLLNews
youtube.com/
joneslanglasalle
linkedin.com/company/
jones-lang-lasalle
joneslanglasalleblog.com/
EMEAResearch