dublin - content.knightfrank.com · dublin office market review and outlook 2019 research special...
TRANSCRIPT

RESEARCH
OCCUPIER TRENDS INVESTMENT TRENDS MARKET OUTLOOK
DUBLINOFFICE MARKET REVIEW AND OUTLOOK2019WITH SPECIAL FOCUS: THE TECH SECTOR IN DUBLIN

2
SUMMARY REVIEW AND OUTLOOK 2019Facebook’s 870,000 sq ft mega deal at Ballsbridge drives annual take-up to the highest level ever achieved.
1. Ireland was the fastest growing economy in Europe for a fifth consecutive year in 2018, expanding by an estimated 6.8%
2. Take-up reached 3.9 million sq ft in 2018 – the highest level ever
3. Prime Grade-A rents remained unchanged in 2018 at €62.50 psf
4. Prime yields remained stable at 4.00% throughout 2018
5. 2.0 million sq ft of office space was completed in 2018 with 2.2 million sq ft projected for 2019
FIGURE 2
Office take-up sq ft
0
500,000
1,000,000
1,500,000
2,000,000
2,500,000
3,000,000
3,500,000
4,000,000
2014
2017
2018
2015
2016
2013
2010
2011
2012
2008
2007
2006
2005
2009
Source: Knight Frank Research
Of all the risks that face the office market, the potential for overbuilding will always be the most analysed. Looking back at demand in 2018, the Central Statistics Office’s Labour Force Survey showed that 50,500 jobs were created in Ireland last year, of which 25,900 (or 51%) were located in Dublin. Given that office based employment accounts for half of new jobs, an estimated 12,950 new workers took up office space in Dublin in 2018. Using an
KNIGHT FRANK VIEW ON RISK occupancy ratio of 130 sq ft per worker and an obsolescence rate of 1% for existing stock, this equated to demand for 2.1 million sq ft of new office space. Therefore, the 2.0 million sq ft of new office stock delivered in 2018 was approximately in-line with estimated demand. Looking ahead, with similar job creation of 50,000 expected this year, the 2.2 million sq ft due for delivery in 2019 also looks to be approximately in-line with demand.
EconomyAccording to the European Commission’s Winter Economic Forecast, the Irish economy is estimated to have expanded by 6.8% in 2018 making it the fastest growing economy in Europe for a fifth consecutive year. This robust performance saw the unemployment rate continue its downward trajectory, falling to 5.7% at the end of 2018, down from 6.2% the year previous. Looking ahead, economic activity is anticipated to advance at a relatively solid pace in 2019, with the European Commission projecting that the economy will grow by 4.1% this year.
While this growth outlook is heavily contingent upon a soft Brexit, Ireland is currently forecast to be the second fastest growing economy in Europe along with Slovakia – with Malta occupying the top spot. Additionally – in what will be positive news for the office market – the Central Bank is also suggesting that the labour market recovery is far from complete, forecasting that 50,000 jobs will be created this year.
Occupier market Occupier activity expanded for a sixth consecutive year in 2018 establishing a new record for the highest level of letting activity ever recorded in the Dublin office market as 3.9 million sq ft transacted. This represents an 8% increase in comparison
0
1%
2%
3%
4%
5%
6%
7%
8%
FOR
EC
AS
T
EU-28
IRELAND
2016 2017 2018 2019 2020
FIGURE 1
Ireland vs EU-28 GDP growth rates
Source: EU Commission
3
DUBLIN OFFICE MARKET REVIEW AND OUTLOOK 2019 RESEARCH
0
€10
€20
€30
€40
€50
€60
€70
2018
2017
2016
2015
2014
2013
2012
2011
2010
2009
2008
2007
2006
2005
Source: Knight Frank Research
FIGURE 5
Dublin prime office rents € per sq ft per annum
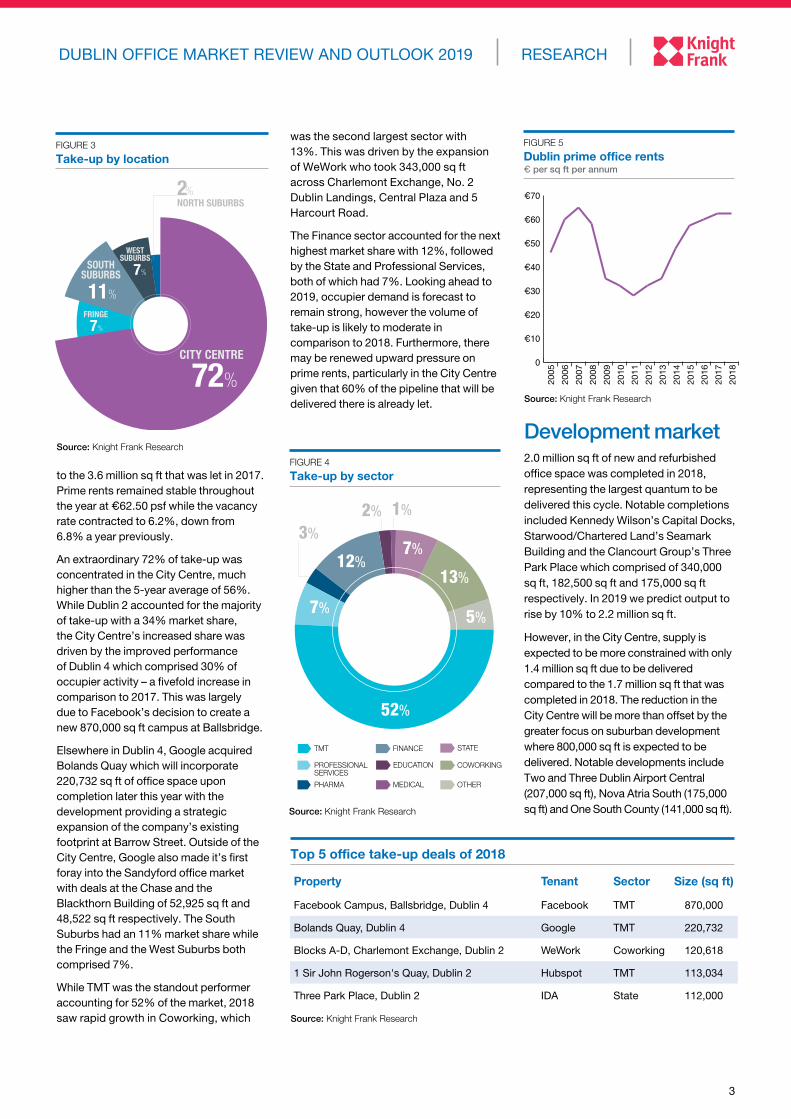
to the 3.6 million sq ft that was let in 2017. Prime rents remained stable throughout the year at €62.50 psf while the vacancy rate contracted to 6.2%, down from 6.8% a year previously.
An extraordinary 72% of take-up was concentrated in the City Centre, much higher than the 5-year average of 56%. While Dublin 2 accounted for the majority of take-up with a 34% market share, the City Centre’s increased share was driven by the improved performance of Dublin 4 which comprised 30% of occupier activity – a fivefold increase in comparison to 2017. This was largely due to Facebook’s decision to create a new 870,000 sq ft campus at Ballsbridge.
Elsewhere in Dublin 4, Google acquired Bolands Quay which will incorporate 220,732 sq ft of office space upon completion later this year with the development providing a strategic expansion of the company’s existing footprint at Barrow Street. Outside of the City Centre, Google also made it’s first foray into the Sandyford office market with deals at the Chase and the Blackthorn Building of 52,925 sq ft and 48,522 sq ft respectively. The South Suburbs had an 11% market share while the Fringe and the West Suburbs both comprised 7%.
While TMT was the standout performer accounting for 52% of the market, 2018 saw rapid growth in Coworking, which
was the second largest sector with 13%. This was driven by the expansion of WeWork who took 343,000 sq ft across Charlemont Exchange, No. 2 Dublin Landings, Central Plaza and 5 Harcourt Road.
The Finance sector accounted for the next highest market share with 12%, followed by the State and Professional Services, both of which had 7%. Looking ahead to 2019, occupier demand is forecast to remain strong, however the volume of take-up is likely to moderate in comparison to 2018. Furthermore, there may be renewed upward pressure on prime rents, particularly in the City Centre given that 60% of the pipeline that will be delivered there is already let.
Development market2.0 million sq ft of new and refurbished office space was completed in 2018, representing the largest quantum to be delivered this cycle. Notable completions included Kennedy Wilson’s Capital Docks, Starwood/Chartered Land’s Seamark Building and the Clancourt Group’s Three Park Place which comprised of 340,000 sq ft, 182,500 sq ft and 175,000 sq ft respectively. In 2019 we predict output to rise by 10% to 2.2 million sq ft.
However, in the City Centre, supply is expected to be more constrained with only 1.4 million sq ft due to be delivered compared to the 1.7 million sq ft that was completed in 2018. The reduction in the City Centre will be more than offset by the greater focus on suburban development where 800,000 sq ft is expected to be delivered. Notable developments include Two and Three Dublin Airport Central (207,000 sq ft), Nova Atria South (175,000 sq ft) and One South County (141,000 sq ft).
Property Tenant Sector Size (sq ft)
Facebook Campus, Ballsbridge, Dublin 4 Facebook TMT 870,000
Bolands Quay, Dublin 4 Google TMT 220,732
Blocks A-D, Charlemont Exchange, Dublin 2 WeWork Coworking 120,618
1 Sir John Rogerson's Quay, Dublin 2 Hubspot TMT 113,034
Three Park Place, Dublin 2 IDA State 112,000
Top 5 office take-up deals of 2018
Source: Knight Frank Research
52%
7%
7%
13%12%
MEDICAL
EDUCATION
PHARMA
PROFESSIONAL SERVICES
TMT FINANCE STATE
OTHER
COWORKING
3%
1%2%
5%
FIGURE 4
Take-up by sector
Source: Knight Frank Research
2%NORTH SUBURBS
FRINGE
7%
CITY CENTRE
72%
SOUTHSUBURBS
11%
WESTSUBURBS
7%
Source: Knight Frank Research
FIGURE 3 Take-up by location
54
AMIE
NS
STR
EET
PORTLAND ROW
O’C
ON
NELL STR
EET
BATH AVENUE
CITY QUAY
SHERIFF STREET UPPER
EAST
WA
LL R
OA
D
HADDINGTON RD
FITZ
WIL
LIAM
ST
UPPE
R
KILD
ARE
ST
DAW
SON
STR
EET
MOUNT STREET LOWER
CUFFE ST
LEESON
ST LOW
ER
GRAND CANAL ST LOWER
HATCH STREET
CA
MD
EN STR
EET LOW
ER
RA
NELAG
H R
OA
D
EDEN QUAY
GEOR GES QUAY
NO
RTH
UM
BERLAN
D R
OA
D
SHELB
OU
RN
E RO
AD
LEESON ST UPPER
CHARLEMONT ST
BAGGOT ST LOWER
PEARSE STREET
VICTORIA QUAY
CHESTERFIELD AVE
USHER’S QUAY
ARRAN QUAY
SOU
TH C
IRC
ULA
R R
OA
D
DOLPHIN ROAD
SOUTH CIRCULAR ROAD
OLD KILMAINHAM ROAD
JAMES STREET
MARROWBONE LANE
CORK STREET
DONORE AVENU
E
KEVIN STREET UPPER
EARL
SFO
RT T
ERRA
CE
CLA
NB
RAS
SIL
STRE
ET
PA
TRIC
K S
TREE
T
BR
IDG
E STREETTHOMAS STREET
WOOD QUAY
CHAPELIZOD BYPASS
BLA
CK
HA
LL P
L
QU
EEN
STR
EET
MANO
R STREET
SUMMERHILL
CO
NST
ITU
TIO
N H
ILL
SERPENTI
NE
AVE
NUE
PARNELL STREET
GARDINER STREET LO
WER
NORTH C
IRCULAR ROAD
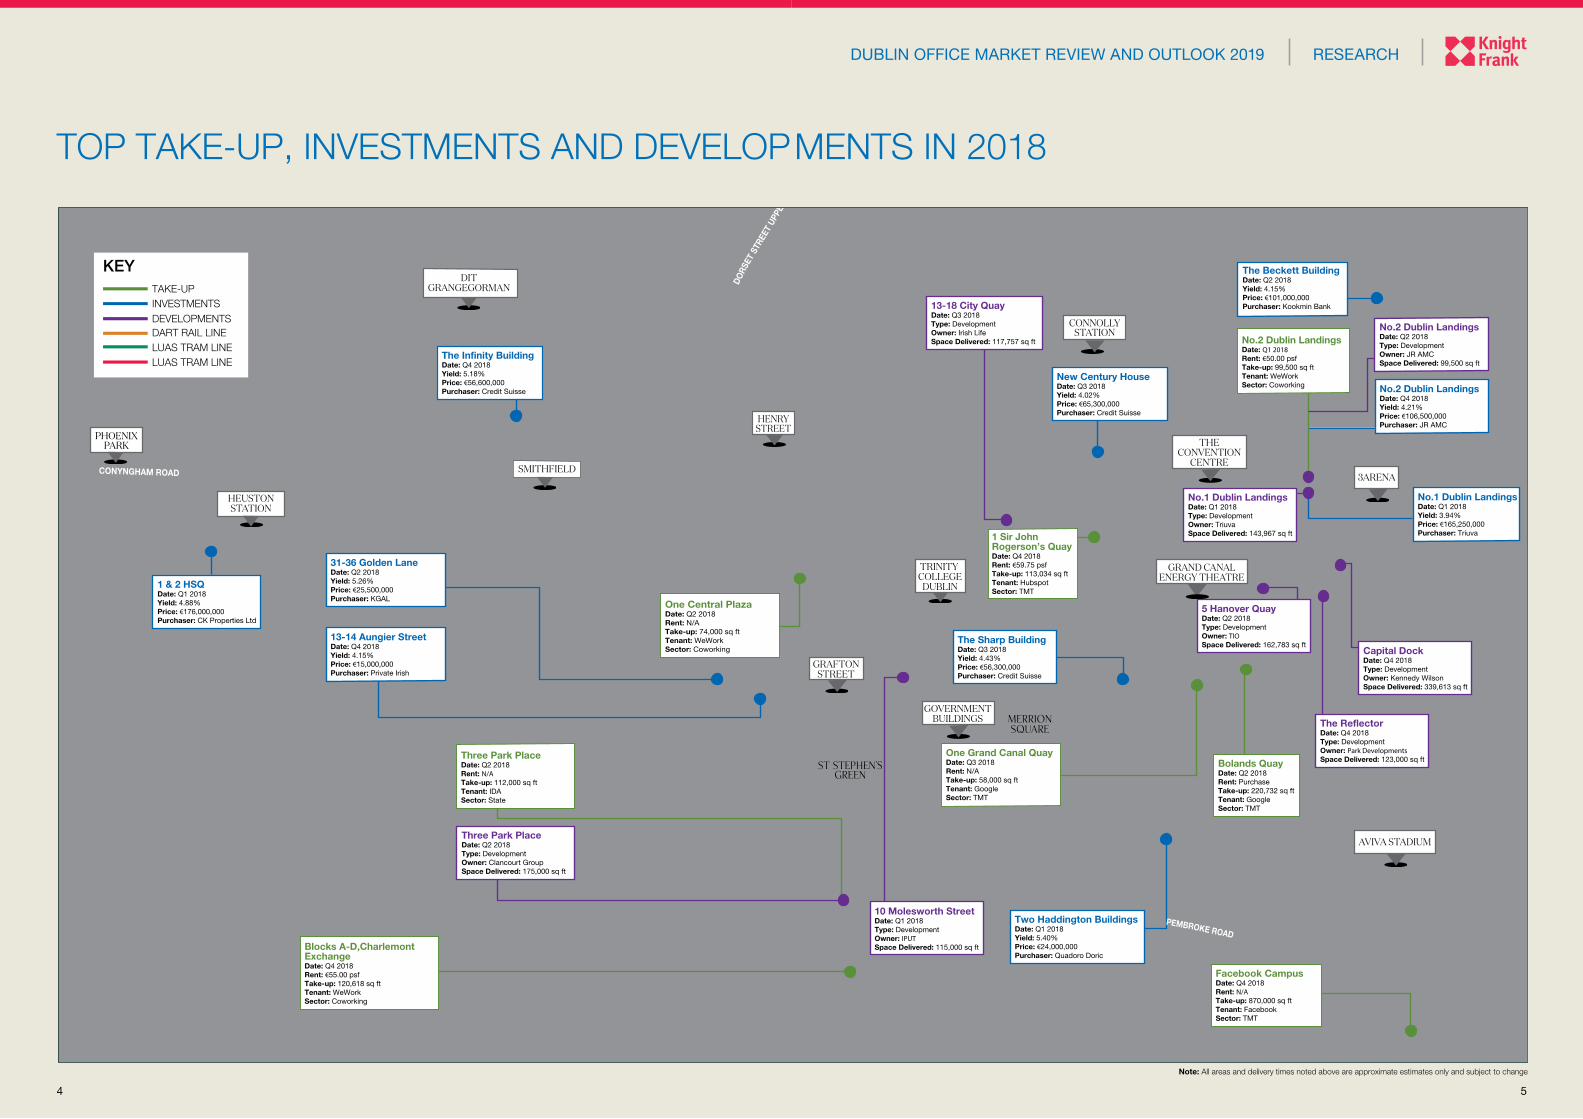
The Beckett BuildingDate: Q2 2018Yield: 4.15%Price: €101,000,000Purchaser: Kookmin Bank
Bolands QuayDate: Q2 2018Rent: PurchaseTake-up: 220,732 sq ftTenant: GoogleSector: TMT
Three Park PlaceDate: Q2 2018Rent: N/ATake-up: 112,000 sq ftTenant: IDASector: State
No.2 Dublin LandingsDate: Q1 2018Rent: €50.00 psfTake-up: 99,500 sq ftTenant: WeWorkSector: Coworking
Blocks A-D,CharlemontExchangeDate: Q4 2018Rent: €55.00 psfTake-up: 120,618 sq ftTenant: WeWorkSector: Coworking
One Central PlazaDate: Q2 2018Rent: N/ATake-up: 74,000 sq ftTenant: WeWorkSector: Coworking
No.2 Dublin LandingsDate: Q4 2018Yield: 4.21%Price: €106,500,000Purchaser: JR AMC
New Century HouseDate: Q3 2018Yield: 4.02%Price: €65,300,000Purchaser: Credit Suisse
The Sharp BuildingDate: Q3 2018Yield: 4.43%Price: €56,300,000Purchaser: Credit Suisse
Two Haddington BuildingsDate: Q1 2018Yield: 5.40%Price: €24,000,000Purchaser: Quadoro Doric
Capital DockDate: Q4 2018Type: DevelopmentOwner: Kennedy WilsonSpace Delivered: 339,613 sq ft
Three Park PlaceDate: Q2 2018Type: DevelopmentOwner: Clancourt GroupSpace Delivered: 175,000 sq ft
No.2 Dublin LandingsDate: Q2 2018Type: DevelopmentOwner: JR AMCSpace Delivered: 99,500 sq ft
No.1 Dublin LandingsDate: Q1 2018Type: DevelopmentOwner: TriuvaSpace Delivered: 143,967 sq ft
13-14 Aungier StreetDate: Q4 2018Yield: 4.15%Price: €15,000,000Purchaser: Private Irish
5 Hanover QuayDate: Q2 2018Type: DevelopmentOwner: TIOSpace Delivered: 162,783 sq ft
1 Sir JohnRogerson’s QuayDate: Q4 2018Rent: €59.75 psfTake-up: 113,034 sq ftTenant: HubspotSector: TMT
Facebook CampusDate: Q4 2018Rent: N/ATake-up: 870,000 sq ftTenant: FacebookSector: TMT
The ReflectorDate: Q4 2018Type: DevelopmentOwner: Park DevelopmentsSpace Delivered: 123,000 sq ft
10 Molesworth StreetDate: Q1 2018Type: DevelopmentOwner: IPUTSpace Delivered: 115,000 sq ft
One Grand Canal QuayDate: Q3 2018Rent: N/ATake-up: 58,000 sq ftTenant: GoogleSector: TMT
31-36 Golden LaneDate: Q2 2018Yield: 5.26%Price: €25,500,000Purchaser: KGAL
1 & 2 HSQDate: Q1 2018Yield: 4.88%Price: €176,000,000 Purchaser: CK Properties Ltd
No.1 Dublin LandingsDate: Q1 2018Yield: 3.94%Price: €165,250,000Purchaser: Triuva
CONYNGHAM ROAD
PEMBROKE ROAD
The Infinity BuildingDate: Q4 2018Yield: 5.18%Price: €56,600,000 Purchaser: Credit Suisse
13-18 City QuayDate: Q3 2018Type: DevelopmentOwner: Irish LifeSpace Delivered: 117,757 sq ft
TRINITY COLLEGE
DUBLIN
CONNOLLYSTATION
THECONVENTION
CENTRE
GRAFTONSTREET
3ARENA
GRAND CANALENERGY THEATRE
AVIVA STADIUM
GOVERNMENTBUILDINGS
ST STEPHEN’SGREEN
MERRIONSQUARE
DITGRANGEGORMAN
DART RAIL LINE
KEY
INVESTMENTSDEVELOPMENTS
TAKE-UP
LUAS TRAM LINELUAS TRAM LINE
DORS
ET S
TREE
T UP
PER
PHOENIXPARK
HEUSTONSTATION
SMITHFIELD
HENRYSTREET
TOP TAKE-UP, INVESTMENTS AND DEVELOP MENTS IN 2018
54
Note: All areas and delivery times noted above are approximate estimates only and subject to change
DUBLIN OFFICE MARKET REVIEW AND OUTLOOK 2019 RESEARCH

6
respectively. Significant transactions included Spear Street Capital’s purchase of the Belfield Office Campus for €90.0 million and the purchase of One and Two Gateway for €29.0 million by Yew Grove REIT. These deals were also emblematic of the increasing investor appetite to deploy capital in non-core markets where there is greater potential for value-add plays. Looking ahead to 2019, office investment volumes are likely to remain buoyant as the pipeline of newly completed and let office stock comes to the market for sale.
Property Seller Buyer Approx. price
1 and 2 HSQ, Dublin 8Northwood Investors
CK Properties Ltd €176.0m
No.1 Dublin Landings, Dublin 1 Ballymore/Oxley Triuva €165.3m
Off-market asset swap of properties in Dublin 1 and Dublin 2
Confidential Confidential €160.0m
No.2 Dublin Landings, Dublin 1 Ballymore/Oxley JR AMC €106.5m
The Beckett Building, Dublin 3The Comer Group
Kookmin Bank €101.0m
Top 5 office investment transactions of 2018
Source: Knight Frank Research
Investment€3.6 billion worth of investment transactions changed hands in 2018, 60% ahead of the 2017 spend of €2.3 billion. Office investment sales accounted for the largest proportion of investor activity with 40% of the market or €1.5 billion, of which 89% or €1.3 billion was concentrated in Dublin.
The emergence of institutional capital from Asia was a key feature of the market in 2018. Asians accounted for 37% of the total spend and were responsible for three of the top five acquisitions. This included the largest office transaction of the year, namely the sale of 1 and 2 HSQ to Hong Kong based CK Properties Ltd for €176.0 million.
The other deals were executed by Korean money, namely the purchase of No.2 Dublin Landings for €106.5 million by JR AMC and the acquisition of the Beckett Building for €101.0 million by Kookmin Bank. European buyers were the most active source of capital however, accounting for 38% of the market spend. The largest purchase by a European buyer was the sale of No.1 Dublin landings to Triuva for €165.3 million.
Buyers from Ireland and the United States accounted for the rest of the market with a 13% and 12% share
0
1,000
2,000
3,000
4,000
5,000
20
14
20
17
20
18
20
16
20
15
20
13
20
10
20
11
20
12
20
08
20
07
20
06
20
05
20
09
Source: Knight Frank Research
FIGURE 6
Irish commercial investment volumes € million
0
1%
2%
3%
4%
5%
6%
7%
8%20
16
2017
201
8
2015
2014
2013
2010
2011
2012
2008
2009
2007
2006
2005
FIGURE 7
Dublin prime office yields
Source: Knight Frank Research
EUROPEASIA US IRELAND UK
BUYERS
VENDORS
13%
12% 2%
38%
37%50%
18%
28%
2%
FIGURE 8
Buyer and vendor source
Source: Knight Frank Research
were acquired by Asian buyers
3 OF THE TOP 5 DEALS
7
GOOGLE FACEBOOK MICROSOFT/LINKEDIN AMAZON
0
200,000
400,000
600,000
800,000
1,000,000
1,200,000
2022
2021
2020
2019
2018
2017
2016
2015
2014
2013
2012
2011
2010
Pre
201
0FIGURE 10
Growth of Mega-Cap Tech footprint in Dublin sq ft
Source: Knight Frank Research
DUBLIN OFFICE MARKET REVIEW AND OUTLOOK 2019 RESEARCH
SPECIAL FOCUS: THE TECH SECTOR IN DUBLIN
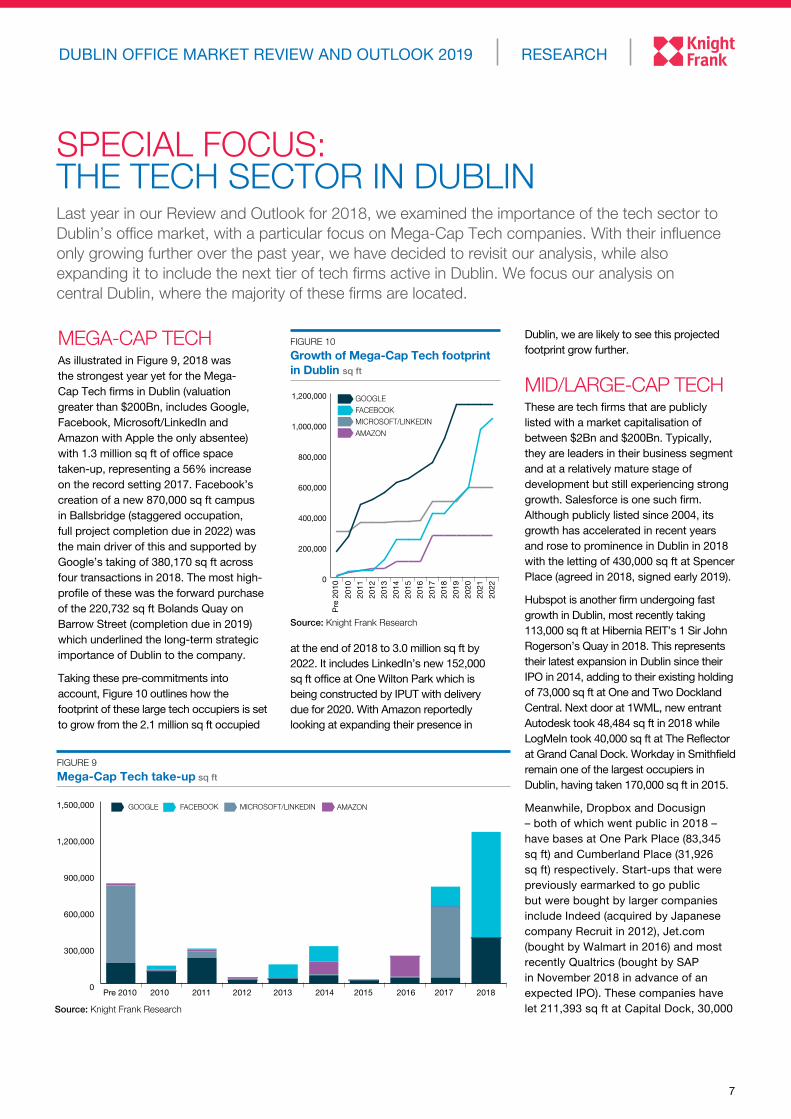
MEGA-CAP TECH As illustrated in Figure 9, 2018 was the strongest year yet for the Mega-Cap Tech firms in Dublin (valuation greater than $200Bn, includes Google, Facebook, Microsoft/LinkedIn and Amazon with Apple the only absentee) with 1.3 million sq ft of office space taken-up, representing a 56% increase on the record setting 2017. Facebook’s creation of a new 870,000 sq ft campus in Ballsbridge (staggered occupation, full project completion due in 2022) was the main driver of this and supported by Google’s taking of 380,170 sq ft across four transactions in 2018. The most high-profile of these was the forward purchase of the 220,732 sq ft Bolands Quay on Barrow Street (completion due in 2019) which underlined the long-term strategic importance of Dublin to the company.
Taking these pre-commitments into account, Figure 10 outlines how the footprint of these large tech occupiers is set to grow from the 2.1 million sq ft occupied
at the end of 2018 to 3.0 million sq ft by 2022. It includes LinkedIn’s new 152,000 sq ft office at One Wilton Park which is being constructed by IPUT with delivery due for 2020. With Amazon reportedly looking at expanding their presence in
Dublin, we are likely to see this projected footprint grow further.
MID/LARGE-CAP TECHThese are tech firms that are publicly listed with a market capitalisation of between $2Bn and $200Bn. Typically, they are leaders in their business segment and at a relatively mature stage of development but still experiencing strong growth. Salesforce is one such firm. Although publicly listed since 2004, its growth has accelerated in recent years and rose to prominence in Dublin in 2018 with the letting of 430,000 sq ft at Spencer Place (agreed in 2018, signed early 2019).
Hubspot is another firm undergoing fast growth in Dublin, most recently taking 113,000 sq ft at Hibernia REIT’s 1 Sir John Rogerson’s Quay in 2018. This represents their latest expansion in Dublin since their IPO in 2014, adding to their existing holding of 73,000 sq ft at One and Two Dockland Central. Next door at 1WML, new entrant Autodesk took 48,484 sq ft in 2018 while LogMeIn took 40,000 sq ft at The Reflector at Grand Canal Dock. Workday in Smithfield remain one of the largest occupiers in Dublin, having taken 170,000 sq ft in 2015.
Meanwhile, Dropbox and Docusign – both of which went public in 2018 – have bases at One Park Place (83,345 sq ft) and Cumberland Place (31,926 sq ft) respectively. Start-ups that were previously earmarked to go public but were bought by larger companies include Indeed (acquired by Japanese company Recruit in 2012), Jet.com (bought by Walmart in 2016) and most recently Qualtrics (bought by SAP in November 2018 in advance of an expected IPO). These companies have let 211,393 sq ft at Capital Dock, 30,000
Last year in our Review and Outlook for 2018, we examined the importance of the tech sector to Dublin’s office market, with a particular focus on Mega-Cap Tech companies. With their influence only growing further over the past year, we have decided to revisit our analysis, while also expanding it to include the next tier of tech firms active in Dublin. We focus our analysis on central Dublin, where the majority of these firms are located.
FACEBOOK AMAZON GOOGLE MICROSOFT/LINKEDIN
0
300,000
600,000
900,000
1,200,000
1,500,000
201820172016201520142013201220112010Pre 2010
Source: Knight Frank Research
FIGURE 9
Mega-Cap Tech take-up sq ft

Knight Frank Research Reports are available at KnightFrank.com/Research
RECENT MARKET-LEADING RESEARCH PUBLICATIONS
© HT Meagher O’Reilly trading as Knight FrankThis report is published for general information only and not to be relied upon in any way. Although high standards have been used in the preparation of the information, analysis, views and projections presented in this report, no responsibility or liability whatsoever can be accepted by HT Meagher O’Reilly trading as Knight Frank for any loss or damage resultant from any use of, reliance on or reference to the contents of this document. As a general report, this material does not necessarily represent the view of HT Meagher O’Reilly trading as Knight Frank in relation to particular properties or projects. Reproduction of this report in whole or in part is not allowed without prior written approval of HT Meagher O’Reilly trading as Knight Frank to the form and content within which it appears. HT Meagher O’Reilly trading as Knight Frank, Registered in Ireland No. 385044, PSR Reg. No. 001266. HT Meagher O’Reilly New Homes Limited trading as Knight Frank, Registered in Ireland No. 428289, PSR Reg. No. 001880. Registered Office – 20-21 Upper Pembroke Street, Dublin 2.Dublin Residential
Market Analysis for International Investors
TRENDS ANALYSIS OUTLOOK
INVESTMENT INSIGHT
DUBLINRESIDENTIAL MARKET ANALYSIS FOR INTERNATIONAL INVESTORS
RESEARCH
THE DUBLIN PRS REPORT
OUTLOOKTRENDS ANALYSIS
The Dublin PRS Report
RESEARCH
John Ring, Head of Research +353 1 634 2466 [email protected]
Robert O’Connor, Research Analyst +353 1 634 2466 [email protected]
CAPITAL MARKETS
Adrian Trueick, Director +353 1 634 2466 [email protected]
Peter Flanagan, Director +353 1 634 2466 [email protected]
Ross Fogarty, Director +353 1 634 2466 [email protected]
OFFICES
Declan O’Reilly, Director +353 1 634 2466 [email protected]
Paul Hanly, Director +353 1 634 2466 [email protected]
Jim O’Reilly, Director +353 1 634 2466 [email protected]
Gavin Maguire, Associate Director +353 1 634 2466 [email protected]
Mark Headon, Associate Director +353 1 634 2466 [email protected]
David Reddy, Associate Director +353 1 634 2466 [email protected]
Global Outlook – 2019
GLOBALOUTLOOK
2019
FORECASTS FOR REAL ESTATE IN THE WORLD’S LEADING CITIES.
Dublin Industrial Market – 2018 in Review
RESEARCHDUBLIN INDUSTRIAL MARKET 2018 IN REVIEW
2018 was another strong year for Dublin’s industrial market as 295,480 sq m of space transacted, representing a 17% increase on the 252,452 sq m taken in 2017. Manufacturing activity continued to expand, although at a slower pace, with the Investec Manufacturing Purchasing Manager’s Index reading 54.5 at the end of 2018 compared to 59.1 a year earlier. Interestingly, according to a survey by Eurostat, Ireland has been ranked the highest in Europe for the number of enterprises making online sales for a fourth consecutive year. The importance of online retailing is increasingly challenging existing supply chain networks, and by extension, shaking-up the structure of the logistics market in Ireland.
Looking at activity in more detail, lettings accounted for 71% of deals, while sales made up the remaining
Looking at deals by size, 34% of take-up comprised of less than 2,501 sq m, 19% was between 2,501 sq m and 5,000 sq m, while 17% was between 5,001 sq m and 10,000 sq m. It is interesting to note that 29% of transactions were greater than 10,000 sq m – a more than threefold increase in comparison to the 9% witnessed in 2017. The continuing shortage of space saw prime rents rise to €105 psm at the end of 2018 - up from €100 psm a year earlier - while secondary rents also increased to finish 2018 at between €60-€70 psm, up from €54-€65 psm at the end of 2017.
295,480 sq m of take-up transacted in 2018
FIGURE 3
Take-up by deal size, 2018
Source: Knight Frank Research
29%. In terms of the geographical breakdown, the South-West encompassed 62% of occupier activity, including the top three deals of 2018. The largest of these was the sale of the former Lufthansa Technick facility (20,425 sq m) off the Naas Road. The remaining deals included Units 1 and 3 Cloverhill Industrial Estate (16,889 sq m) and Unit B Mountpark Baldonnell (16,536 sq m) which were let to logistics firm Primeline and homewares retailer Home Store + More respectively.
6%<501 sq m
2910,001+ sq m
8%501-1,000 sq m
20%1,001-2,500 sq m
19%2,501-5,000 sq m
17%5,001-10,000 sq m
%
FIGURE 2
Take-up by location, 2018
Source: Knight Frank Research
62%SOUTH-WEST
31%NORTH-WEST
6%NORTH-EAST
With rents continuing to follow an upward trajectory, a noticeable pick-up in development activity was witnessed in 2018. This included the commencement and delivery of Unit A Mountpark Baldonnell which extends to 11,045 sq m. Construction is underway at the aforementioned Unit B, with
FIGURE 1
Take-up by type, 2018
Source: Knight Frank Research
29%SALES
71%LETTINGS
Units A & B Mountpark Baldonnell, Dublin 22
sq ft at 40 Molesworth Street and 53,507 sq ft at 1 Clarendon Row/Chatham and King respectively.
TECH UNICORNS‘Tech Unicorns’ are start-up companies that have a valuation of $1 billion or more. Typically, these companies are rapidly expanding and expected to go public in the coming years. Irish founded Intercom is one such company and who took 15,145 sq ft at Stephen Court last year, adding to the 50,000 sq ft they took in the same building in 2016. Another Irish company, Stripe, are the largest Fintech Unicorn in the world and have occupied
45,000 sq ft at the One Building on Grand Canal Street since 2015. Newcomers Coinbase entered the Dublin market in 2018, with the crypto currency exchange taking 19,000 sq ft at the Exchange in the IFSC. The largest Tech Unicorn in Dublin is Airbnb and they took 40,000 sq ft in 2018 at The Reflector in Grand Canal Dock, located next to their EMEA HQ which is of a similar size. On a more modest scale, other companies that have taken space in 2018 include Asana, who took 5,200 sq ft at the newly completed Three Park Place. They join fellow Unicorn Slack who took 29,222 sq ft at One Park Place in 2016.
Size Company Primary business line
Market cap/est. value (Bn)*
Approx. space occupied in Dublin
Large-Cap Salesforce CRM €91.5 150,000 sq ft,
commmitted to 430,000 sq ft by 2021
Large-Cap Workday Enterprise resource planning €30.7 170,000 sq ft
Large-Cap Autodesk 3D design software €24.6 48,000 sq ft
Large-Cap Twitter Social media €19.1 85,000 sq ft
Mid-Cap Dropbox Cloud storage €7.3 83,000 sq ft
Mid-Cap Docusign Cybersecurity €5.8 32,000 sq ft
Mid-Cap Zalando E-commerce €5.7 19,000 sq ft
Mid-Cap Zendesk Customer service €5.5 58,000 sq ft
Mid-Cap Hubspot Inbound marketing €4.3 186,000 sq ft
Mid-Cap LogMeIn Remote access work €3.6 40,000 sq ft
Former Unicorn Indeed Jobs portal n/a 211,000 sq ft
Former Unicorn Qualtrics Surveying n/a27,000 sq ft, committed to 54,000 sq ft by 2020
Former Unicorn Jet.com E-commerce n/a 30,000 sq ft
Unicorn Airbnb Rental accomodation €25.5 78,000 sq ft
Unicorn Stripe Fintech €17.7 45,000 sq ft
Unicorn Coinbase Fintech €7.0 19,000 sq ft
Unicorn Slack Work messenger €6.2 29,000 sq ft
Unicorn Asana Project management €1.3 5,000 sq ft
Unicorn Intercom Customer messaging €1.1 65,000 sq ft
Large/Mid-Cap & Unicorn tech firms in central Dublin Arranged by market capitalisation
*Source: Publically listed values from YCharts as at 31/12/2018. Unicorn valuations from CB Insights, January 2019