ducation status report india - education … status...education status report - india 2 ... aser...
TRANSCRIPT
EDUCATION STATUS REPORT - INDIA
PRIMARY, MIDDLE, AND SECONDARY EDUCATION
Prepared by
Anju Gupta, Independent Development Consultant
Catalyst Management Services (CMS) | CEI - India
Education Status Report - India
2
CONTENTS
ABBREVIATIONS…………………………………………………………………………………………………………..3
1. EDUCATION IN INDIA .............................................................................................................................. 5
2. EVOLUTION AND BRIEF ABOUT DIFFERENT EDUCATIONAL PROGRAMME ..................... 5
3. ELEMENTARY EDUCATION IN INDIA ................................................................................................. 9
4. LITERATES (AGE 7 YEARS AND ABOVE) ...................................................................................... 11
5. STATUS OF ELEMENTARY EDUCATION ........................................................................................ 12
6. SEMIS FINDINGS 2010-11…………………………………………………………………………………..19
7. ASER 2012 RURAL ................................................................................................................................. 21
8. BUDGET ALLOCATION UNDER SSA AND RMSA ......................................................................... 24
9. RIGHT TO EDUCATION NORMS ....................................................................................................... 30
10 ARTICLES RELATED TO ELEMENTARY EDUCATION................................................................ 35
Education Status Report - India
3
Abbreviations
ASER Annual Status of Education Report
Avr. Average
BRCs Block Resource Center
CRC Cluster Resource Center
DISE District Information system for Education
DPEP District Primary Education Programme
EBBs Educationally Backward Blocks
ECE Early Childhood Education
EGS Education Guarantee Scheme
Enr. Enrollment
GER Gross Enrollment Ratio
Govt. Government
GPI Gender Parity Index
ICDS Integrated Child Development Scheme
KGBV Kasturba Gandhi Balika Vidyalay
MIS Management Information System
MHRD Ministry of Human Resource Development
NLM National Literacy Mission
NER Net Enrollment Ratio
NPE National Policy of Education
NPEGEL National Program for Education of Girls at Elementary Level
OBC Other Backward Caste
P. Primary
PTR Pupil-Teacher Ratio
Pvt. Private
POA Program of Action
RTE Right To Education
RMSA Rashtriya Madhyamik Shiksha Abhiyan
SC Schedule Caste
Sch. School
SCR Student Class-room ration
SEMIS Secondary Education Management Information System
Education Status Report - India
4
Sec./H.Sec. Secondary/ Higher Secondary
ST Schedule Tribe
SSA Sarva Shiksha Abhiyaan
TLM Teaching learning Material
Unrec. Unrecognized
UP Upper Primary
Education Status Report - India
5
1. Education in India
Education leads to individual freedom and empowerment, which yields significant societal
development gains and makes an individual self-reliant. It is seen as the foundation of society,
enabling economic wealth, social prosperity and political stability. Education is therefore
increasingly being viewed as a fundamental right across the globe and essential for the exercise
of all human rights. All individuals are entitled to education.
Elementary education forms the foundation for all levels of learning and development. It
empowers and equips individuals with analytical capabilities, instills confidence and fortifies
them with determination to achieve goal setting competencies. It therefore plays pivotal role in
improving the socio-economic condition of the nation. For any country to grow, it is imperative
that it has in place a strong elementary school-driven education system.
Education in India is provided by the public sector as well as by the private sector with control
and funding coming from three levels: central, state and local. Education in India falls under
the control of both the Union government and State Government, with some responsibilities
lying with the Union and the states having autonomy for others. India has made progress in
terms of increasing the primary education attendance rate and expanding literacy to
approximately three quarters of the population. India's improved education system is often
cited as one of the main contributors to the economic rise of India. Much of the progress,
especially in higher education and scientific research, has been credited to various public
institutions. The private education market in India was 5% and in terms of value was estimated
to be worth US$40 billion in 2008 but had increased to US$68–70 billion by 2012.
As per the Annual Status of Education Report (ASER) 2012, 96.5% of all rural children between
the ages of 6-14 were enrolled in school. This is the fourth annual survey to report enrollment
above 96%. 83% of all rural 15-16 year olds were enrolled in school. However, going forward,
India will need to focus more on quality.
2. Evolution and brief about different Educational
Programme
In accordance with the Constitutional commitment to ensure free and compulsory education
for all children up to the age of 14 years, provision of universal elementary education has been
a salient feature of national policy since independence. This resolve has been spelt out
emphatically in the National Policy of Education (NPE) and the Programme of Action (POA)
1992. A number of schemes and programmes were launched in pursuance of the emphasis
embodied in the NPE and the POA. These included the various scheme and programs-
Education Status Report - India
6
2.1 National Literacy Mission
National Literacy Mission (NLM) was set up by the government of India on 5 May 1988 with an
aim to eradicate illiteracy in the country by imparting functional literacy to non-literates. Thus,
National Literacy Mission was established not only to make everybody just self reliant in the 3
Rs- reading, writing and arithmetic but also to make them aware of the development issues
affecting the society. The target group of NLM is people between the age of 15 and 35. National
Literate Mission works under the guidance of National Literacy Mission Authority, an
independent wing of Ministry of Human Resources and Development.
The National Literacy Mission has two flagship programs- Total literacy programs and Post
Literacy Programme through which it gives shape to its aims. But with the revitalization of
National Literacy Mission Programme on 30 September 1999, both the campaigns have come
under one single project: 'Literacy Campaigns an Operation Restoration'.
The NLM initiated its first successful literacy campaign in Kottayam city of Kerala followed by
Ernakulam district of the same state. Till November 2002, 596 districts out of the total 600
districts of the country had been covered up by the National Literacy Mission under the total
literacy campaign program. Out of which, 191 was in the post literacy phase and 238 in the
continuing education phase.
The initiation of total literacy campaigns by the National Literacy Mission has achieved due
recognition. The UN agency-UNESCO in year 1999 conferred upon it the UNESCO Noma Literacy
Prize. It also received appreciation of the jury for the teaching learning material produced by it
and for the voice raised by it to increase the quality of primary education in schools.
In achieving its objective of 100 percent literacy, the National Literacy Mission takes the help of
various NGOs existing across the country. For taking active promotional role in the literacy
movement, NGOs are provided financial assistance.
The National Literacy Mission also empowers women of the country by including them into
their total literacy campaigns. If one goes by the 2001 census, then it will become clear that
percentage of female literacy in the country is 54.16. The literacy campaigns undertaken by
NLM not only guides females on how to read and write but also make them aware of the
various social issues in the society. Through education earned in campaigns by NLM, females
find themselves tremendously confident. They run their family in a better way and have a
greater say in the family matters.
For undertaking literacy campaigns across various districts of the country, NLM release funds
for each district. While the ratio between centre and state is 2:1, it is 4: 1 for the tribal sub plan
districts across the country.
2.2 Operation Blackboard
Education Status Report - India
7
Operation Blackboard is a centrally sponsored program which was started in 1987 immediately
after the Rajiv Gandhi NPE of 1986 was released to supply the bare minimum crucial facilities to
all primary schools in the country. The objective of the scheme is providing students studying in
primary settings with the necessary institutional equipment and instructional material to
facilitate their education. There is a provision to provide salary for an additional teacher to
those primary schools that have an enrolment of more 100 students or for a consecutive period
of two years. In the ninth five year plan the scheme was extended to all upper primary schools
as well.
In attempt to improve the implementation of this scheme a few additional provision have been
added. All teachers will be trained in using the materials provided by the scheme under a
particularly designed teacher preparation program. The state will provide for replacement of
broken or non-functioning materials. At the local level, there will be some flexibility for
purchasing additional items and teaching aids, which are applicable to the local situation. At
least fifty percent of the teachers will be women, which in turn will affect the girl enrolment in
school. School building will be designed according to local needs. The central government
provides funds for school equipment and the buildings; the state government also raises funds
through the Jawahar Rojgar Yojna scheme. An amount of Rs. 12.80 lakhs has been spent on the
scheme from 1987 to1994.
2.3 District Primary Education Program
The Centrally Sponsored Scheme of District Primary Education Programme, DPEP was launched
in 1994 as a major initiative to revitalize the primary education system and to achieve the
objective of universalization of primary education. The objectives of the program are
To provide all children with access to Primary Education either in formal system or
through Alternative Schooling Center.
Provides Reading Writing Materials and free textbooks to all SC and ST children and to
girls in general.
Providing Access to Primary Education for all children.
Reducing the Gap among Gender and disadvantaged social groups to less than 5.
Increasing learning achievement of primary school students by 25 percent.
From December 1996 to June 2003, the five districts of Bolangir, Kalahandi, Rayagada, Gajapati
and Dhenkanal came under the first phase. In the second phase from December 1996 to June
2003, the three districts of Bargarh, Keonjhar and Sambalpur were covered and lastly from
Education Status Report - India
8
January 2001 to 2008, Boudh, Kandhamal, Koraput, Malkangiri, Mayurbhanj, Nawarangpur,
Nuapada, Sonepur come under extension districts.
The District Primary Education Programme is one of the home grown innovative educational
programs with three main goals; universal access, retention and achievement. It is an ambitious
national program firmly rooted in the national policy on Education aiming to achieve Education
for All by 2000 A.D. It is a sustainable, cost-effective are replicable one on a national scale. It is
also an exercise in decentralized planning which puts local communities in charge of education.
The districts chosen under it represent those where female literacy is below the national
average of 52.21%.
2.4 Mid Day Meal Program
With a view to enhancing enrolment, retention and attendance and simultaneously improving
nutritional levels among children, the National Programme of Nutritional Support to Primary
Education (NP-NSPE) was launched as a Centrally Sponsored Scheme on 15th August 1995.
In 2001 MDMS became a cooked Mid Day Meal Scheme under which every child in every
Government and Government aided primary school was to be served a prepared Mid Day Meal
with a minimum content of 300 calories of energy and 8-12 gram protein per day for a
minimum of 200 days. The Scheme was further extended in 2002 to cover not only children
studying in Government, Government aided and local body schools, but also children studying
in Education Guarantee Scheme (EGS) and Alternative & Innovative Education (AIE) centres.
In September 2004 the Scheme was revised to provide for Central Assistance for Cooking cost
@ Re 1 per child per school day to cover cost of pulses, vegetables cooking oil, condiments, fuel
and wages and remuneration payable to personnel or amount payable to agency responsible
for cooking. Transport subsidy was also raised from the earlier maximum of Rs 50 per quintal to
Rs. 100 per quintal for special category states and Rs 75 per quintal for other states. Central
assistance was provided for the first time for management, monitoring and evaluation of the
scheme @ 2% of the cost of food grains, transport subsidy and cooking assistance. A provision
for serving mid day meal during summer vacation in drought affected areas was also made.
In July 2006 the Scheme was further revised to enhance the cooking cost to Rs 1.80 per
child/school day for States in the North Eastern Region and Rs 1.50 per child / school day for
other States and UTs. The nutritional norm was revised to 450 Calories and 12 gram of protein.
In order to facilitate construction of kitchen-cum-store and procurement of kitchen devices in
schools provision for Central assistance @ Rs. 60,000 per unit and @ Rs. 5,000 per school in
phased manner were made.
Education Status Report - India
9
In October 2007, the Scheme was extended to cover children of upper primary classes (i.e. class
VI to VIII) studying in 3,479 Educationally Backwards Blocks (EBBs) and the name of the Scheme
was changed from ‘National Programme of Nutritional Support to Primary Education’ to
‘National Programme of Mid Day Meal in Schools’. The nutritional norm for upper primary
stage was fixed at 700 Calories and 20 grams of protein. The Scheme was extended to all areas
across the country from 1.4.2008.
The Scheme was further revised in April 2008 to extend the scheme to recognized as well as
unrecognized Madarsas / Maqtabs supported under SSA.
3. Elementary Education in India
According to the Constitution of India, elementary education is a fundamental right of children
in the age group of 6-14 years. India has about 688,000 primary schools and 110,000 secondary
schools. According to statistics two third of school going age children of India are enrolled in
schools but the figures are deceptive as many don't attend schools regularly. At least half of all
students from rural area drop out before completing school. The government has rolled out
many plans to increase the percentage of elementary education. The plans such as 'Sarva Siksha
Abhiyan (SSA), District Primary Education Program (DPEP), Operation Blackboard, Mid Day Meal
have been successful to great extent.
3.1 Educationally backward blocks
The Ministry of Human Resource Development (MHRD) is implementing various schemes in
Educationally Backward Blocks (EBBs) such as Model Schools, construction of Girls hostel,
Kastruba Gandhi Balika Vidyalay (KGBVs) etc. These EBBs blocks have been identified by
following methodology:
Initially a list of 3073 educational backward blocks (EBBs) was drawn up in connection with the
Sarva Shiksha Abhiyan. This was arrived at on the basis of twin criteria of Female Literacy Rate
being below the national average of 46.13% and Gender Gap in Literacy being above the
national average of 21.59%. Both these criteria had been earmarked by the RGI. Subsequently
this list was expanded to include 406 more blocks, out of which 404 blocks were having rural
FLR of less than 45% irrespective of the Gender Gap. Besides, one SC concentration Block from
West Bengal with SC Rural FLR on 19.81% and one ST concentration block in Orissa with ST rural
FLR of 9.47% were also included, taking the total number of EBBs to 3479.
3.2 Sarva Siksha Abhiyan (SSA)
Education Status Report - India
10
The main goal of this program is that all children of 6-11 years of age should complete primary
education by the year 2007 and all children of 6-14 years of age should complete eight years of
schooling by 2010. This plan covers the whole country with special emphasis on girl education
and education of Schedule Caste (SC) and Schedule Tribe (ST) children and children with special
needs. The SSA centers are mainly opened in those areas, which do not have any school or
where schools are very far off. Special girl oriented programs include:
Girl education at elementary level.
National Program for Education of Girls at Elementary Level (NPEGEL)
Kasturba Gandhi Balika Vidyalaya (KGBV)
Mahila Samakhya Scheme
3.3 Rashtriya Madhyamik Shiksha Abhiyan
This scheme was launched in March, 2009 with the objective to enhance access to secondary
education and to improve its quality. The implementation of the scheme started from 2009-10.
It is envisaged to achieve an enrolment rate of 75% from 52.26% in 2005-06 at secondary stage
within 5 years of implementation of the scheme by providing a secondary school within a
reasonable distance of any habitation. The other objectives include improving quality of
education imparted at secondary level through making all secondary schools conform to
prescribed norms, removing gender, socio-economic and disability barriers, providing universal
access to secondary level education by 2017, i.e., by the end of 12th Five Year Plan and
achieving universal retention by 2020.
The scheme is being implemented by the State government societies established for
implementation of the scheme. The central share is released to the implementing agency
directly. The applicable State share is also released to the implementing agency by the
respective State Governments.
Important physical facilities provided under the scheme are:
(i) Additional class rooms, (ii) Laboratories, (iii) Libraries, (iv) Art and crafts room, (v) Toilet
blocks, (vi) Drinking water provisions and (vii) Residential Hostels for Teachers in remote areas.
Education Status Report - India
11
Important quality interventions provided under the scheme are:
(i) appointment of additional teachers to reduce PTR to 30:1, (ii) focus on Science, Math and
English education, (iii) In-service training of teachers, (iv) science laboratories, (v) ICT enabled
education, (vi) curriculum reforms; and (vii) teaching learning reforms.
Important equity interventions provided in the scheme are:
(i) special focus in micro planning (ii) preference to Ashram schools for upgradation (iii)
preference to areas with concentration of SC/ST/Minority for opening of schools (iv) special
enrolment drive for the weaker section (v) more female teachers in schools; and (vi) separate
toilet blocks for girls.
Financial and Physical Progress under the Scheme
During the 11th Five Year Plan, the Central Government bore 75% of the project expenditure
during the 11th Plan, with the remaining 25% being borne by State Governments. However,
funding pattern was 90:10 for North Eastern States.
4. Literates and Literacy Rate in India
To know development in a society, Literacy is another proper indicator of economic
development. For purpose of census, a person in age limit of seven and above, who can both
write and read with understanding in any of the language is considered as a literate in India.
4.1 Literates (Age 7 years and above)
The number of literates in India is 763.5 million in census 2011. Of this, 482.7 million literates
are in rural areas and 280.8 million literates in urban areas. Out of an increase of 202.8 million
literates during the decade 2001-2011, rural areas accounted for 120.8 million and urban areas
82.0 million. The highest number of rural literates has been recorded in Uttar Pradesh (85.3
million). Maharashtra (40.1 million) has recorded the highest number of literates in urban
areas.
Male literates numbered 434.7 million (56.9% of total literates). The highest number of male
literates in rural areas is returned in Uttar Pradesh (51.8 million), while the lowest are returned
in Lakshadweep (5,949). In urban areas, the lowest number of male literates is returned in
Lakshadweep (22,074) and the highest number in Maharashtra (21.9 million).
Female literates numbered 328.8 million (43.1% of total literates). The highest female literates
in rural areas are returned in Uttar Pradesh (33.5 million), while the lowest are returned in
Education Status Report - India
12
Lakshadweep (5,339). In urban areas, the lowest number of female literates is returned in
Lakshadweep (19,191) and the highest number in Maharashtra (18.2 million).
4.2 Effective literacy rate
The effective literacy rate in India works out to 73.0% (rural-67.8%; urban-84.1%). There has
been increase of 82 percentage points in effective literacy rate (9.1 percentage point in rural
areas and 4.2 percentage points in urban areas) during the last decade.
Male literacy- It works out to 80.9% (rural-77.2%; urban-88.8%). The highest male literacy rate
in rural area is returned in Kerala (95.4%), while the lowest in Arunachal Pradesh (61.4%). In
urban areas, the lowest male literacy rate is returned in Uttar Pradesh (80.4%) and the highest
in Mizoram (98.0%).
Female literacy- It works out to 64.6% (rural-57.9%; urban-79.1%). The highest male literacy
rate in rural area is returned in Kerala (90.8%), while the lowest in Rajasthan (45.8%). In urban
areas, the lowest male literacy rate is returned in Jammu & Kashmir (69.0%) and the highest in
Mizoram (97.3%).
The female literacy rate has increased significantly by 10.9 percentage points in the last decade
(rural-11.8 percentage points and urban-6.2 percentage points). On the other hand, male
literacy rate increased only by 5.6 points (rural 6.5 percent points and urban-2.5 percent
points). It is significant to note that the gap in literacy rate among male and female has reduced
from 21.6 in 2001 to 16.3 in 2011.
5. Status of Elementary Education
The status of elementary education in terms of major educational indicators is given below.
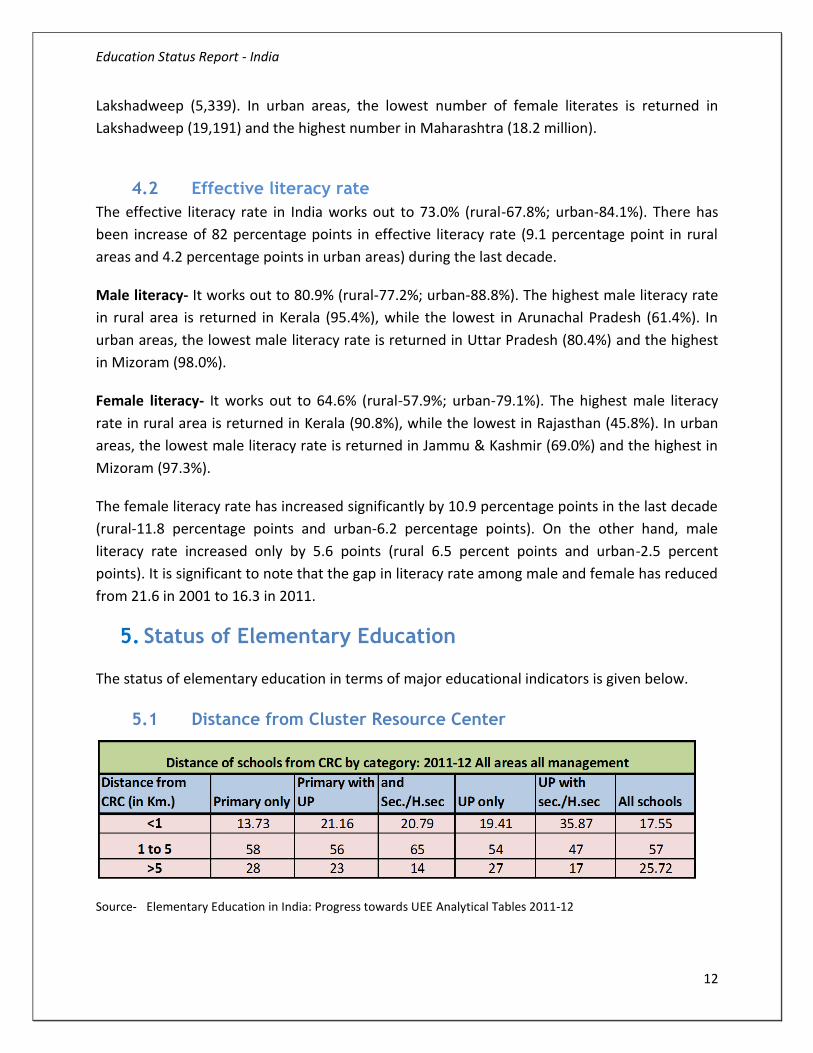
5.1 Distance from Cluster Resource Center
Source- Elementary Education in India: Progress towards UEE Analytical Tables 2011-12
Education Status Report - India
13
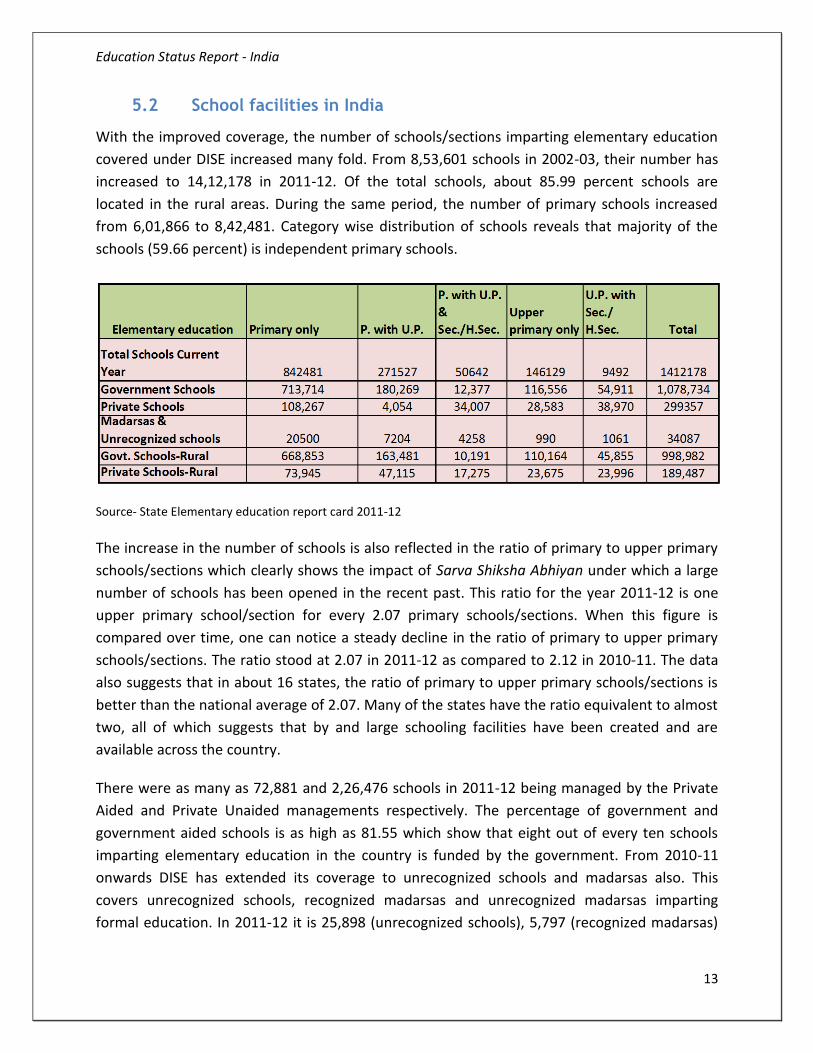
5.2 School facilities in India
With the improved coverage, the number of schools/sections imparting elementary education
covered under DISE increased many fold. From 8,53,601 schools in 2002-03, their number has
increased to 14,12,178 in 2011-12. Of the total schools, about 85.99 percent schools are
located in the rural areas. During the same period, the number of primary schools increased
from 6,01,866 to 8,42,481. Category wise distribution of schools reveals that majority of the
schools (59.66 percent) is independent primary schools.
Source- State Elementary education report card 2011-12
The increase in the number of schools is also reflected in the ratio of primary to upper primary
schools/sections which clearly shows the impact of Sarva Shiksha Abhiyan under which a large
number of schools has been opened in the recent past. This ratio for the year 2011-12 is one
upper primary school/section for every 2.07 primary schools/sections. When this figure is
compared over time, one can notice a steady decline in the ratio of primary to upper primary
schools/sections. The ratio stood at 2.07 in 2011-12 as compared to 2.12 in 2010-11. The data
also suggests that in about 16 states, the ratio of primary to upper primary schools/sections is
better than the national average of 2.07. Many of the states have the ratio equivalent to almost
two, all of which suggests that by and large schooling facilities have been created and are
available across the country.
There were as many as 72,881 and 2,26,476 schools in 2011-12 being managed by the Private
Aided and Private Unaided managements respectively. The percentage of government and
government aided schools is as high as 81.55 which show that eight out of every ten schools
imparting elementary education in the country is funded by the government. From 2010-11
onwards DISE has extended its coverage to unrecognized schools and madarsas also. This
covers unrecognized schools, recognized madarsas and unrecognized madarsas imparting
formal education. In 2011-12 it is 25,898 (unrecognized schools), 5,797 (recognized madarsas)
Education Status Report - India
14
and 2,392 (unrecognized madarsas). The three together contributes to 2.41percent of the total
elementary schools in 2011-12.
A significant achievement seen in most of the new schools that have opened in the recent past
is the presence of a school building. As many as 3, 16,819 new schools have been opened since
2002-03, majority of which are located in the rural areas and 95 percent of these schools have a
school building. During the period 2002-03to 2011-12, as many as 1, 85,965 primary schools
have been opened which is 22.07 percent of the total primary schools in the country. More
than 92 percent of such schools have a building.
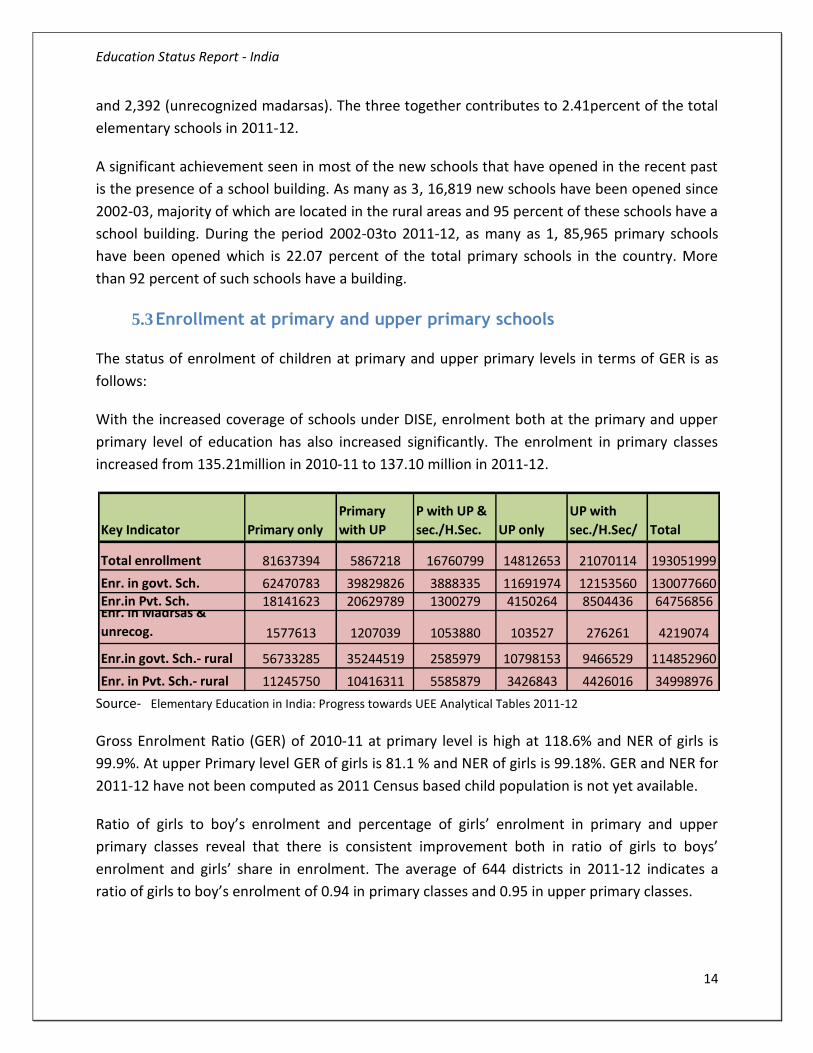
5.3 Enrollment at primary and upper primary schools
The status of enrolment of children at primary and upper primary levels in terms of GER is as
follows:
With the increased coverage of schools under DISE, enrolment both at the primary and upper
primary level of education has also increased significantly. The enrolment in primary classes
increased from 135.21million in 2010-11 to 137.10 million in 2011-12.
Source- Elementary Education in India: Progress towards UEE Analytical Tables 2011-12
Gross Enrolment Ratio (GER) of 2010-11 at primary level is high at 118.6% and NER of girls is
99.9%. At upper Primary level GER of girls is 81.1 % and NER of girls is 99.18%. GER and NER for
2011-12 have not been computed as 2011 Census based child population is not yet available.
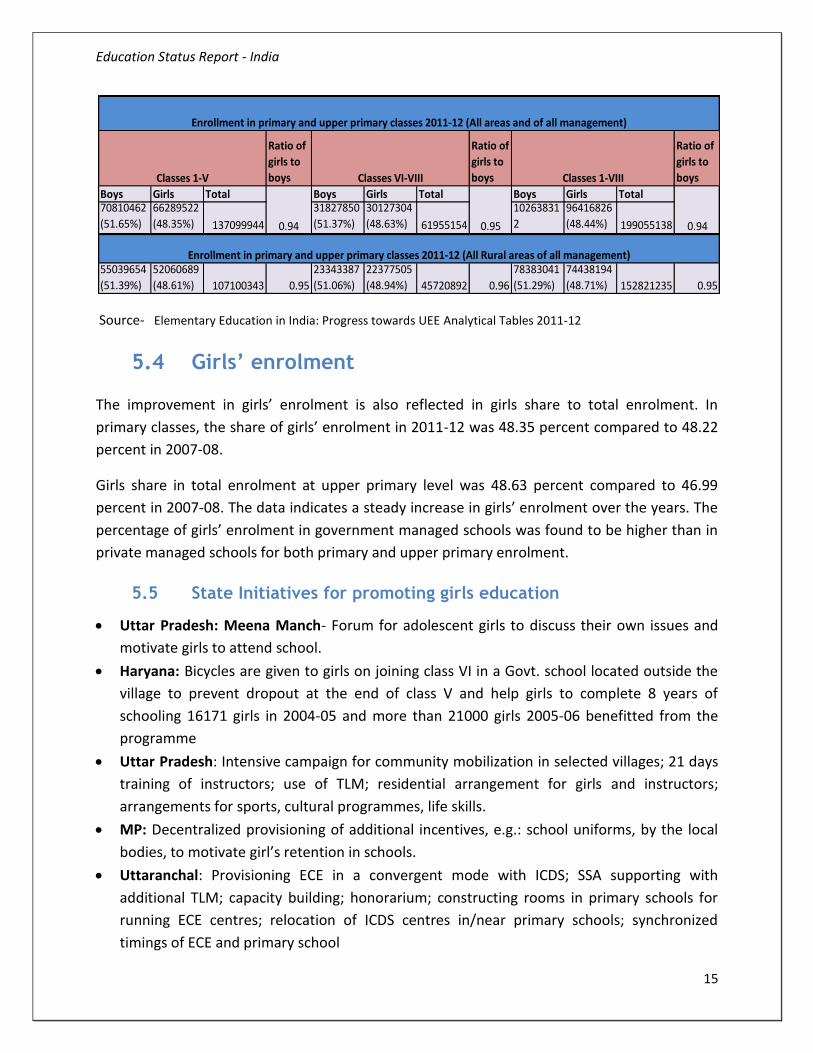
Ratio of girls to boy’s enrolment and percentage of girls’ enrolment in primary and upper
primary classes reveal that there is consistent improvement both in ratio of girls to boys’
enrolment and girls’ share in enrolment. The average of 644 districts in 2011-12 indicates a
ratio of girls to boy’s enrolment of 0.94 in primary classes and 0.95 in upper primary classes.
Key Indicator Primary only
Primary
with UP
P with UP &
sec./H.Sec. UP only
UP with
sec./H.Sec/ Total
Total enrollment 81637394 5867218 16760799 14812653 21070114 193051999
Enr. in govt. Sch. 62470783 39829826 3888335 11691974 12153560 130077660Enr.in Pvt. Sch. 18141623 20629789 1300279 4150264 8504436 64756856Enr. in Madrsas &
unrecog. 1577613 1207039 1053880 103527 276261 4219074
Enr.in govt. Sch.- rural 56733285 35244519 2585979 10798153 9466529 114852960
Enr. in Pvt. Sch.- rural 11245750 10416311 5585879 3426843 4426016 34998976
Education Status Report - India
15
Source- Elementary Education in India: Progress towards UEE Analytical Tables 2011-12
5.4 Girls’ enrolment
The improvement in girls’ enrolment is also reflected in girls share to total enrolment. In
primary classes, the share of girls’ enrolment in 2011-12 was 48.35 percent compared to 48.22
percent in 2007-08.
Girls share in total enrolment at upper primary level was 48.63 percent compared to 46.99
percent in 2007-08. The data indicates a steady increase in girls’ enrolment over the years. The
percentage of girls’ enrolment in government managed schools was found to be higher than in
private managed schools for both primary and upper primary enrolment.
5.5 State Initiatives for promoting girls education
Uttar Pradesh: Meena Manch- Forum for adolescent girls to discuss their own issues and
motivate girls to attend school.
Haryana: Bicycles are given to girls on joining class VI in a Govt. school located outside the
village to prevent dropout at the end of class V and help girls to complete 8 years of
schooling 16171 girls in 2004-05 and more than 21000 girls 2005-06 benefitted from the
programme
Uttar Pradesh: Intensive campaign for community mobilization in selected villages; 21 days
training of instructors; use of TLM; residential arrangement for girls and instructors;
arrangements for sports, cultural programmes, life skills.
MP: Decentralized provisioning of additional incentives, e.g.: school uniforms, by the local
bodies, to motivate girl’s retention in schools.
Uttaranchal: Provisioning ECE in a convergent mode with ICDS; SSA supporting with
additional TLM; capacity building; honorarium; constructing rooms in primary schools for
running ECE centres; relocation of ICDS centres in/near primary schools; synchronized
timings of ECE and primary school
Ratio of
girls to
boys
Ratio of
girls to
boys
Ratio of
girls to
boys
Boys Girls Total Boys Girls Total Boys Girls Total70810462
(51.65%)
66289522
(48.35%) 137099944
31827850
(51.37%)
30127304
(48.63%) 61955154
10263831
2
96416826
(48.44%) 199055138
55039654
(51.39%)
52060689
(48.61%) 107100343 0.95
23343387
(51.06%)
22377505
(48.94%) 45720892 0.96
78383041
(51.29%)
74438194
(48.71%) 152821235 0.95
Enrollment in primary and upper primary classes 2011-12 (All areas and of all management)
Classes 1-V Classes VI-VIII Classes 1-VIII
Enrollment in primary and upper primary classes 2011-12 (All Rural areas of all management)
0.94 0.95 0.94
Ratio of
girls to
boys
enrollment
Ratio of
girls to
boys
enrollment
Ratio of
girls to
boys
enrollme
Boys Girls Total Boys Girls Total Boys Girls Total5318952
(51.16%)
5077665
(48.84%) 10396617
2454037
(49.87%)
2467174
(50.13%) 4921211
(53.10%)7
772989
7544839
(46.90) 15317828
3916829
(50.81%)
3792285
(49.19%) 7709114 0.97
1732658
(49.08%)
1797324
(50.92%) 3529982 1.04
5649487
(50.27%)
5589609(
49.73%) 11239096 0.99
Enrollment in primary and upper primary classes 2011-12 (All rural areas of all management)
Enrollment in primary and upper primary classes 2011-12 (All areas and of all management)
Classes 1-v Classes vi-viii Classes i-viii
0.95 1.01 0.97
Education Status Report - India
16
Orissa – Kalasi Dhara (carrying earthen vessel) - An initiative to mobilise the community
and Mother Teacher Associations to monitor the attendance of teachers and children,
cleanliness of the school compound, regularity of classes being held. The designated
mothers are also required to bring to school those children found to be absent by
motivating their parents etc.
Bihar: Summer Camps for Remedial Teaching, provided to girls.
Madhya Pradesh: Open Learning for many girls who are unable to complete elementary
education due to poor access. A tie up with State Open School where there is a 50:50 cost
sharing between SSA & State Open School for the girls fees.
5.6 Enrolment status of disadvantaged group
During 2006-07 DISE data collection, an attempt was made to collect information on enrolment
of Muslim children for the first time. In 2011-12, the percentage of Muslim enrolment at
primary level is reported to be 13.31 (13.04 in 2010-11) against 11.65 (11.25 in 2010-11) at
upper primary level. The percentage of Muslim girls’ enrolment is as high as 49.17 and 51.31
(GPI, 0.97) at primary and upper primary levels. Preliminary analysis of data suggests that there
are about 68 districts in the country which have 25 percent or more Muslim students in primary
classes. Most of these districts are from the states of Assam, Jammu & Kashmir, Lakshadweep,
Kerala and West Bengal.
At the primary level, the share of SC and ST enrolment with respect to total enrolment works
out to 20.09 and 11.40 percent respectively. At the upper primary level, it was 19.14 percent
and 9.86 percent respectively. Notably, at all levels, government schools are the main providers
of educational needs of both SC and ST children. SC and ST enrolment together had a share of
36.91 and 34.49 percent respectively of the total enrolment in government run primary and
upper primary schools. The share of OBC enrolment in the primary and upper primary classes in
schools across the country was 42.80 and 43.25 percent.
A lot of emphasis is given to include and integrate children with special needs into the
education system. The percentage enrolment of such children was 0.87 at the primary level and
0.83 at the upper primary level. DISE is perhaps the only source that collects information on
disabled children in elementary classes on regular basis by nature of disability. In 2011-12,
about 1.68 million (overall GPI of 0.74) disabled children were enrolled in elementary classes
across the country, of which 1.18 million (GPI, 0.72) were in primary and 0.50 million (GPI, 0.79)
in upper primary classes.
One of the essential requirements to achieve is to retain students in the education system. The
ratio of Grade V to Grade I improved to 86 percent in 2011-12 compared to 82 percent in 2010-
Education Status Report - India
17
11. This is also reflected in the retention rate at primary level which is estimated to be 76
percent.
With improvement in the number of schools, facilities in schools and enrolment, the dropout
rate for 2010-11 indicates an average rate of 6.50 compared to 6.76 percent the previous year
in primary grades. A few states have almost achieved the goal of universal retention at primary
level.
One of the other important indicators that are essential to achieve is a high transition from
primary level to upper primary level of education. It has improved significantly from 64.48
percent in 2002-03 to 87.09 percent in 2010-11. Both Boys and Girls have a similar transition
rate of about 85 percent.
5.7 Teachers in position
Availability of teachers in schools is an important variable for quality education. The total
number of teachers in 2011-12 suggests that about 6.7 million teachers are engaged in
teaching in schools imparting elementary education in the country. The data also shows
appointment of a large number of teachers across the country consequent to the SSA
interventions. All the schools in the country now have an average of 3 and more teachers. The
all India average reveals that, on an average, there were 4.7 teachers in a school in 2011-12
who impart elementary education compared to an average of 3.1 teachers per primary school.
Data shows that female teachers were steadily increasing per year which is about 46 percent of
the total teachers in 2011-12. Urban areas had higher percentage of female teachers at almost
67 percent compared to rural areas at 40 percent. Irrespective of school types, a significant
difference is also noticed in case of female teachers in schools under private (almost 55
percent) and government managements (almost 41 percent). Increase in the number of
teachers is also reflected in the pupil teacher ratio which has shown consistent improvement.
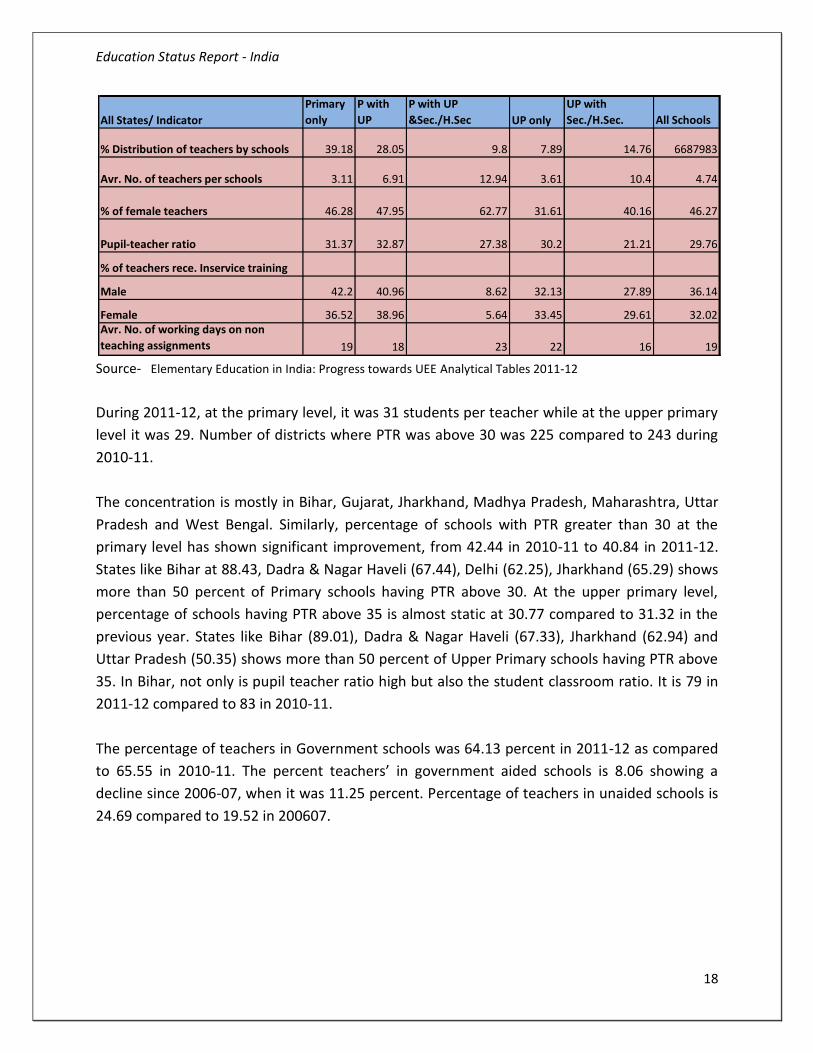
Teacher Related Indicator
Education Status Report - India
18
Source- Elementary Education in India: Progress towards UEE Analytical Tables 2011-12
During 2011-12, at the primary level, it was 31 students per teacher while at the upper primary
level it was 29. Number of districts where PTR was above 30 was 225 compared to 243 during
2010-11.
The concentration is mostly in Bihar, Gujarat, Jharkhand, Madhya Pradesh, Maharashtra, Uttar
Pradesh and West Bengal. Similarly, percentage of schools with PTR greater than 30 at the
primary level has shown significant improvement, from 42.44 in 2010-11 to 40.84 in 2011-12.
States like Bihar at 88.43, Dadra & Nagar Haveli (67.44), Delhi (62.25), Jharkhand (65.29) shows
more than 50 percent of Primary schools having PTR above 30. At the upper primary level,
percentage of schools having PTR above 35 is almost static at 30.77 compared to 31.32 in the
previous year. States like Bihar (89.01), Dadra & Nagar Haveli (67.33), Jharkhand (62.94) and
Uttar Pradesh (50.35) shows more than 50 percent of Upper Primary schools having PTR above
35. In Bihar, not only is pupil teacher ratio high but also the student classroom ratio. It is 79 in
2011-12 compared to 83 in 2010-11.
The percentage of teachers in Government schools was 64.13 percent in 2011-12 as compared
to 65.55 in 2010-11. The percent teachers’ in government aided schools is 8.06 showing a
decline since 2006-07, when it was 11.25 percent. Percentage of teachers in unaided schools is
24.69 compared to 19.52 in 200607.
All States/ Indicator
Primary
only
P with
UP
P with UP
&Sec./H.Sec UP only
UP with
Sec./H.Sec. All Schools
% Distribution of teachers by schools 39.18 28.05 9.8 7.89 14.76 6687983
Avr. No. of teachers per schools 3.11 6.91 12.94 3.61 10.4 4.74
% of female teachers 46.28 47.95 62.77 31.61 40.16 46.27
Pupil-teacher ratio 31.37 32.87 27.38 30.2 21.21 29.76
% of teachers rece. Inservice training
Male 42.2 40.96 8.62 32.13 27.89 36.14
Female 36.52 38.96 5.64 33.45 29.61 32.02Avr. No. of working days on non
teaching assignments 19 18 23 22 16 19
Education Status Report - India
19
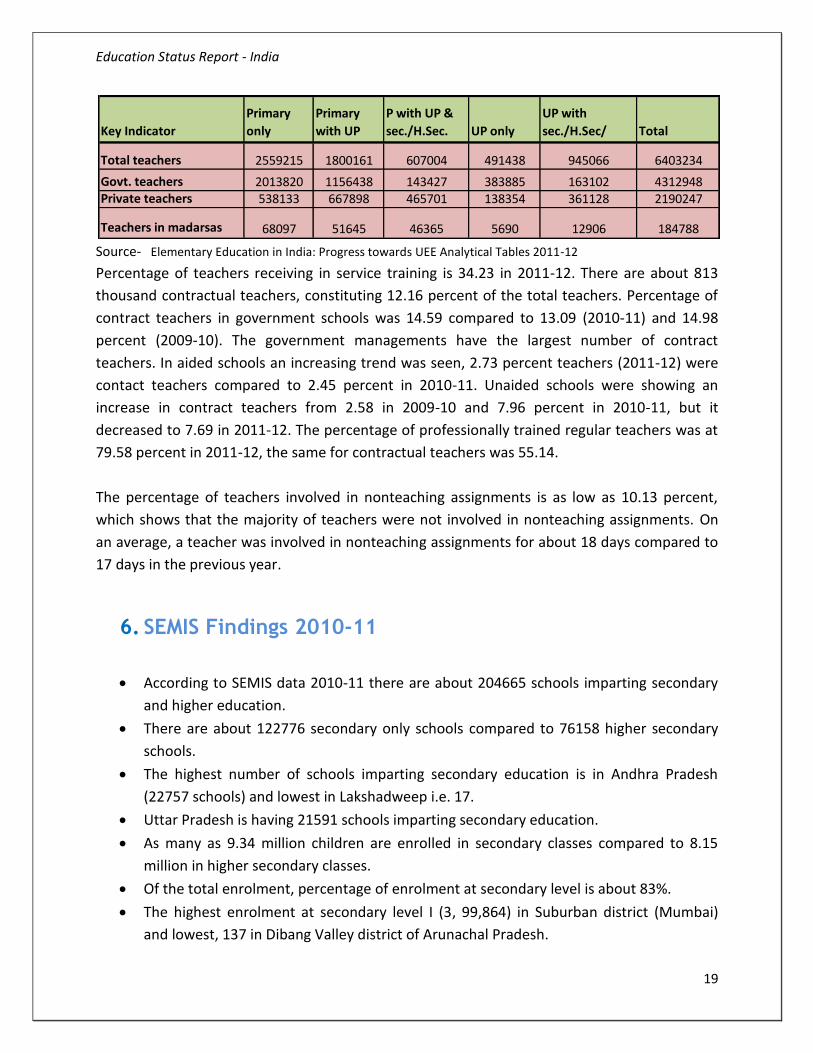
Source- Elementary Education in India: Progress towards UEE Analytical Tables 2011-12
Percentage of teachers receiving in service training is 34.23 in 2011-12. There are about 813
thousand contractual teachers, constituting 12.16 percent of the total teachers. Percentage of
contract teachers in government schools was 14.59 compared to 13.09 (2010-11) and 14.98
percent (2009-10). The government managements have the largest number of contract
teachers. In aided schools an increasing trend was seen, 2.73 percent teachers (2011-12) were
contact teachers compared to 2.45 percent in 2010-11. Unaided schools were showing an
increase in contract teachers from 2.58 in 2009-10 and 7.96 percent in 2010-11, but it
decreased to 7.69 in 2011-12. The percentage of professionally trained regular teachers was at
79.58 percent in 2011-12, the same for contractual teachers was 55.14.
The percentage of teachers involved in nonteaching assignments is as low as 10.13 percent,
which shows that the majority of teachers were not involved in nonteaching assignments. On
an average, a teacher was involved in nonteaching assignments for about 18 days compared to
17 days in the previous year.
6. SEMIS Findings 2010-11
According to SEMIS data 2010-11 there are about 204665 schools imparting secondary
and higher education.
There are about 122776 secondary only schools compared to 76158 higher secondary
schools.
The highest number of schools imparting secondary education is in Andhra Pradesh
(22757 schools) and lowest in Lakshadweep i.e. 17.
Uttar Pradesh is having 21591 schools imparting secondary education.
As many as 9.34 million children are enrolled in secondary classes compared to 8.15
million in higher secondary classes.
Of the total enrolment, percentage of enrolment at secondary level is about 83%.
The highest enrolment at secondary level I (3, 99,864) in Suburban district (Mumbai)
and lowest, 137 in Dibang Valley district of Arunachal Pradesh.
Key Indicator
Primary
only
Primary
with UP
P with UP &
sec./H.Sec. UP only
UP with
sec./H.Sec/ Total
Total teachers 2559215 1800161 607004 491438 945066 6403234
Govt. teachers 2013820 1156438 143427 383885 163102 4312948Private teachers 538133 667898 465701 138354 361128 2190247
Teachers in madarsas 68097 51645 46365 5690 12906 184788
Education Status Report - India
20
The highest enrolment at higher secondary level is 1, 70,906 in Suburban district
(Mumbai) and lowest, 110 in Dibang Valley district of Arunachal Pradesh.
Percentage of girls enrolment at secondary level is 46.59% compared to 45.47% at
higher secondary level.
The highest percentage of girl’s enrolment at secondary level is in Jaintia Hills district of
Meghalaya (58.59%) and lowest, 22.74% in Jaisalmer district of Rajasthan.
The highest number of higher secondary schools, 1233 is in Jaipur district and lowest, 2
are in Arunachal Pradesh.
GPI in enrolment at secondary level is 0.87 as compared to 0.83 at higher secondary
level.
PTR in secondary schools is 17% as compared to 57% in higher secondary school.
SCR in secondary schools is 59% as compared to 57% in higher secondary schools.
Percentage of female teacher at secondary level is 36.85% as compared to 38.02 at
higher secondary level.
Education Status Report - India
21
7. ASER 2012 Rural
ASER is the largest annual household survey of children in rural India that focuses on the status
of schooling and basic learning. Facilitated by Pratham, in each rural district ASER is conducted
by local organizations, institutions and concerned citizens. ASER 2012 reached 567 districts,
more than 16,166 villages, 331,881 households and 5, 96,846 children in the age 3-16.
Every year, ASER finds out whether children in rural India go to school, whether they can read
simple text and whether they can do basic arithmetic. Since 2009, ASER has also included a visit
to one government school in each sampled village. Since the implementation of the RTE Act in
2010, school visits in ASER have included indicators of compliance with those norms and
standards specified in the Right to Education Act that are easy to measure. In 2012, ASER visited
almost 14,600 government schools.
7.1 Key Findings
Enrollment in the 6-14 age groups continues to be very high. But the proportion of out of
school children has increased, especially among girls in the age group of 11 to 14.
Overall, enrollment numbers remain very high. Over 96% of all children in the age group
6 to 14 years are enrolled in school. This is the fourth consecutive year that enrollment
levels have been 96% or more.
Nationally, the proportion of children (age 6 to 14) who are not enrolled in school has
gone slightly up, from 3.3% in 2011 to 3.5% in 2012. A slight increase is seen for all age
groups and for both boys and girls.
Girls in the age group of 11 to 14 years are often the hardest to bring to school and keep
in school. In 2006, in eight major states, more than 11% girls in this age group were not
enrolled in school. By 2011, this figure had dropped to less than 6.5% in 3 of these states
(Jharkhand, Gujarat and Odisha) and less than 5% in 3 others (Bihar, Chhattisgarh and
West Bengal). The situation in these states remained more or less unchanged in 2012.
However in Rajasthan and Uttar Pradesh, the proportion of out of school girls (age 11-
14) has increased from 8.9% and 9.7% respectively in 2011 to more than 11% in 2012.
Reading levels continue to be a cause for serious concern. More than half of all children in
Std. V are at least three grade levels behind where they should be.
In 2010 nationally, 46.3% of all children in Std. V could not read a Std. II level text. This
proportion increased to 51.8% in 2011 and further to 53.2% in 2012. For Std. V children
Education Status Report - India
22
enrolled in government schools, the percentage of children unable to read Std. II level
text has increased from 49.3% (2010) to 56.2% (2011) to 58.3% (2012).
For all children in Std. V, the major decline in reading levels (of 5 percentage points or
more) between 2011 and 2012 is seen in Haryana, Bihar, Madhya Pradesh, Maharashtra
and Kerala. Even private schools in Maharashtra and Kerala, with a large proportion of
aided schools, show a decline in reading ability for Std. V.
The percentage of all children enrolled in Std. III who cannot read a Std. I level text has
increased steadily from 53.4% (2009) to 54.4% (2010) to 59.7% (2011) to 61.3% in 2012.
For children enrolled in government schools, this figure has increased from 57.6% in
2010 to 64.8% in 2011 to 67.7% in 2012.
2012 was the year of mathematics. But it has been a bad year for basic arithmetic for children
in India.
In 2010, of all children enrolled in Std. V, 29.1% could not solve simple two-digit
subtraction problems with borrowing. This proportion increased to 39% in 2011 and
further to 46.5% in 2012. Barring Andhra Pradesh, Karnataka and Kerala, every major
state shows signs of a substantial drop in arithmetic learning levels.
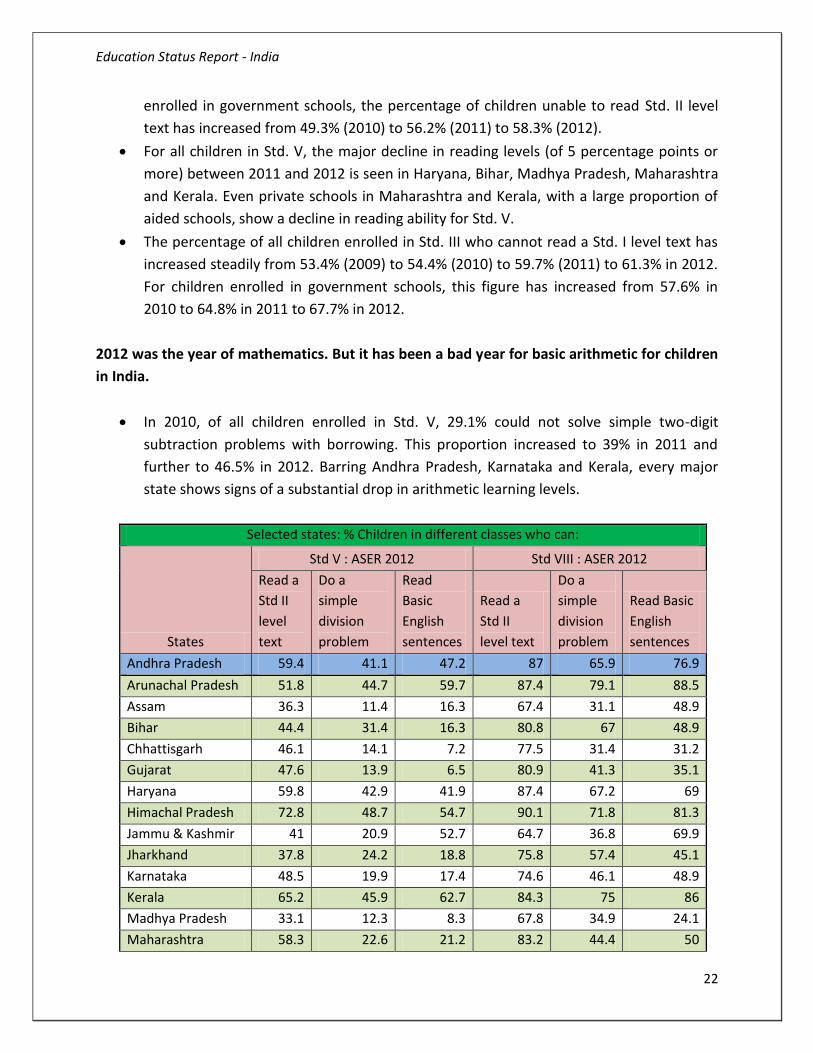
Selected states: % Children in different classes who can:
States
Std V : ASER 2012 Std VIII : ASER 2012
Read a
Std II
level
text
Do a
simple
division
problem
Read
Basic
English
sentences
Read a
Std II
level text
Do a
simple
division
problem
Read Basic
English
sentences
Andhra Pradesh 59.4 41.1 47.2 87 65.9 76.9
Arunachal Pradesh 51.8 44.7 59.7 87.4 79.1 88.5
Assam 36.3 11.4 16.3 67.4 31.1 48.9
Bihar 44.4 31.4 16.3 80.8 67 48.9
Chhattisgarh 46.1 14.1 7.2 77.5 31.4 31.2
Gujarat 47.6 13.9 6.5 80.9 41.3 35.1
Haryana 59.8 42.9 41.9 87.4 67.2 69
Himachal Pradesh 72.8 48.7 54.7 90.1 71.8 81.3
Jammu & Kashmir 41 20.9 52.7 64.7 36.8 69.9
Jharkhand 37.8 24.2 18.8 75.8 57.4 45.1
Karnataka 48.5 19.9 17.4 74.6 46.1 48.9
Kerala 65.2 45.9 62.7 84.3 75 86
Madhya Pradesh 33.1 12.3 8.3 67.8 34.9 24.1
Maharashtra 58.3 22.6 21.2 83.2 44.4 50
Education Status Report - India
23
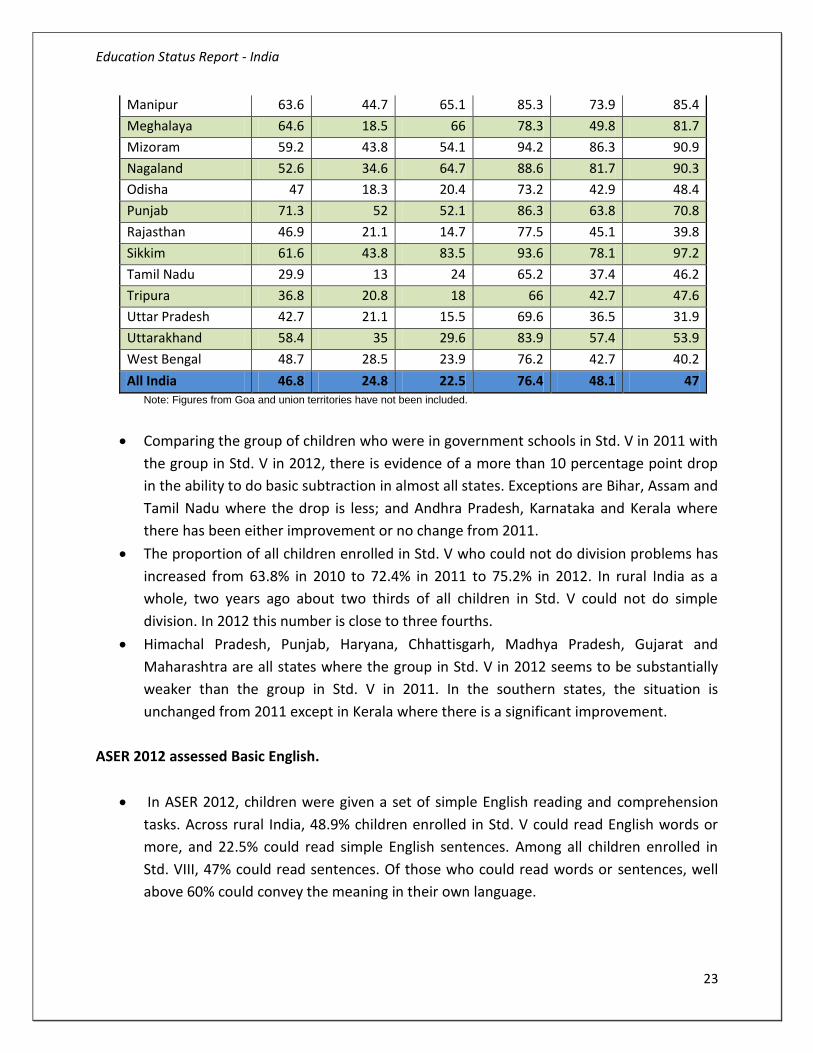
Manipur 63.6 44.7 65.1 85.3 73.9 85.4
Meghalaya 64.6 18.5 66 78.3 49.8 81.7
Mizoram 59.2 43.8 54.1 94.2 86.3 90.9
Nagaland 52.6 34.6 64.7 88.6 81.7 90.3
Odisha 47 18.3 20.4 73.2 42.9 48.4
Punjab 71.3 52 52.1 86.3 63.8 70.8
Rajasthan 46.9 21.1 14.7 77.5 45.1 39.8
Sikkim 61.6 43.8 83.5 93.6 78.1 97.2
Tamil Nadu 29.9 13 24 65.2 37.4 46.2
Tripura 36.8 20.8 18 66 42.7 47.6
Uttar Pradesh 42.7 21.1 15.5 69.6 36.5 31.9
Uttarakhand 58.4 35 29.6 83.9 57.4 53.9
West Bengal 48.7 28.5 23.9 76.2 42.7 40.2
All India 46.8 24.8 22.5 76.4 48.1 47 Note: Figures from Goa and union territories have not been included.
Comparing the group of children who were in government schools in Std. V in 2011 with
the group in Std. V in 2012, there is evidence of a more than 10 percentage point drop
in the ability to do basic subtraction in almost all states. Exceptions are Bihar, Assam and
Tamil Nadu where the drop is less; and Andhra Pradesh, Karnataka and Kerala where
there has been either improvement or no change from 2011.
The proportion of all children enrolled in Std. V who could not do division problems has
increased from 63.8% in 2010 to 72.4% in 2011 to 75.2% in 2012. In rural India as a
whole, two years ago about two thirds of all children in Std. V could not do simple
division. In 2012 this number is close to three fourths.
Himachal Pradesh, Punjab, Haryana, Chhattisgarh, Madhya Pradesh, Gujarat and
Maharashtra are all states where the group in Std. V in 2012 seems to be substantially
weaker than the group in Std. V in 2011. In the southern states, the situation is
unchanged from 2011 except in Kerala where there is a significant improvement.
ASER 2012 assessed Basic English.
In ASER 2012, children were given a set of simple English reading and comprehension
tasks. Across rural India, 48.9% children enrolled in Std. V could read English words or
more, and 22.5% could read simple English sentences. Among all children enrolled in
Std. VIII, 47% could read sentences. Of those who could read words or sentences, well
above 60% could convey the meaning in their own language.
Education Status Report - India
24
8. Budget Allocation under SSA and RMSA
8.1 Budget 2012-13 under SSA
Education has been allocated Rs. 65,867 crore, an increase of 17 per cent over the RE for 2012-
13. Right to Education (RTE)- Sarva Shiksha Abhiyan (SSA) received Rs 25, 555 crore allocation,
showing an increase of 21.7%; while a 29% increase for Rashtriya Madhyamik Shiksha Abhiyan
making it Rs 3,124 crore.
As proposed, 6000 schools will be set up at block level as model schools in the 12th Five Year
Plan. Besides, a Credit Guarantee Fund announced to be set up for better flow of credit to
students.
"In the 12th Plan, 6,000 schools have been proposed to be set-up at block level as model
schools to benchmark excellence. Of these, 2,500 will be set up under public-private-
partnership (PPP)."
An allocation of Rs 15, 850 crore was made for Integrated Child Development Services (ICDS)
scheme, an increase of 58% and Rs 13,215 crore for National Programme of Mid-Day Meals in
schools for the year 2012-13.
8.2 Budget 2012-13 under RMSA
In 2012-13, Rs 3,124 crore has been allocated for Rastriya Madhyamik Shiksha Abhiyan
(RMSA), which is nearly 29 per cent higher than the allocation in 2011-12. The Rashtriya
Madhyamik Shiksha Abhiyan (RMSA) was launched in March, 2009 to enhance access to
quality secondary education.
The budget also allocated Rs.49, 659 crore to the school education sector that caters to
over 230 million students. The sector got a moderate Rs.3, 690-crore hike from the
previous budget estimate. This comprises the SSA allocation, Rs.13, 215 crore for the
mid-day meal scheme and Rs.3, 983 crore for the Rashtriya Madhyamik Shiksha Abhiyan
(RMSA), a scheme to universalize secondary education and curb the high drop-out rate.
For higher education, the finance minister pegged an allocation of Rs.16, 210 crore for
2013-14 against an allocation of Rs.15, 458 crore in the budget estimate for 2012-13.
During the 11th Five Year Plan, the Central Government bore 75% of the project
expenditure during the 11th Plan, with the remaining 25% being borne by State
Governments. However, funding pattern was 90:10 for North Eastern States.
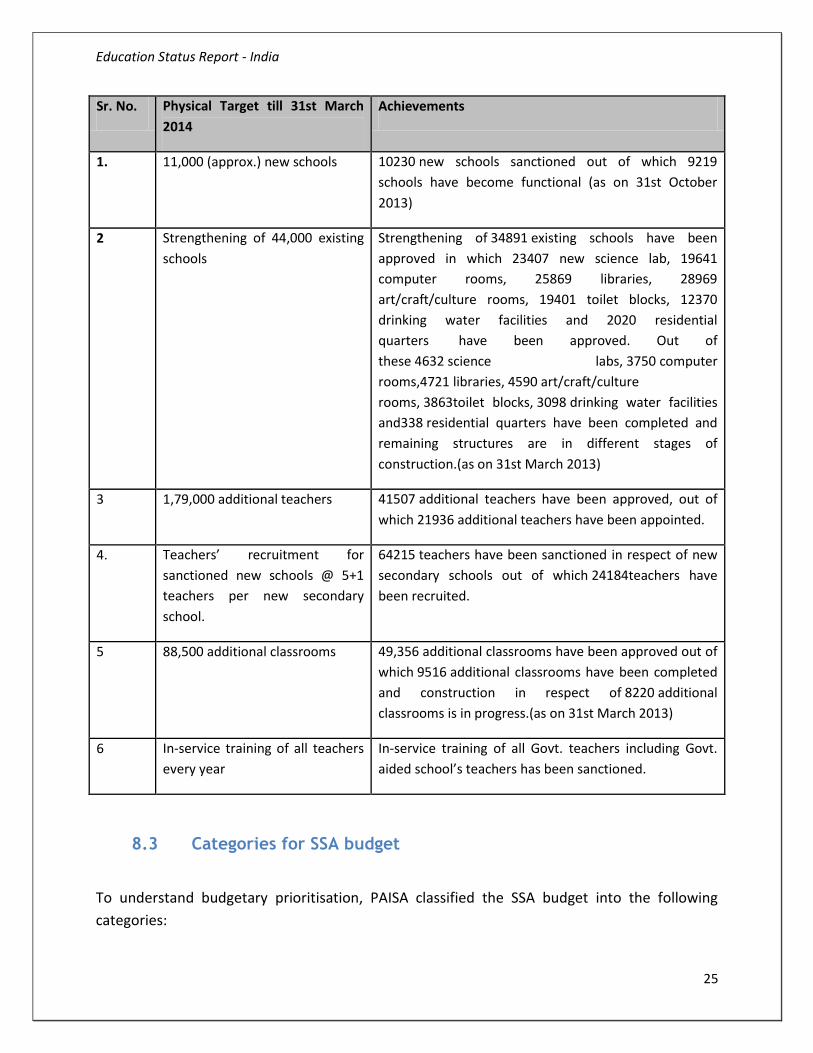
Physical Target and Achievements under RMSA
Education Status Report - India
25
Sr. No. Physical Target till 31st March
2014
Achievements
1. 11,000 (approx.) new schools 10230 new schools sanctioned out of which 9219
schools have become functional (as on 31st October
2013)
2 Strengthening of 44,000 existing
schools
Strengthening of 34891 existing schools have been
approved in which 23407 new science lab, 19641
computer rooms, 25869 libraries, 28969
art/craft/culture rooms, 19401 toilet blocks, 12370
drinking water facilities and 2020 residential
quarters have been approved. Out of
these 4632 science labs, 3750 computer
rooms,4721 libraries, 4590 art/craft/culture
rooms, 3863toilet blocks, 3098 drinking water facilities
and338 residential quarters have been completed and
remaining structures are in different stages of
construction.(as on 31st March 2013)
3 1,79,000 additional teachers 41507 additional teachers have been approved, out of
which 21936 additional teachers have been appointed.
4. Teachers’ recruitment for
sanctioned new schools @ 5+1
teachers per new secondary
school.
64215 teachers have been sanctioned in respect of new
secondary schools out of which 24184teachers have
been recruited.
5 88,500 additional classrooms 49,356 additional classrooms have been approved out of
which 9516 additional classrooms have been completed
and construction in respect of 8220 additional
classrooms is in progress.(as on 31st March 2013)
6 In-service training of all teachers
every year
In-service training of all Govt. teachers including Govt.
aided school’s teachers has been sanctioned.
8.3 Categories for SSA budget
To understand budgetary prioritisation, PAISA classified the SSA budget into the following
categories:
Education Status Report - India
26
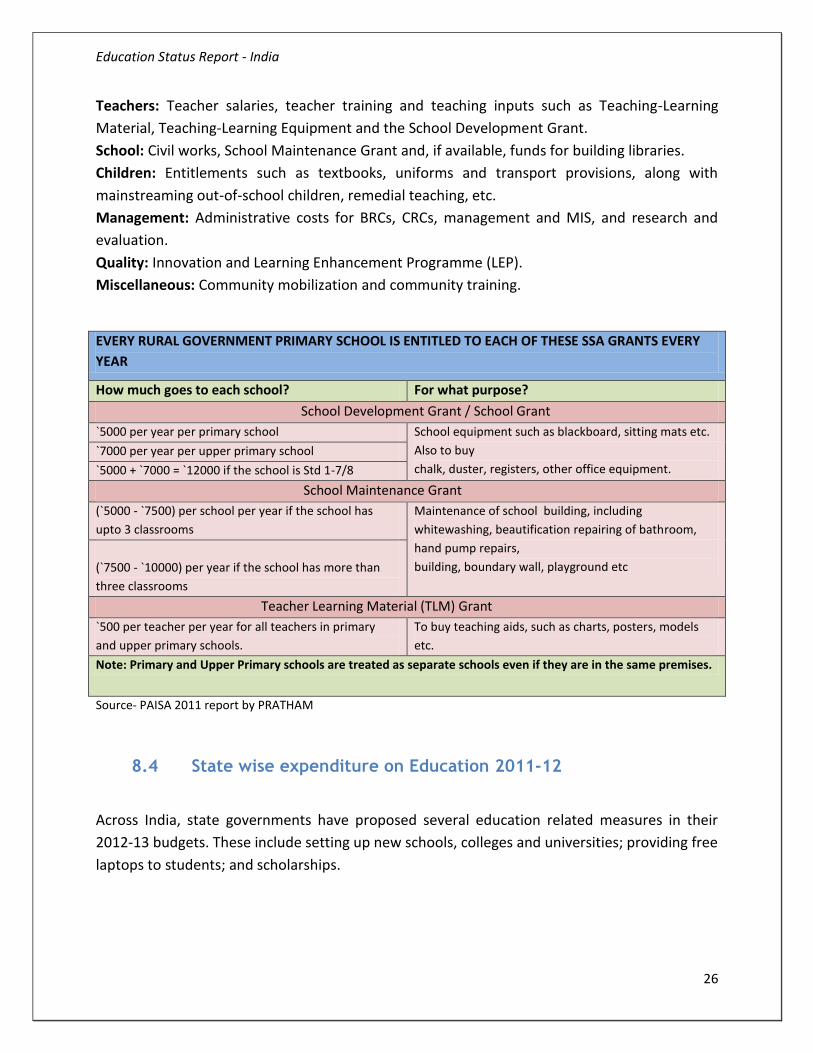
Teachers: Teacher salaries, teacher training and teaching inputs such as Teaching-Learning
Material, Teaching-Learning Equipment and the School Development Grant.
School: Civil works, School Maintenance Grant and, if available, funds for building libraries.
Children: Entitlements such as textbooks, uniforms and transport provisions, along with
mainstreaming out-of-school children, remedial teaching, etc.
Management: Administrative costs for BRCs, CRCs, management and MIS, and research and
evaluation.
Quality: Innovation and Learning Enhancement Programme (LEP).
Miscellaneous: Community mobilization and community training.
EVERY RURAL GOVERNMENT PRIMARY SCHOOL IS ENTITLED TO EACH OF THESE SSA GRANTS EVERY
YEAR
How much goes to each school? For what purpose?
School Development Grant / School Grant
`5000 per year per primary school School equipment such as blackboard, sitting mats etc.
Also to buy
chalk, duster, registers, other office equipment.
`7000 per year per upper primary school
`5000 + `7000 = `12000 if the school is Std 1-7/8
School Maintenance Grant
(`5000 - `7500) per school per year if the school has
upto 3 classrooms
Maintenance of school building, including
whitewashing, beautification repairing of bathroom,
hand pump repairs,
building, boundary wall, playground etc
(`7500 - `10000) per year if the school has more than
three classrooms
Teacher Learning Material (TLM) Grant
`500 per teacher per year for all teachers in primary
and upper primary schools.
To buy teaching aids, such as charts, posters, models
etc.
Note: Primary and Upper Primary schools are treated as separate schools even if they are in the same premises.
Source- PAISA 2011 report by PRATHAM
8.4 State wise expenditure on Education 2011-12
Across India, state governments have proposed several education related measures in their
2012-13 budgets. These include setting up new schools, colleges and universities; providing free
laptops to students; and scholarships.
Education Status Report - India
27
Taken together, states are estimated to spend Rs 2.6 lakh crore, a 13% increase over 2011-12.
But education expenditure as a proportion of aggregate expenditure has remained almost
identical at around 16.5%.
The largest allocation to education comes in Assam (21.1%) while the lowest is in Arunachal
Pradesh (8.3%). The biggest increase in allocation is in Bihar, almost a 3% increase from 16.6%
to 19.5%. In Tripura, education spending has decreased by 3.4% to 13.8% making it the largest
reduction.
8.5 The Budget Analysis 2013-14 (Elementary Education)
The budget proposes a fund outflow of Rs 65,867 crore for education in 2013-14, against
Rs. 61,427 crore in 2012-13. Only 17% increase from the current fiscal’s estimates
against 18% hike in the budget spending that was last year and 24 % in the year 2011-
12. A decrease of 1%.
The school education, with an enrollment of more than 220 million, has been allocated
Rs 49659 crore against Rs 45,969 crore last year. Higher education has received an
outlay of Rs 16198 crore, up from 15,458 crore last year.
The total education outlay, including Plan and non-Plan allocation, has rose to only 7.3%
to Rs. 79451 crore in 2013-14 from Rs 74056 crore in the 2012-13 fiscal year. Last year it
was 17%.
Though there has been a double-digit increase in budgetary allocation but it is still short
of the long due 6% investment of GDP on education.
The amount of allocation also raises concern over the quality of India’s education
system in the long term.
Though the RTE-SSA is representing only an increase of 15.74% with a allocation of Rs
27, 258 Rs. over 2012-13 (of Rs. 23,555 crore) but is the amount enough which
continues to see funding challenges along with other conceptual and implementation
hurdles. Last year (2012-13) there was a 21.7% increase in the allocation for RTE-SSA
over its previous year (2011-2012) and prior to that it was 40%.
To further enhance enrolment, retention, attendance, and also help in improving
nutrition levels among children for the National Programme of Mid Day Meals in Schools
in 2013-14, Rs 13215 crore has been allocated as against Rs. 11,937 in 2012-13.
Various scholarship schemes for students belonging to SC, STs, and disadvantaged
classes. Rs 5,284 crore would be allocated to various ministries for scholarships for
SC/ST, OBC and minority students against Rs 4575 crore last year.
Education Status Report - India
28
An allocation of Rs. 7,710.00 crore has been made for Secondary Education. This
includes allocation, inter-alia, of Rs. 1,250.00 crore for Navodaya Vidyalaya Samiti and
Rs 350.00 crore for Kendriya Vidyalaya Sangathan.
In view of large number of students completing upper primary level, to meet the growth
in demand for secondary education, as a major policy initiative, the budget has
proposed a fund of Rs 3983 crore, an increase of 25.6 % for the Rashtriya Madhyamik
Shiksha Abhiyan. Last year the increase was 29%.
A provision of Rs 1,000.00 crore has been made for starting 6,000 Model Schools at
Block level as Benchmark of Excellence; Rs. 450.00 crore has been provided for
construction and running of Girls Hostels for students of Secondary and Higher
Secondary Schools. An outlay of Rs. 70.00 crore has been kept for disbursing 1, 00,000
scholarship to students in Classes IX to XII under the National Means-cum- Merit
Scholarship Scheme.
There has been significant focus and also growth in higher and technical education in
order to achieve the targeted GRE of 30% but the main area of concern is the manpower
crisis that higher education is facing and need is to ensure quality teachers. There has
been no mention as to how be it possible to bring in good quality faculty for the new
institutions. The most important factor that drives the education sector is the teaching
faculty. Govt. should take steps to get the best teachers.
An allocation of Rs. 683.00 crore has been made for Adult Education. This allocation,
inter-alia, includes allocation of `572.00 crore for Adult Education and Skill Development
for Saakshar Bharat.
The attention and allocation for skill development is a positive move for the next decade
and subsequent budgets must build on it.
But there is lack of emphasis in terms of school improvement, quality control etc- given
that this sector in education has to be strengthened in order to prepare the skilled and
innovative workforce of 2025.
In India only about 5% of students have access to any vocational training as compared to
about 60% in developed countries. It is seen that students graduating from universities
rarely possess the skills required for the workplace. In this context universalizing access
to secondary education, increasing percentage of our scholars in higher education and
providing skills training is necessary.
Overall, the budget has not been as it was expected and it is still silent on the passage of
all pending higher education Bills.
The important step in making India a knowledge economy is to provide access equitably
with quality. The total amount spent on education is still less than 6% percent of GDP.
This needs to go beyond 8 percent of GDP. Need is to create an environment where
private participation come in a big way in an environment where they are given tax
Education Status Report - India
29
breaks and incentives. After all, education is associated with better skills, higher
productivity and enhanced human capacity to improve the quality of life. With 17
percent of the world population we could be a powerhouse of Human Capital, provided
we make them 'employable'.
Education Status Report - India
30
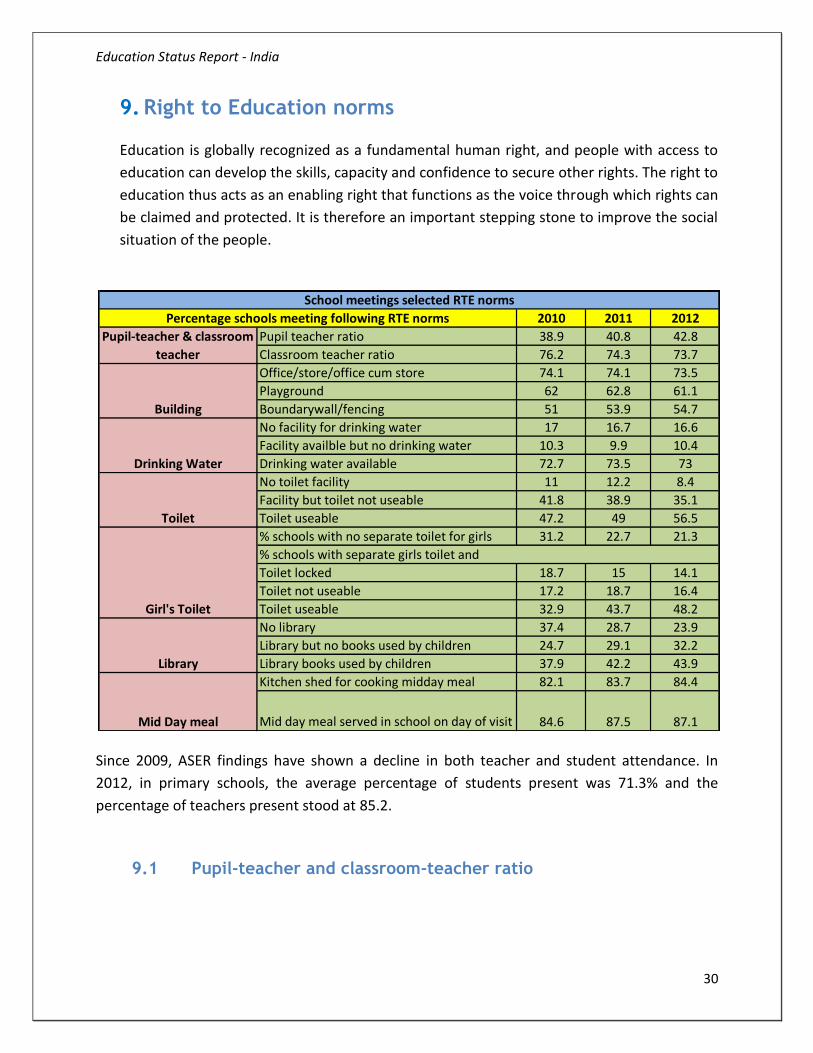
9. Right to Education norms
Education is globally recognized as a fundamental human right, and people with access to
education can develop the skills, capacity and confidence to secure other rights. The right to
education thus acts as an enabling right that functions as the voice through which rights can
be claimed and protected. It is therefore an important stepping stone to improve the social
situation of the people.
Since 2009, ASER findings have shown a decline in both teacher and student attendance. In
2012, in primary schools, the average percentage of students present was 71.3% and the
percentage of teachers present stood at 85.2.
9.1 Pupil-teacher and classroom-teacher ratio
2010 2011 2012
Pupil teacher ratio 38.9 40.8 42.8
Classroom teacher ratio 76.2 74.3 73.7
Office/store/office cum store 74.1 74.1 73.5
Playground 62 62.8 61.1
Boundarywall/fencing 51 53.9 54.7
No facility for drinking water 17 16.7 16.6
Facility availble but no drinking water 10.3 9.9 10.4
Drinking water available 72.7 73.5 73
No toilet facility 11 12.2 8.4
Facility but toilet not useable 41.8 38.9 35.1
Toilet useable 47.2 49 56.5
% schools with no separate toilet for girls 31.2 22.7 21.3
% schools with separate girls toilet and
Toilet locked 18.7 15 14.1
Toilet not useable 17.2 18.7 16.4
Toilet useable 32.9 43.7 48.2
No library 37.4 28.7 23.9
Library but no books used by children 24.7 29.1 32.2
Library books used by children 37.9 42.2 43.9
Kitchen shed for cooking midday meal 82.1 83.7 84.4
Mid day meal served in school on day of visit 84.6 87.5 87.1
Girl's Toilet
Library
Mid Day meal
School meetings selected RTE norms
Percentage schools meeting following RTE norms
Pupil-teacher & classroom
teacher
Building
Drinking Water
Toilet
Education Status Report - India
31
Pupil teacher ratio- ASER's school observations show improvement in compliance with PTR
norms. In 2010, the proportion of schools meeting these norms was 38.9%. This figure has risen
to 42.8% in 2012.
9.2 Drinking water
The proportion of schools with drinking water facilities has remained largely unchanged since
2010. In 2012, 73% schools visited had drinking water facilities available. Safe and adequate
drinking water is important in attracting children to school and ensuring their retention. The
present study shows a low figure of 73 % with regard to availability of safe drinking water.
Performance of states such as Andhra Pradesh (19.4), Assam (25.2), Bihar (19.3), Haryana
(23.2), Manipur (28.1) and West Bengal (20.2) where almost a quarter or slightly more schools
do not have drinking water facility11 needs focused attention.
9.3 Toilets
The proportion of schools without toilets has reduced from 12.2% in 2011 to 8.4% in 2012.
Approximately 80% of the schools visited had a separate toilet for girls. Of all the schools
visited, close to half had useable facilities, in comparison to a third in 2010.
9.4 Provision of Separate Toilets for Girls in schools
More than 75% of the schools in the states of Karnataka, Gujarat and Tamil Nadu are reported
to have separate functional toilets for girls. However, there is a lot to be done to improve the
scenario in many states like, Orissa (14%), Andhra Pradesh (46.3), Bihar (46), Jharkhand (45)
Uttar Pradesh (59.4), Madhya Pradesh (41.7), Rajasthan (32) and West Bengal (44.8) where only
a smaller percentage of schools have separate toilets for girls.
9.5 Mid day meal
The mid-day meal was observed being served in 87.1% of all schools visited an increase over
2010. Midday meal to school going children is one of the flagship programmes of the
government. This aims to improve attendance, reduce dropout for child labour and moreover
to provide minimum food and nutrition support to children to sustain themselves in the classes.
Field level observation have revealed that children of poor families often came to school
Education Status Report - India
32
without having any food in the morning and for them midday meal is a basic requirement to
help them attend classes and learn.
9.6 Access to essential teaching material (TLM)
The study indicates that nearly 80 % of the schools got TLM. If we assume that all those schools
that have TLM would be using, it could be very encouraging information. The states that need
to improve in this regard are Rajasthan, Manipur and Uttar Pradesh.9 Black board is an
essential part of the school learning and it is critical TLM for a school. The image of the teacher
is always associated with blackboard for the children. According to the present study even after
three years of implementation of the RTE Act 2009 around 7 % of the schools still do not have
functional black boards. The problem is severe in Bihar and Uttar Pradesh.
9.7 Common Room for Teachers
Only in one third of the schools mentioned there was common room for teachers. The implication
of this is that teachers did not have space to prepare teaching materials and for sharing and
learning etc. This, not only affects the teaching quality but also the assessments.
9.8 Adequate Classrooms
Number of classrooms and how the children are distributed into different classes plays a major
role in determining child participation, learning levels and learning outcomes. Single classroom
schools are still not a forgotten story in our country, particularly in the rural areas. Around 5 %
of the schools in the sample are run in single classrooms. However, more than two third schools
have only three or more classrooms and more than 58 % schools have four or more classrooms.
More than one third of the schools have seven or more classrooms. Considering the increasing
number of the newly enrolled children attending schools, the number of classrooms needs also
to be improved in schools where there is a lacuna for it.
9.9 Play ground and materials
Co-curricular activities have a major role in education. Physical and socio-cultural development
of children is shaped by the participation of children of children in games. They form their
ability to work in teams and help in physical development. In the present study, nearly 58 % of
the schools reported to have play grounds10 and 55 % have some kind of play materials. Nearly
82 % of schools in Tamil Nadu have play grounds, while Bihar, Jharkhand, Rajasthan and West
Education Status Report - India
33
Bengal has to provide play grounds in 44 % to 60 % of their schools. At present nearly 40 %
schools on an average do not have play grounds.
9.10 Status of Community Participation in the states in ensuring RTE
States where most of the schools have constituted SMCs are Rajasthan (96%), Haryana, Odisha
and (93%), Maharashtra (91%), Jharkhand (88%) and Gujarat (86%). We have not considered
Himachal Pradesh, Manipur and Uttrakhand in this case as their sample sizes are too small to
draw an inference, though useful to be included in presenting a national picture. The states of
Assam (39%) and Bihar (60%) present a picture very low formation of SMCs which needs to be
attended to.
As regards following the election process in the formation of SMCs is concerned Madhya
Pradesh (92%), Rajasthan (82%) and Maharashtra (85%) and Jharkhand (81%) present the bright
side as per the data. However states of Assam (15%), Gujarat (27%), Bihar (42%), Tamil Nadu
(27%) and West Bengal (34%) where SMCs were formed through elections only in a small
percentage of schools as mentioned above needs to improve on this account. In terms of
constitution of SMCs as per RTE norms ensuring the gender and social group representation the
states of Gujarat (82%), Jharkhand (75%), Maharashtra (83%), Manipur (84%), Madhya Pradesh
(88%), Rajasthan (85%) appear to be the better performers. States of Assam (26%), Bihar (33%),
Karnataka (35%) and Tamil Nadu (30%) seem to lag behind in forming SMCs through elections.
In Maharashtra (80%), Rajasthan (80%), Gujarat (77%), Haryana (91%), the SMC members
appear to have received training to support them in performing the functions. Training was
available only in 2 % schools in Bihar, 18.2 % in UP and 36 % schools in West Bengal, which are
states which need to take adequate measures to equip the SMC members. School development
plans were reportedly prepared by the SMC members in around 80 % of schools in Assam and
Rajasthan as well as in 75 % schools in Maharashtra. At the same time in only in 30 % of schools
in Andhra Pradesh, 26 % in Tamil Nadu and 38 % in Odisha and 45 % schools in UP were the
SDPs prepared by SMCs. These states need to take extra efforts to train and involve the SMC
members in preparing the SDPs.
The states where more SMCs were involved in monitoring the functioning of schools were from
Assam (81%), Maharashtra (85%), Manipur (96%), Odisha (82%), Rajasthan (79%). States where
SMCs measures need to be taken to involve more SMCs in monitoring the functioning of
schools are Andhra Pradesh (38%) and Tamil Nadu (47%). A similar pattern with more
involvement of SMCs in monitoring the utilization of school grants is found with states such as
Assam (91%) Manipur (90%), Maharashtra (79%) showing higher percentage of SMC
involvement with the states of Andhra Pradesh and Tamil Nadu showing a low level of
involvement by SMCs in 35 % of the schools in both the states. A probable explanation could be
Education Status Report - India
34
that due to increasing spread of privatization in these states which are economically developed,
there is a lack of interest in Government and Government aided schools about which this study
primarily deals with.
9.11 Kitchen as specified in RTE Act is available only in 68.8 % of the
schools.
Schools in South India ranging from Karnataka (73.5%), Andhra Pradesh (79%) and Tamil Nadu
(82%) indicate better performance in this regard. States such as Bihar (36%), Haryana (38.9%),
Jharkhand (35%), Maharashtra (39.2%), Manipur (31.2%), MP (41.7%), Rajasthan (31%) UP
(28.9%), West Bengal (28.8%) where more than a quarter and above schools do not have
kitchens for cooking midday meals need to to invest more on building kitchen shed in the
schools and make them functional.12 This field enquiry in schools showed that nearly 60
percent schools in AP, Assam and Bihar to 80 % in Gujarat, 86.5 % in Maharashtra and 88 % in
Odisha followed the menu they had made public. Noncompliance in this regard is reportedly
high in AP (23.4%), Assam (28.4%), Manipur (37%), MP (16.5%), Tamil Nadu (25.2), UP (18.9%)
and West Bengal (17.2%).
9.12 Library
With regard to library facility in schools, the present study also indicates that 55 % schools
reported having libraries; though this study is not covering all the states and union territories.
As per the data, it is reported that wherever library is available, it is accessible to children.
However, it is still a question how good these libraries and whether teachers are helping
students to use the library effectively. The states that have to improve in the provisioning of
libraries are Assam, Manipur, Madhya Pradesh, Bihar and West Bengal.
Education Status Report - India
35
10. Articles related to elementary education
10.1 National decline in reading and math ability among students
Bhavya Dore, Hindustan Times Mumbai, January 18, 2013
Learning levels – both basic reading and mathematical abilities – have declined across the
nation and the state since 2010, according to the findings of the Annual Status of Education
Report (ASER) for 2012.
The report, put together annually by the non-profit group Pratham, was released on
Wednesday. The sharp fall has directly coincided with the centrally mandated Right to
Education Act coming into effect in April 2010. One of its clauses states that children cannot be
failed until Class 8.
In 2010, 46.3% of all Class 5 students in the country could not read Class 2 textbooks; this
increased to 53.2% in 2012. The proportion of Class 3 students who couldn’t read Class 1
textbooks increased from 54.4% in 2010 to 61.3% in 2012.
Arithmetic ability, too, has declined. In 2010, of all Class 5 children, 29.1% couldn’t solve a two
digit subtraction problem, this increased to 46.5% in 2012. Similarly, children who couldn’t do
division problems increased from 63.8% in 2010 to 75.2% in 2012.
“There is a general apathy towards education,” said Usha Rane, director, content and training
at Pratham. “Perhaps children and parents feel there is no need to study as they will be
passed.” The no-fail policy is enshrined in the Act, and was implemented in Maharashtra in
2010 by way of a government order.
“Since 2010, declining trends are visible. Guarantee of education is meaningless without
satisfactory learning. (There are) huge implications for equity and growth for Maharashtra if
basic learning outcomes do not improve soon,” said the report. Enrollment levels are however,
high both in India (96.5%) and Maharashtra (98.5%).
ASER was conducted by surveying 21,782 children from 823 schools in all 33 districts of
Maharashtra. Nearly 4.5 lakh children were covered nationally.
A nationwide survey on status of education in rural India has revealed that there has been a
decline in the education standards across the country. The Annual Status of Education Report
(Rural) 2012, prepared by NGO Pratham and released by Union HRD Minister MM Pallam Raju
on Thursday, also raises questions about whether the Right to Education Act has actually led to
any improvement in India's literacy.
Education Status Report - India
36
According to the in the report, the basic learning levels of children in rural India have fallen; in
2012, just five out of 10 students in Class V across rural India, could solve a simple arithmetic
problem, it says.
The report also says that there is a sharp decline in the reading ability of children, especially in
government schools and that more and more parents seem to be depending on private schools
in rural India. Last year, 45 per cent of students enrolled in Class I-VIII were attending private
schools, the report says.
And in the same year, the enrollment rate of girls in schools showed a decline in a few states,
the report says.
The report was based on a survey carried out in rural schools across 567 districts and covering
about six lakh children in the age of 3-16.
Mr Raju said he was worried about the figures and hoped things will be better from next year.
The minister also said, "We have been spending a lot of money on improving the reach of
schools. All these are interventions. We are not unduly alarmed by parents sending their
children to private schools; want to focus on improving standards in government schools."
The report is one of its kind in India as no other survey has been done so far to identify the
status of education across rural India, either by the government or a private entity. Dr Rukmini
Banerji, in-charge of the Pratham survey, said, "It's how you look at the way forward. The last
couple of years have seen a big decline and that is very worrying. We have spent many years
getting our children into school, now it is time to see what we learn from them."
Criticising the Right to Education Act (RTE), the report said it may have led to relaxation of
classroom teachings since examinations and assessments are scrapped till a few classes.
The HRD Minister, however, defended the RTE act saying the focus since the introduction of the
act has been on capacity and on getting more children on school. The minister also said that the
time has now come to focus on learning outcomes. He also said that relaxation of norms is not
a factor that could have affected the quality of education, as aspiration levels in rural India are
also going up and hence people would not neglect studies.
According to social scientist Yogendra Yadav, who was also a part of a council for the act, said it
is unfair to blame the RTE act. He said there could be other factors like the issue of recruitment
of teachers and their quality.
Education Status Report - India
37
But there are a few positives as well in the report. The Pupil-Teacher ratio in schools is up, and
so is the proportion of schools with usable toilets. But the question is: how soon can the
government act to ensure that this crisis in our education system be stemmed now?
10.2 Status of Indian Education - Present Trends and Past Systems:
Some ReflectionsDr. Anirban Ganguly, Research Fellow, VIF
The Annual Status of Education Report (ASER) 2012 is out and has already generated discussion
on the state of education in the country. A quick survey of some figures seem to point to a mix
of a movement forward – especially in terms of infrastructure and broad enrolment ratio – and
a certain movement backward in terms of learning skills and teacher performance. It would be
perhaps useful to have a brief look at some of the findings and to note with alarm the fact that
the principal investigators of the report feel that there is indeed a ‘deepening crisis in
education’, especially mass education in the country. And this crisis, they feel, is like ‘an unseen
and quiet killer disease’ of which the government, education policy makers and educationists in
the country ought to take serious cognizance.
Some of these findings may be thus enumerated: learning levels in government schools are
declining and the private school enrolment figures are rising by almost 10% per year. A decline
in education performance has been discerned as well. This has been attributed by some experts
to the RTE regulation which stipulates no detention till class VIII leading to a ‘relaxation’ in
teaching in classrooms. It has been argued that the scrapping of all exams till that notified level
has contributed to the reduction and eventual removal of performance pressure from the
classroom thus leading to a decline in educations standards. One can argue that instead of
seeing this as the debilitating effects of adhering, for more than a century, to an exam and
syllabus oriented centralized education system, the tendency is to decry any move that looks at
trying to reduce the stress and load on the young learner. The teachers for this past period –
ever since the colonial system of exam-syllabus oriented education was introduced – gradually
lost their sense of initiative and became mere executors of textbooks. Their new found role
thus, as educators and not mere examination monitors and facilitators may have left them
perplexed for the time being leading to a certain hesitancy which is perhaps mistakenly being
perceived as ‘relaxation’. On the teachers’ role, the report observes that the problem with the
‘governmental system is that the individual teacher feels that he has to wait for the highest
authority to say what is to be done.’ Therefore it may be asked whether under the no-exam RTE
regulation the teachers and their role need a comprehensive re-examinations and rethinking.
This particular RTE regulation requires greater study and debate and ought not to be dumped
without forethought.
The other observation on the deteriorating levels of learning and retention that the report
made was that it was better to ‘adhere to a policy of achieving basic learning outcomes’ rather
Education Status Report - India
38
than solely focus on ‘completing the syllabus.’ The past adherence to a mechanical system of
education ensured the primacy of the text book and subordinated all other aims of education
to the overweening goal of completing the syllabus. It must be recognized that these
expressions in our times are a result of that past history.
The other point of concern that the report highlights is the widening gap between children who
go to government run schools and those who attend private schools. The District Information
System of Education (DISE) statistics for 2012 have revealed that 29.8% Indian children in
standard I-V, both and urban and rural, attended private schools in 2010-11. Pointing to this
growing trend of taking recourse to private education the ASER 2010 report revealed that
22.5% of rural children in standard I-V attended private schools and the ASER 2012 reports that
the proportion has risen to 28.39% over two years – an increase of 5.8%. Making a projection,
the report notes that in this manner by 2014 41% of all India’s primary age children will be
attending private schools and that by 2019 the private sector will emerge as the ‘clear major
formal education provider in India.’ Commenting on this trend, the report observes that private
school enrolment ‘will go on increasing till it hits family budget constraints’ and ‘unless the
quality of government schools improves substantially’ this gap between government school
going children and private school going children will ‘create a great divide in every aspect of life
and opportunity.’ Taking this further the report also notes that by 2020 over 50% children in
India will have to pay for their primary education.
On skills developed the report found that in private schools, less than 40% of standard V
children ‘could solve a simple division sum in 2012.’ General reading skills continue to be a
cause for ‘serious concern’ with more than ‘half of all children in standard V’ being ‘at least
three grade levels behind where they should be.’ On the enrolment front it has been noted that
96% of children between the ages of 6-14 years attend school and the other positive
development is that of enhanced basic infrastructure in schools. The teacher pupil ratio has
shown improvement as well; in 2010 the percentage of schools meeting these norms was 38.9
while 2012 saw it rise to 42.8%. While 73% of schools surveyed had drinking water facilities and
the proportion of schools without toilets has seen a reduction from 12.2% in 2011 to 8.4% in
2012 the mid-day meal scheme was also seen in operation in 87.1% schools that were
surveyed.
But challenges, especially in teaching, teachers’ training and motivation in rural mass education
remain. The inability of governments to really revamp primary education, especially rural
education, is one of the greatest looming challenges for Indian education in the years ahead.
10.3 Impressive growth in enrolment of girls in schools: Survey PTI :
New Delhi, Tue Jan 22 2013
Education Status Report - India
39
Enrolment of girls has shown an impressive growth in schools, a government survey today
revealed though the figure went down in higher classes.
The eighth all India education survey for 2002-09 by NCERT said while the enrolment at primary
stage stood at 48.13 per cent, it came down to 42.56 per cent at higher secondary stage.
Similar trend was observed in percentage of girl's enrolment in schools in rural areas. Officials,
however, said it was difficult to attribute specific reasons contributing to this trend.
The survey covered more than 13 lakhs recognized schools across the country in each
habitation, village and urban areas, out of which more than 84.14 per cent schools were rural
areas.
During this period, 228,994,454 students enrolled in different recognized schools of the
country. 13.67 per cent growth was registered in student's enrolment from Class I-XII.
In case of girls, the enrolment registered was 19.12 per cent.
Carried out before RTE regime, the survey revealed that schools in rural areas were still
deprived of basic facilities like drinking water, usable urinal and playgrounds.
10.4 Learning curve going downward Charu Sudan Kasturi, Hindustan
Times April 22, 2012
Nayan Chettri should have learned how many meters make a kilometer in class 3. But the
boy, now in standard 4, still doesn’t know the answer. Chettri, who studies in a Nepali
medium school in Guwahati, also draws a blank in his science and social science classes. His
teachers have never US President Barack Obama famously declared in 2010 that America was
in an “education arms race” with China and India. But India, the challenger, is in a race with
itself — to ensure that it doesn’t fritter away the demographic advantage of its young
population against that of the aging West and China, because of inadequacies in its own
education system.
The Right to Education Act aims to ensure that every child between 6 and 14 gets schooling.
The law bars schools from failing students till they complete class 8, a move aimed at
eliminating early academic pressure on children, and at getting rid of a reason many students
drop out of school. But while Chettri will not fail at least till class 8, Indian education is
struggling to make the grade in ensuring that children like him actually learn in school.
Education Status Report - India
40
Less than half of the country’s rural children in class 5 can read class 2 texts, and 20 % of
students even in class 8 can’t read texts meant for children six years younger, according to
the latest Annual Status of Education Report (ASER) released by NGO Pratham. Math, a
subject India has traditionally proclaimed relative mastery in, represents an equally worrying
picture.
A quarter of class 5 students can’t recognize numbers to 99, and 45% of class 8 students can’t
divide. Worse still, the number of students who can’t do the math they are expected to for
their class is bloating.
The gloom isn’t uniform — some urban centers like Chennai have better learning outcomes,
argued VR Devika, founder of Aseema Trust, an NGO that works with school children. Devika
conducted a small but indicative experiment with four Chennai municipal schools that
showed most class 3 and class 4 students could read and recollect a story, and answer
questions on it.
But Devika, who plans to expand the experiment to more schools next year, accepted that the
ASER findings reflected the plight of rural schools, including private institutions.
Rote-based teaching in most schools is a major reason students fail to learn and understand
what they study in class, Devika said. But the absence of remedial teaching in most schools
means that struggling students like Chettri are left to fend for themselves or give up.
It isn’t easy to put a robust remedial learning structure in place.
The Assam government has joined hands with the National Institute of Open Schooling and
the KK Handique Open University for training teachers and preparing teaching learning
material. The state is also taking assistance from the Guwahati-based Don Bosco Institute to
train teachers on how to “banish fear and infuse fun” in the class.
But the strategy is predicated on the availability of remedial teachers. In a country short of six
lakh regular teachers, that’s a steep challenge.
10.5 Student-teacher ratio revised in govt. schools Ahmedabad, Mon
Oct 28 2013
The classroom strength is to decide the student-teacher ratio in lower and upper
government primary schools. With the implementation of Right to Education (RTE) Act
and recent mass appointments of teachers (vidyasahayaks) for primary schools, the state
Education Status Report - India
41
Education Department has revised the student-teacher ratio that is based on the student
strength.
Earlier, while the ratio was fixed below a set number of students for entire primary
school (from Class I-VIII), it has been now divided into lower and upper primary sections
as well as for both sections based on the number of students in each class categorized
into different slabs.
While, the upper limit of students in lower primary (Class I-V) schools has been fixed as
40 if the classroom strength exceeds 200, the same has been kept as 35 in upper primary
(Class VI-VIII) schools if the classroom strength exceeds 105.
This has been done after a major reshuffle of teachers from secondary to primary schools
with the implementation of RTE Act that stipulates free and compulsory education till
Class VIII. While, as per Gujarat Education Department the primary schools were till Class
VII only. Thus, more than 12,000 teachers became surplus as Class VIII was brought down
from secondary to primary schools leaving thousands as surplus, who had been recently
"adjusted" in primary schools.
"The student-teacher ratio has been revised in consonance with the RTE Act. Also, the
ratio has helped estimating the requirement of teachers in primary schools that will
further guide the number of posts to be created and filled in the coming months," said a
senior official of the Education Department.
At present, there are over 2 lakh teaching faculty for nearly 33,900 primary schools in the
state with student strength of over 53 lakh students. These include all the schools
directly run by municipal corporations in urban areas as well as district panchayats in
villages. The number of villages as per the official records is 18,500.
Also, keeping in mind the implementation of RTE Act, the Department had conducted
recent appointments of more than 15,000 teachers for upper primary schools. Recently,
8,800 posts of primary teachers for Class VI-VIII were created and appointments
completed in the month of August by the Education Department.
While, a similar number of posts for both primary and secondary teachers, are expected
to be created for candidates who have taken the recent Teachers Aptitude Test (TAT)
conducted in the month of September, this year.
Education Status Report - India
42
10.6 India has made best progress in elementary education: UN
UNESCO lauds government effort, political commitment in
implementing Sarva Shiksha Abhiyan Prashant K. Nanda First
Published: Mon, Jun 10 2013. 07 36 AM IST
New Delhi: Bringing cheer to India’s administrators, the United Nations Educational, Scientific
and Cultural Organization (Unesco) said the country has progressed the most in the world in
sending children to schools by committed implementation of its right to education law and
universal elementary education programme.
“India has made the largest progress in absolute terms of any country in the world … reducing
out-of-school (children) numbers from 20 million in 2000 to 2.3 million in 2006, and (around)
1.7 million by latest data (2011),” Unesco’s latest Education For All Global Monitoring Report
said.
The United Nations agency lauded the government’s effort and political commitment in
implementing the Sarva Shiksha Abhiyan, a welfare programme on universalizing elementary
education, and making education an entitlement by law.
Although an official at the human resource development ministry said, on condition of
anonymity, that the elementary education scheme has started showing results and the benefits
of the right to education law will follow suit in a few years, some experts are sceptical of the
progress.
“Since 2000, it’s fact that enrolment has gone up significantly. But many students are only in
school registers,” said educationist Vinod Raina. “Education is not about only enrolment. You
have to look at enrolment, attendance and dropout rate together.”
“In India, the attendance rate is around 70% and the dropout rate is nearly 40% at the
elementary level. These are not comfortable numbers at all,” said Raina, a member of the
Central Advisory Board on Education, the highest education policy adviser to the Union
government.
“Many UN bodies are not very critical of countries because they don’t have their independent
source of information. They depend on data provided by governments.”
India’s commitment to elementary education helped it get the “largest share of aid” to basic
education of any country in the world (10%). The country received $578 million in aid during
2011, 50% more than the previous year, Pauline Rose, director of the global monitoring report
told Mint in an email.
Education Status Report - India
43
What is heartening is that South Asia, considered one of the poorest regions in the world, has
made more progress than any other region in sending children to schools. This progress has
helped the entire world in bettering this social indicator, said the report released on Sunday.
Sub-Saharan Africa continues to be a drag.
“As Africa’s proportion of the world’s out-of-school children grows, South and West Asia’s
declines,” said the report. In 2000, there were some 37.8 million out-of-school children in South
and West Asia, which dropped to 12.4 million in 2011. In the same period, sub-Saharan Africa
reduced the number of its out-of-school children from 40.6 million to 29.8 million.
Despite the progress made in some regions, including India, the entire world may fail to achieve
100% schooling by 2015, Unesco said. This is because several key donors, including countries
and multi-lateral agencies such as the International Monetary Fund and the World Bank, have
reduced education grants to needy countries. In 2011, the world had some 57 million children
out of schools, the report said.
“As debate continues over the goals of the post-2015 development agenda, new data show
that the world is unlikely to fulfil one of the most modest commitments: to get every child in
school by 2015,” the UN body said.
“More than 57 million children continue to be denied the right to primary education, almost
half of whom will probably never enter a classroom.”
The report said donor countries and agencies facing tough economic environment have cut
their education grants. Of the 10 major bilateral donors to basic education, six (Canada, France,
Japan, the Netherlands, Norway and the US) have reduced their aid. While the World Bank
increased its aid to basic education overall, its allocation to low-income countries declined by
almost a quarter. The Netherlands, too, has cut its aid by 33% as this does not contribute to its
foreign policy priorities, the report said.
“Economic austerity should not be an excuse for donors to abandon their pledges to the
world’s poorest,” Unesco said in its report.
Raina did not completely agree with this.
“Basic education should be a responsibility of the domestic economy and countries like India
should never rely on grants or loans,” he said. “But some countries, which don’t have a robust
domestic economy, need sustained allocation from donor countries and agencies.”
Education Status Report - India
44
11. Articles and reports referred during preparation of
State education report
1. State Elementary Education Report cards 2011-12.
2. Elementary Education in India: Progress towards UEE Analytical Tables 2011-12.
3. Annual status of education report (rural) 2012. 4. PAISA 2011 report by PRATHAM. Do schools get their money? 5. News and articles related to RTE. 6. www.educationortal.gov.in 7. www.ssa.nic.in
8. www.educationnewsindia.com
9. www.rteforumindia.org
10. www.dise.in
11. www.rmsaap.nic.in
12. www.nuepa.org
13. www.performance.gov.in