duke energy 2010 | 2011 sustainability report€¦ · in 2010, duke energy was named to the dow...
TRANSCRIPT

2010 | 2011 sustainability report
INVESTINGfor our future.
DELIVERING toDAY.

CompaNy pRofILE
Duke Energy is one of the largest electric power holding companies in the United States. Our regulated utility operations serve approximately 4 million customers located in five states in the Southeast and Midwest, representing a population of approximately 12 million people. Our commercial power and international business segments own and operate diverse power generation assets in North America and Latin America, including a growing portfolio of renewable energy assets in the United States.
ouR mISSIoN
At Duke Energy, we make people’s lives better by providing gas and electric services in a sustainable way — affordable, reliable and clean. This requires us to constantly look for ways to improve, to grow and to reduce our impact on the environment.
ouR VaLuES
■ Safety — We put safety first in all we do.
■ Caring — We look out for each other. We strive to make the environment and communities around us better places to live.
■ Integrity — We do the right thing. We honor our commitments. We admit when we’re wrong.
■ openness — We’re open to change and to new ideas from our co-workers, customers and other stakeholders. We explore ways to grow our business and make it better.
■ passion — We’re passionate about what we do. We strive for excellence. We take personal accountability for our actions.
■ Respect — We value diverse talents, perspectives and experiences. We treat others the way we want to be treated.
2010 | 2011 SuSTaINaBILITy RECoGNITIoN
■ In 2010, Duke Energy was named to the Dow Jones Sustainability World Index (DJSI World). We were also named to the North American DJSI for the fifth year in a row.
■ Corporate Responsibility magazine named Duke Energy to its 2011 “100 Best Corporate Citizens List.”
■ In 2010, Duke Energy was ranked among the top 100 companies in the world for sustainability by the NASDAQ OMX Group and CRD Analytics.
■ Duke Energy is listed on the Maplecroft Climate Innovation Index — a ranking of the largest U.S. companies that publicly engage on the issue of climate change.
Additional awards and recognition earned by the company and its leaders are mentioned throughout this report.
Contents
Duke Energy at a Glance . . . . . . . . . . . . . . . . . . . . . . 3
Letter from the Chairman . . . . . . . . . . . . . . . . . . . . . 5
What Matters Most . . . . . . . . . . . . . . . . . . . . . . . . . . 9
External Viewpoints . . . . . . . . . . . . . . . . . . . . . . . . . . 10
Sustainability Plan and Progress at a Glance . . . . . . 12
Innovative Products and Services . . . . . . . . . . . . . . 14
Environmental Footprint . . . . . . . . . . . . . . . . . . . . . . 21
Quality Workforce . . . . . . . . . . . . . . . . . . . . . . . . . . . 32
Strong Communities . . . . . . . . . . . . . . . . . . . . . . . . . 36
Governance and Transparency . . . . . . . . . . . . . . . . . 39
Global Reporting Initiative . . . . . . . . . . . . . . . . . . . . . 42
Independent Review . . . . . . . . . . . . . . . . . . . . . . . . . 43
aBouT ThIS REpoRT
the title of this 2010|2011 sustainability report sums up our company’s mission in just six words: “Delivering today. investing for our Future.” We share this theme with Duke energy’s 2010 annual report.
this report is organized for the summary reader as well as for those seeking more detailed information. Key features:
■ Jim rogers’ letter provides an update on recent progress and what lies ahead. ■ the sustainability plan and progress at a Glance provides a two-page overview
of our results against our goals. ■ A more in-depth review of performance is organized by our five areas of focus. ■ throughout the report, we feature several Duke energy employees who hold
themselves personally accountable for sustainable outcomes.Again this year, we offer print and Web versions of our Sustainability Report. The printed report includes the issues that are most important to our stakeholders and to us. We denote online-only content, including mouse-over definitions, with this icon:
Duke energy international supplements this report with its own publication covering our latin american operations, available at www.duke-energy.com.
We welcome your feedback on this report, our sustainability progress or related issues. email [email protected].

business segment overvieW
u.S. fRaNChISED ELECTRIC aND GaS
generation diversity(percent owned capacity)
27% Nuclear
1% Wind/Hydro
2% Natural Gas/Oil
70% Coal
Coal 49% nuclear 19% natural Gas/Fuel Oil 20% Hydro 12%
Customer diversity(in billed GWh sales)
27% Nuclear
1% Wind/Hydro
2% Natural Gas/Oil
70% Coal
Residential 34% Commercial 32% Industrial 25% Wholesale/Other 9%
U.S. Franchised Electric and Gas (USFE&G) consists of Duke Energy’s regulated generation, electric and gas transmission and distribution systems. USFE&G’s generation portfolio is a balanced mix of energy resources having different operating characteristics and fuel sources designed to provide energy at the lowest possible cost.
Electric operations ■ Owns approximately 27,000 megawatts (MW) of
generating capacity.■ Service area covers about 50,000 square miles with
an estimated population of 12 million.■ Service to approximately 4 million residential, commercial
and industrial customers.■ Over 152,200 miles of distribution lines and a 20,900-mile
transmission system.
Gas operations■ Regulated natural gas transmission and distribution
services to approximately 500,000 customers in southwestern Ohio and northern Kentucky.
CommERCIaL poWER
generation diversity(percent owned capacity)
27% Nuclear
1% Wind/Hydro
2% Natural Gas/Oil
70% Coal
Coal 41% natural Gas 44% Renewable 12% Other 3%
Commercial Power owns, operates and manages power plants, primarily located in the Midwest, and a renewable energy portfolio. Commercial Power’s subsidiary, Duke Energy Retail, serves retail electric customers in Ohio with generation and other energy services at competitive rates. Commercial Power also includes Duke Energy Generation Services (DEGS), an on-site energy solutions and utility services provider.
■ Owns and operates a balanced generation portfolio of approximately 7,550 net MW of power generation (excluding wind and solar generation assets).
■ Duke Energy Renewables currently has 986 MW of wind energy in operation and over 5,000 MW of wind energy projects in development, and owns 16 MW of commercial solar capacity.
DukE ENERGy INTERNaTIoNaL
generation diversity(percent owned capacity)
27% Nuclear
1% Wind/Hydro
2% Natural Gas/Oil
70% Coal
Hydro 69% Oil Diesel 20% natural Gas 11%
Duke Energy International (DEI) operates and manages power generation facilities and engages in sales and marketing of electric power and natural gas outside the U.S. DEI’s activities target power generation in Latin America. DEI also has an equity investment in National Methanol Co., a Saudi Arabian regional producer of MTBE, a gasoline additive.
■ Owns, operates or has substantial interests in approximately 4,200 net MW of generation facilities.
■ About 70 percent of DEI’s generating capacity is hydroelectric.
DukE ENERGy aT a GLaNCE: yEaR-END 2010
3

I’m aCCouNTaBLE
Roberta Bowman was named Duke Energy’s
fi rst chief sustainability offi cer fi ve years ago.
In the following Q&A, she refl ects on the
company’s sustainability progress and the
outlook for the future.roberta bowman, Senior Vice President and Chief Sustainability Offi cer
in the company’s fi rst sustainability report in 2007, you said that “sustainability is a journey, not a destination.” What progress has duke Energy made on this journey? I think we’ve made good progress building
the framework for sustainability at Duke Energy . We have a common language and plan that aligns our various divisions and businesses, and unifi es our employees. And, we’ve recruited and trained a group of creative and committed sustainability leaders throughout the company . Combine this sustainability “infrastructure” with Jim Rogers’ personal leadership and commitment — and we’ve built a strong foundation for success . Even more exciting — we are starting to see employee-led innovations that are making a real difference — increasing effi ciency, reducing waste and saving money . You’ll read about some of them in this report .
What are some of your “lessons learned” from duke Energy’s experience with sustainability? First, the motivating power of bold goals .
We’ve had healthy debate over how much “stretch” to put in our goals . Clearly, incremental improvements are important . But, we’ve found that breakthrough ideas and performance come from stretch goals . For example, in 2007 we set a safety goal of moving the Total Incident Case Rate (TICR) for our employees from second quartile to top decile by 2012 . Some of our managers and safety professionals didn’t think it could be done. And yet, we’re on track to achieve that goal, ending 2010 with our best-ever TICR results .
And second, it’s the outcome — not the noun — that matters . It doesn’t matter whether people call
it “sustainability,” “corporate responsibility,” “lean six sigma,” “life-cycle accounting,” “externalities,” “social impact” or what have you . What’s important is improving our decisions and operations by consid-ering a broad range of costs and impacts .
Has your thinking about sustainability changed over the past fi ve years? if so, how? I used to think that there were two kinds of
companies — those that committed to sustainability and those that didn’t . Today, I don’t believe companies have a real choice .
We are seeing more and more interest in measures of sustainability performance by the fi nancial community and other key stakeholders . They see these measures as predictors of management quality and overall company performance .
Sustainability is also important in the global competition for talent . Employees entering the workforce today “get” sustainability, and they want to work for companies that share that core value .
And third, sustainability is about risks and oppor-tunities . With the world’s population expected to exceed 9 billion by 2050 and the constraints of fi nite natural resources, companies need to improve their effi ciency in order to stay in business.
What do you foresee as the company’s greatest sustainability challenges going forward?
Our sustainability challenges are our business challenges . Balancing the need for
affordable, reliable and clean energy is central to our mission, but the business environment and external events infl uence our decisions and timing. in the aftermath of the cascading disasters in Japan, we
don’t yet know how those events will affect the economic recovery or our future energy options .
Environmental policy and the availability of natural resources also have an impact on our business . Global climate change has grabbed the headlines, but other issues — including water quality and scarcity — are infl uencing our operations.
An important point to recognize is that many of the issues we face today are interconnected . Energy . Water . Food . Security . Sustainability helps us see these connections, and develop integrated solutions .
What do you see as the emerging skills and competencies of the future? I think collaboration is becoming a core
competency . Some of the most interesting and workable solutions are coming from public/private partnerships . Business has historically been an engine of innovation . But, to be successful, we need clear policy signals from government and the “pull” of the consumer . Working with stakeholders will continue to be an important skill for the future .
And, it wouldn’t hurt to know how to play chess. Chess requires you to think three and four steps ahead, to play offense and defense, and to develop new strategies if you fi nd one avenue blocked.
I think the business model of the future is going to be much more like chess than checkers .
a:
a:
a:
a:
a:
For more Q&As with Roberta Bowman, please visit our Sustainability Report online.
DukE ENERGy CoRpoRaTIoN 2010 | 2011 sustainability report
4
LETTER fRom ThE ChaIRmaN
Dear Stakeholders: This year marks a major
milestone in our journey as a sustainable
company. It’s been fi ve years since Duke
Energy merged with Cinergy, and I became
chief executive of the combined company.
This is also our fi fth sustainability report. Jim rogers, Chairman, President and Chief Executive Offi cerJim rogers,
This fi ve-year mark is a good time to refl ect on our progress. It comes at an important point in time — as Duke Energy prepares to merge with Progress Energy, and our industry continues to navigate the challenges of economic recovery and environmental constraints.
Our commitment to sustainability helps us achieve the critical balance among people, the planet and profi ts. As our business challenges and priorities change, our fi ve focus areas keep us on the right path for sustainable decisions and results.
Our direction was affi rmed in 2010, when Duke Energy earned a place on the Dow Jones Sustainability World Index. Only 15 electric utilities worldwide were named to the elite World Index. We were also named to the North American DJSI for the fi fth year in a row.
On the facing page, Roberta Bowman, Duke Energy’s chief sustainability offi cer, discusses our sustainability journey over the past fi ve years. I’ll review where we are today, and what lies ahead.
DELIVERING ToDay. INVESTING foR ouR fuTuRE.
This Sustainability Report shares a common theme with our Annual Report: “Delivering Today. Investing for Our Future.” I think it captures our dual respon-sibilities — to deliver affordable, reliable and increasingly clean energy today, while making the investments needed to ensure a sustainable future.
In a nutshell, sustainability is all about innovation and accountability.
It means the relentless pursuit of productivity gains in the generation, delivery and use of energy.
It means engaging our employees, and unlocking their ideas.
It means managing our business responsibly and transparently, from the fi nancial ledger to the plant fl oor.
And it means caring about the environ-ment, and the communities we serve.
REaL JoBS IN a JoBLESS RECoVERy
Duke Energy currently offers some of the most competitive electric rates in the U.S. We benefi t today from the investment decisions made decades ago.
Now, we are entering a new building cycle — replacing aging energy facilities, improving productivity and effi ciency, meeting stricter environmental standards and diversifying our fuel sources.
I believe that investing in new energy infrastructure and related technologies can be the spark that ignites the next engine of American prosperity — bringing jobs and building energy security.
Government has an important role to play in job creation, for sure. But, it is private industry that will supply the fuel and turbines for new power plants, fi berglass for windmills, photovoltaic cells for solar panels , batteries for electric vehicles and the infrastructure
for a smart grid — all providing good jobs. A 2009 study by the Political Economy Research Institute estimates that a $1 billion investment in energy-related infrastructure can create from approxi-mately 15,000 to more than 20,000 jobs.
a TEChNoLoGy CompaNy DISGuISED aS a uTILITy
At the turn of the 20th century, electric companies were the innovators of the world, bringing electricity and all that it enabled to customers and communities. It was a life-changing — and economy-changing — transformation.
The 21st century electric company is a technology company disguised as a utility. We identify, integrate and scale up new technologies that make electricity cleaner, more reliable and affordable. New, more effi cient generating plants, seamlessly integrated into a smart grid, will create the foundation for a low-carbon future. A switch to electric vehicles will drive entire new industries and new jobs. A trend toward more effi cient buildings and appli-ances will create opportunities for jobs and investment as well.
Duke Energy is an industry leader in this value chain of sustainable innovation. Here are some highlights:
pRomoTING ENERGy EffICIENCy
One way we are improving productivity and holding down costs is by promoting energy effi ciency.
Icon denotes additional content online at sustainabilityreport .duke-energy .com
5

Our regulatory framework for energy efficiency differs from traditional utility conservation programs in that we are rewarded not only for selling power — but also for helping customers save it. The savings are measured and verified by a third party, to ensure we are producing real results.
Our energy efficiency model has been approved in North Carolina, South Carolina and Ohio. While we have not yet filed for a similar framework in Kentucky, we do have conservation programs in place.
After we received preliminary approval in Indiana, the state’s utility commission ordered all utilities to offer a set of standard efficiency programs. We withdrew our previous proposal and submitted new plans for programs beyond those mandated by the state. We are awaiting the commission’s approval.
Our efficiency programs are already helping customers better manage their energy use and create sustainable energy savings.
For example, in 2010, Duke Energy distributed more than 10 million compact fluorescent light bulbs (CFLs) to our residential electric customers. By replacing their incandescent bulbs with CFLs, customers save money and energy.
Also in 2010, we announced Envision: Charlotte, the largest commercial-scale community application of smart-energy technology in the U.S. to date. This public/private partnership aims to reduce overall energy use in some 70 uptown Charlotte buildings by up to 20 percent over the next five years.
ImpRoVING RELIaBILITy
Though the reliability of our power delivery system has improved substantially in recent years, we did not meet our aggres-sive 2010 outage-reduction goals. Stormy weather had a major impact — lightning strikes increased by 80 percent in the Carolinas and 46 percent in the Midwest, compared to 2009.
Weather aside, in order to sustain higher levels of reliability in the long run, our electric power grid needs a major upgrade. That’s where smart grid technology comes in.
Moving from analog to digital technology will equip our delivery system to detect and resolve power problems, and prevent and shorten outages. It will enable our buildings, appliances and
electronic devices to use energy more efficiently. And, it will give our customers the information, choices and control to make wiser energy decisions, save energy and save money — in a way that works best for them.
Since 2008, we have installed approximately 140,000 “smart” electric meters and nearly 100,000 digital gas meters for customers in Ohio. We have also installed thousands of digital meters in the Carolinas, mostly in the Charlotte area.
makING ENERGy CLEaNER
Weather extremes in 2010 tested our generating fleet and operations team, and they responded with excep-tional performance. Due to higher electricity demand from customers, the fleet emitted about 100 million tons of carbon dioxide (CO2) in 2010 — up from 94 million tons in 2009, when the economy was weaker. Our carbon inten-sity (tons of CO2 emitted per net megawatt-hour of electricity produced) also increased slightly — from 0.59 in 2009 to 0.60 in 2010 — due to those same factors. However, based on 2009 data (the latest available), while Duke Energy was the fifth largest generator of megawatt-hours among U.S.-based, investor-owned utilities, we were only the 11th highest in U.S. carbon inten-sity, due to our diverse generation mix.
We remain committed to reducing our environmental footprint, and are taking actions today for a cleaner energy future.
As I mentioned earlier, the power industry’s infrastructure is aging. About 70 percent of the approximately 450 major U.S. electric power generating units began operating more than 30 years ago. Over the next decade, we expect new Environmental Protection Agency regulations may make almost a third of all U.S. coal plants uneconomical to operate. On the Duke Energy system, we will need to replace most of the power plants operating today by 2050. By modernizing and diversifying our generating fleet now,
we will produce energy more efficiently, retire older, less-efficient plants, and reduce our carbon footprint — for good.
Nuclear power As I write this letter, we continue to monitor the disasters in Japan — an unprecedented earthquake, a massive tsunami and the resulting emergency at the Fukushima Daiichi nuclear station.
The nuclear energy industry worldwide works cooperatively and continuously to share experience and improve safety. We have long recognized that a problem at one nuclear unit can affect us all. And, while it will take time to better understand
the causes and effects of the Japanese nuclear crisis, Duke Energy and the U.S. nuclear industry are already taking actions to ensure the continued safety of our plants. On page 26, our chief genera-tion and nuclear officer, Dhiaa Jamil, a 30-year veteran of the nuclear power industry, answers questions about the Japanese crisis.
It is impossible to predict what impact the events in Japan will have on the burgeoning nuclear renaissance in the U.S. and worldwide. But, I believe nuclear power will remain an important part of our energy mix, because it is the only technology that allows us to generate electricity 24/7 with zero
greenhouse gases. At Duke Energy, we have nearly 40
years of experience safely and efficiently operating nuclear power plants. In fact, in 2010, we set a new company record for capacity factor — approximately 95.9 percent — which translates into lower costs and cleaner power for our customers.
Cleaner coalAlmost half of the power produced in
the U.S. comes from coal. It is plentiful and affordable; our challenge is to find ways to burn it more cleanly.
We have invested approximately $5 billion over the last decade to significantly reduce SO2 and NOx emissions. Over the
By modernizing and diversifying our generating fleet now, we will produce energy more efficiently, retire older, less-efficient plants, and reduce our carbon footprint – for good .
DukE ENERGy CoRpoRaTIoN 2010 | 2011 sustainability report
6

past five years, we have reduced our sulfur dioxide emissions by 73 percent, and nitrogen oxides emissions by 52 percent.
Our Edwardsport plant in Indiana will be one of the world’s cleanest coal-fired plants when it is completed in 2012. It will also be the largest power plant in the world to use advanced technology to gasify coal, strip out the pollutants and burn the cleaner gas to produce power — reducing carbon emissions per megawatt-hour by nearly half. The plant is more than 80 percent complete, including engineering, procurement and construction.
But Edwardsport has not been without its challenges.
While construction remained on schedule in 2010, the scale and complexity of the project has pushed estimated costs from $2.35 billion to $2.88 billion. We have filed a proposal with the Indiana Utility Regulatory Commission to cap Edwardsport construc-tion costs to be passed on to customers at $2.72 billion plus financing costs, and to lower the overall customer rate increase related to the project.
We expect a decision from the commission in 2011 regarding the cost increase and the cost-cap proposal.
Our reputation was tested in 2010 with a controversy over the hiring of a former Indiana Utility Regulatory Commission attorney and related issues in Indiana. We immediately launched an investigation after concerns were raised, and cooperated fully with external inves-tigations. As we learned more, we took swift, decisive and appropriate policy and personnel actions. You can read more about our response to this matter on pages 40 and 41. We are working hard to rebuild the trust of our Indiana stakeholders.
In North Carolina, the modernization of our Cliffside coal plant is on schedule for completion in 2012. A new, highly efficient unit will replace 1,000 megawatts of older coal-fired generation, including four units at Cliffside. Emission control systems will remove 99 percent of sulfur dioxide emissions, 90 percent of nitrogen oxides emissions and 90 percent of mercury, while the plant generates more than twice the electricity as before.
Natural gasNatural gas is becoming an increas-
ingly popular fuel for electric generation, particularly as an alternative to coal. This is primarily due to lower prices driven by
new discoveries of shale gas reserves, as well as lower emissions. We are building two natural gas-fired generating plants in North Carolina — Buck and Dan River — and plan to retire two 1940s- and 1950s-vintage coal units at each site.
The gas-fired plant at Buck will be completed and begin operation in 2011. Construction began on Dan River in January 2011, and it is scheduled to go on line in late 2012.
Renewable energyDuke Energy now has nearly 1,000
megawatts (MW) of commercial wind energy on line, with two major projects — Top of the World in Wyoming and Kit Carson in Colorado — completed at the end of 2010. We also grew our commer-cial solar business in 2010 with the 14-MW Blue Wing Solar Project in Texas and two smaller farms in North Carolina. We expect to complete additional solar facilities by the end of 2011.
On the regulated side, we had more applicants than we could accommodate for our distributed solar program in North Carolina. Factories, businesses and schools are renting out their property and rooftops to Duke Energy for solar energy installations. The panels can produce 8 megawatts of electricity — enough to serve about 1,300 homes. In addition, we purchase solar power from third parties, like the SunEdison solar farm in Davidson County, N.C., one of the largest in the country.
Duke Energy also buys renewable power generated from landfill methane gas, which we expect to play an increas-ingly important role in meeting North Carolina’s Renewable Energy and Energy Efficiency Portfolio Standard.
promoting electric vehiclesElectric vehicles represent an important
innovation both in cleaner transportation and in electricity storage and use. We are collaborating with manufacturers of vehicles, batteries and charging stations to promote the long-term adoption of plug-in electric vehicles.
Duke Energy is a board member of the Electric Drive Transportation Association and helped launch www.GoElectricDrive.com in 2010. The association’s website offers informa-tion on advancements in electric vehicle technologies, purchase incentives and environmental benefits.
Some of our employees in Indiana and North Carolina are also participating in pilot programs so we can better under-stand the user experience and the impact of electric vehicles on our power grid. We’re also “greening” our fleet with more hybrid and electric vehicles, consistent with our 2009 Clinton Global Initiative commitment to make those our only new purchases by 2020.
Scaling new technology with ChinaI believe that China has developed the
“intellectual property” behind scaling new technologies. That’s why we are working with Chinese energy companies to share information on clean energy technologies and explore joint projects. The end game, of course, is to apply what we learn to better serve our customers with affordable, reliable and increasingly clean electricity.
In 2010, we signed an agreement with BYD, a Chinese manufacturer of electric vehicles, to collaborate on energy storage, electric vehicle and digital grid technolo-gies, and to look for opportunities for joint business development.
Since 2009, we’ve partnered with ENN Group, one of China’s largest private energy companies, on clean energy technologies, including solar and other low-carbon innovations. We also continue to explore clean energy technologies with Huaneng Group, China’s largest power generator.
maINTaININGfINaNCIaL STRENGTh
Our financial results in 2010 exceeded expectations. Extreme weather grabbed the headlines, but masked the story of operating excellence by our people and power plants.
We ended 2010 with adjusted diluted earnings per share of $1.43, above our original adjusted diluted earnings guidance range of $1.25 to $1.30, and up from $1.22 per share in 2009.
Our total shareholder return (TSR) — the change in stock price plus dividends — was 9.5 percent in 2010, once again outperforming our peers. The TSR for the Philadelphia Utility Index of 20 utilities (including Duke Energy) was 5.7 percent in comparison.
Duke Energy has also maintained one of the electric utility industry’s strongest balance sheets during the economic
Icon denotes additional content online at sustainabilityreport .duke-energy .com
7
recession. That has allowed us to access capital at very low interest rates.
Quality operations also contributed to the bottom line. In addition to record-setting nuclear performance, our regulated fossil (coal and natural gas) generation fleet met high energy demand with excellent commercial availability of approximately 88.7 percent in 2010. Our nonregulated Midwest generation fleet also experienced superior operational results, with commercial availability of 89.7 percent.
You’ll find more detail on our financial and operating performance in our 2010 Annual Report and Form 10-K.
WoRkING ToGEThER
If I’ve learned anything as a utility CEO for more than 20 years, it’s that we can’t go it alone. As a company, we cannot be sustainable unless we continue to engage all of our stakeholders — communities, customers, employees, investors, partners, NGOs (nongovernmental organizations), suppliers, regulators and policymakers.
Engaging our workforceWe achieve business success by
tapping the diversity and talents of our employees. In 2010, we harvested a number of exciting innovations from employee-driven sustainability projects. Throughout this report, you’ll find examples of employees who are account-able in various ways for helping us do business in a sustainable way.
We are making progress on safety. Employees achieved our lowest-ever Total Incident Case Rate (the number of OSHA-recordable incidents per 100 employees) in 2010, and employee TICR has improved by 40 percent since 2006.
But no degree of success is good enough unless every one of our workers goes home safe at the end of the day. Tragically, five contractors died from injuries sustained while working for Duke Energy in 2010.
In late 2010, we commissioned a team of senior leaders to address the issue of contractor safety. This task force will help us move to the next level in our safety culture — where all employees and all contractors go home safely to their families.
partnering with communitiesThe importance of supporting our
communities is magnified in these tough economic times. Charitable giving from The Duke Energy Foundation and the company, along with employee and retiree donations and the value of their volunteer time, totaled nearly $29 million in 2010.
In addition, Duke Energy’s economic development team helped state, regional and local government officials attract almost $5.8 billion in capital investments and nearly 14,000 new jobs to our five service areas.
Charlotte, our headquarters city, is reinventing itself as a hub of energy innovation. The 16-county Charlotte region now has more than 240 energy-related companies employing about 27,000 workers.
participating in public policy It’s been a challenge to lead a
company through an era of regulatory uncertainty related to climate change and other energy policy issues. It’s like playing a high-stakes game with no rules — and you don’t find out until the end if you’ve won or lost.
Having spent a great deal of time and energy advocating for fair climate legisla-tion, I’ve been disappointed that Congress hasn’t passed a bill. Our country needs a sound, clear and consistent energy policy. As an industry, we need to know the rules on carbon emissions, new nuclear development and a host of other issues that affect the investments we make for the future.
I applaud President Obama’s call earlier this year for a review of federal regulations to avoid excessive, inconsis-tent and redundant rules, and promote economic growth. With a clear road map, our industry can accelerate its efforts to replace aging plants, update the power grid, develop clean energy technologies — and create jobs in the process.
foCuSED oN ThE fuTuRE
On Jan. 10, 2011, we announced that Duke Energy would be merging with Progress Energy , based in Raleigh, N.C.
Duke and Progress share a common view of the future. We’ve both been working to improve energy efficiency and develop renewable energy, and to keep nuclear power a viable option. Both
companies have spent billions modernizing our plants and making them cleaner for our customers. For years, we’ve shared work crews and equipment in the aftermath of major storms. We’ve also worked side-by-side at the policy level on key federal and state legislation.
This merger will create the largest electric utility in the U.S. But “bigger” is not our goal. We want to be the best. We will have the size, scale and financial strength to modernize our operations while holding down costs for our customers. And, we will have the humility and agility to foresee — and seize — new opportuni-ties that occur during periods of transfor-mation and change.
In the months ahead, we will be working to secure the necessary approvals and develop plans to integrate our compa-nies. Once the merger is completed, I will become the executive chairman of Duke Energy, and Bill Johnson, the current CEO of Progress Energy, will become our CEO.
I assure you that sustainability will continue to be a priority of the new Duke Energy. In fact, it is key to our drive for productivity gains and an important element of what will become our new corporate culture. In the pages that follow, you’ll read more about the progress Duke Energy is making in our five sustainability focus areas. Following the merger, we will revisit and reset our goals to reflect the combined company.
Let me take this opportunity to thank Roberta Bowman, our chief sustainability officer, who will be retiring from Duke Energy later this year after 25 years of service. We simply could not have come this far this fast without a leader of her caliber guiding our company’s sustain-ability efforts.
Finally, I want to thank all of our employees and stakeholders who have been part of this journey to become a more sustainable company. Your ideas, comments and feedback have made us better.
Sincerely,
Jim Rogers Chairman, President and Chief Executive OfficerApril 6, 2011
DukE ENERGy CoRpoRaTIoN 2010 | 2011 sustainability report
8

Duke Energy’s approach to sustainability focuses on the issues that are most material to our stakeholders and to us. This table represents our current view of our most material issues and their life cycle phases. The issues will continue to evolve as the environment in which we operate changes.
issues of high ConCern to staKehoLders and duKe energy
issue Life CyCLe
emerging deveLoping mature
Affordable and reliable energy
Air quality
Climate change
Coal combustion residuals
Economic development/jobs
Employee engagement and development
Energy effi ciency
Ethics
Mountaintop-removal coal mining
New cleaner-coal and nuclear generation
Nuclear safety in light of the emergency in Japan nEW
Nuclear waste
Philanthropy/volunteerism
Political involvement nEW
Protecting natural/cultural resources eXPANDeD
Reduce, reuse, recycle
Renewables
Safety
Shareholder return/fi nancial success
Smart grid/cyber security eXPANDeD
Supply chain
Water
neW We have added the issue to our listing this year .
eXpanded We have expanded the name to include additional aspects of the issue .
emerging The issue is becoming a high concern to stakeholders and Duke Energy .
deveLoping Solutions and projects are being proposed, piloted or implemented .
mature The issue is well known and best practices are becoming commonplace .
WhaT maTTERS moST
Web eXCLusive Content
■ Duke Energy’s Sustainability Filter©
■ Management Approach to sustainability
Icon denotes additional content online at sustainabilityreport .duke-energy .com
9

DELIVERING ToDay. Duke Energy’s mission is to provide affordable, reliable and increasingly clean energy to customers. We asked two customers — one served by our regulated business and one served by our commercial business — to tell us how we are delivering for them today.
EXTERNaL VIEWpoINTS
Lynn WilsonSenior Vice President of Communications and Investor Relations
Black Hills Corp .
david Holthouser Director of Facilities Management
Davidson College
Davidson College, a nationally recognized liberal arts college located 20 miles north of Charlotte, N.C., is served by our regulated electric power business.
How has duke Energy partnered with your organization? The Davidson College campus uses a sophisticated energy management
system that is wired to most campus buildings . We use the system to manage our peak energy use and demand .
We were in the process of analyzing the Baker sports Complex’s operating infrastructure — including its HVAC system, controls and lighting — when Duke Energy offered to include the sports facility in its Energy Smart Building pilot program . The program uses digital metering and communications technology to give customers more information, options and control over their energy use . The college signed on with Duke Energy and the pilot program, allowing us to integrate information from the retrofi tted facility with Davidson’s centralized energy management system . We also enrolled in PowerShare® — a demand response program that rewards businesses for adjusting energy consumption levels during peak time periods — and accepted more than $75,000 in energy effi ciency incentives to retrofi t the sports complex with up-to-date equipment and controls.
What have been the benefi ts?the retrofi t allows Davidson College to fully maximize the advantages of digital technologies . The real-time metering data and building automation
systems enable us to manage our energy use more effectively than before . This has led to a measurable impact on energy effi ciency — we have seen an average improvement of 30 percent over readings taken before the upgrades . The college has seen similar results for chilled water and steam consumption .
In addition, this program has allowed us to increase our already strong commit-ment to reducing peak demand . For two decades, Davidson has tried to manage its peak demand by shifting loads across time periods . This partnership with Duke Energy has allowed us to do that even more effectively .
How might duke Energy meet your needs in the future? Davidson College staff have long been interested in data — and this
partnership has provided valuable data . We’re excited to see where Duke Energy is going with dashboarding, and thinking about how the college can synchronize that with Duke energy going forward.
Davidson is grateful to have been a part of this pilot, as it has provided opportu-nities for learning on both sides — consistent with our educational mission .
a:
a:
a:
Black Hills Corp. and its utility Cheyenne Light, Fuel & Power have 20-year agreements with Duke Energy to purchase power from two of our commercial wind farms in Wyoming.
Why did Cheyenne Light, Fuel & Power choose to buy power from duke Energy’s wind farms? in all of our projects, we look for strong partners to help us fulfi ll our
customer-focused mission of “Improving Life with Energy .” With Duke’s reputation as a leader in the energy industry, we knew we would be working with a partner who would ensure that the Happy Jack and Silver Sage wind projects were completed in a timely, cost-effective manner — and operated effi ciently to deliver safe and reliable energy to our utilities .
How do the wind farms benefi t your customers and your community? The Happy Jack and Silver Sage wind farms allow us to cost-effectively
bring a renewable source of energy to our customers as part of a diverse generation portfolio . Wyoming currently has no mandates for renewable energy . These wind projects demonstrate to our customers, communities and regulators that we are willing to contract for and/or invest in renewable energy sources and new technologies — in a way that mitigates the rate impact on our customers . In addition, these wind farms give us the opportunity to educate our customers, employees and shareholders about the benefi ts, operational challenges and costs of renewable energy .
What advice do you have for duke Energy as we develop future wind farms? At Black Hills Corp. and at all of our utilities, we believe it is important
to deliver energy to our customers from a diverse portfolio of resources . As part of that commitment, we work continuously to identify new technologies and energy sources that can reduce our impact on the environment, keep us in compliance with regulations and help us maintain reasonable rates for our customers .
All of our decisions take into account the fi nancial impact on customers and the operational impacts on our utility systems . We believe this is something all energy businesses should think about, in light of changing environmental regulations and as new renewable energy technologies become more available, reliable and cost-effective .
a:
a:
a:
DukE ENERGy CoRpoRaTIoN 2010 | 2011 sustainability report
10

dr. S. ming SungChief Representative for Asia-Pacifi c
Clean Air task Force
John WatersOwner and President
Waters & Associates Consulting
John Waters is an entrepreneur specializing in the development of sustainable products and solutions. He launched Bright Automotive Inc., creator of the IDEA plug-in hybrid electric fl eet vehicle.
What are the advantages of electric vehicles?In a word, freedom ... As an example, Charles Kettering, edison’s contemporary, added electrons to the fi rst internal combustion engine
car in 1911, replacing the ineffi cient hand-crank starter — and liberating women to drive the new “horseless carriages .”
We have now advanced to electric vehicles that will bring the consumer radical new freedoms — in effi ciency, cost, maintenance, performance, sound, communication and safety . The electric power train is more than three times as effi cient as internal combustion, and the potential supply of electrons is infi nite.
What are the key challenges to widespread adoption?My answer may be a bit tainted, as I was involved in GM’s EV1 program in the mid-90s. its history was captured in the documentary “Who Killed
the Electric Car?” Entire industries can be threatened by this radical improvement in transportation, and government subsidies often confuse the competitive market and impede true innovation . Widespread adoption will occur when the American consumer realizes — and is willing to pay for — the electric vehicle’s inherent simplicity, performance, safety, convenience, and low-cost repair and maintenance .
Electric vehicles generate value at multiple levels: homeland security, quality of life, sustainability, clean-tech innovation and cost savings . Bottom line: People will buy products at a tangible value. Automakers will need to offer valuable electric vehicles, and that requires a revolution in thinking, design and production .
What advice do you have for duke Energy, as we prepare for potential widespread use of electric vehicles?
Duke Energy needs to continue its leadership in the electric vehicle revolution . While Duke has pursued pilot projects and collaborated with
partners, the company might also move more aggressively to develop best practices in EV charging and distributed energy storage . These best practices could be readily implemented with proven technology, consumer benefi ts, and energy, emissions and cost savings . The distributed energy capability of electric vehicles has the potential to provide supplemental power, grid stability and renewable energy storage. All of this leads to tangible technological and economic sustainability, led by the innovative utility sector, and Duke Energy .
a:a:
a:
a:
Dr. Sung is well known in the U.S. and China for his expertise in clean energy technologies and large energy project development. He has helped Duke Energy form relationships with Chinese energy companies.
What are the advantages of U.S. and Chinese partnerships on clean energy technologies? in the years that the Clean Air task Force and Duke energy have been
working together, we’ve seen that the u .S . and China are complementary in most areas of clean energy development . The u .S . tends to lead in technology innovation, fi nancial and business structures, product marketing and fi nancial management . China leads in its ability to implement projects once they’re designed, and to refi ne existing technologies to meet local requirements. Chinese companies also have access to lower-cost capital .
What’s most important is that, together, we are developing advanced clean energy technologies faster and at lower costs than we ever could separately, and therefore taking aim at the leading cause of global climate change . This is not a zero-sum game, or a business competition. the market potential for these technologies is too large to be cornered by any one company .
Which clean energy technologies are the most promising in the near term?In order to address global climate change, we must develop all clean energy technologies as fast as possible . In the clean-coal area,
post-combustion carbon dioxide (CO2) capture, coal gasifi cation, integrated gasifi cation combined-cycle and polygeneration (creating multiple products from a coal plant) are the most promising . For renewables, we need to dramatically lower the costs of solar and wind . In addition, we need to bring to scale smaller modular nuclear reactors, solar thermal generation, CO2 geologic sequestration and renewable energy storage . Finally, we should continue to pursue smart total energy management — from generation to distribution to energy effi ciency improvements.
Given your experience bringing U.S. and Chinese companies together, what advice do you have for duke Energy?
I believe Duke should continue to develop deeper relationships with its Chinese partners in ways that provide mutual benefi ts in terms of project
execution and broader business strategy . Duke should continuously evaluate partnership opportunities with Chinese fi rms in light of its own business strategy and priorities, and focus on achieving success in a few key projects .
a:
a:
a:
INVESTING foR ouR fuTuRE. To make the investments needed to ensure a sustainable future, Duke Energy works with experts to better understand emerging trends and opportunities. We asked two of them to share their thoughts on electric vehicles and technology partnerships with Chinese energy companies.
Icon denotes additional content online at sustainabilityreport .duke-energy .com
11

Reliable Energy:
Maintain the high reliability of our generation system.
2010 Status:
■ Nuclear capacity factor was approximately 95.9 percent versus a target of 93.8 percent.
■ Regulated fossil commercial availability was approximately 88.7 percent versus a target of 88.3 percent.
■ Nonregulated fossil commercial avail-ability was approximately 89.7 percent versus a target of 87.2 percent.
Maintain the high reliability of our distribution system.
2010 Status: Though we have improved reliability substantially in recent years, we did not meet our aggressive 2010 goals due to more lightning strikes.
■ Average number of outages* was 1.11 versus a target of 1.10.
■ Average outage duration* was 144 minutes versus a target of 139 minutes.
* Outages longer than 5 minutes; statistics are reported per customer .
DukE ENERGy SuSTaINaBILITy pLaN
aND pRoGRESS aT a GLaNCE
1 Innovative Products and Services 2 Environmental
Footprint
Corporate sustainabiLity goaLs
Carbon Emissions: Reduce or offset the carbon dioxide (CO2 ) emissions from our U.S. generation fl eet 17 percent from 2005 by 2020 (i.e., go from 105 million tons in 2005 to 87 million tons in 2020).
2010 Status: Due to higher electricity demand from customers, our U.S. generation fl eet emitted about 100 million tons of CO2 — up from 94 million tons in 2009, when the economy was weaker. Current forecasts indicate higher electricity demand and other factors will cause our emissions to exceed the 2020 goal. New nuclear generation capacity, if built in the 2021-2023 time frame as currently forecasted, will help reduce emissions and move us substantially closer to a 17 percent reduction.
Carbon Intensity: Reduce the carbon intensity (tons of CO2 emitted per net megawatt-hour of electricity produced) of our total generation fl eet from 0.63 in 2005 to 0.50 by 2020.
2010 Status: Our total generation fl eet carbon intensity increased slightly — from 0.59 in 2009 to 0.60 in 2010 — due to the same factors mentioned above. Current forecasts indicate our carbon intensity will slightly exceed the 2020 goal.
Waste: Increase the percentage of solid waste that is recycled from 52 percent in 2008 to 62 percent by 2012. (This goal excludes Duke Energy International and Duke Energy Generation Services.)
2010 Status: We recycled more than 24,000 tons of materials, or about 63 percent of the total waste stream. While we have reached our goal, staying on track for 2012 will require the continued participation of employees across the company.
Provide innovative products and services in a carbon-constrained, competitive world.
Why it matters: Our customers want products and services that keep them competitive, yet respond to environmental concerns.
Reduce our environmental footprint.
Why it matters: As an energy company, we have a large impact on the environment and depend on natural resources for our fuel.
Energy Effi ciency: Reduce customer energy consumption by 2,500 gigawatt-hours (GWh) and peak demand by 2,100 megawatts (MW) by 2013.
2010 Status: As of year-end 2010, energy consumption was reduced by 1,270 GWh, and peak demand was reduced by 798 MW.
Renewables: Scale up to 3,000 MW of wind, solar and biomass by 2020.
2010 Status: We added more than 250 MW of wind and solar energy in 2010, ending the year with more than 1,000 MW in service.
affordable Energy: Maintain rates lower than the national average.
2010 Status:
Duke Energy’s regulated average retail rates were lower than the U.S. average in South Carolina, North Carolina, Indiana and Kentucky.
Due to the economic downturn and drop in wholesale prices, our regulated average retail rate in Ohio, which was set in 2008 through the end of 2011, is now above the national average. (For information about how we are addressing this issue, see pages 18-19 of this report.)
Corporate sustainabiLity goaLs
DukE ENERGy CoRpoRaTIoN 2010 | 2011 sustainability report
12

Corporate sustainabiLity goaLs
Safety:
Achieve zero work-related fatalities.
2010 Status: Tragically, fi ve contrac-tors died from injuries sustained while working for Duke Energy in 2010. A team of senior leaders has been formed to address the issue of contractor safety.
Achieve top-decile safety performance in employee Total Incident Case Rate (TICR) by 2012.
2010 Status: We exceeded our aggres-sive employee target in 2010, achieving a TICR of 0.9. Employee TICR has improved in each of the past fi ve years, and 40 percent since 2006. We are on track to be in the top decile by 2012.
Employee Engagement: Maintain management and employee engage-ment at 75 percent and 64 percent, respectively, or higher, as measured by favorable scores on survey questions.
2010 Status: Management and employee engagement were 76 and 71 percent, respectively.
Corporate sustainabiLity goaLs
philanthropy: Develop the baseline number of lives positively impacted by our support of key community partners during 2010.
2010 Status: We piloted a process to evaluate the impacts of our philanthropy on the community. The pilot included 12 grants ranging from $125,000 to $5 million, given over a period of one to fi ve years, totaling $16.5 million. By engaging with our key community partners, we learned that in 2009 over 1 million lives were positively impacted by those 12 grants. Given the value we and our community partners gained from this evaluation process, we plan to continue it in 2011.
Corporate sustainabiLity goaLs
Shareholder Return: Outperform our peers in total shareholder return (TSR) annually and over a three-year period, as measured by the Philadelphia Utility Index.
2010 Status: Our TSR was 9.5 percent for 2010, exceeding our peers as measured by the Philadelphia Utility Index. TSR for the index was 5.7 percent in 2010. Duke Energy has achieved cumulative TSR of 4.7 percent over the past three years, while the utility index TSR has been a negative 15.4 percent.
This sustainability plan refl ects Duke Energy’s commitment to operate in a way that is good for people, the planet and profi ts. It expands on the company’s business strategy and values. After our merger with Progress Energy is complete, we will be updating our sustainability plan and goals to refl ect the merged company.
Attract, develop and retain a diverse, high-quality workforce.
Why it matters: Energy companies will be differentiated by the quality, creativity and customer focus of their employees.
Help build strong communities.
Why it matters: Our success is linked to the health and prosperity of the communities we serve.
Be profi table and demonstrate strong governance and transparency.
Why it matters: Creating shareholder value and earning the trust and confi dence of our many stakeholders keeps us in business.
4 Strong Communities3 Quality
Workforce 5 Governance and Transparency
progress Key: ACHieVeD or oN trACK CurreNtlY Not oN trACK goAl Not ACHieVeD
Icon denotes additional content online at sustainabilityreport .duke-energy .com
13

ChaLLENGES
■ Keep rates affordable as we invest in modernizing our system. ■ Grow our renewable energy portfolio, despite the economic downturn
and increased competition. ■ Continue to mitigate the impact of customer switching in Ohio.
oppoRTuNITIES
■ Help customers save power and money through energy effi ciency offerings that also benefi t the environment.
■ Continue to be a leader in building a smart grid network. ■ Develop infrastructure to support widespread adoption of plug-in
electric vehicles.
2010 aND EaRLy 2011 hIGhLIGhTS
■ Deployed energy effi ciency programs under our new regulatory model that enables us to earn a return for helping customers lower their energy bills.
■ Added more than 250 megawatts (MW) of wind and solar energy in 2010, ending the year with more than 1,000 MW in service.
■ Continued smart grid pilots in the Carolinas and deployments in Ohio.
1Innovative Products and Services
moVING ToWaRD a SECuRE, DIGITaL GRID
We are implementing digital technologies in our century-old power grid to build a secure and fl exible network that can handle today’s advancements in energy — and tomorrow’s.
The digital grid will improve the fl exibility and resiliency of our electric system. This means improved effi ciency, better power quality and reliability, and more options for renewable energy, energy storage and plug-in electric vehicles. And, it will enable us to offer new effi ciency programs to give customers greater control over their energy use and costs.
ohio We received regulatory approval to
implement the smart grid in Ohio in 2008. In 2010, we began full-scale deployment of the technology.
■ Ohio is the fi rst state in Duke Energy’s footprint to modernize its power delivery system with digital technology.
■ Duke Energy has installed approxi-mately 140,000 smart electric meters, 100,000 smart gas meters, and 22,000 communication nodes in Ohio — eliminating the need for manual meter readings and giving customers greater insight into their daily energy usage.
■ We are installing distribution automa-tion equipment, such as relays, circuit breakers and sensors, to improve reliability. This digital equipment can automatically shorten power outages and even prevent them altogether. The technology also improves the system’s effi ciency by reducing the amount of energy lost from the lines as it travels long distances.
■ Installations will grow to more than 1 million smart electric and gas meters and other components over the next fi ve years.

IndianaDuke Energy Indiana’s original
proposal to install 800,000 smart meters was rejected by the Indiana Utility Regulatory Commission (IURC) in late 2009. But the commission asked us to come back with a scaled-back smart grid rollout plan.■ In April 2010, we filed a plan to install
40,000 smart meters and distribution automation, and to pilot time-of-use rates, electric vehicles, distributed solar generation and stationary battery storage.
■ The test area includes 39,000 residen-tial customers and 1,000 commercial customers just north of Indianapolis.
■ We will collect pilot data for a year. We then hope to be able to demonstrate to regulators that the programs should be implemented across our service territory.
■ Duke Energy presented the plan during an IURC hearing in July 2010. We anticipate a ruling in 2011.
kentucky and the CarolinasWe’re working through the planning
process to finalize full-scale deployment plans in Kentucky and the Carolinas. In the meantime, we will use information from our North Carolina pilot programs and our Ohio rollout to enhance the customer experience in our other service territories.
DukE ENERGy pREppING foR ELECTRIC VEhICLES
In late 2010, manufacturers like General Motors and Nissan began deploying their new plug-in electric vehicles (PEVs) in the U.S. Duke Energy is preparing for widespread adoption through a variety of programs and partnerships. Our job is twofold: to maintain a safe and reliable power grid as demand grows for electricity as a transportation fuel, and to ensure a positive experience for our customers.
The benefits of electric vehicles are clear:our customers will save money.
Given today’s oil prices, “filling up” an electric vehicle is a cheaper alternative to fueling gasoline-powered vehicles.
The environment will benefit. Widespread adoption of electric vehicles will significantly cut vehicle emissions.
Electricity is a domestic resource. Electric vehicles reduce our dependence on foreign oil and lead to more local jobs.
A plug-in electric vehicle’s impact on greenhouse gas emissions depends on the source of the electricity used to charge its battery . When power is produced by nuclear or renewable energy sources, electric cars reduce emissions dramatically . However, even in regions where most electricity is produced by coal, PEVs still reduce greenhouse gases by 25 to 30 percent over conventional vehicles . Source: www .GoElectricDrive .com
pilot programsEligible residential customers will
receive electric vehicle charging stations as part of pilot programs in Indiana and the Carolinas. Duke Energy will install charging stations, as well as service the technology for the duration of the programs. When the pilot ends, participants will have the option of purchasing the charging stations at significant savings.
We recently installed electric vehicle charging stations at our Charlotte and Plainfield corporate offices, and plan instal-lations at additional company locations in 2011. Partially funded by the American Recovery and Reinvestment Act, these installations will support pilot programs to evaluate the impact of PEVs on our power grid. For example, our own plug-in electric vehicle deployment project recently enlisted 10 Duke Energy employees to test the new Chevy Volt in North Carolina.
We will use the insights and informa-tion we gain from these pilots to design products and services that appeal to PEV owners, and to develop model regulatory frameworks for future PEV deployments.
IToChu partnershipDuke Energy and Tokyo-based
ITOCHU Corp. signed an agreement in November 2010 to collaborate on advanced energy technologies, starting with the evaluation and testing of second-life applications for electric vehicle (EV) batteries.
According to some auto industry estimates, EV batteries that can no longer charge to approximately 80 percent of their original capacity may be candidates for replacement. Duke Energy and ITOCHU believe these partially used batteries could live on in other applications, like supplementing home energy supply, storing renewable power or providing a fast-charging power source for EVs. By increasing the total lifetime value of batteries, second-life applications could also help reduce initial battery cost.
This pilot project will help Duke Energy and ITOCHU develop potential business models for future commercialization.
Cyber seCurity
Emerging technologies — regardless of industry — always open new avenues of risk . Duke Energy is continually assessing and improving its security plan to keep pace with growing cyber-threats, regulatory and oversight expectations, and evolving digital grid technologies .
Duke Energy’s digital grid components are protected with layers of cyber and physical security:
■ The company employs skilled information technology experts who constantly monitor our system’s security .
■ Our active relationships with manufacturers and regulators help ensure that we have a broad view of real-time cyber-security threats and can respond to them appropriately . We review security as part of the new-technology design process, and include security requirements when procuring new equipment. We also test new equipment, and request upgrades and fixes if problems are identified.
■ Our robust cyber-security policies help ensure the safety of our power delivery system, including the digital grid .
Icon denotes additional content online at sustainabilityreport .duke-energy .com
15

a GREENER upToWN ChaRLoTTE
Duke Energy, Cisco, Verizon Wireless and Charlotte Center City Partners are collaborating on Envision: Charlotte, announced at the 2010 Clinton Global Initiative. The aim is to reduce energy use in our headquarters city by up to 20 percent among about 70 offi ce buildings by 2016 — avoiding approximately 220,000 metric tons of greenhouse gases.
Using Duke Energy’s Smart Energy NowSM energy effi ciency services, Envision: Charlotte will use digital energy technologies to gather data on the buildings’ collective energy use. Display screens in participating buildings and throughout uptown will provide near-real-time updates.
Duke Energy is funding 70 percent of the program’s cost, with Cisco and Verizon funding the remainder. In February 2011,
the N.C. Utilities Commission approved our ability to recover a portion of our costs under our energy effi ciency framework.
aNoThER STRoNG yEaR foR RENEWaBLES
As the economy forces many renewable energy project developers to scale back or delay their plans, Duke Energy continues to build its wind and solar portfolio.
Winds of ChangeDuke Energy Renewables, a newly
named commercial business unit, added 251 megawatts (MW) of wind-generated capacity in 2010. The 51-MW Kit Carson Windpower Project, completed in November 2010, is the company’s fi rst renewable energy facility in Colorado. The 200-MW Top of the World Windpower Project near Casper, Wyo., is our second in the area and fourth in the Cowboy State.
While we met our goal of adding between 200 and 300 MW of wind energy to our portfolio in 2010, we foresee market challenges ahead. Because whole-sale customers are requesting fewer bids, Duke Energy’s wind business, as well as the U.S. wind power industry as a whole, may slow in 2011. However, our pipeline of potential development projects — more than 5,000 MW — creates excellent prospects for growth in 2012 and beyond.
In August 2010, Duke Energy canceled plans to erect three demonstration wind turbines in North Carolina’s Pamlico Sound, between the mainland and the state’s Outer Banks. After a year of in-depth study and collaboration with the University of North Carolina at Chapel Hill, we concluded that the fi xed costs associated with permitting, design and construction of the small-scale project would not be economically viable. Our partnership with UNC-Chapel Hill is now focused on studies to enable large-scale offshore wind development on the ocean side of the N.C. coast.
Solar power Shining BrightlyProven technology and improved
economies of scale helped fuel new investments in solar energy in 2010. Duke Energy Renewables acquired and completed three commercial solar farms — two 1-MW photovoltaic (PV) projects in North Carolina and a 14-MW facility in Texas. The Blue Wing Solar Project near San Antonio consists of approximately
Duke energy’s Kit Carson Windpower Project in eastern Colorado
vincent davisDirector, Smart Energy now Community PartnershipsCharlotte, n .C .
I’m accountable for Envision: Charlotte, a team effort to create one of the most sustainable and energy effi cient urban cores in the u.s. this is an exciting, fi rst-of-its-kind program, and it refl ects Charlotte’s role as an emerging “energy capital .”
We are starting out by equipping buildings in Charlotte’s uptown business area with the latest in energy technologies . We’ll be able to use near-real-time energy use data to create awareness and change behavior among building owners and managers, companies and employees . That is really the core of this program — to engage the public in a way that creates actionable behavior .
Helping customers use less energy can delay the building of new power plants, which is good for Duke Energy, our customers and the community . The initiative is also transforming Charlotte into an active learning laboratory for innovative sustainability practices. As we create a model for sustainability, energy effi ciency and innovation, we’ll become a role model for the country — perhaps even the world.
Envision: Charlotte carries an even deeper, more personal meaning to me . The company’s Sustainability Filter asks us to look through the eyes of future generations when we make decisions . I have two children . I want them to thrive in a community that takes responsibility for its actions . We have this unique opportunity to change the way our community uses energy . I have high hopes that this will inspire people to envision their own sustainable future, and join together to make it a reality .
i’m aCCountabLe
urban cores in the u.s. this is an exciting, fi rst-of-its-kind program, and it refl ects
DukE ENERGy CoRpoRaTIoN 2010 | 2011 sustainability report
16
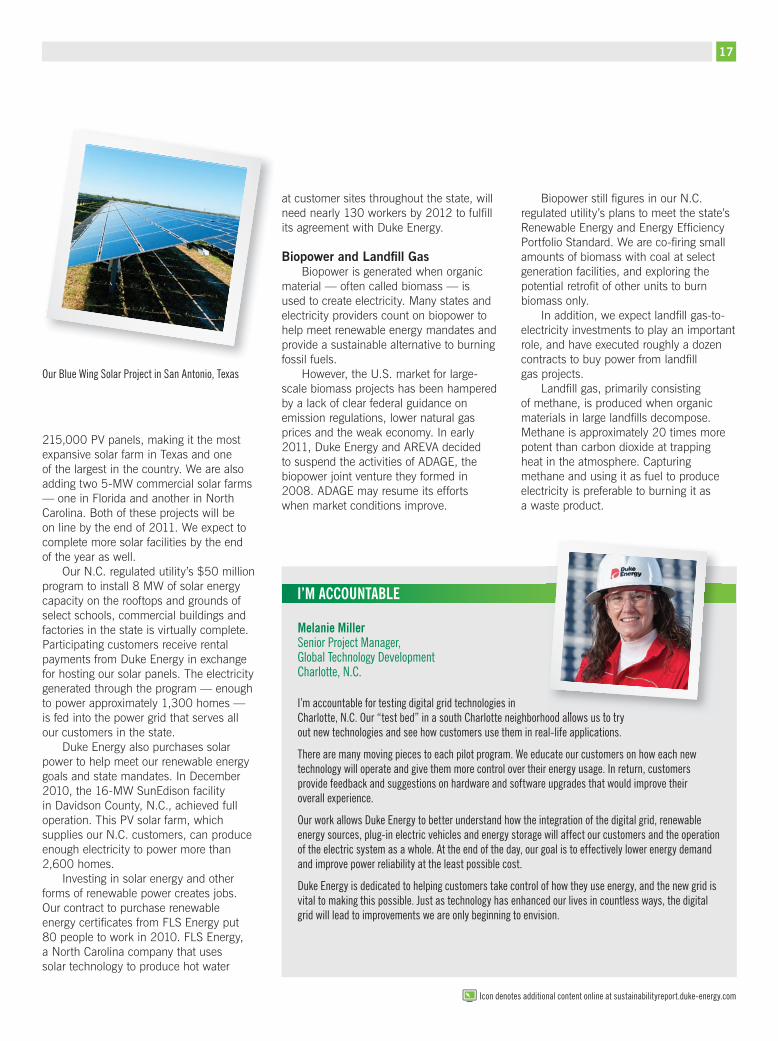
215,000 PV panels, making it the most expansive solar farm in Texas and one of the largest in the country. We are also adding two 5-MW commercial solar farms — one in Florida and another in North Carolina. Both of these projects will be on line by the end of 2011. We expect to complete more solar facilities by the end of the year as well.
Our N.C. regulated utility’s $50 million program to install 8 MW of solar energy capacity on the rooftops and grounds of select schools, commercial buildings and factories in the state is virtually complete. Participating customers receive rental payments from Duke Energy in exchange for hosting our solar panels. The electricity generated through the program — enough to power approximately 1,300 homes — is fed into the power grid that serves all our customers in the state.
Duke Energy also purchases solar power to help meet our renewable energy goals and state mandates. In December 2010, the 16-MW SunEdison facility in Davidson County, N.C., achieved full operation. This PV solar farm, which supplies our N.C. customers, can produce enough electricity to power more than 2,600 homes.
Investing in solar energy and other forms of renewable power creates jobs. Our contract to purchase renewable energy certifi cates from FLS Energy put 80 people to work in 2010. FLS Energy, a North Carolina company that uses solar technology to produce hot water
at customer sites throughout the state, will need nearly 130 workers by 2012 to fulfi ll its agreement with Duke Energy.
Biopower and Landfi ll GasBiopower is generated when organic
material — often called biomass — is used to create electricity. Many states and electricity providers count on biopower to help meet renewable energy mandates and provide a sustainable alternative to burning fossil fuels.
However, the U.S. market for large-scale biomass projects has been hampered by a lack of clear federal guidance on emission regulations, lower natural gas prices and the weak economy. In early 2011, Duke Energy and AREVA decided to suspend the activities of ADAGE, the biopower joint venture they formed in 2008. ADAGE may resume its efforts when market conditions improve.
Biopower still fi gures in our N.C. regulated utility’s plans to meet the state’s Renewable Energy and Energy Effi ciency Portfolio Standard. We are co-fi ring small amounts of biomass with coal at select generation facilities, and exploring the potential retrofi t of other units to burn biomass only.
In addition, we expect landfi ll gas-to-electricity investments to play an important role, and have executed roughly a dozen contracts to buy power from landfi ll gas projects.
Landfi ll gas, primarily consisting of methane, is produced when organic materials in large landfi lls decompose. Methane is approximately 20 times more potent than carbon dioxide at trapping heat in the atmosphere. Capturing methane and using it as fuel to produce electricity is preferable to burning it as a waste product.
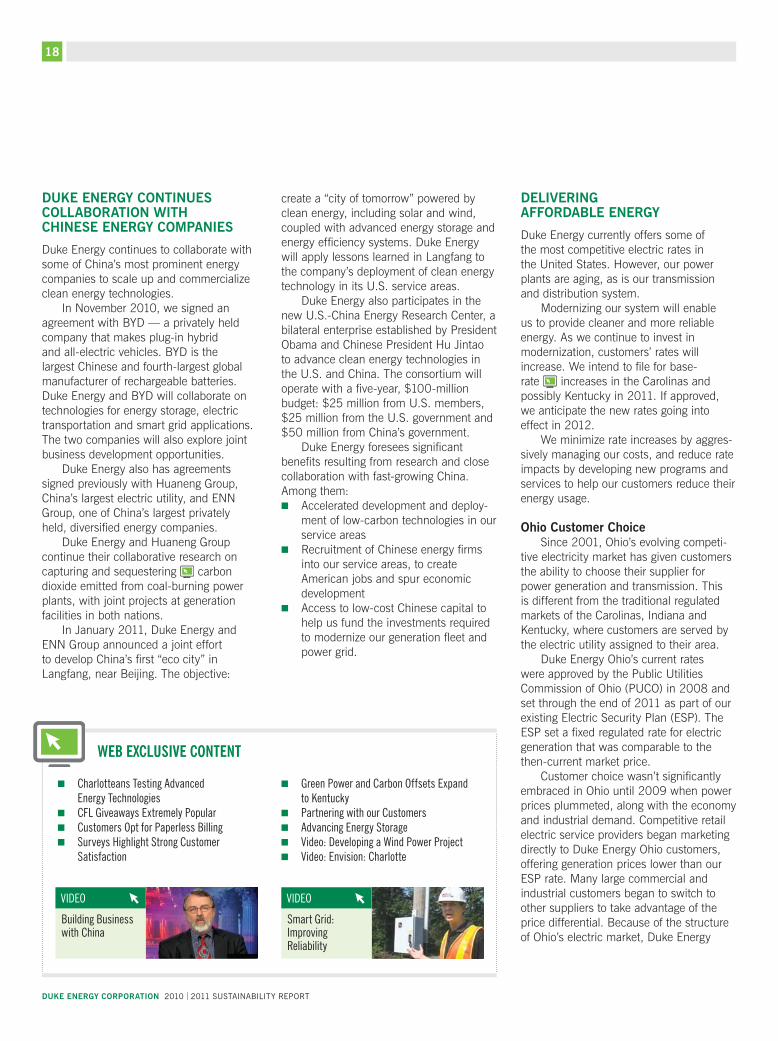
melanie millerSenior Project Manager, Global Technology DevelopmentCharlotte, n .C .
I’m accountable for testing digital grid technologies in Charlotte, n .C . Our “test bed” in a south Charlotte neighborhood allows us to try out new technologies and see how customers use them in real-life applications .
There are many moving pieces to each pilot program . We educate our customers on how each new technology will operate and give them more control over their energy usage . In return, customers provide feedback and suggestions on hardware and software upgrades that would improve their overall experience .
Our work allows Duke Energy to better understand how the integration of the digital grid, renewable energy sources, plug-in electric vehicles and energy storage will affect our customers and the operation of the electric system as a whole. At the end of the day, our goal is to effectively lower energy demand and improve power reliability at the least possible cost .
Duke Energy is dedicated to helping customers take control of how they use energy, and the new grid is vital to making this possible . Just as technology has enhanced our lives in countless ways, the digital grid will lead to improvements we are only beginning to envision .
i’m aCCountabLe
Charlotte, n .C . Our “test bed” in a south Charlotte neighborhood allows us to try
our Blue Wing solar Project in san Antonio, texas
Icon denotes additional content online at sustainabilityreport .duke-energy .com
17
DukE ENERGy CoNTINuES CoLLaBoRaTIoN WITh ChINESE ENERGy CompaNIES
Duke Energy continues to collaborate with some of China’s most prominent energy companies to scale up and commercialize clean energy technologies.
In November 2010, we signed an agreement with BYD — a privately held company that makes plug-in hybrid and all-electric vehicles. BYD is the largest Chinese and fourth-largest global manufacturer of rechargeable batteries. Duke Energy and BYD will collaborate on technologies for energy storage, electric transportation and smart grid applications. The two companies will also explore joint business development opportunities.
Duke Energy also has agreements signed previously with Huaneng Group, China’s largest electric utility, and ENN Group, one of China’s largest privately held, diversifi ed energy companies.
Duke Energy and Huaneng Group continue their collaborative research on capturing and sequestering carbon dioxide emitted from coal-burning power plants, with joint projects at generation facilities in both nations.
In January 2011, Duke Energy and ENN Group announced a joint effort to develop China’s fi rst “eco city” in Langfang, near Beijing. The objective:
create a “city of tomorrow” powered by clean energy, including solar and wind, coupled with advanced energy storage and energy effi ciency systems. Duke Energy will apply lessons learned in Langfang to the company’s deployment of clean energy technology in its U.S. service areas.
Duke Energy also participates in the new U.S.-China Energy Research Center, a bilateral enterprise established by President Obama and Chinese President Hu Jintao to advance clean energy technologies in the U.S. and China. The consortium will operate with a fi ve-year, $100-million budget: $25 million from U.S. members, $25 million from the U.S. government and $50 million from China’s government.
Duke Energy foresees signifi cant benefi ts resulting from research and close collaboration with fast-growing China. Among them: ■ Accelerated development and deploy-
ment of low-carbon technologies in our service areas
■ Recruitment of Chinese energy fi rms into our service areas, to create American jobs and spur economic development
■ Access to low-cost Chinese capital to help us fund the investments required to modernize our generation fl eet and power grid.
DELIVERING affoRDaBLE ENERGy
Duke Energy currently offers some of the most competitive electric rates in the United States. However, our power plants are aging, as is our transmission and distribution system.
Modernizing our system will enable us to provide cleaner and more reliable energy. As we continue to invest in modernization, customers’ rates will increase. We intend to fi le for base-rate increases in the Carolinas and possibly Kentucky in 2011. If approved, we anticipate the new rates going into effect in 2012.
We minimize rate increases by aggres-sively managing our costs, and reduce rate impacts by developing new programs and services to help our customers reduce their energy usage.
ohio Customer ChoiceSince 2001, Ohio’s evolving competi-
tive electricity market has given customers the ability to choose their supplier for power generation and transmission. This is different from the traditional regulated markets of the Carolinas, Indiana and Kentucky, where customers are served by the electric utility assigned to their area.
Duke Energy Ohio’s current rates were approved by the Public Utilities Commission of Ohio (PUCO) in 2008 and set through the end of 2011 as part of our existing Electric Security Plan (ESP). The ESP set a fi xed regulated rate for electric generation that was comparable to the then-current market price.
Customer choice wasn’t signifi cantly embraced in Ohio until 2009 when power prices plummeted, along with the economy and industrial demand. Competitive retail electric service providers began marketing directly to Duke Energy Ohio customers, offering generation prices lower than our ESP rate. Many large commercial and industrial customers began to switch to other suppliers to take advantage of the price differential. Because of the structure of Ohio’s electric market, Duke Energy
Web eXCLusive Content
■ Charlotteans testing Advanced Energy Technologies
■ CFL Giveaways Extremely Popular■ Customers Opt for Paperless Billing■ Surveys Highlight Strong Customer
Satisfaction
■ Green Power and Carbon Offsets Expand to Kentucky
■ Partnering with our Customers■ Advancing energy storage■ Video: Developing a Wind Power Project ■ Video: Envision: Charlotte
Building Business with China
VIDEO
Smart Grid: Improving Reliability
VIDEO
DukE ENERGy CoRpoRaTIoN 2010 | 2011 sustainability report
18

Ohio was no longer able to offer them competitive pricing.
To respond to the competitive market, in 2009 Duke Energy Retail, a nonregu-lated subsidiary of Duke Energy Corp., began to market to large commercial and industrial customers in Ohio. In mid-2010, we began marketing to residential customers as well.
By the end of 2010, about 65 percent of Duke Energy Ohio’s customer load had switched to other retail suppliers who offered generation at lower prices. Duke Energy Retail was able to recover approximately 60 percent of that switched load, while also capturing customer load outside our franchised service area. Duke Energy Ohio continues to serve as its customers’ power distribution provider, regardless of which entity they choose for their electric generation.
Late last year, we applied to move toward market-driven rates. The proposed change would have ensured that Duke Energy Ohio customers receive a competitive, reliable supply of electric generation. However, the PUCO did not approve our market-rate application as fi led. In light of this ruling, we are evaluating our options and plan to fi le a revised application.
Duke Energy’s Regulated average Retail Rates(Cents per kilowatt-hour)
source: edison electric institute typical Bills and Average rates report, Summer 2010; 12 months ending 6/30/2010
14 .00
12 .00
10 .00
8 .00
6 .00
4 .00
2 .00
0 South North indiana Kentucky Ohio Carolina Carolina
U.S. Average 9.84
6.537.35 7.43 7.87
11.71
i’m aCCountabLe
Gianna manesSenior Vice President and Chief Customer offi cer
We’re committed to helping customers achieve greater energy effi ciency. In this Q&A, Gianna Manes talks about our current energy-saving programs and what to expect in the future.
What key programs has duke Energy piloted or offered? For many years now, we have offered products, services and information to help customers save
energy and money . We are currently focusing on several new programs, including:
■ Home Energy Comparison Report — provides customers information on how their energy usage compares to an average of their neighbors .
■ Compact fl uorescent light (CFl) bulb distribution — customers can get up to 15 bulbs at a discount or at no cost .
■ Home Energy Management — leverages advanced energy technologies to give customers near-real-time energy usage information . Customers also receive tools to control — either at home or remotely — some of their larger appliances in order to reduce their energy consumption during high-demand periods .
How are the programs going? Any lessons learned?Implementation is going well . We’ve targeted about 18,000 customers in Ohio and South Carolina to receive Home Energy Comparison Reports, and customers are on track to save about 2 percent
— about $20 annually, on average — on their electric bills . We plan to expand this program to other customers by the end of 2011 .
In 2010, our CFL campaigns were hugely successful and resulted in the distribution of more than 10 million compact fl uorescent light bulbs. By replacing their incandescents with those CFls, our customers can save enough energy to power nearly 45,000 homes . Building on the success of last year’s campaigns, we plan to distribute an additional 10 million bulbs in 2011 .
We completed our fi rst Home energy Management pilot in 2010. overall, the results and customer feedback demonstrate that customers want to take control of their energy usage and costs . Their partici-pation proved that small changes add up, and can help reduce peak demand .
This pilot has given us valuable insights into the technology and customers’ expectations . We are using the feedback to enhance the program and will increase the number of pilot participants in north Carolina and Ohio this year .
Are these programs a win for everyone? How? energy effi ciency is a true win for everyone, and is really a key
driver in helping us deliver on our mission of affordable, reliable and increasingly clean energy .
From a customer’s perspective, our energy effi ciency products and services provide the information and tools they need to take control of their energy usage and costs . When our customers make decisions to reduce their energy usage, and that behavior is sustained, we can begin to count on the savings as the “fi fth fuel” in our generation mix . This can reduce our need for peak generation and even delay the need to build new power plants . That will help keep rates affordable for customers, while also reducing emissions . It’s a win across the board for our customers, the company and the environment .
a:
a:
a:
For more Q&As with Gianna Manes, please visit the Innovative Products and Services section of our Sustainability Report online.
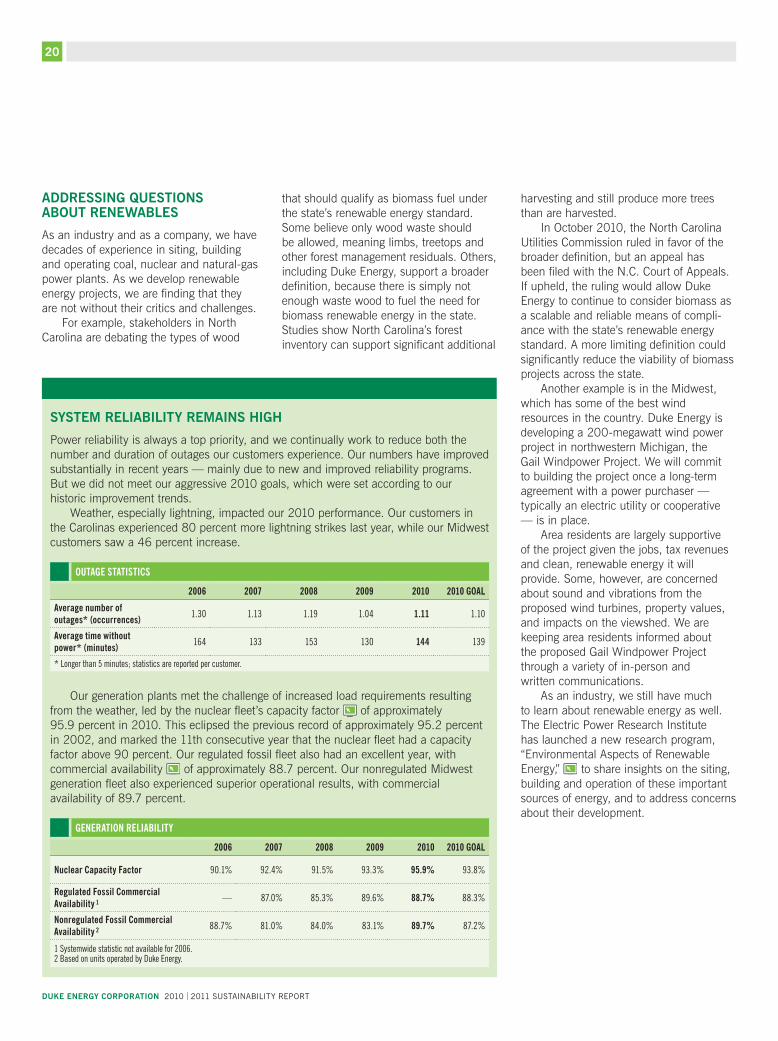
aDDRESSING QuESTIoNS aBouT RENEWaBLES
As an industry and as a company, we have decades of experience in siting, building and operating coal, nuclear and natural-gas power plants. As we develop renewable energy projects, we are finding that they are not without their critics and challenges.
For example, stakeholders in North Carolina are debating the types of wood
that should qualify as biomass fuel under the state’s renewable energy standard. Some believe only wood waste should be allowed, meaning limbs, treetops and other forest management residuals. Others, including Duke Energy, support a broader definition, because there is simply not enough waste wood to fuel the need for biomass renewable energy in the state. Studies show North Carolina’s forest inventory can support significant additional
SySTEm RELIaBILITy REmaINS hIGh
Power reliability is always a top priority, and we continually work to reduce both the number and duration of outages our customers experience. Our numbers have improved substantially in recent years — mainly due to new and improved reliability programs. But we did not meet our aggressive 2010 goals, which were set according to our historic improvement trends.
Weather, especially lightning, impacted our 2010 performance. Our customers in the Carolinas experienced 80 percent more lightning strikes last year, while our Midwest customers saw a 46 percent increase.
outage statistiCs
2006 2007 2008 2009 2010 2010 goaL
Average number of outages* (occurrences) 1 .30 1 .13 1 .19 1 .04 1.11 1 .10
Average time without power* (minutes) 164 133 153 130 144 139
* Longer than 5 minutes; statistics are reported per customer .
Our generation plants met the challenge of increased load requirements resulting from the weather, led by the nuclear fleet’s capacity factor of approximately 95.9 percent in 2010. This eclipsed the previous record of approximately 95.2 percent in 2002, and marked the 11th consecutive year that the nuclear fleet had a capacity factor above 90 percent. Our regulated fossil fleet also had an excellent year, with commercial availability of approximately 88.7 percent. Our nonregulated Midwest generation fleet also experienced superior operational results, with commercial availability of 89.7 percent.
generation reLiabiLity
2006 2007 2008 2009 2010 2010 goaL
Nuclear Capacity Factor 90 .1% 92 .4% 91 .5% 93 .3% 95.9% 93 .8%
Regulated Fossil Commercial Availability 1 — 87 .0% 85 .3% 89 .6% 88.7% 88 .3%
Nonregulated Fossil Commercial Availability 2 88 .7% 81 .0% 84 .0% 83 .1% 89.7% 87 .2%
1 Systemwide statistic not available for 2006 .2 Based on units operated by Duke Energy .
harvesting and still produce more trees than are harvested.
In October 2010, the North Carolina Utilities Commission ruled in favor of the broader definition, but an appeal has been filed with the N.C. Court of Appeals. If upheld, the ruling would allow Duke Energy to continue to consider biomass as a scalable and reliable means of compli-ance with the state’s renewable energy standard. A more limiting definition could significantly reduce the viability of biomass projects across the state.
Another example is in the Midwest, which has some of the best wind resources in the country. Duke Energy is developing a 200-megawatt wind power project in northwestern Michigan, the Gail Windpower Project. We will commit to building the project once a long-term agreement with a power purchaser — typically an electric utility or cooperative — is in place.
Area residents are largely supportive of the project given the jobs, tax revenues and clean, renewable energy it will provide. Some, however, are concerned about sound and vibrations from the proposed wind turbines, property values, and impacts on the viewshed. We are keeping area residents informed about the proposed Gail Windpower Project through a variety of in-person and written communications.
As an industry, we still have much to learn about renewable energy as well. The Electric Power Research Institute has launched a new research program, “Environmental Aspects of Renewable Energy,” to share insights on the siting, building and operation of these important sources of energy, and to address concerns about their development.
DukE ENERGy CoRpoRaTIoN 2010 | 2011 sustainability report
20

2Environmental Footprint
ChaLLENGES
■ Keep rates competitive while making investments to reduce our impact on the environment.
■ Monitor, infl uence and prepare for potential new regulations that could impact our generation fl eet.
■ Address stakeholder concerns associated with Edwardsport, a fi rst-of-its-scale integrated gasifi cation combined-cycle coal plant.
■ Participate fully in industry efforts to understand and learn from the nuclear crisis in Japan.
oppoRTuNITIES
■ Reduce our carbon intensity by retiring and replacing older plants with new, cleaner generation.
■ Encourage U.S. energy policy that benefi ts both the environment and the economy.
■ Reduce demand through energy effi ciency and digital smart grid programs.
■ Partner to effectively manage limited water supplies in some regions.
2010 aND EaRLy 2011 hIGhLIGhTS
■ Made signifi cant progress on building the Cliffside and Edwardsport advanced-coal units.
■ Expanded partnerships with leading Chinese energy companies on clean energy technologies.
■ Reduced sulfur dioxide and nitrogen oxides emissions 73 and 52 percent, respectively, over past fi ve years.
■ Recycled more than 24,000 tons of materials, or about 63 percent of our U.S. solid waste stream.
aDVaNCING SouND ENERGy poLICy
Duke Energy continued to play a leader-ship role in advocating for sound national energy policy in 2010. Regrettably, Congress failed to enact comprehensive climate legislation, which would have put a market price on carbon and more rapidly moved the U.S. toward a low-carbon future. Congressional action on a climate bill is also unlikely in 2011 or 2012.
In early 2011, the U.S. Environmental Protection Agency (EPA) moved forward with its regulatory strategy to control carbon emissions. The EPA’s carbon efforts, along with its numerous regula-tions governing other emissions, have met stiff opposition in both houses of Congress.
Also in early 2011, the Obama administration and some bipartisan members of Congress urged passage of a Clean Energy Standard to mandate the deployment of solar, wind, cleaner-coal and nuclear power generation. Whether such a technology-focused law could pass both houses of Congress remains an open question. Duke Energy could support a properly constructed federal Clean Energy Standard that advances the deployment of low-emitting energy technologies and meets our criteria of fairness, effectiveness and affordability.
‘CLean energy standard’ versus ‘reneWabLe energy standard’
A federal renewable energy standard would mandate the production of renewable energy and exclude nonrenewable, low-carbon resources such as nuclear power and coal-fi red plants equipped with carbon capture and storage. As of January 2011, 29 states have this type of mandate in place, and an additional seven have nonbinding goals. A Clean energy standard at the state or federal level would be broader and would include nonrenewable, low-carbon resources .
Even absent a clear national energy policy — an “energy road map” — Duke Energy is moving forward to modernize and decarbonize its fl eet of power plants and plot its own course toward a cleaner energy future.
21

Ultimately, the path to a cleaner energy future lies with the development and deployment of new technologies. Duke Energy is redefi ning itself as a technology company, far beyond its role as a traditional utility.
For more information on Duke Energy’s political involvement, see the Governance and Transparency section of this report.
‘STRokE of pEN’ RISkS pERSIST foR GENERaTIoN fLEET
Duke Energy continues to actively partici-pate in the development of federal policy that will shape environmental regulations in coming years. These new rules — what we call “stroke of pen” risks — will likely drive additional power plant retrofi ts and retirements. While compliance costs are subject to considerable uncertainty and will depend on fi nal rules, our capital expenditures for new environmental control equipment could total approxi-mately $5 billion over the next 10 years.
air QualityIn August 2010, the U.S.
Environmental Protection Agency (EPA) proposed the Transport Rule to further reduce nitrogen oxides and sulfur dioxide emissions from fossil-fueled power plants in 31 eastern states and the District of Columbia. Phase 1 of the two-phase program would begin Jan. 1, 2012, and Phase 2 would begin Jan. 1, 2014. The
agency expects to fi nalize the rule in mid-2011.
In March 2011, the EPA released its proposed Toxics Rule to limit emissions of mercury and other hazardous air pollutants from coal-fi red power plants across the U.S. Under the proposed schedule, compliance with fi nal emission limits could be required beginning in early 2015. The EPA plans to fi nalize the rule in November 2011.
Revisions to the National Ambient Air Quality Standards (NAAQS) continue. In 2010, the EPA fi nalized tighter air quality standards for sulfur dioxide, and is expected to fi nalize tighter standards for ozone and particulate matter within the next year. As with all NAAQS, state implementation plans will outline how the states intend to implement the more rigorous federal standards.
Water The EPA issued a proposed rule in
March 2011 for existing power plants under Section 316(b) of the Clean Water Act, with the fi nal rule expected in July 2012. The rule’s purpose is to minimize impact to aquatic life from the location or operation of cooling water intake struc-tures by using “best technology available,” including additional studies and possibly closed-cycle cooling towers at our larger steam-generating facilities. A widespread requirement to install cooling towers at existing coal and nuclear plants would affect about 40 percent of U.S. generating
capacity, and could have signifi cant cost and supply impacts. Recognizing that water system and ecosystem needs vary, Duke Energy supports the states’ continued ability to select site-specifi c technologies that best suit local environ-mental and water needs.
The EPA also intends to revise Steam Electric Effl uent Guidelines, which could drive more stringent wastewater permit requirements for ash pond discharges and scrubber wastewater treatment systems. The EPA expects to propose guidelines in mid-2012, with fi nal guide-lines in January 2014 and compliance beginning in mid-2017.
Coal Combustion ResidualsAn ash dike failure at a Tennessee
Valley Authority plant in December 2008 has heightened concerns about dike stability and how utilities manage coal combustions residuals (CCRs), including coal ash and scrubber gypsum. CCR management is currently addressed by varying state regulations.
Duke Energy has a comprehensive monitoring, maintenance and inspection program in place to ensure dike stability, and is committed to managing CCRs in a way that protects human health and the environment. Approximately 9.5 million tons of CCRs were produced at Duke Energy’s coal-fi red plants in 2010, and approximately half was benefi cially used.
A key CCR uncertainty, however, is whether the EPA will seek to reverse its 2000 determination that CCRs are not hazardous waste. The agency’s proposed rule in June 2010 sought comments on both hazardous and nonhazardous waste determinations. Duke Energy supports a federal nonhazardous rule, which would protect human health and the environment, while preserving the ability to recycle ash and gypsum into concrete, wallboard and other products.
We also support including structural integrity standards for surface impound-ments. We believe the rule should not contain blanket impoundment closure requirements, but rather should base closure on performance standards.
We are focusing on clean energy technology at power plants like our Edwardsport facility, under construction in southwestern Indiana . We’re also using technology to help our customers better manage their energy use .
DukE ENERGy CoRpoRaTIoN 2010 | 2011 sustainability report
22
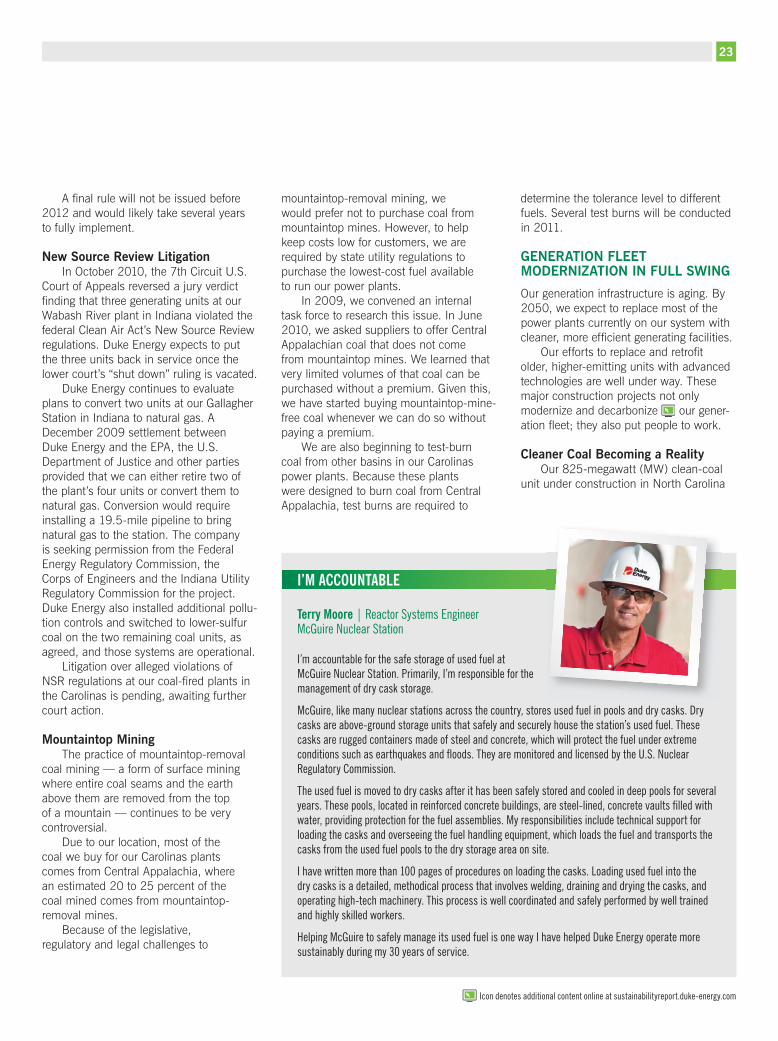
A fi nal rule will not be issued before 2012 and would likely take several years to fully implement.
New Source Review LitigationIn October 2010, the 7th Circuit U.S.
Court of Appeals reversed a jury verdict fi nding that three generating units at our Wabash River plant in Indiana violated the federal Clean Air Act’s New Source Review regulations. Duke Energy expects to put the three units back in service once the lower court’s “shut down” ruling is vacated.
Duke Energy continues to evaluate plans to convert two units at our Gallagher Station in Indiana to natural gas. A December 2009 settlement between Duke Energy and the EPA, the U.S. Department of Justice and other parties provided that we can either retire two of the plant’s four units or convert them to natural gas. Conversion would require installing a 19.5-mile pipeline to bring natural gas to the station. The company is seeking permission from the Federal Energy Regulatory Commission, the Corps of Engineers and the Indiana Utility Regulatory Commission for the project. Duke Energy also installed additional pollu-tion controls and switched to lower-sulfur coal on the two remaining coal units, as agreed, and those systems are operational.
Litigation over alleged violations of NSR regulations at our coal-fi red plants in the Carolinas is pending, awaiting further court action.
mountaintop miningThe practice of mountaintop-removal
coal mining — a form of surface mining where entire coal seams and the earth above them are removed from the top of a mountain — continues to be very controversial.
Due to our location, most of the coal we buy for our Carolinas plants comes from Central Appalachia, where an estimated 20 to 25 percent of the coal mined comes from mountaintop-removal mines.
Because of the legislative, regulatory and legal challenges to
mountaintop-removal mining, we would prefer not to purchase coal from mountaintop mines. However, to help keep costs low for customers, we are required by state utility regulations to purchase the lowest-cost fuel available to run our power plants.
In 2009, we convened an internal task force to research this issue. In June 2010, we asked suppliers to offer Central Appalachian coal that does not come from mountaintop mines. We learned that very limited volumes of that coal can be purchased without a premium. Given this, we have started buying mountaintop-mine-free coal whenever we can do so without paying a premium.
We are also beginning to test-burn coal from other basins in our Carolinas power plants. Because these plants were designed to burn coal from Central Appalachia, test burns are required to
determine the tolerance level to different fuels. Several test burns will be conducted in 2011.
GENERaTIoN fLEET moDERNIZaTIoN IN fuLL SWING
Our generation infrastructure is aging. By 2050, we expect to replace most of the power plants currently on our system with cleaner, more effi cient generating facilities.
Our efforts to replace and retrofi t older, higher-emitting units with advanced technologies are well under way. These major construction projects not only modernize and decarbonize our gener-ation fl eet; they also put people to work.
Cleaner Coal Becoming a RealityOur 825-megawatt (MW) clean-coal
unit under construction in North Carolina
Terry moore | Reactor Systems EngineerMcGuire nuclear Station
I’m accountable for the safe storage of used fuel at McGuire nuclear Station . Primarily, I’m responsible for the management of dry cask storage .
McGuire, like many nuclear stations across the country, stores used fuel in pools and dry casks . Dry casks are above-ground storage units that safely and securely house the station’s used fuel . These casks are rugged containers made of steel and concrete, which will protect the fuel under extreme conditions such as earthquakes and fl oods. they are monitored and licensed by the u.s. Nuclear Regulatory Commission .
The used fuel is moved to dry casks after it has been safely stored and cooled in deep pools for several years. these pools, located in reinforced concrete buildings, are steel-lined, concrete vaults fi lled with water, providing protection for the fuel assemblies . My responsibilities include technical support for loading the casks and overseeing the fuel handling equipment, which loads the fuel and transports the casks from the used fuel pools to the dry storage area on site .
I have written more than 100 pages of procedures on loading the casks . Loading used fuel into the dry casks is a detailed, methodical process that involves welding, draining and drying the casks, and operating high-tech machinery . This process is well coordinated and safely performed by well trained and highly skilled workers .
Helping McGuire to safely manage its used fuel is one way I have helped Duke Energy operate more sustainably during my 30 years of service .
i’m aCCountabLe
Icon denotes additional content online at sustainabilityreport .duke-energy .com
23

is more than 80 percent complete and on budget.
Scheduled to begin operation in 2012, unit 6 at Cliffside Steam Station will be one of the cleanest and most efficient coal units in the country. It will emit 30 percent less carbon dioxide per megawatt-hour generated than older units.
Retirement of four older units at Cliffside, plus 800 MW of older, less efficient coal-fired generation elsewhere on our system, combined with other efforts, will make Cliffside unit 6 carbon-neutral by 2018.
The new unit will have state-of-the-art air emission controls to remove 99 percent of sulfur dioxide emissions, 90 percent of nitrogen oxides emissions and 90 percent of mercury emissions.
The 618-MW Edwardsport integrated gasification combined-cycle (IGCC) facility in Indiana is also more than 80 percent complete, and is scheduled to begin service in the fall of 2012.
The plant will convert coal into a synthetic gas that’s processed to remove pollutants. It will be the first major new coal-fired power plant constructed in Indiana in more than 20 years. We will retire existing units at the site — built between 1944 and 1951.
The new plant will produce 10 times as much power as the older units and will emit less sulfur dioxide, nitrogen oxides and mercury. It will also emit more than 40 percent less carbon dioxide per megawatt-hour. We’re studying the poten-tial for carbon capture at Edwardsport and have a request pending with state regulators to study carbon sequestration.
In April 2010, we updated the plant’s cost estimate from $2.35 billion to $2.88 billion, due to the project’s scale and complexity. The revised cost is being reviewed by the Indiana Utility Regulatory Commission.
In March 2011, we filed a proposal with the commission to cap the project’s construction costs to be passed along to customers at $2.72 billion, excluding financing costs on that amount. Duke Energy is also proposing adjustments to lower the average rate increase related to
ENVIRoNmENTaL fooTpRINT (COnTInuED)
ELECTRICITy GENERaTIoN TRaDE-offS
Every generation technology — coal, natural gas, nuclear, hydro, wind, biomass and solar — has advantages and disadvantages. The Electric Power Research Institute (EPRI) summarizes those trade-offs in its recent assessment of different generation technologies. This EPRI chart illustrates the importance of having a diverse generation portfolio.
generation teChnoLogy referenCe Card
Assessment of relative benefit/impact Coal Coal
w/CCS*Natural
gas Nuclear Hydro Wind Biomass Geo- thermal
Solar Photo- voltaic
Construction cost new plant construction cost for an equivalent amount of generating capacity
Electricity cost Projected cost to produce electricity from a new plant over its lifetime
Land use Area required to support fuel supply and electricity generation
Water requirements Amount of water required to generate equivalent amount of electricity
Co2 emissions Relative amount of CO2 emissions per unit of electricity
Non-CO2 emissions Relative amount of air emissions other than CO2 per unit of electricity
Waste products Presence of other signifi-cant waste products
Availability Ability to generate electricity when needed
Flexibility Ability to quickly respond to changes in demand
* CCS: carbon capture and storage More Favorable Less Favorable
DukE ENERGy CoRpoRaTIoN 2010 | 2011 sustainability report
24
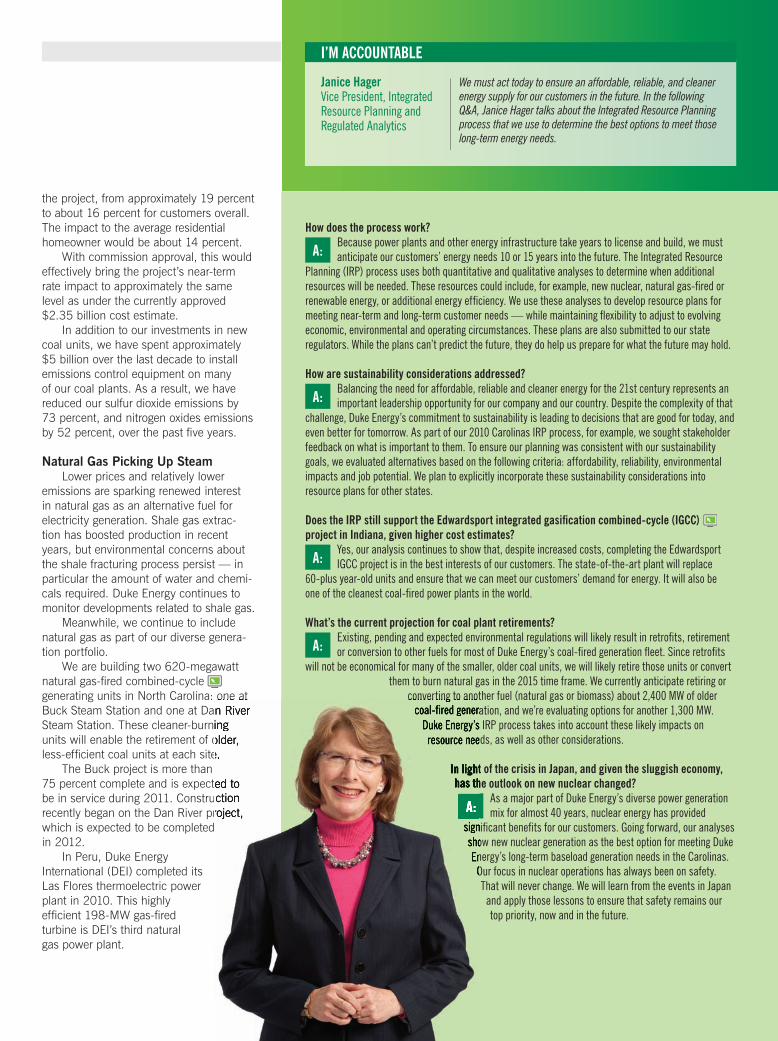
i’m aCCountabLe
How does the process work? Because power plants and other energy infrastructure take years to license and build, we must
anticipate our customers’ energy needs 10 or 15 years into the future . The Integrated Resource Planning (IRP) process uses both quantitative and qualitative analyses to determine when additional resources will be needed. these resources could include, for example, new nuclear, natural gas-fi red or renewable energy, or additional energy effi ciency. We use these analyses to develop resource plans for meeting near-term and long-term customer needs — while maintaining fl exibility to adjust to evolving economic, environmental and operating circumstances . These plans are also submitted to our state regulators . While the plans can’t predict the future, they do help us prepare for what the future may hold .
How are sustainability considerations addressed? Balancing the need for affordable, reliable and cleaner energy for the 21st century represents an
important leadership opportunity for our company and our country . Despite the complexity of that challenge, Duke Energy’s commitment to sustainability is leading to decisions that are good for today, and even better for tomorrow. As part of our 2010 Carolinas irP process, for example, we sought stakeholder feedback on what is important to them . To ensure our planning was consistent with our sustainability goals, we evaluated alternatives based on the following criteria: affordability, reliability, environmental impacts and job potential . We plan to explicitly incorporate these sustainability considerations into resource plans for other states .
does the iRP still support the Edwardsport integrated gasifi cation combined-cycle (iGCC) project in indiana, given higher cost estimates? Yes, our analysis continues to show that, despite increased costs, completing the Edwardsport
IGCC project is in the best interests of our customers . The state-of-the-art plant will replace 60-plus year-old units and ensure that we can meet our customers’ demand for energy . It will also be one of the cleanest coal-fi red power plants in the world.
What’s the current projection for coal plant retirements? existing, pending and expected environmental regulations will likely result in retrofi ts, retirement
or conversion to other fuels for most of Duke energy’s coal-fi red generation fl eet. since retrofi ts will not be economical for many of the smaller, older coal units, we will likely retire those units or convert
them to burn natural gas in the 2015 time frame . We currently anticipate retiring or converting to another fuel (natural gas or biomass) about 2,400 MW of older
coal-fi red generation, and we’re evaluating options for another 1,300 MW. Duke Energy’s IRP process takes into account these likely impacts on
resource needs, as well as other considerations .
in light of the crisis in Japan, and given the sluggish economy, has the outlook on new nuclear changed? As a major part of Duke energy’s diverse power generation
mix for almost 40 years, nuclear energy has provided signifi cant benefi ts for our customers. going forward, our analyses show new nuclear generation as the best option for meeting Duke Energy’s long-term baseload generation needs in the Carolinas .
Our focus in nuclear operations has always been on safety . That will never change . We will learn from the events in Japan
and apply those lessons to ensure that safety remains our top priority, now and in the future .
a:
a:
a:
a:
a:
the project, from approximately 19 percent to about 16 percent for customers overall. The impact to the average residential homeowner would be about 14 percent.
With commission approval, this would effectively bring the project’s near-term rate impact to approximately the same level as under the currently approved $2.35 billion cost estimate.
In addition to our investments in new coal units, we have spent approximately $5 billion over the last decade to install emissions control equipment on many of our coal plants. As a result, we have reduced our sulfur dioxide emissions by 73 percent, and nitrogen oxides emissions by 52 percent, over the past fi ve years.
Natural Gas picking up SteamLower prices and relatively lower
emissions are sparking renewed interest in natural gas as an alternative fuel for electricity generation. Shale gas extrac-tion has boosted production in recent years, but environmental concerns about the shale fracturing process persist — in particular the amount of water and chemi-cals required. Duke Energy continues to monitor developments related to shale gas.
Meanwhile, we continue to include natural gas as part of our diverse genera-tion portfolio.
We are building two 620-megawatt natural gas-fi red combined-cycle generating units in North Carolina: one at Buck Steam Station and one at Dan River Steam Station. These cleaner-burning units will enable the retirement of older, less-effi cient coal units at each site.
The Buck project is more than 75 percent complete and is expected to be in service during 2011. Construction recently began on the Dan River project, which is expected to be completed in 2012.
In Peru, Duke Energy International (DEI) completed its Las Flores thermoelectric power plant in 2010. This highly effi cient 198-MW gas-fi red turbine is DEI’s third natural gas power plant.
converting to another fuel (natural gas or biomass) about 2,400 MW of older coal-fi red generation, and we’re evaluating options for another 1,300 MW.
Duke Energy’s IRP process takes into account these likely impacts on resource needs, as well as other considerations .
in light of the crisis in Japan, and given the sluggish economy, has the outlook on new nuclear changed?
signifi cant benefi ts for our customers. going forward, our analyses show new nuclear generation as the best option for meeting Duke Energy’s long-term baseload generation needs in the Carolinas .
Our focus in nuclear operations has always been on safety .
a:
generating units in North Carolina: one at Buck Steam Station and one at Dan River Steam Station. These cleaner-burning units will enable the retirement of older, less-effi cient coal units at each site.
75 percent complete and is expected to be in service during 2011. Construction recently began on the Dan River project, which is expected to be completed
Janice HagerVice President, Integrated Resource Planning and regulated Analytics
We must act today to ensure an affordable, reliable, and cleaner energy supply for our customers in the future. In the following Q&A, Janice Hager talks about the Integrated Resource Planning process that we use to determine the best options to meet those long-term energy needs.

i’m aCCountabLe
Nuclear Remains an Important Resource
Affordable, reliable and clean nuclear energy has been part of our generation mix for nearly 40 years. And, with zero carbon emissions, it is an important clean-energy resource for the future.
Safety has always been the highest priority in our nuclear operations. Along with the entire nuclear energy industry worldwide, we are engaged in the events in Japan. Our industry will work together to clearly understand the effects of the earthquake and tsunami on the Japanese nuclear plants. And, we will incorporate lessons learned from that experience into our current operations — as well as into our planning for new nuclear units — to further ensure the safety of our plants, our employees and our communities.
Duke Energy remains committed to pursuing a combined construction and operating license (COL) for the proposed Lee Nuclear Station in South Carolina. The COL application to the U.S. Nuclear Regulatory Commission is for two Westinghouse AP1000™ reactors, which have highly advanced technology to ensure plant safety and reliability. We anticipate receiving the COL in the 2013 time frame.
If approved and built, the 2,234-mewagatt facility will signifi cantly reduce the company’s carbon footprint. Lee Nuclear Station would also help stimu-late the region’s economy through job creation and tax revenues, while meeting customers’ need for clean, affordable and reliable electricity.
Increasing hydroelectric CapacityWe continue to enjoy the environ-
mental and peaking-power benefi ts of our company’s oldest generation type — renewable hydroelectric power.
Duke Energy’s Jocassee Pumped-Storage Hydroelectric Station is replacing two turbines to increase capacity by 50 megawatts by summer 2011. These are the fi rst upgrades to Jocassee units 1 and 2 since they began commercial opera-tion in 1973. Units 3 and 4 were upgraded in 2006 and 2007.
What are the industry and duke Energy doing to respond to the crisis in Japan? As this emergency event unfolded, all u.s. chief nuclear offi cers participated in twice-daily phone
conferences to understand what was happening in Japan, and what actions might be needed to ensure the continued safe operation of our nuclear plants . We have also worked through national and international industry agencies to support our counterparts in Japan .
Our industry takes very seriously our commitment to the safe operation of nuclear power plants . As an industry, we agreed early on to take the following short-term actions at u.s. nuclear plants:
■ Reverify our capability to maintain safety during severe adverse events, including the loss of signifi cant operational systems caused by natural events, fi res, aircraft impact or explosions.
■ reverify our ability to respond to a loss of electric power by confi rming that we have adequate materials and procedures in place .
■ reverify our ability to respond to fl oods, including their impact on systems inside and outside the plant.
■ Perform walk downs and inspections of important equipment needed to successfully respond to fi res and fl oods.
What measures are in place at U.S. nuclear facilities to ensure public safety?nuclear power plants are designed for safety, with multiple barriers and redundant and diverse safety systems. the ability to withstand natural events, such as earthquakes, tornadoes, fl oods
and hurricanes, was incorporated into the design of all u .S . nuclear plants . Plant designs also include additional “margin” above design requirements. seismic hazards are based on plant location and geology, and the maximum predicted earthquake .
In addition, all u .S . plants are designed to withstand a station blackout — the total loss of all alternating-current power . Duke Energy plants have on-site power sources beyond the regulatory minimum to provide additional safety margin . This includes, but is not limited to, diesel and steam-driven generators/pumps, batteries, and independent support facilities that can be used in the event of an emergency. Post-sept. 11 measures require u.s. nuclear plants to also be able to cope with signifi cant destruction due to fi res, explosions and aircraft impacts. Additionally, u.s. nuclear power plant operators have guidelines to follow in the unlikely event that a severe accident results in fuel damage, and we regularly practice our response to various severe accidents in emergency preparedness drills .
Will the events in Japan affect the future of the U.S. nuclear industry? It’s premature to draw conclusions about the impact of the Japanese
nuclear crisis on the u .S . The events in Japan will be thoroughly analyzed in the coming months. the nuclear industry regularly studies and learns from shared operating experience . We will incorporate lessons learned from this event into the operation of our existing plants, as well as future plants, and continue to do whatever is necessary to ensure the safety of our communities .
nuclear energy has been and will continue to play a key role in meeting America’s energy needs. Duke energy is continuing with development activities for our proposed Lee nuclear Station in order to make safe, reliable and affordable electricity available for our customers for years into the future .
a:
a:
a:
dhiaa JamilGroup Executive, Chief generation offi cer and Chief Nuclear offi cer
A hallmark of the nuclear industry is working cooperatively to improve performance and safety. In this Q&A, Dhiaa Jamil provides the company’s perspective on the implications of the nuclear crisis in Japan.
customers’ need for clean, affordable and reliable electricity.
Increasing hydroelectric CapacityWe continue to enjoy the environ-
mental and peaking-power benefi ts of our company’s oldest generation type — renewable hydroelectric power.
It’s premature to draw conclusions about the impact of the Japanese nuclear crisis on the u .S . The events in Japan will be thoroughly
analyzed in the coming months. the nuclear industry regularly studies and learns from shared operating experience . We will incorporate lessons learned from this event into the operation of our existing plants, as well as future plants, and continue to do whatever is necessary to ensure
nuclear energy has been and will continue to play a key role in meeting America’s energy needs. Duke energy is continuing

DEI Brazil is building two small hydro-electric plants (16 MW each), expected to be complete in the 2011-2012 time frame. The Retiro and Palmeiras plants are located on the Mirim Sapucal river in Sao Paulo State.
Read about Duke Energy’s use of renewable energy in the Innovative Products and Services section of this report.
aLGaE CaRBoN CapTuRE TESTING ShoWS pRomISE
Partnering on research and development is one way to accelerate the development of cleaner and more affordable energy technologies.
In 2010, Duke Energy and ENN Group, one of our Chinese partners, conducted a joint study to test the ability of various strains of algae to remove carbon dioxide (CO2) from coal-fi red power plant emissions. This was the fi rst study to use CO2 from power-plant fl ue gas instead of pure CO2.
Using a mobile algae unit that was designed and built by ENN Group, we set up a test site at Duke Energy’s East Bend Station in Kentucky to conduct the three-month study. Since algae, like all plants, use CO2 in photosynthesis, carbon emissions can serve as feedstock for the plant’s growth. Workers piped in controlled amounts of fl ue gas from the plant stack emissions directly into a series of large test tubes containing different algae strains and various sources of station water. The next phase of testing will study the potential use of the algae in products such as animal feed and fertilizer.
The team of scientists found that several strains of algae grew just as well using fl ue gas instead of pure CO2, an important indicator that these strains could be a good fi t for potential CO2 mitigation. Further research will help determine if algae can become a low-cost solution to absorb a portion of fl ue gas CO2. To that end, we have submitted a large-scale demonstration project for funding by the U.S.-China Energy Research Center.
This joint study is one of several carbon-capture technologies Duke Energy
is pursuing in our efforts to reduce carbon emissions.
WaTER: a LImITED RESouRCE
Water is a critical resource to Duke Energy and the communities we serve. Rivers and reservoirs serve as the backbone of our generation fl eet by providing hydro-power and cooling water for our nuclear and fossil plants. At the same time, these water resources also support public water systems, industries, wildlife and recreation.
In 2010, demand for water continued to rise, and drought conditions returned to portions of Duke Energy’s service territory. With limited opportunities to develop additional reservoirs, Duke Energy continues to work with government, community and private-sector partners to effectively manage water resources in the following three areas:
managing Water Supplies ■ In early 2010, the Catawba-
Wateree Water Management Group (CW-WMG) won a matching research grant from the Water Research Foundation to explore ways to enhance water resources in the basin. The Foundation convened a panel of world-renowned experts to study the safe yield of the Catawba-Wateree River Basin and how it compares to similar basins around the world. Further study will take place in 2011. The CW-WMG is a nonprofi t corpo-ration composed of Duke Energy Carolinas and 18 public water system
owners in the Catawba-Wateree River Basin.
■ The Keowee-Toxaway Hydroelectric Relicensing Project got under way in 2010, using a stakeholder-driven process similar to what was used for the Catawba-Wateree Hydroelectric Project relicensing effort. Duke Energy has updated a U.S. Army Corps of Engineers reservoir opera-tions model and conducted a water supply assessment in the Upper Savannah Basin as part of preliminary relicensing work.
■ The South Carolina Surface Water Withdrawal Permitting bill was passed into law in 2010. This new legislation requires most surface water intake owners to obtain a permit from the state environmental agency before withdrawing water — helping ensure appropriate allocation of future water use. Duke Energy provided valuable leadership during the stakeholder negotiation process associated with this legislation.
managing Water Demand■ In 2007, the Supreme Court agreed
to hear a case fi led by South Carolina against North Carolina for equitable sharing of water resources in the Catawba River. The court allowed Duke Energy to participate as an intervenor in the case. In 2010, the case was settled by the parties and dismissed by the Supreme Court. The Comprehensive Relicensing Agreement
Duke Energy’s Jocassee Hydroelectric Station, a pumped-storage facility in upstate South Carolina
Recreational use is just one reason to protect our valuable water resources .
Icon denotes additional content online at sustainabilityreport .duke-energy .com
27

(CRA) for Duke Energy’s Catawba-Wateree Hydroelectric Project was used as the basis for the settlement. The CRA, which was signed by 70 stakeholders in 2006 after three years of negotiation, includes procedures for conserving water during droughts and studying future water demands. This settlement has been called a model for how states should work together to preserve shared natural resources.
■ The Catawba-Wateree WMG commissioned a survey of demand-management best practices across the U.S. Survey results have been used to identify measures that will be implemented by public water systems in the basin.
■ Duke Energy and the Catawba-Wateree WMG are jointly funding a three-year study by N.C. State University to assess “smart” irrigation technologies that could help lakeside residents better manage their lawn watering systems. Year three of this effort is getting under way in 2011.
managing Drought■ The Catawba-Wateree Low Infl ow
Protocol (LIP), established during Duke Energy’s efforts to relicense its Catawba-Wateree Project, helps the company and other major water users in the basin conserve water supplies during droughts. This protocol is being implemented on a voluntary basis until the Federal Energy Regulatory Commission issues a new license. It is also being evaluated for potential improvements, based on lessons learned during the record-breaking drought in 2007-2008. In 2010, Stage 1 of the LIP was implemented as drought conditions returned to the basin. This stage recommends voluntary conservation by water users across the basin.
■ Work continues on the installation of a network of gauges in the Catawba-Wateree Basin to better understand how groundwater affects surface water availability during droughts. The project is scheduled for comple-tion in 2012.
SIGNIfICaNT poWER SaVINGS aT DaTa CENTERS
Due to their rapid growth and considerable energy consumption, data centers have an increasingly large carbon footprint.
In November 2010, Duke Energy and the Electric Power Research Institute (EPRI) released preliminary results of a pilot project showing that data centers operating on direct current (DC), rather than alternating current (AC), can cut their power usage by 10 to 20 percent. And, those fi gures could double when the added energy savings due to lower cooling requirements are taken into account.
Most large data centers run on AC power — creating ineffi ciencies as power is repeatedly converted back and forth from AC to DC. Those conversions also generate heat — resulting in increased air conditioning costs in order to maintain the servers and other equipment.
Working with EPRI, we converted part of a Duke Energy data center in North
Carolina to operate only on DC power. The servers and storage banks operated normally with approximately 15 percent less power.
Because DC equipment can be retrofi tted for use with existing equipment, DC power is not limited to new or large enterprise operations. That’s good news for the more than 2.5 million smaller data centers across the United States looking for inexpensive ways to cut costs. Based on federal projections, EPRI says that reducing those data centers’ energy consumption could save up to 25 billion kilowatt-hours of energy annually.
The use of DC power is just one approach Duke Energy is exploring to reduce data center energy use and costs. Other key strategies include HVAC air optimization, data center consolida-tion, server virtualization and replacing older equipment with more effi cient computer hardware.
We are fi nding ways to make our customers’ and our own data centers more energy effi cient.
Web eXCLusive Content
■ Greening Our Vehicle Fleet ■ reducing landfi ll Waste ■ Moving to a Culture of Less Printing ■ restoring Forests in Brazil ■ Climate Change Adaptation research
Gaining Ground ■ Duke Energy Gives Endangered
Mammals a Platform for Survival ■ Preserving Argentina’s Paleontological
Heritage ■ Environmental Leadership Recognition
Algae Carbon Capture Testing
VIDEO
DukE ENERGy CoRpoRaTIoN 2010 | 2011 sustainability report
28

2010 eLeCtriCity generated (Net MegAWAtt-Hours) 1
United States Latin America Total
MWh (thousands) Percent
MWh (thousands) Percent
MWh (thousands) Percent
Coal 93,192 62 .7% 0 0% 93,192 55 .8%
Natural Gas/Oil 8,157 5 .5% 3,166 17 .3% 11,323 6 .8%
Total Fossil 101,349 68 .2% 3,166 17 .3% 104,515 62 .6%
Nuclear 43,443 29 .2% 0 0% 43,443 26 .0%
Conventional Hydro 2,239 1 .5% 15,178 82 .7% 17,417 10 .4%
Wind 2,281 1 .5% 0 0% 2,281 1 .4%
Solar 17 <1% 0 0% 17 <1%
Total Carbon-Free 47,982 32 .3% 15,178 82 .7% 63,159 37 .8%
Pumped-Storage Hydro 2 (689) -0 .5% 0 0% (689) -0 .4%
Total 148,642 100 .0% 18,344 100 .0% 166,985 100 .0%
1 All data based on Duke energy’s ownership share of generating assets. totals may not add up exactly due to rounding. 2 Pumped-storage hydro helps meet peak demands and, like other storage technologies, consumes more energy than it produces .
2010 generation CapaCity (MegAWAtts) 1
United States Latin America Total
MW Percent MW Percent MW Percent
Coal 16,925 47 .4% 0 0 .0% 16,925 42 .4%
Natural Gas/Oil 9,395 26 .3% 1,294 30 .8% 10,689 26 .8%
Total Fossil 26,320 73 .7% 1,294 30 .8% 27,614 69 .2%
Nuclear 5,173 14 .5% 0 0 .0% 5,173 13 .0%
Conventional Hydro 1,111 3 .1% 2,909 69 .2% 4,020 10 .1%
Solar 24 0 .1% 0 0 .0% 24 < 0 .1%
Wind 986 2 .8% 0 0 .0% 986 2 .5%
Total Carbon-Free 7,294 20 .4% 2,909 69 .2% 10,203 25 .6%
Pumped-Storage Hydro 2 2,090 5 .9% 0 0 .0% 2,090 5 .2%
Total 35,704 100 .0% 4,203 100 .0% 39,907 100 .0%
1 All data based on Duke energy’s ownership share of generating assets. totals may not add up exactly due to rounding. 2 Pumped-storage hydro helps meet peak demands and, like other storage technologies, consumes more energy than it produces .
FUELS CONSUmEd FOR U.S. ELECTRiC GENERATiON 3
2006 2007 2008 2009 2010
Coal (million tons) 46 .5 46 .8 45 .0 36 .1 39.6
Oil (million gallons) — 23 .0 22 .2 18 .3 18.0
Natural Gas (million decatherms) — 33 .7 26 .8 50 .7 64.6
3 All data based on Duke energy’s ownership share of generating assets.
Water WithdraWn and Consumed (BillioN gAlloNs)
2008 4 2009 5 2010
Withdrawn 4,000 3,800 3,900
Consumed 60 74 88
4 Excludes Duke Energy International and Duke Energy Generation Services .5 Excludes Duke Energy Generation Services .
ENVIRoNmENTaL pERfoRmaNCE mETRICS
2010 Electricity Generated*
55 .8% Coal 26 .0% nuclear
10 .4% Conventional Hydro
6 .8% natural Gas/Oil1 .4% Wind/Solar
* Pumped-storage hydro, which totaled (0 .4%), consumes more energy than it produces .
In 2010, as in 2009, almost 40 percent of the electricity we generated was from carbon-free sources, including nuclear, hydro, solar and wind .
2010 Generation Capacity*
42 .4% Coal 26 .8% natural Gas/Oil
13 .0% nuclear 10 .1% Conventional
Hydro 2 .5% Wind/Solar
* Pumped-storage hydro, which totaled 5 .2%, consumes more energy than it produces .
Our diverse generation portfolio reduces commodity price volatility and helps us meet our customers’ electricity needs in a sustainable way .
fuels Consumed for u.S. Electric GenerationFuels consumed increased in 2010 over 2009, due to the need for increased coal and natural gas generation to meet higher demand for electricity .
Water Withdrawn and ConsumedWater withdrawn is the total volume removed from a water source, such as a lake or a river . Due to once-through cooling systems on many of our coal-fired and nuclear plants, a large portion of this water is returned to the source and available to be used again . Water consumed is the amount of water removed for use and not returned to the source .
Icon denotes additional content online at sustainabilityreport .duke-energy .com
29

Emissions from GenerationEmission levels depend on many factors, including generation diversity and efficiency, demand for electricity, weather, fuel availability and prices, and emission controls deployed . Carbon dioxide (CO2) and nitrogen oxides (nOx) emissions increased in 2010 over 2009 due to increased coal and natural gas generation, which resulted from increased demand for electricity . Sulfur dioxide (SO2) emissions decreased due to the addition of flue gas desulfurization (FgD) scrubbers. We have invested approximately $5 billion over the past decade to significantly reduce so2 and Nox emissions from our coal fleet. As a result, we have reduced SO2 emissions by 73 percent and Nox by 52 percent over the past five years. our CO2 emissions have decreased 5 percent over that same period, largely due to decreased demand for electricity. our modernization strategy will help us further reduce emissions . In addition, new nuclear, if built, along with new wind and solar, will help us deliver increasingly clean energy .
u.S. Toxic Release Inventory (TRI)Duke Energy’s TRI-reported releases for 2009 were down 31 percent from 2008 . (2010 data will not be available until July 2011 .) This reduction was due to reduced 2009 generation (and fuel consumption) and installation of air pollution control devices at several plants, including new FGD scrubbers . TRI-reported releases of metal compounds also decreased from 2008 . From 2005 to 2009, TRI-reported releases decreased by over 60 percent .
u.S. on-Road and off-Road Vehicle fleet Emissions and fuel ConsumedWe have a goal to reduce nitrogen oxides, volatile organic compounds, particulate matter and carbon monoxide emissions from our on-road and off-road vehicle fleet by 35 percent by 2012 compared to 2006 . From 2006 to 2010, emissions have been reduced by approximately 24 percent, and we are on track to meet this goal .
emissions from generation
2006 2007 2008 2009 2010
Carbon dioxide (CO2) Emissions (thousand tons) 6
U.S. 102,300 108,500 105,000 90,800 97,600 Latin America 3,000 3,100 2,700 2, 900 2,300
Total 105,300 111,600 107,700 93,700 99,900
Total CO2 Emissions intensity (tons per net MWh) 0 .63 0 .66 0 .66 0 .59 0.60
U.S. Sulfur dioxide (SO2) Emissions (tons) 7 817,700 682,300 427,700 239,800 221,200
U.S. SO2 Emissions intensity (pounds per net MWh) 11 .0 8 .9 5 .8 3 .4 3.0
U.S. Nitrogen Oxides (NOx) Emissions (tons) 7 149,200 130,500 122,700 64,800 71,800
U.S. NOx Emissions intensity (pounds per net MWh) 2 .0 1 .7 1 .7 0 .9 1.0
6 CO2 reported from u .S . electric generation and Duke Energy International operations, and based on ownership share of generating assets .7 SO2 and nOx reported from u .S . electric generation based on ownership share of generating assets .
U.S. SULFUR diOxidE ANd NiTROGEN OxidES EmiSSiONS (tHousAND toNs) 8
u .S . Sulfur Dioxide Emissions u .S . nitrogen Oxides Emissions
900
750
600
450
300
150
0 2006 2007 2008 2009 2010
8 SO2 and nOx reported from u .S . electric generation based on ownership share of generating assets .
U.S. TOxiC RELEASE iNvENTORy — TRi (tHousAND PouNDs) 9
2005 2006 2007 2008 2009
Releases to Air 80,173 75,752 59,584 39,382 24,318
Releases to Water 248 195 224 234 211
Releases to Land 15,234 14,224 15,593 13,895 11,753
Off-Site Transfers 77 64 92 118 509
Total 95,732 90,235 75,492 53,630 36,790
9 Data pertain to facilities Duke Energy owns or operates and where Duke Energy is the responsible reporting party . Totals may not add up exactly due to rounding .
U.S. ON-ROAd ANd OFF-ROAd vEHiCLE FLEET EmiSSiONS ANd FUEL CONSUmEd 10
2006 (Baseline) 2007 2008 2009 2010
Number of vehicles 5,396 5,426 5,460 5,647 5,637
Fuel Consumed (thousand gallons) 7,800 7,887 7,569 7,294 7,118
Nitrogen Oxides (tons) 486 497 449 467 414
volatile Organic Compounds (tons) 73 66 59 56 47
Particulate matter (tons) 24 26 24 27 25
Carbon monoxide (tons) 718 629 649 544 497
Total Emissions (tons) 1,301 1,218 1,181 1,094 984
10 this table represents just over 90 percent of our vehicle fleet. operation and fuel consumption are estimated where individual mileage, engine hours or fuel measurements are not available . These estimates are used for emissions calculations where necessary .
DukE ENERGy CoRpoRaTIoN 2010 | 2011 sustainability report
30

ACCELERATEd mAiN REPLACEmENT PROGRAm (AmRP)
2007 2008 2009 2010 Goal
Reduction in Leaks Repaired (Since 2007 ) Baseline year 6% 29% 11 14% 20% by 2012
11 This differs from what was reported last year due to better available information .
Waste
2006 2007 2008 2009 2010
U.S. Solid Waste 12 Total Generated (tons) Percent Recycled
— —
— —
40,162
52%
39,651
55%
38,651
63%
Hazardous Waste Generated (tons) 13 — — — 438 125
Low-level Radioactive Waste (Class B and C) Generated (cubic feet)
1,464 1,420 1,303 739 658 (58% less
than baseline)
12 All data exclude Duke energy generation services, Duke energy international and large, one-time projects. Weights are estimated based on volumes where necessary . Data not available for 2006-2007 .
13 Companywide data not available for 2006-2008 .
U.S. ELECTRiCiTy CONSUmEd
2005-2007 Average (Baseline)
2006-2008 Average
2007-2009 Average
2008-2010 Average
Electricity Consumption: 13 of Our Largest Commercial Buildings (megawatt-hours)
64,836 62,607 60,486 58,783 (9% less than
baseline)
reportabLe oiL spiLLs 14
2006 2007 2008 2009 2010
Spills 75 79 66 92 56
Gallons 3,300 28,900 6,600 4,700 7,400
14 Data for 2006-2008 includes u .S . spills only . Duke Energy International spill data are included for later years .
environmentaL reguLatory Citations 15
2006 2007 2008 2009 2010
Citations 12 12 16 20 16 19
Fines/Penalties (dollars) $8,850 $29,265,500 16 $141,657 $2,805,525 16 $15,982
15 includes international and u.s. federal, state and local citations and fines/penalties.16 these historical values differ from what was reported last year and reflect judicial actions and corrections that were made after the report
was published .
accelerated main Replacement program (amRp)in 2000, the AMrP was launched on Duke energy’s natural gas distribution system in ohio and Kentucky to reduce leaks and improve safety, performance and reliability . The program accelerates replacement of approximately 1,400 miles of cast iron and bare steel pipe, some in service since 1873. the AMrP is complete in Kentucky, and more than 70 percent complete in Ohio . We are on track to meet our target of reducing repaired leaks by 20 percent by 2012 compared to 2007 . Reducing leaks decreases the release of natural gas, which is mostly methane, a greenhouse gas approximately 20 times more potent than CO2 .
WasteWe have a goal to increase the percentage of u .S .solid waste that is recycled from 52 percent in 2008 to 62 percent by 2012 . Our nuclear plants also have a goal to reduce by 25 percent the amount of low-level radioactive waste (Class B and C) they generate by 2012, compared to the 2002 through 2006 average of 1,552 cubic feet . To date, we are exceeding both of these goals .
u.S. Electricity ConsumedWe have a goal to reduce electricity consump-tion at 13 of our largest commercial buildings by 10 percent by 2012, compared to the 2005 through 2007 average . We are on track to meet this goal .
Reportable oil SpillsOil spills include releases of lubricating oil from generating stations, leaks from transformers or damage caused by third parties (typically due to auto accidents) .
Environmental Regulatory CitationsNo fines were associated with 14 of the 19 citations in 2010 . In addition, $2,800 of the total 2010 fines/penalties resulted from resolution of citations received prior to 2010 . The 2007 total fines/penalties figure includes proposed fines of approximately us$29 million assessed by the Brazil state environmental Agency of Parana (iAP), and approximately us$270,000 by the Brazilian institute of Environment and Renewable natural Resources
(iBAMA) for alleged violations related to reforesta-tion . These amounts are higher than what was reported in 2009. one 2007 iAP fine was increased in 2011, resulting in the total iAP fines increasing to uS$29 million . We are contesting these violations . in addition, 2009 total citations and fines/penalties have increased due to the addition of two interna-tional citations totaling $16,235 in fines.
Icon denotes additional content online at sustainabilityreport .duke-energy .com
31
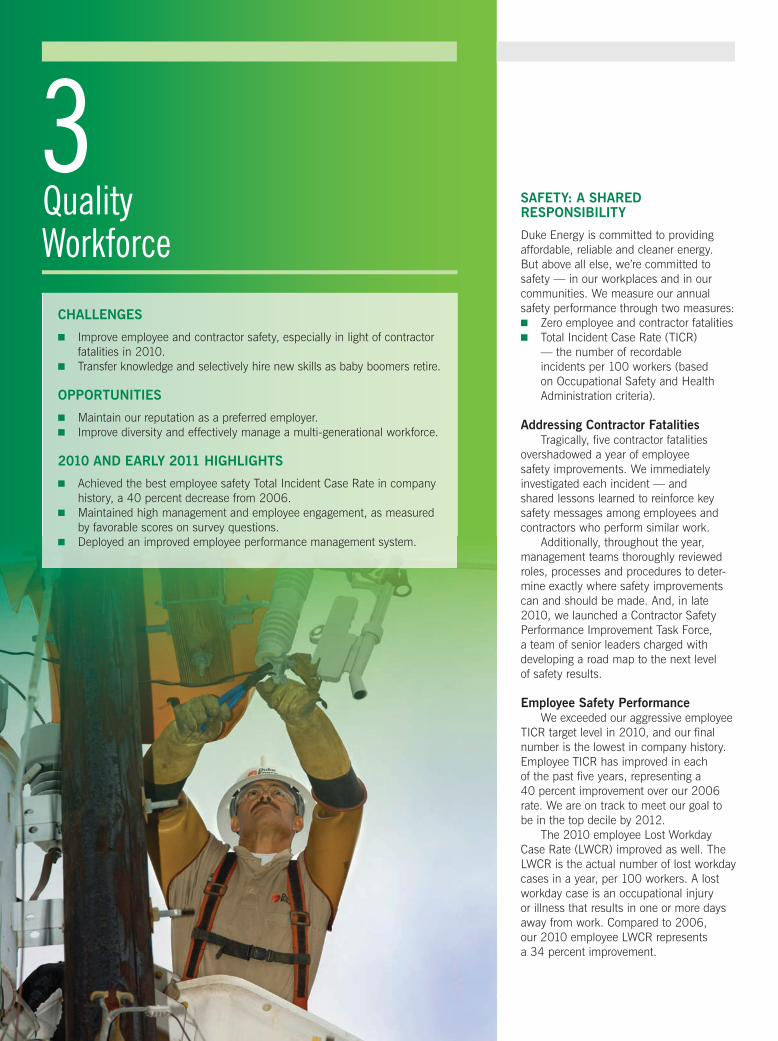
SafETy: a ShaRED RESpoNSIBILITy
Duke Energy is committed to providing affordable, reliable and cleaner energy. But above all else, we’re committed to safety — in our workplaces and in our communities. We measure our annual safety performance through two measures:
■ Zero employee and contractor fatalities ■ Total Incident Case Rate (TICR)
— the number of recordable incidents per 100 workers (based on Occupational Safety and Health Administration criteria).
addressing Contractor fatalitiesTragically, fi ve contractor fatalities
overshadowed a year of employee safety improvements. We immediately investigated each incident — and shared lessons learned to reinforce key safety messages among employees and contractors who perform similar work.
Additionally, throughout the year, management teams thoroughly reviewed roles, processes and procedures to deter-mine exactly where safety improvements can and should be made. And, in late 2010, we launched a Contractor Safety Performance Improvement Task Force, a team of senior leaders charged with developing a road map to the next level of safety results.
Employee Safety performanceWe exceeded our aggressive employee
TICR target level in 2010, and our fi nal number is the lowest in company history. Employee TICR has improved in each of the past fi ve years, representing a 40 percent improvement over our 2006 rate. We are on track to meet our goal to be in the top decile by 2012.
The 2010 employee Lost Workday Case Rate (LWCR) improved as well. The LWCR is the actual number of lost workday cases in a year, per 100 workers. A lost workday case is an occupational injury or illness that results in one or more days away from work. Compared to 2006, our 2010 employee LWCR represents a 34 percent improvement.
ChaLLENGES
■ Improve employee and contractor safety, especially in light of contractor fatalities in 2010.
■ Transfer knowledge and selectively hire new skills as baby boomers retire.
oppoRTuNITIES
■ Maintain our reputation as a preferred employer. ■ Improve diversity and effectively manage a multi-generational workforce.
2010 aND EaRLy 2011 hIGhLIGhTS
■ Achieved the best employee safety Total Incident Case Rate in company history, a 40 percent decrease from 2006.
■ Maintained high management and employee engagement, as measured by favorable scores on survey questions.
■ Deployed an improved employee performance management system.
3Quality Workforce
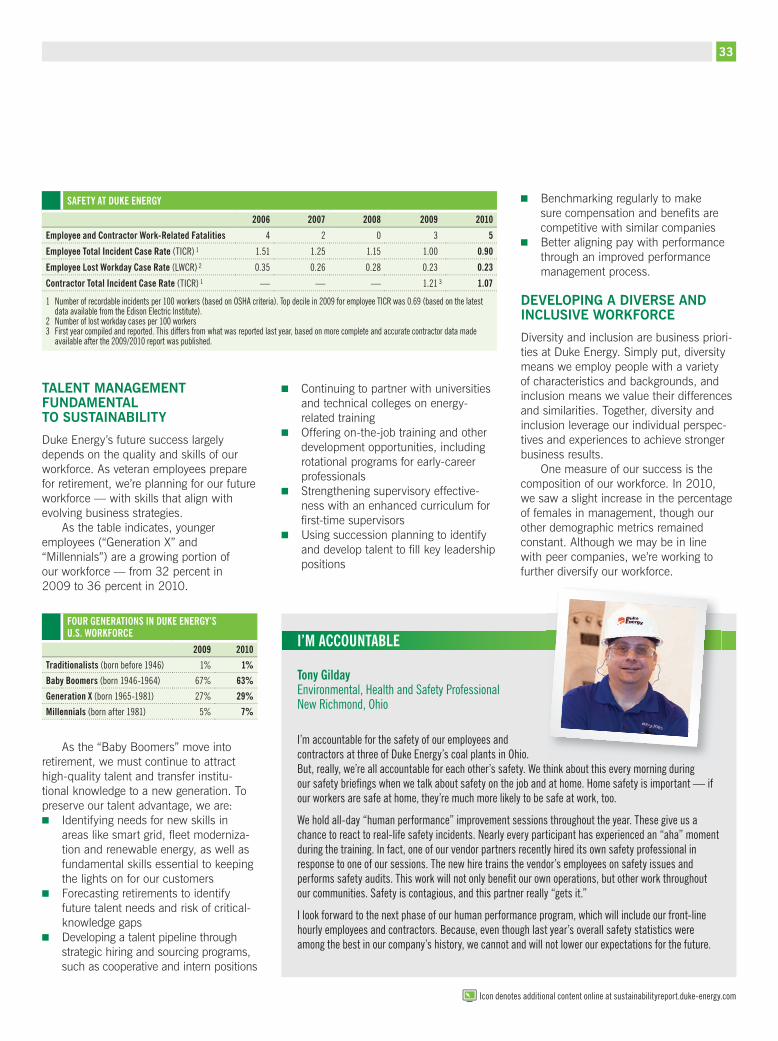
TaLENT maNaGEmENT fuNDamENTaL To SuSTaINaBILITy
Duke Energy’s future success largely depends on the quality and skills of our workforce. As veteran employees prepare for retirement, we’re planning for our future workforce — with skills that align with evolving business strategies.
As the table indicates, younger employees (“Generation X” and “Millennials”) are a growing portion of our workforce — from 32 percent in 2009 to 36 percent in 2010.
four generations in duKe energy’s U.S. WORKFORCE
2009 2010
Traditionalists (born before 1946) 1% 1%
Baby Boomers (born 1946-1964) 67% 63%
Generation x (born 1965-1981) 27% 29%
millennials (born after 1981) 5% 7%
As the “Baby Boomers” move into retirement, we must continue to attract high-quality talent and transfer institu-tional knowledge to a new generation. To preserve our talent advantage, we are:
■ Identifying needs for new skills in areas like smart grid, fl eet moderniza-tion and renewable energy, as well as fundamental skills essential to keeping the lights on for our customers
■ Forecasting retirements to identify future talent needs and risk of critical-knowledge gaps
■ Developing a talent pipeline through strategic hiring and sourcing programs, such as cooperative and intern positions
■ Continuing to partner with universities and technical colleges on energy-related training
■ Offering on-the-job training and other development opportunities, including rotational programs for early-career professionals
■ Strengthening supervisory effective-ness with an enhanced curriculum for fi rst-time supervisors
■ Using succession planning to identify and develop talent to fi ll key leadership positions
■ Benchmarking regularly to make sure compensation and benefi ts are competitive with similar companies
■ Better aligning pay with performance through an improved performance management process.
DEVELopING a DIVERSE aND INCLuSIVE WoRkfoRCE
Diversity and inclusion are business priori-ties at Duke Energy. Simply put, diversity means we employ people with a variety of characteristics and backgrounds, and inclusion means we value their differences and similarities. Together, diversity and inclusion leverage our individual perspec-tives and experiences to achieve stronger business results.
One measure of our success is the composition of our workforce. In 2010, we saw a slight increase in the percentage of females in management, though our other demographic metrics remained constant. Although we may be in line with peer companies, we’re working to further diversify our workforce.
safety at duKe energy
2006 2007 2008 2009 2010
Employee and Contractor Work-Related Fatalities 4 2 0 3 5
Employee Total incident Case Rate (TICR) 1 1 .51 1 .25 1 .15 1 .00 0.90
Employee Lost Workday Case Rate (LWCR) 2 0 .35 0 .26 0 .28 0 .23 0.23
Contractor Total incident Case Rate (TICR) 1 — — — 1 .21 3 1.07
1 Number of recordable incidents per 100 workers (based on osHA criteria). top decile in 2009 for employee tiCr was 0.69 (based on the latest data available from the Edison Electric Institute) .
2 number of lost workday cases per 100 workers3 First year compiled and reported . This differs from what was reported last year, based on more complete and accurate contractor data made
available after the 2009/2010 report was published .
Tony Gilday Environmental, Health and Safety Professional new Richmond, Ohio
I’m accountable for the safety of our employees and contractors at three of Duke Energy’s coal plants in Ohio . But, really, we’re all accountable for each other’s safety . We think about this every morning during our safety briefi ngs when we talk about safety on the job and at home. Home safety is important — if our workers are safe at home, they’re much more likely to be safe at work, too .
We hold all-day “human performance” improvement sessions throughout the year . These give us a chance to react to real-life safety incidents . nearly every participant has experienced an “aha” moment during the training . In fact, one of our vendor partners recently hired its own safety professional in response to one of our sessions . The new hire trains the vendor’s employees on safety issues and performs safety audits. this work will not only benefi t our own operations, but other work throughout our communities . Safety is contagious, and this partner really “gets it .”
I look forward to the next phase of our human performance program, which will include our front-line hourly employees and contractors . Because, even though last year’s overall safety statistics were among the best in our company’s history, we cannot and will not lower our expectations for the future .
i’m aCCountabLe
Icon denotes additional content online at sustainabilityreport .duke-energy .com
33

WorKforCe statistiCs
1/31/07 1 12/31/07 12/31/08 12/31/09 12/31/10
Full- and Part-Time Employees 18,053 18,117 18,548 18,683 18,439 united States 17,100 17,045 17,429 17,581 17,293 International 953 1,072 1,119 1,102 1,146
Collective Bargaining Unit/Union members as Percent of Workforce u .S . (members of a collective bargaining unit) 27 .1% 25 .5% 25 .2% 24 .7% 24.6% International (dues-paying members of a union) 35 .3% 30 .2% 27 .4% 26 .2% 25.4%
1 After spectra energy spinoff
U.S. WORKFORCE dEmOGRAPHiCS 2
1/31/07 3 12/31/07 12/31/08 12/31/09 12/31/10
Ethnic diversity as Percent of Workforce White 86 .6% 86 .6% 86 .7% 86 .9% 86.4% Black/African American 11 .2% 11 .3% 11 .2% 11 .0% 11.2% Hispanic/Latino 0 .9% 0 .9% 0 .9% 0 .9% 1.1% Asian 0 .9% 0 .8% 0 .8% 0 .9% 1.0% American indian/Alaska Nation 0 .3% 0 .3% 0 .3% 0 .3% 0.3% Native Hawaiian/other Pacifi c islander (new category for 2010 reporting)
— — — — 0.0%
Not specifi ed 0 .1% 0 .2% 0 .1% 0 .0% 0.0%
Females/minorities as Percent of Workforce/management Females as percent of workforce 22 .6% 22 .6% 22 .6% 22 .6% 22.9% Females as percent of management 17 .6% 17 .2% 15 .5% 16 .3% 17.2% Minorities as percent of workforce 13 .3% 13 .3% 13 .3% 13 .1% 13.6% Minorities as percent of management 7 .8% 8 .0% 7 .9% 7 .6% 7.6%
2 Ethnic diversity and gender data are not captured for Duke Energy International employees .3 After spectra energy spinoff
U.S. EmPLOyEE TURNOvER SUmmARy
2007 2008 2009 2010
reason Severance package volunteers 405 210 14 686 Resignations 244 304 238 284 Retirements 218 190 205 197 employees who were notifi ed they did not have a position in the company and elected to leave with a severance package 4 114 18 12 27
Dismissals 46 96 127 144
Total Turnover 1,027 818 596 1,338
Total U.S. Employees 17,045 17,429 17,581 17,293
Turnover as a Percent of Workforce 6 .0% 4 .7% 3 .4% 7.7%
Percentage of Employees Eligible to Retire in 5 years 5 — — 50 .9% 50.9%
Percentage of Employees Eligible to Retire in 10 years 5 — — 67 .9% 66.7%
4 Employees whose jobs were affected by restructuring were offered an option to transfer into a “transition pool” for a six-month period, during which they could look for other employment opportunities within Duke Energy .
5 eligible to retire is defi ned as 55 years of age or older, with at least 5 years of service.
WoRkfoRCE pERfoRmaNCE mETRICS
In our CommunitiesDuke Energy supports educational
programs for women and minorities throughout the U.S. We fund scholarships, student groups and educational-advance-ment programs. We also sponsor job fairs and other programs for student and professional organizations that support the development of minorities and women.
Diversity Steering TeamsDuke Energy’s Diversity Steering
Teams work to improve employee engage-ment and build an inclusive culture. Through dialogue, training and local projects, these teams foster an under-standing of differences and similarities among employees in the departments they represent.
Employee Resource GroupsEmployee Resource Groups (ERGs)
are networks of employees with common interests or experiences. Open to all employees, ERGs aim to support business needs, align with company goals and strat-egies, promote understanding and provide a stronger sense of community. Employees organize and manage the groups, which provide educational, networking and
Duke energy employees in Plainfi eld, ind.
DukE ENERGy CoRpoRaTIoN 2010 | 2011 sustainability report
34

mentoring opportunities, as well as seminars and conferences, for members.
Our ERGs include:■ African-American Network■ Business Women’s Network■ Latinos United Cultivating Energy
and Service■ Leadership Development Network.
Duke Energy also sponsors employee chapters of Women in Nuclear, Young Generation in Nuclear, Toastmasters and American Association of Blacks in Energy.
‘Best of the Best’ CompanyIn 2010, Duke Energy was named
a “Best of the Best” company by three employment magazines: Black Equal Opportunity Employment Journal, Professional Woman’s Magazine and Hispanic Network Magazine. The publica-tions included Duke Energy in their listings of top energy, oil and utility companies.
What is the Workplace of the Future concept? The goal of the Workplace of the Future is to foster a highly creative and productive workforce
through open and transformative work environments, complete with energy effi cient designs and the latest technologies . The program complements other better-known initiatives — like the u .S . Green Building Council’s leeD program — by combining energy effi ciency and the use of sustainable materials with forward-thinking designs for workspaces and furnishings .
Why is duke Energy creating the Workplace of the Future? Fresh and energetic environments are vital to our company’s success as we work to attract and
retain top talent in today’s challenging and highly competitive marketplace . The move to our new corporate headquarters — the Duke energy Center, which was awarded platinum-level leeD certifi cation — gave us the perfect opportunity to develop a creative work environment that can be replicated throughout our system, cost-effectively and sustainably . We feel our progressive workplace concepts will help drive innovation, collaboration and creativity throughout our company .
How were sustainable design principles incorporated into the duke Energy Center? Key workplace design features include more natural light, ergonomic design, a balance of
collaborative and individual space, energy effi cient water usage, furniture made from recyclable and reusable materials, informal areas for socializing and new technologies.
the Workplace of the Future concept allows for fl exibility, too. We developed multiple work “styles” within a common footprint, so that each workspace can be customized as locations and work habits change. the customization is also highly cost-effective and signifi cantly reduces new waste streams.
How have employees reacted?The employee response is overwhelmingly positive . They appreciate the open, community environment, while still having access to private workspaces . In the coming months, we will
solicit detailed employee feedback, which we’ll use as we plan for future projects .
Where are the Workplace of the Future design principles being applied?We initially piloted many of the design concepts in 2009 in the renovated Lafayette Operations Center in Indiana . This past year, we used Workplace of the Future elements while renovating
parts of the historic 4th & Main building in Cincinnati, the regulated-trading fl oor at our former Charlotte headquarters and our governmental Affairs offi ce in indianapolis. We also applied the design features to our new Cherokee Operations Center in Whittier, n .C .
We are developing a formalized design standard that incorporates both Workplace of the Future and LEED design principles for our various facility types and business operations . We are making a long-term commitment to provide highly functional, cost-effective and sustainable facilities that bring out the best in our employees, wherever they work .
a:
a:
a:
a:
a:
i’m aCCountabLe
dennis WoodVice President, Real Estate Services
In this Q&A, Dennis Wood discusses the Workplace of the Future design concept that defi nes our new corporate headquarters, how it reinforces our company’s culture, and how it will change our workspaces in the future.
WoRkfoRCE pERfoRmaNCE mETRICS
governmental Affairs offi ce in indianapolis. We also applied the design features to our new Cherokee Operations
We are developing a formalized design standard that incorporates both Workplace of the Future and LEED design principles for our various facility types and business operations . We are making a long-term commitment to provide highly functional, cost-effective and sustainable facilities that bring out the best in our employees, wherever they work .
Web eXCLusive Content
■ Former HQ earns eNergY stAr® Certifi cation
■ Safety: Seeing is Believing■ The 3 Rs of Working Safely■ Employee Wellness Programs Focus
on Prevention■ Employee Satisfaction Remains High■ Putting Sustainable Thinking to Work■ Duke energy Brazil Honored■ employees recognized with James B.
Duke Awards
What It’s Like to Work as a Line Tech
VIDEO

ChaLLENGES
■ Encourage economic development in the continuing sluggish economy. ■ Help the communities we serve stay competitive with other regions.
oppoRTuNITIES
■ Help attract jobs to our service territories as high unemployment persists. ■ Use our community programs to strengthen the regions we serve.
2010 aND EaRLy 2011 hIGhLIGhTS
■ Provided competitively priced, reliable electricity in each of our fi ve states.
■ Helped attract almost $5.8 billion in capital investments and nearly 14,000 new jobs.
■ Contributed almost $29 million to our communities (includes contribu-tions from The Duke Energy Foundation and the company, along with employee and retiree donations and the value of their volunteer time).
4Strong Communities
2010 ECoNomIC DEVELopmENT GoaLS EXCEEDED
Duke Energy’s business success depends on the strength of the communities we serve. Our work in economic development is focused on attracting investments that expand economies and create jobs in our fi ve-state service area.
We work closely with state and local offi cials to position competitive energy costs as a key differentiator for companies looking to locate or expand operations. We also serve in key leadership positions in local and regional economic develop-ment organizations. This work has become even more important in light of the weak economy and increasing competition among regions to attract business growth.
In 2010, Duke Energy’s economic development efforts helped state, regional and local government offi cials attract almost $5.8 billion in capital investments and nearly 14,000 new jobs, greatly exceeding our goals. (These results refl ect new capital investments and jobs; they do not take into account business closures and job losses due to the economic downturn.)
To read about notable economic development highlights over the past year, see the rest of this article in the Strong Communities section of our online Sustainability Report.
CoNTRIBuTING To ouR CommuNITIES
An important way we strengthen our communities is through our fi nancial support. Charitable giving from The Duke Energy Foundation and the company, along with employee and retiree donations and the value of their volunteer time, totaled almost $29 million in 2010. This is in line with our annual giving in recent years and on par with industry benchmarks.

2010 CharitabLe giving
The Duke Energy Foundation $15 .8 million
Other company cash contributions and in-kind gifts and services
$ 3 .0 million
Cash contributions from employees and retirees
$ 5 .5 million
Value of our employees’ and retirees’ volunteer time
$ 4 .5 million
Total Charitable Giving $28.8 million
Through corporate and regional contributions councils, The Duke Energy Foundation awarded grants based on the needs of the community and in alignment with our areas of focus:
■ Community vitality — 63 percent ($8.7 million)
■ Economic development, including educational initiatives — 28 percent ($3.9 million)
did economic development get any easier in North Carolina during the past year?
I’d say there were many factors that made economic development less challenging this past
year . north Carolina lawmakers and the Department of Commerce were extremely engaged, giving us the right environment and tools to allow economic develop-ment to thrive during the downturn. And it paid off, illustrated by an abundance of economic development announcements that garnered national attention and accolades . However, when you’re the lead dog, the competition is eager to take your place . To stay ahead of the pack, north Carolina must continue to look forward, with a clear focus on its competitive advantages .
What are the keys to success when working with companies looking to site or expand their operations? ultimately, the key to success is our ability to provide affordable, reliable
and clean energy, coupled with superior customer service. As rising energy costs increasingly represent a larger portion of business expenses, the cost of energy has become one of the most important factors in site selection criteria . We proactively identify opportunities for our customers to take control of their energy costs through energy effi ciency programs and services. Additionally, strong collaborations with local chambers of commerce, regional partnerships and other organizations focused on economic development are instrumental in the process .
How is the city of Charlotte, N.C., doing in its quest to become an energy hub? Charlotte has experienced tremendous success as it fulfi lls its
dream and destiny to become “the new energy capital .” According to the Charlotte regional Partnership, 240 energy or energy-
related companies employ nearly 27,000 people in Charlotte and its surrounding counties . Since 2007, Charlotte has created
approximately 5,000 new energy-related jobs . The Queen City has been in the national spotlight for its efforts, and continues
to attract the interest of energy-related companies for possible manufacturing facilities and/or headquarters .
a:
a:
a:
i’m aCCountabLe
Brett CarterPresident, Duke Energy north Carolina
In the following Q&A, Brett Carter discusses the transformative role the energy industry can play in stimulating the economy.
did economic development get any easier in
I’d say there were many factors that made economic development less challenging this past
year . north Carolina lawmakers and the Department of Commerce were extremely engaged, giving us the right environment and tools to allow economic develop-ment to thrive during the downturn. And it paid
and other organizations focused on economic development are instrumental in the process .
How is the city of Charlotte, N.C., doing in its quest to become an energy hub?
Charlotte has experienced tremendous success as it fulfi lls its dream and destiny to become “the new energy capital .”
According to the Charlotte regional Partnership, 240 energy or energy-related companies employ nearly 27,000 people in Charlotte and
its surrounding counties . Since 2007, Charlotte has created approximately 5,000 new energy-related jobs . The Queen City
has been in the national spotlight for its efforts, and continues to attract the interest of energy-related companies for
possible manufacturing facilities and/or headquarters .
a:
For more Q&As with Brett Carter, please visit the Strong Communities section of our Sustainability Report online.
■ Environment and energy effi ciency — 9 percent ($1.2 million).
Another $2 million was given by The Duke Energy Foundation to fund matching gifts and volunteer grants for employees and retirees in 2010.
In addition to charitable giving of nearly $29 million in 2010, Duke Energy invested almost $4.7 million in our communities to support regulatory agree-ments and other business initiatives.
For instance, Duke Energy Carolinas continued to share its bulk power marketing (BPM) profi ts by providing over $1.7 million toward education and $1.5 million for low-income energy assistance programs. BPM profi ts come from off-system sales of power on the open market.
Low-income energy assistance programs in Indiana (Helping Hand), Kentucky (WinterCare) and Ohio (HeatShare) received $747,000 from Duke Energy and almost $262,000 from employee and customer contributions. Similar programs in the Carolinas — like Share the Warmth, Cooling Assistance and Fan Relief — are funded from a variety of sources, including customer and employee contributions (which totaled nearly $592,000 in 2010).
As part of the Catawba-Wateree Comprehensive Relicensing Agreement in the Carolinas, we invested approxi-mately $710,000 to improve water use and management and to enhance aquatic habitat and fi sh populations.
37

EmpLoyEES aND RETIREES makE a DIffERENCE
Volunteerism is a tradition at Duke Energy and one that our employees and retirees embrace. To support their efforts, Duke Energy created Volunteers In Action, an online database where employees can submit, search and sign up for volunteer opportunities across our service territories.
We also provide fi nancial support for our employees’ volunteer efforts — including grants for “sweat equity” projects completed by employees, and board leadership grants for employees and retirees who serve on the boards of direc-tors of qualifying organizations. In 2010, we estimate that approximately 5,100 volunteers spent 215,000 hours partici-pating in 600 projects in more than 160 U.S. communities.
At the heart of Volunteers In Action is the annual Global Service Event (GSE), a companywide grassroots campaign to make a concerted impact on the commu-nities we serve. Employees and retirees identify needs in the community, organize projects, recruit volunteers and provide project leadership.
During the 2010 GSE event, we estimate that approximately 3,000 Duke Energy employees, retirees and their family members and friends participated in almost 350 community projects between May and June. Their efforts assisted more than 260 charitable organizations.
pRomoTING SuSTaINaBLE ENERGy IN ThE DEVELopING WoRLD
Duke Energy is a member of e8 , a worldwide organization of electric utilities founded in 1992 to promote sustain-able energy development in the world’s emerging nations.
The 10 members of e8 are among the largest electricity companies in the world, representing Brazil, Canada, France, Germany, Italy, Japan, Russia and the U.S.
The e8 companies develop projects that bring clean energy to some of the 2 billion people around the world who — in 2011 — still have no access to electricity.
The member companies also develop training programs to ensure that clean energy projects eventually can be turned over to, and managed by, citizens of the targeted regions.
In 2010, Duke Energy assumed leadership of the organization’s graduate scholarship program and invested in two projects: the construction of a combined wind energy and water desalinization facility in Tunisia; and a training program for energy and fi nance ministers in Latin America, focused on improving energy investment opportunities in their countries.
BRINGING SafE ELECTRICITy To RuRaL aREa IN pERu
Duke Energy International invested more than $165,000 in electricity infrastructure to support 120 families in the La Ramada Alta community near the company’s Carhauquero hydroelectric power plant in Peru.
What little energy the community had been receiving was through illegal connections that posed serious safety risks. This project benefi ts the community by providing safe and reliable electricity, improving the quality of life, and offering programs to promote energy awareness and safety.
JoB TRaINING pRoGRam paSSES $10 mILLIoN maRk
Duke Energy’s grant program to improve job training in the Carolinas reached a key milestone in 2010. The Community and Technical College Grant program has now awarded over $10 million to support more than 50 separate training initiatives at North Carolina’s community colleges.
Created in 2004, the grant program is a way for Duke Energy to share its bulk power marketing profi ts with communities in our North Carolina service area. More than 5,000 workers have received training offered through the Duke Energy-funded programs at 21 community colleges. And more than 900 new jobs have been created as a result of a better trained workforce. In South Carolina, a similar program called AdvanceSChas provided more than $15 million in education grants to high schools and colleges.
Innovative partnerships like this — between education systems, major employers and our company — demon-strate the real and tangible work that is taking place to re-energize economies in the regions we serve.
Web eXCLusive Content
■ strategy to Attract Data Centers Paying off ■ Site Readiness Program Expands to Ohio
and Kentucky ■ Duke Energy among Top 10 utilities for
Economic Development ■ Enabling Communities to Become More
Sustainable ■ Working with Tribal Leaders to Site
Electrical Tie Station
■ Challenging K-12 students to be energy effi cient
■ Can You Meet Tomorrow’s Energy Challenge?
■ Helping Low-income Families Improve Water Quality
■ Duke Energy International Building Homes for Families in need
iPads for Elementary Classrooms
VIDEO
Partnering on a new Data Center
VIDEO
DukE ENERGy CoRpoRaTIoN 2010 | 2011 sustainability report
38

fINaNCIaL pERfoRmaNCE STRoNG IN 2010
Financially, we exceeded our own expecta-tions in 2010. Weather was a major factor, as extreme temperatures in both winter and summer increased demand for energy. But removing weather’s effects, we would still have had a strong year — due to solid operational performance, careful control of costs and the impacts of rate increases.
We posted year-end adjusted diluted earnings per share of $1.43, a 17 percent increase over our 2009 results of $1.22.
Our total shareholder return (TSR) — the change in stock price plus dividends — was 9.5 percent for 2010, once again exceeding our peers as measured by the Philadelphia Utilities Index. TSR for the index of 20 electric utility companies, including Duke Energy, was 5.7 percent in 2010. Duke Energy has seen cumula-tive TSR of 4.7 percent over the past three years, while the utility index TSR has been a negative 15.4 percent. Over fi ve years, our cumulative returns have been 44.2 percent, compared to 20.9 percent for the utility index.
We’re seeing positive signs of slow but steady economic recovery. In our regulated service territories, excluding weather impacts, customer demand grew by nearly 2 percent in 2010 over 2009. This increase was principally driven by a 7 percent increase in sales to our industrial customers.
We held operations and maintenance expenses basically fl at from 2007 through 2009. Increases in 2010 were primarily due to extreme temperatures.
We mitigated the fi nancial impacts of customers switching suppliers in Ohio, where Duke Energy Retail, our competitive retail energy provider, was able to capture some of our lost margins.
For the 84th consecutive year, Duke Energy paid a quarterly cash dividend on our common stock in 2010. We also increased the quarterly dividend by a half-cent per share, and we are committed to continuing to grow the dividend.
We continued our focus on maintaining the strength of the balance sheet. During 2010, we issued $1.4 billion of fi xed-rate
5Governance and Transparency
ChaLLENGES
■ Maintain strong fi nancial performance despite a sluggish economy. ■ Achieve timely and constructive regulatory recovery of our investments. ■ Successfully resolve property tax disputes in Ohio. ■ Rebuild trust with stakeholders in Indiana.
oppoRTuNITIES
■ Maintain strong corporate governance ratings. ■ Attract additional investors who value sustainability.
2010 aND EaRLy 2011 hIGhLIGhTS
■ Continued to aggressively manage operating and maintenance expenses. ■ Increased the quarterly dividend from $0.24 to $0.245 per share in
2010. ■ Outperformed the Philadelphia Utility Index in total shareholder return in
2010 and over the past three and fi ve years.
39

debt at a weighted-average rate of 3.8 percent and an average maturity of approx-imately eight years. Financing during this period of historically low interest rates helps us mitigate customer rate impacts.
INDIaNa hIRING ISSuE
Duke Energy’s reputation was challenged in 2010, after the company hired a regulatory attorney from the Indiana Utility Regulatory Commission (IURC).
When public concerns were raised due to the employee’s recent involvement in regulatory decisions involving Duke Energy, our management took immediate action.
Duke Energy has fully cooperated with the Indiana Inspector General’s investigation and with the IURC’s review of cases over which the attorney had presided. The company also promptly initiated internal and independent investigations of the matter.
After careful consideration, the employee was dismissed from the company, along with Duke Energy’s state president for Indiana. The head of our regulated operations later resigned, when inappropriate emails with state regulators also became public.
The company has changed its hiring practices to avoid similar situations in the future. All job applications now include pre-screening questions about candi-dates’ previous responsibilities that might have involved Duke Energy’s interests. And, before we post a job with regulatory or oversight responsibilities, the hiring manager is consulted to determine the potential for confl icts of interest. If the
potential is high, we apply a greater level of scrutiny throughout the hiring process.
We are working diligently to rebuild trust with stakeholders in Indiana.
SuppLy ChaIN SuSTaINaBILITy
Duke Energy continues to collaborate with suppliers on sustainability, both individu-ally and through the efforts of the Electric Utility Industry Sustainable Supply Chain Alliance , which we helped found in 2008.
In 2010, consistent with Alliance best practices, we strengthened our process for taking environmental performance into account in the awarding of large contracts. Suppliers’ answers to more than 20 questions — about compliance, environmental management systems, greenhouse gas (GHG) emissions, energy, water, waste and other topics — now help inform our buying decisions.
Also in 2010, we completed an inven-tory of energy use throughout our own supply chain operations. This baseline inventory was part of an Alliance initiative to reduce members’ GHG emissions, and to encourage suppliers to do so as well. In aggregate, Alliance members are targeting a 10 percent reduction in the energy use of their supply chain operations by 2015, from a 2008 baseline.
The Alliance is also developing best practices to reduce the environmental impacts of signifi cant categories of products such as poles, transformers, and wire and cable. Duke Energy is already implementing best practices, such as shipping poles directly to job sites
to reduce fuel consumption and emissions. We also buy a signifi cant portion of our wire and cable in “reel-less” bundles that we place on reusable steel spools mounted on our trucks. This avoids the use of large, heavy wooden reels, which have limited life spans.
Since 2006, Duke Energy has clearly established our expectations of vendors with our Supplier Code of Conduct. We expect our suppliers to conduct their business with the same regard for the environment, human rights, safety and quality that we expect of ourselves.
poLITICaL INVoLVEmENT
By participating in the political process, we ensure the voices of our company, customers, shareholders and other stake-holders are heard in the public arena.
Legislative and regulatory “strokes of the pen” pose some of the greatest risks to our business. Our lobbyists study proposed bills and regulations, consult with technical and fi nancial specialists, and provide infor-mation to lawmakers so they can make informed decisions.
In 2010, we spent nearly $7 million on reportable lobbying expenses at the federal and state levels to promote sound energy policy. Included in this amount is approximately $630,000 of our 2010 federal trade association dues that were used for lobbying.
finanCiaL highLights (iN MillioNs eXCePt For Per sHAre DAtA) 1
2008 2009 2010
Total operating revenues $13,207 $12,731 $14,272
Net income attributable to duke Energy Corporation $1,362 $1,075 $1,320
Reported diluted earnings per share $1 .07 $0 .83 $1.00
Adjusted diluted earnings per share $1 .21 $1 .22 $1.43
dividends per share $0 .90 $0 .94 $0.97
Total assets $53,077 $57,040 $59,090
Long-term debt including capital leases and variable interest entities, less current maturities $13,250 $16,113 $17,935
1 see 2010 Duke energy Annual report / Form 10-K Financial Highlights for detailed notes and explanations of fi gures above.
Web eXCLusive Content
■ Crisis Management in the Age of Social Media
■ Paying Our Fair Share of Taxes ■ Protecting the Dividend Tax Rate ■ Local and Regional Banks Invest in
Duke Energy ■ Ceo recognized for infl uence in
Corporate Governance ■ Diverse Supplier Spending Increases
Slightly ■ Stakeholder Expectations and
Fulfi llments ■ Partnerships and Memberships
DukE ENERGy CoRpoRaTIoN 2010 | 2011 sustainability report
40
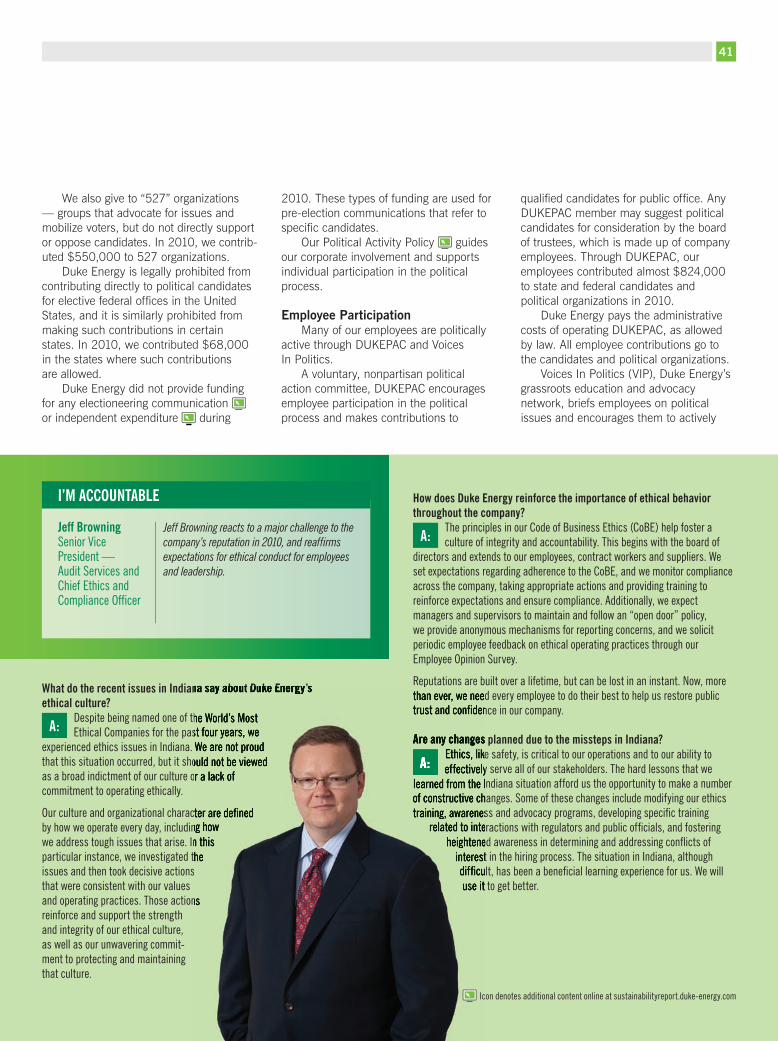
We also give to “527” organizations — groups that advocate for issues and mobilize voters, but do not directly support or oppose candidates. In 2010, we contrib-uted $550,000 to 527 organizations.
Duke Energy is legally prohibited from contributing directly to political candidates for elective federal offi ces in the United States, and it is similarly prohibited from making such contributions in certain states. In 2010, we contributed $68,000 in the states where such contributions are allowed.
Duke Energy did not provide funding for any electioneering communication or independent expenditure during
2010. These types of funding are used for pre-election communications that refer to specifi c candidates.
Our Political Activity Policy guides our corporate involvement and supports individual participation in the political process.
Employee participationMany of our employees are politically
active through DUKEPAC and Voices In Politics.
A voluntary, nonpartisan political action committee, DUKEPAC encourages employee participation in the political process and makes contributions to
qualifi ed candidates for public offi ce. Any DUKEPAC member may suggest political candidates for consideration by the board of trustees, which is made up of company employees. Through DUKEPAC, our employees contributed almost $824,000 to state and federal candidates and political organizations in 2010.
Duke Energy pays the administrative costs of operating DUKEPAC, as allowed by law. All employee contributions go to the candidates and political organizations.
Voices In Politics (VIP), Duke Energy’s grassroots education and advocacy network, briefs employees on political issues and encourages them to actively
What do the recent issues in indiana say about duke Energy’s ethical culture?
Despite being named one of the World’s Most Ethical Companies for the past four years, we
experienced ethics issues in Indiana . We are not proud that this situation occurred, but it should not be viewed as a broad indictment of our culture or a lack of commitment to operating ethically .
our culture and organizational character are defi ned by how we operate every day, including how we address tough issues that arise . In this particular instance, we investigated the issues and then took decisive actions that were consistent with our values and operating practices . Those actions reinforce and support the strength and integrity of our ethical culture, as well as our unwavering commit-ment to protecting and maintaining that culture .
How does duke Energy reinforce the importance of ethical behavior throughout the company?
The principles in our Code of Business Ethics (CoBE) help foster a culture of integrity and accountability . This begins with the board of
directors and extends to our employees, contract workers and suppliers . We set expectations regarding adherence to the CoBE, and we monitor compliance across the company, taking appropriate actions and providing training to reinforce expectations and ensure compliance. Additionally, we expect managers and supervisors to maintain and follow an “open door” policy, we provide anonymous mechanisms for reporting concerns, and we solicit periodic employee feedback on ethical operating practices through our Employee Opinion Survey .
Reputations are built over a lifetime, but can be lost in an instant . now, more than ever, we need every employee to do their best to help us restore public trust and confi dence in our company.
Are any changes planned due to the missteps in indiana? Ethics, like safety, is critical to our operations and to our ability to
effectively serve all of our stakeholders . The hard lessons that we learned from the Indiana situation afford us the opportunity to make a number of constructive changes . Some of these changes include modifying our ethics training, awareness and advocacy programs, developing specifi c training
related to interactions with regulators and public offi cials, and fostering heightened awareness in determining and addressing confl icts of
interest in the hiring process . The situation in Indiana, although diffi cult, has been a benefi cial learning experience for us. We will use it to get better .
a:
a:
a:
i’m aCCountabLe
Jeff BrowningSenior Vice President — Audit services and Chief Ethics and Compliance offi cer
Jeff Browning reacts to a major challenge to the company’s reputation in 2010, and reaffi rms expectations for ethical conduct for employees and leadership.
What do the recent issues in indiana say about duke Energy’s
Despite being named one of the World’s Most Ethical Companies for the past four years, we
experienced ethics issues in Indiana . We are not proud that this situation occurred, but it should not be viewed as a broad indictment of our culture or a lack of
our culture and organizational character are defi ned by how we operate every day, including how we address tough issues that arise . In this particular instance, we investigated the issues and then took decisive actions
and operating practices . Those actions
Reputations are built over a lifetime, but can be lost in an instant . now, more than ever, we need every employee to do their best to help us restore public trust and confi dence in our company.
Are any changes planned due to the missteps in indiana? Ethics, like safety, is critical to our operations and to our ability to effectively serve all of our stakeholders . The hard lessons that we
learned from the Indiana situation afford us the opportunity to make a number of constructive changes . Some of these changes include modifying our ethics training, awareness and advocacy programs, developing specifi c training
related to interactions with regulators and public offi cials, and fostering heightened awareness in determining and addressing confl icts of
interest in the hiring process . The situation in Indiana, although diffi cult, has been a benefi cial learning experience for us. We will use it to get better .
a:
Icon denotes additional content online at sustainabilityreport .duke-energy .com
41
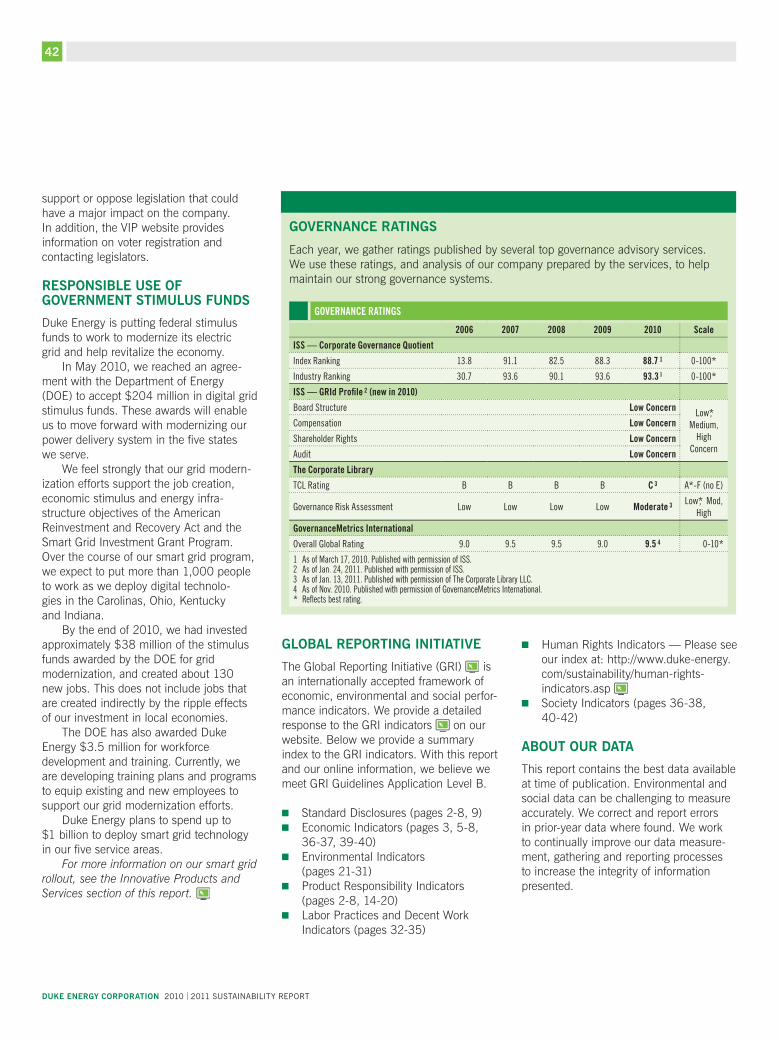
support or oppose legislation that could have a major impact on the company. In addition, the VIP website provides information on voter registration and contacting legislators.
RESpoNSIBLE uSE of GoVERNmENT STImuLuS fuNDS
Duke Energy is putting federal stimulus funds to work to modernize its electric grid and help revitalize the economy.
In May 2010, we reached an agree-ment with the Department of Energy (DOE) to accept $204 million in digital grid stimulus funds. These awards will enable us to move forward with modernizing our power delivery system in the five states we serve.
We feel strongly that our grid modern-ization efforts support the job creation, economic stimulus and energy infra-structure objectives of the American Reinvestment and Recovery Act and the Smart Grid Investment Grant Program. Over the course of our smart grid program, we expect to put more than 1,000 people to work as we deploy digital technolo-gies in the Carolinas, Ohio, Kentucky and Indiana.
By the end of 2010, we had invested approximately $38 million of the stimulus funds awarded by the DOE for grid modernization, and created about 130 new jobs. This does not include jobs that are created indirectly by the ripple effects of our investment in local economies.
The DOE has also awarded Duke Energy $3.5 million for workforce development and training. Currently, we are developing training plans and programs to equip existing and new employees to support our grid modernization efforts.
Duke Energy plans to spend up to $1 billion to deploy smart grid technology in our five service areas.
For more information on our smart grid rollout, see the Innovative Products and Services section of this report.
GLoBaL REpoRTING INITIaTIVE
The Global Reporting Initiative (GRI) is an internationally accepted framework of economic, environmental and social perfor-mance indicators. We provide a detailed response to the GRI indicators on our website. Below we provide a summary index to the GRI indicators. With this report and our online information, we believe we meet GRI Guidelines Application Level B.
■ Standard Disclosures (pages 2-8, 9)■ Economic Indicators (pages 3, 5-8,
36-37, 39-40)■ Environmental Indicators
(pages 21-31)■ Product Responsibility Indicators
(pages 2-8, 14-20)■ Labor Practices and Decent Work
Indicators (pages 32-35)
■ Human Rights Indicators — Please see our index at: http://www.duke-energy.com/sustainability/human-rights-indicators.asp
■ Society Indicators (pages 36-38, 40-42)
aBouT ouR DaTa
This report contains the best data available at time of publication. Environmental and social data can be challenging to measure accurately. We correct and report errors in prior-year data where found. We work to continually improve our data measure-ment, gathering and reporting processes to increase the integrity of information presented.
GoVERNaNCE RaTINGS
Each year, we gather ratings published by several top governance advisory services. We use these ratings, and analysis of our company prepared by the services, to help maintain our strong governance systems.
governanCe ratings
2006 2007 2008 2009 2010 Scale
iSS — Corporate Governance Quotient
Index Ranking 13 .8 91 .1 82 .5 88 .3 88.7 1 0-100*
Industry Ranking 30 .7 93 .6 90 .1 93 .6 93.3 1 0-100*
iSS — GRid Profile 2 (new in 2010)
Board Structure Low Concern Low*, Medium,
High Concern
Compensation Low Concern
Shareholder Rights Low Concern
Audit Low Concern
The Corporate Library
TCL Rating B B B B C 3 A*-F (no e)
governance risk Assessment Low Low Low Low moderate 3 Low*, Mod, High
Governancemetrics international
Overall Global Rating 9 .0 9 .5 9 .5 9 .0 9.5 4 0-10*
1 As of March 17, 2010. Published with permission of iss.2 As of Jan. 24, 2011. Published with permission of iss.3 As of Jan. 13, 2011. Published with permission of the Corporate library llC.4 As of Nov. 2010. Published with permission of governanceMetrics international.* reflects best rating.
DukE ENERGy CoRpoRaTIoN 2010 | 2011 sustainability report
42

Business for Social Responsibility (BSR) is pleased to provide our fi fth independent review of Duke Energy’s annual Sustainability Report. The perspectives we offer below are informed by our knowledge of material social and environmental issues in the electric utilities sector, familiarity with Duke Energy and the company’s reporting practice over the past fi ve years, and experience applying international standards for best practice in sustainability reporting. This review neither verifi es nor expresses an opinion on the accuracy, materiality or completeness of information provided in this report.
Notable strengths of the 2010 | 2011 Report include its:
■ Refl ection on Duke Energy’s achievements over the past fi ve years. Roberta Bowman’s Q&A, presentation of multiple years of data and discussion of signifi cant goals attained — such as the company’s dramatic reduction of solid waste and improvement in its Total Incident Case Rate since 2007 — highlight the longer arc of cumulative progress it has made since publication of its fi rst Sustainability Plan.
■ Balanced exploration of existing and emerging social and environmental concerns. Duke Energy continues to directly and openly address long-standing concerns like nuclear safety and ethical conduct, as well as new issues like cyber security for smart grids and stakeholder preoccupa-tions about new renewable energy technologies. However, we would like to see the company tackle long-term questions about the costs, relative CO2 reductions and environmental impacts of natural gas in greater depth.
■ Clear insight into the “work” of sustainability. This year’s report brings readers to the front lines of sustainability at Duke Energy. For the fi rst time it includes employee as well as executive voices, shares grassroots innovations inspired by sustainability challenges and goals, and starts to document the business returns the company has enjoyed as a result, from cost reduction to investor recognition on the DJSI World Index. These are proof positive that sustainability is increasingly part of Duke Energy’s corporate DNA.
In next year’s report, we encourage Duke Energy to:
■ Thoroughly address the implications of the fukushima nuclear crisis. Even as this report is written, the events unfolding in Japan are fundamentally reshaping the future of nuclear power. We — and the company’s stakeholders — will want to know what Duke Energy learned from Fukushima, and the impact those lessons have had on its approach to public policy, transparency and engagement with stakeholders around the costs and benefi ts of nuclear power, new generation strategy, and technology, design and safety measures at existing and potential nuclear power facilities.
■ provide more sophisticated and in-depth discussion of supply chain sustainability risks, opportunities and activities. What does Duke Energy’s supply chain look like? How is it changing as its business is transformed? What kind of material social and environmental impacts do its suppliers have on workers and communities? How is the company comprehensively managing sustainability risk and capitalizing on opportunities with suppliers? While this year’s report provides greater detail on this topic than ever, we believe there is still room for substantial improvement in its treatment of supply chain sustainability.
■ Share how the company is reinvigo-rating its approach to sustainability in light of the planned merger with progress Energy. This offers both opportunity and challenge. Opportunity to set aggressive new targets, learn from each company’s’ experience, and bring fresh eyes and skills to sustainability management. On the other hand, there will be dramatic changes to the company’s struc-ture and leadership, which create great uncertainty for the future of sustainability at Duke Energy. We look forward to hearing how the company is integrating new opera-tions, perspectives, staff, structures and leadership, and how it plans to build on its strong foundation for sustainability moving forward.
We appreciate the opportunity to share our feedback and look forward to following Duke Energy’s ongoing journey.
Julia Ka’iulani NelsonManager, Energy & ExtractivesBusiness for Social ResponsibilityApril 6, 2011
INDEpENDENT REVIEW
Icon denotes additional content online at sustainabilityreport .duke-energy .com
43
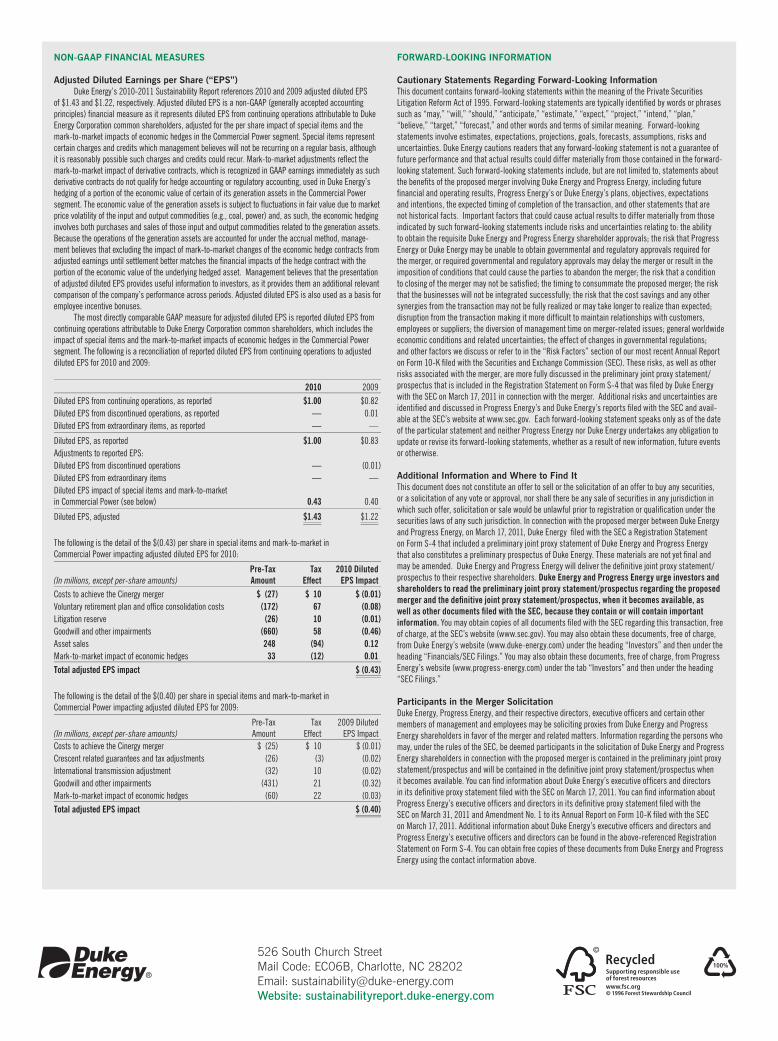
526 South Church StreetMail Code: EC06B, Charlotte, NC 28202Email: [email protected]: sustainabilityreport.duke-energy.com
NoN-Gaap fINaNCIaL mEaSuRES
adjusted Diluted Earnings per Share (“EpS”)Duke Energy’s 2010-2011 Sustainability Report references 2010 and 2009 adjusted diluted EPS
of $1.43 and $1.22, respectively. Adjusted diluted ePs is a non-gAAP (generally accepted accounting principles) financial measure as it represents diluted EPS from continuing operations attributable to Duke Energy Corporation common shareholders, adjusted for the per share impact of special items and the mark-to-market impacts of economic hedges in the Commercial Power segment . Special items represent certain charges and credits which management believes will not be recurring on a regular basis, although it is reasonably possible such charges and credits could recur . Mark-to-market adjustments reflect the mark-to-market impact of derivative contracts, which is recognized in gAAP earnings immediately as such derivative contracts do not qualify for hedge accounting or regulatory accounting, used in Duke Energy’s hedging of a portion of the economic value of certain of its generation assets in the Commercial Power segment . The economic value of the generation assets is subject to fluctuations in fair value due to market price volatility of the input and output commodities (e .g ., coal, power) and, as such, the economic hedging involves both purchases and sales of those input and output commodities related to the generation assets . Because the operations of the generation assets are accounted for under the accrual method, manage-ment believes that excluding the impact of mark-to-market changes of the economic hedge contracts from adjusted earnings until settlement better matches the financial impacts of the hedge contract with the portion of the economic value of the underlying hedged asset . Management believes that the presentation of adjusted diluted EPS provides useful information to investors, as it provides them an additional relevant comparison of the company’s performance across periods. Adjusted diluted ePs is also used as a basis for employee incentive bonuses .
the most directly comparable gAAP measure for adjusted diluted ePs is reported diluted ePs from continuing operations attributable to Duke Energy Corporation common shareholders, which includes the impact of special items and the mark-to-market impacts of economic hedges in the Commercial Power segment . The following is a reconciliation of reported diluted EPS from continuing operations to adjusted diluted EPS for 2010 and 2009:
2010 2009Diluted EPS from continuing operations, as reported $1.00 $0 .82Diluted EPS from discontinued operations, as reported — 0 .01Diluted EPS from extraordinary items, as reported — —
Diluted EPS, as reported $1.00 $0 .83Adjustments to reported ePs:Diluted EPS from discontinued operations — (0 .01)Diluted EPS from extraordinary items — —Diluted EPS impact of special items and mark-to-market in Commercial Power (see below) 0.43 0 .40
Diluted EPS, adjusted $1.43 $1 .22
The following is the detail of the $(0 .43) per share in special items and mark-to-market in Commercial Power impacting adjusted diluted EPS for 2010:
(In millions, except per-share amounts)Pre-Tax Amount
Tax Effect
2010 diluted eps impact
Costs to achieve the Cinergy merger $ (27) $ 10 $ (0.01)Voluntary retirement plan and office consolidation costs (172) 67 (0.08)Litigation reserve (26) 10 (0.01)Goodwill and other impairments (660) 58 (0.46)Asset sales 248 (94) 0.12Mark-to-market impact of economic hedges 33 (12) 0.01Total adjusted EPS impact $ (0.43)
The following is the detail of the $(0 .40) per share in special items and mark-to-market in Commercial Power impacting adjusted diluted EPS for 2009:
(In millions, except per-share amounts)Pre-Tax Amount
Tax Effect
2009 Diluted EPS Impact
Costs to achieve the Cinergy merger $ (25) $ 10 $ (0 .01)Crescent related guarantees and tax adjustments (26) (3) (0 .02)International transmission adjustment (32) 10 (0 .02)Goodwill and other impairments (431) 21 (0 .32)Mark-to-market impact of economic hedges (60) 22 (0 .03)Total adjusted EPS impact $ (0.40)
foRWaRD-LookING INfoRmaTIoN
Cautionary Statements Regarding forward-Looking InformationThis document contains forward-looking statements within the meaning of the Private Securities litigation reform Act of 1995. Forward-looking statements are typically identified by words or phrases such as “may,” “will,” “should,” “anticipate,” “estimate,” “expect,” “project,” “intend,” “plan,” “believe,” “target,” “forecast,” and other words and terms of similar meaning . Forward-looking statements involve estimates, expectations, projections, goals, forecasts, assumptions, risks and uncertainties . Duke Energy cautions readers that any forward-looking statement is not a guarantee of future performance and that actual results could differ materially from those contained in the forward-looking statement . Such forward-looking statements include, but are not limited to, statements about the benefits of the proposed merger involving Duke energy and Progress energy, including future financial and operating results, Progress energy’s or Duke energy’s plans, objectives, expectations and intentions, the expected timing of completion of the transaction, and other statements that are not historical facts . Important factors that could cause actual results to differ materially from those indicated by such forward-looking statements include risks and uncertainties relating to: the ability to obtain the requisite Duke Energy and Progress Energy shareholder approvals; the risk that Progress Energy or Duke Energy may be unable to obtain governmental and regulatory approvals required for the merger, or required governmental and regulatory approvals may delay the merger or result in the imposition of conditions that could cause the parties to abandon the merger; the risk that a condition to closing of the merger may not be satisfied; the timing to consummate the proposed merger; the risk that the businesses will not be integrated successfully; the risk that the cost savings and any other synergies from the transaction may not be fully realized or may take longer to realize than expected; disruption from the transaction making it more difficult to maintain relationships with customers, employees or suppliers; the diversion of management time on merger-related issues; general worldwide economic conditions and related uncertainties; the effect of changes in governmental regulations; and other factors we discuss or refer to in the “risk Factors” section of our most recent Annual report on Form 10-K filed with the securities and exchange Commission (seC). these risks, as well as other risks associated with the merger, are more fully discussed in the preliminary joint proxy statement/prospectus that is included in the registration statement on Form s-4 that was filed by Duke energy with the seC on March 17, 2011 in connection with the merger. Additional risks and uncertainties are identified and discussed in Progress energy’s and Duke energy’s reports filed with the seC and avail-able at the SEC’s website at www .sec .gov . Each forward-looking statement speaks only as of the date of the particular statement and neither Progress Energy nor Duke Energy undertakes any obligation to update or revise its forward-looking statements, whether as a result of new information, future events or otherwise .
additional Information and Where to find ItThis document does not constitute an offer to sell or the solicitation of an offer to buy any securities, or a solicitation of any vote or approval, nor shall there be any sale of securities in any jurisdiction in which such offer, solicitation or sale would be unlawful prior to registration or qualification under the securities laws of any such jurisdiction . In connection with the proposed merger between Duke Energy and Progress energy, on March 17, 2011, Duke energy filed with the seC a registration statement on Form S-4 that included a preliminary joint proxy statement of Duke Energy and Progress Energy that also constitutes a preliminary prospectus of Duke energy. these materials are not yet final and may be amended. Duke energy and Progress energy will deliver the definitive joint proxy statement/prospectus to their respective shareholders . duke Energy and Progress Energy urge investors and shareholders to read the preliminary joint proxy statement/prospectus regarding the proposed merger and the definitive joint proxy statement/prospectus, when it becomes available, as well as other documents filed with the SEC, because they contain or will contain important information. You may obtain copies of all documents filed with the seC regarding this transaction, free of charge, at the SEC’s website (www .sec .gov) . You may also obtain these documents, free of charge, from Duke Energy’s website (www .duke-energy .com) under the heading “Investors” and then under the heading “Financials/SEC Filings .” You may also obtain these documents, free of charge, from Progress Energy’s website (www .progress-energy .com) under the tab “Investors” and then under the heading “SEC Filings .”
participants in the merger SolicitationDuke energy, Progress energy, and their respective directors, executive officers and certain other members of management and employees may be soliciting proxies from Duke Energy and Progress Energy shareholders in favor of the merger and related matters . Information regarding the persons who may, under the rules of the SEC, be deemed participants in the solicitation of Duke Energy and Progress Energy shareholders in connection with the proposed merger is contained in the preliminary joint proxy statement/prospectus and will be contained in the definitive joint proxy statement/prospectus when it becomes available. You can find information about Duke energy’s executive officers and directors in its definitive proxy statement filed with the seC on March 17, 2011. You can find information about Progress energy’s executive officers and directors in its definitive proxy statement filed with the seC on March 31, 2011 and Amendment No. 1 to its Annual report on Form 10-K filed with the seC on March 17, 2011. Additional information about Duke energy’s executive officers and directors and Progress energy’s executive officers and directors can be found in the above-referenced registration Statement on Form S-4 . You can obtain free copies of these documents from Duke Energy and Progress Energy using the contact information above .