duke realty supp q3 2021
TRANSCRIPT


Table of Contents
Page PageCompany Information Property Operating Information
Company, Common Stock, and Earnings Call Information 1 Occupancy 15
Definitions 2-3 Property Net Operating Income 16-18
Largest Customers 4 Same Property Net Operating Income 19
Financial Information Lease Expirations 20
Balance Sheets 5 Leasing Activity 21
Condensed Statements of Operations 6 Real Estate Investment Information
Non-GAAP Reconciliations - FFO, Core FFO and AFFO 7-8 Land Inventory 22
Balance Sheet Information 9 Development Projects Under Construction 23
Selected Financial Information 10 Development Project Deliveries 24
Debt Information Joint Ventures 25
Leverage Metrics 11 Dispositions and Acquisitions 26
Debt Maturities 12 Components of Net Asset Value 27
Unsecured Public Debt Covenants 13 Other
Joint Venture Debt Maturities 14 Range of Estimates 28
When used in this supplemental information package and the conference call to be held in connection herewith, the word “believes,” “expects,” “estimates” and similar expressions are intended to identify forward-looking statements. Such statements are subject to certain risks and uncertainties which could cause actual results to differ materially. In particular, among the factors that could cause actual results to differ materially are the current pandemic caused by COVID19, continued qualification as a real estate investment trust, general business and economic conditions, competition, increases in real estate construction costs, interest rates, accessibility of debt and equity capital markets and other risks inherent in the real estate business including tenant defaults, potential liability relating to environmental matters and liquidity of real estate investments. Readers are advised to refer to Duke Realty's Form 10-K Report as filed with the Securities and Exchange Commission on February 19, 2021 and Form 10-Q for the quarter ended September 30, 2021, for additional information concerning these risks. Additional factors are discussed in reports filed with the Securities and Exchange Commission by us under the heading "Risk Factors."
Duke Realty Corporation
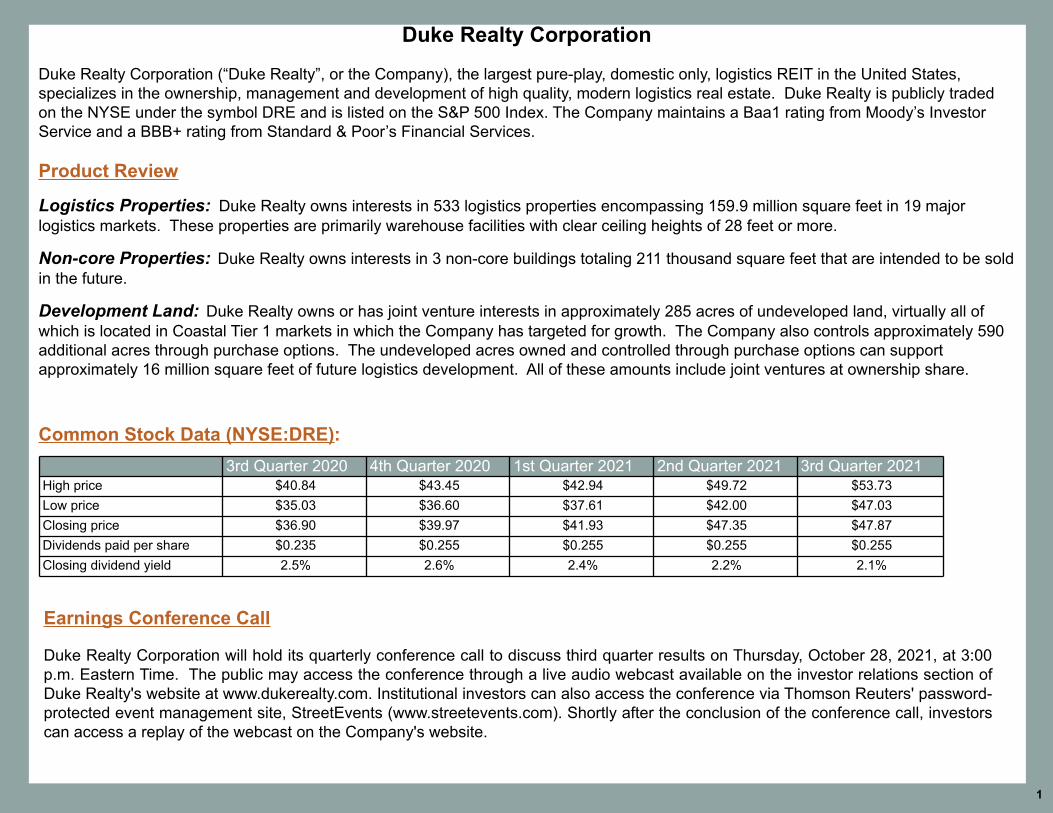
Duke Realty Corporation (“Duke Realty”, or the Company), the largest pure-play, domestic only, logistics REIT in the United States, specializes in the ownership, management and development of high quality, modern logistics real estate. Duke Realty is publicly traded on the NYSE under the symbol DRE and is listed on the S&P 500 Index. The Company maintains a Baa1 rating from Moody’s Investor Service and a BBB+ rating from Standard & Poor’s Financial Services.
Product Review Logistics Properties: Duke Realty owns interests in 533 logistics properties encompassing 159.9 million square feet in 19 major logistics markets. These properties are primarily warehouse facilities with clear ceiling heights of 28 feet or more. Non-core Properties: Duke Realty owns interests in 3 non-core buildings totaling 211 thousand square feet that are intended to be sold in the future. Development Land: Duke Realty owns or has joint venture interests in approximately 285 acres of undeveloped land, virtually all of which is located in Coastal Tier 1 markets in which the Company has targeted for growth. The Company also controls approximately 590 additional acres through purchase options. The undeveloped acres owned and controlled through purchase options can support approximately 16 million square feet of future logistics development. All of these amounts include joint ventures at ownership share.
1
3rd Quarter 2020 4th Quarter 2020 1st Quarter 2021 2nd Quarter 2021 3rd Quarter 2021High price $40.84 $43.45 $42.94 $49.72 $53.73Low price $35.03 $36.60 $37.61 $42.00 $47.03Closing price $36.90 $39.97 $41.93 $47.35 $47.87Dividends paid per share $0.235 $0.255 $0.255 $0.255 $0.255Closing dividend yield 2.5% 2.6% 2.4% 2.2% 2.1%
Earnings Conference Call
Duke Realty Corporation will hold its quarterly conference call to discuss third quarter results on Thursday, October 28, 2021, at 3:00 p.m. Eastern Time. The public may access the conference through a live audio webcast available on the investor relations section of Duke Realty's website at www.dukerealty.com. Institutional investors can also access the conference via Thomson Reuters' password-protected event management site, StreetEvents (www.streetevents.com). Shortly after the conclusion of the conference call, investors can access a replay of the webcast on the Company's website.
Common Stock Data (NYSE:DRE):

Definitions
Non-GAAP Supplemental Performance Measures Funds from Operations (“FFO”): FFO is a non-GAAP performance measure computed in accordance with standards established by the National Association of Real Estate Investment Trusts (“Nareit”). It is calculated as net income attributable to common shareholders computed in accordance with generally accepted accounting principles (“GAAP"), excluding depreciation and amortization related to real estate, gains or losses on sales of real estate assets (including real estate assets incidental to our business), gains or losses from change in control, impairment charges related to real estate assets (including real estate assets incidental to our business) and similar adjustments for unconsolidated joint ventures and partially owned consolidated entities, all net of related taxes. We believe FFO to be most directly comparable to net income attributable to common shareholders as defined by GAAP. FFO does not represent a measure of liquidity, nor is it indicative of funds available for our cash needs, including our ability to make cash distributions to shareholders. Core Funds from Operations (“Core FFO”): Core FFO is computed as FFO adjusted for certain items that can create significant earnings volatility and do not directly relate to our core business operations. The adjustments include gains or losses on debt transactions, gains or losses from involuntary conversion from weather events or natural disasters, promote income, severance and other charges related to major overhead restructuring activities, the expense impact of non-incremental costs attributable to successful leases and similar adjustments for unconsolidated joint ventures and partially owned consolidated entities. Although our calculation of Core FFO differs from Nareit’s definition of FFO and may not be comparable to that of other REITs and real estate companies, we believe it provides a meaningful supplemental measure of our operating performance. Non-Incremental Costs Attributable to Successful Leases: Non-incremental costs attributable to successful leases represent internal costs allocable to successful leasing activities and exclude estimated costs related to downtime and/or unsuccessful deals. These costs primarily consist of compensation and other benefits for internal leasing and legal personnel. These costs are not capitalizable "incremental costs" in the context of the applicable lease accounting rules, but we believe including them as an adjustment when computing Core FFO provides useful information for purposes of comparability with economically similar success-based costs incurred by other organizations that outsource their leasing functions, which are generally capitalizable. Adjusted Funds from Operations (“AFFO”): AFFO is defined by the Company as the Core FFO (as defined above), less recurring building improvements and total second generation capital expenditures (the leasing of vacant space that had previously been under lease by the Company is referred to as second generation lease activity) related to leases commencing during the reporting period, and adjusted for certain non-cash items including straight line rental income and expense, non-cash components of interest expense including interest rate hedge amortization, stock compensation expense and after similar adjustments for unconsolidated partnerships and joint ventures. EBITDA for Real Estate ("EBITDAre"): EBITDAre is a non-GAAP supplemental performance measure, which is defined by Nareit as net income (computed in accordance with GAAP), before interest, taxes, depreciation and amortization ("EBITDA") adjusted to exclude gains and losses on sales of real estate assets (including real estate assets incidental to our business), gains and losses from change of control, impairment charges related to real estate assets (including real estate assets incidental to our business) and to include share of EBITDAre of unconsolidated joint ventures. We believe EBITDAre to be most directly comparable to net income computed in accordance with GAAP and consider it to be a useful supplemental performance measure for investors to evaluate our operating performance and ability to meet interest payment obligations. Core EBITDA: Core EBITDA is defined by the Company as the EBITDAre, adjusted for the same reasons as Core FFO, to exclude gains or losses on debt transactions, gains or losses from involuntary conversion from weather events or natural disasters, the expense impact of costs attributable to successful leasing activities, promote income and severance charges related to major overhead restructuring activities. Property Level Net Operating Income - Cash Basis ("PNOI"): PNOI is a non-GAAP performance measure, which is comprised of rental revenues from continuing operations (computed in accordance with GAAP) less rental expenses and real estate taxes from continuing operations, along with adjustments to exclude the straight line rental income and expense, amortization of above and below market rents, amortization of lease concessions and lease termination fees as well as an adjustment to add back intercompany rent. PNOI, as we calculate it, may not be directly comparable to similarly titled, but differently calculated, measures for other REITs. We believe that PNOI to be most directly comparable to income from continuing operations defined by GAAP and that PNOI is another useful supplemental performance measure, as it is an input in many REIT valuation models and it provides a means by which to evaluate the performance of the properties within our Rental Operations segments. Same Property Net Operating Income ("SPNOI - Cash"): We evaluate the performance of our properties, including our share of properties we jointly control, on a "same property" basis, using PNOI with certain minor adjustments. The same property pool of properties is defined once a year at the beginning of the current calendar year, and includes buildings that were in the stabilized portfolio throughout both the current and prior calendar years in both periods. The same property pool is adjusted for dispositions subsequent to its initial establishment. SPNOI also excludes termination fees. SPNOI is a non-GAAP supplemental performance measure that we believe is useful because it improves comparability between periods by eliminating the effects of changes in the composition of our portfolio. Same Property Net Operating Income ("SPNOI - Net Effective"): Computed consistently, and with the same population of properties, as SPNOI-Cash except for the inclusion of the effects on properties of straight-line rental income, the amortization of above or below market rents and the amortization of lease concessions.
2

Other Terms Average Net Effective Rent Growth: Represents the percentage change in net effective rent between the original leases and the current leases. Net effective rent represents average annual base rental payments, on a straight-line basis for the term of each lease excluding operating expense reimbursements. The calculation excludes leases with an initial term of less than 12 months and is weighted by the square footage of leases executed. Cash Rent Growth: Represents the change in starting rental rates per the lease agreement on new and renewed leases signed during the period as compared with the previous ending rental rates in that same space. The calculation excludes leases with an initial term of less than 12 months and excludes any free rent periods. The calculation is weighted by the square footage of leases executed.
Funds Available for Reinvestment: Represents AFFO less regular dividends and distributions.
GAAP Yield (Developments): Stabilized GAAP yield measures the average annualized net operating income expected to be generated over the life of the leaseterm(s) divided by the average annual investment in the development project over the same period. In the instances where a project is not yet fully leased, the GAAP yield is equal to the five year average, using lease-up projections, and computed for years 2-6, allowing the development project a twelve month stabilization period. In-Place Yield (Acquisitions): In-place yields of acquisitions are calculated as annualized net operating income, from space leased to tenants at the date of purchase on a lease-up basis, including full rent from all executed leases, even if currently in a free rent period, divided by the acquisition cost. Annualized net operating income is comprised of base rental payments, excluding reimbursement of operating expenses, less current annualized operating expenses not recovered through tenant reimbursements. To the extent an acquired property is under short-term leaseback to the seller, the income from such leaseback, net of operating expenses, is also included in the in-place yield. In-Place Cap Rate (Dispositions): In-place cap rates of dispositions are calculated as annualized net operating income from space leased to tenants at the date of sale on a lease-up basis, including full rent from all executed leases, even if currently in a free rent period, divided by the sales proceeds. Annualized net operating income is comprised of base rental payments, excluding reimbursement of operating expenses, less current annualized operating expenses not recovered through tenant reimbursements. Percentage Leased: Percentage leased represents the percentage of total square feet under lease, without regard to whether the leases have commenced. Percentage Occupied: Percentage occupied represents the percentage of total square feet where the leases have commenced.
Stabilized Acquisition Cost: As presented for building acquisitions, includes the cash purchase price of the building, transaction costs associated with the acquisition, near term capital expenditures needed to stabilize the property and the effects of marking assumed debt and leases to market.
Stabilized Yield (Acquisitions): Stabilized yield measures an estimated twelve months of potential rental revenue (including cash rental payments, the amortization of above or below market leases and expense reimbursements), less estimated operating expenses, expected to be generated upon stabilization divided by the Stabilized Acquisition Cost of the project(s). Stabilized Cash Yield (Developments): Stabilized cash yield measures the net operating income expected to be generated upon stabilization divided by the total cost of the development project. The development cost includes estimated carry costs during the lease-up period. Stabilized Properties: Represents buildings that have reached 90% leased, or have been in-service for at least one year since development completion or acquisition date. Stabilized properties are subdivided into two additional categories for PNOI and NAV reporting (pages 16, 17 and 27) using the following criteria:
Stabilized Properties - Economic: Stabilized properties that have been 90% occupied, with all initial periods of free rent completed, for at least one full quarterly reporting period.
Stabilized Properties - Pre-Economic: Stabilized properties that have not yet been 90% occupied or with initial periods of free rent not completed for at least one full quarterly reporting period.
Unstabilized Properties: Represents buildings that have not yet reached 90% leased and have been in-service for less than one year since development completion or acquisition date. Value Creation: Estimated value creation is computed by applying a market cap rate to development projects initial net operating income expected to be generated upon stabilization to calculate an implied value. The value creation represents the amount by which the implied value exceeds the estimated stabilized costs of the project at the time of stabilization.
3

Largest Customers and Industry ClassificationsProperties in-service as of September 30, 2021
CustomerAnnualized
NLV (1) % of ANLV Industry % of ANLV
Amazon.com $52,224,431 6.6% Transportation 22%Home Depot 35,826,650 4.5% E-commerce 17%Wayfair Inc 16,105,634 2.0% Manufactured Products 17%United Parcel Service Inc. 15,655,784 2.0% Wholesale Goods 7%GoPlus Corp. 12,050,073 1.5% Food products 6%Lecangs LLC 12,007,298 1.5% Retail (2) 6%NFI Industries 9,165,737 1.2% Lumber & Building Materials 6%Floor & Decor Outlets 8,704,233 1.1% Consumer Services 5%Deckers Outdoor Corporation 7,456,863 0.9% Textiles 3%Bob's Discount Furniture LLC 7,411,033 0.9% Technology 2%Target Corporation 6,718,271 0.9% Chemical Products 2%Samsung Electronics Co. LTD 6,117,930 0.8% Publishing 2%U.S. Government Agencies 6,020,121 0.8% Health Services 2%Sonepar USA 5,498,302 0.7% Other 3%Clorox 5,369,648 0.7%Armada Warehouse Solutions LLC 5,023,906 0.6%Kimberly-Clark Corporation 4,843,541 0.6%Kraft Foods Inc. 4,680,066 0.6%Wal Mart 4,659,892 0.6%SNCF Group 4,657,243 0.6%Top 20 Customers $230,196,657 29.1%
Note: Amazon.com % of ANLV in the table above excludes a disposition that closed in October.
Note: Joint Venture annualized net lease value is included at the Company's economic ownership percentage.(1) Represents average annual net effective rents due from signed leases in the Company's in-service portfolio as of September 30, 2021. Average annual net effective rent equals the average annual rental property revenue over the terms of the respective leases excluding landlord operating expense allowance and additional rent due as operating expense reimbursements.
(2) Top Retail tenants by ANLV include: Bob's Discount Furniture, Target, The Container Store, Inditex.com, Electrolux, Starbucks, Walmart, Cotton On, and Regalo; in aggregate which represents 74% of total retail exposure.
4

Balance Sheets(unaudited and in thousands)
September 30,2021
June 30,2021
December 31,2020
Assets:
Real estate assets $9,104,690 $8,693,665 $8,745,155 Accumulated depreciation (1,659,068) (1,612,490) (1,659,308) Construction in progress 617,887 913,241 695,219 Land held for development 331,293 333,135 284,895 Non-strategic land — 2,087 6,719 Net real estate investments 8,394,802 8,329,638 8,072,680
Real estate investments and other assets held-for-sale 198,914 435,606 67,946
Cash and cash equivalents 9,874 8,252 6,309 Accounts receivable 12,323 12,103 15,204 Straight-line rent receivable 162,918 155,124 153,943 Receivables on construction contracts, including retentions 96,164 59,285 30,583 Investments in and advances to unconsolidated joint ventures 166,272 122,875 131,898 Deferred leasing and other costs, net 328,973 330,083 329,765 Restricted cash held in escrow for like-kind exchange 273,413 2,802 47,682 Other escrow deposits and other assets 404,724 388,392 255,384
Total assets $10,048,377 $9,844,160 $9,111,394
Liabilities and Equity:
Secured debt, net of deferred financing costs $60,529 $61,926 $64,074 Unsecured debt, net of deferred financing costs 3,138,926 3,387,226 3,025,977 Unsecured line of credit 156,000 265,000 295,000
3,355,455 3,714,152 3,385,051
Liabilities related to real estate investments held-for-sale 12,243 23,939 7,740 Construction payables and amounts due subcontractors, including retentions 157,693 128,406 62,332 Accrued real estate taxes 104,123 80,634 76,501 Accrued interest 21,674 20,726 18,363 Other liabilities 295,061 302,100 269,806 Tenant security deposits and prepaid rents 57,745 59,294 57,153
Total liabilities 4,003,994 4,329,251 3,876,946
Common shares 3,807 3,780 3,733 Additional paid-in capital 6,046,397 5,920,931 5,723,326 Accumulated other comprehensive loss (28,900) (29,789) (31,568) Distributions in excess of net income (71,005) (469,076) (532,519)
Total shareholders' equity 5,950,299 5,425,846 5,162,972
Noncontrolling interests 94,084 89,063 71,476
Total liabilities and equity $10,048,377 $9,844,160 $9,111,394
5

Statements of Operations(unaudited and in thousands)
Three Months Ended Nine Months EndedSeptember 30, 2021 September 30, 2020 September 30, 2021 September 30, 2020
Revenues:Rental and related revenue $256,815 $235,391 $768,965 $680,520 General contractor and service fee revenue 23,550 26,637 72,384 46,388
280,365 262,028 841,349 726,908 Expenses:
Rental expenses 19,766 20,231 66,411 56,631 Real estate taxes 39,972 37,027 122,510 110,517 General contractor and other services expenses 19,040 24,604 62,569 41,578 Depreciation and amortization 88,033 88,596 273,335 260,659
166,811 170,458 524,825 469,385 Other Operating Activities:
Equity in earnings of unconsolidated joint ventures 2,966 4,023 29,824 8,958 Gain on sale of properties 439,212 10,968 555,755 19,905 Gain on land sales 1,653 2,346 12,791 8,551 Other operating expenses (1,290) (1,772) (2,773) (4,430) Impairment charges — — — (5,626) Non-incremental costs related to successful leases (3,334) (4,058) (10,319) (10,617) General and administrative expenses (14,152) (11,439) (54,248) (46,808)
425,055 68 531,030 (30,067) Operating income 538,609 91,638 847,554 227,456
Other Income (Expenses):Interest and other income, net 1,433 32 3,569 1,643 Interest expense (20,003) (23,059) (63,582) (69,394) Loss on debt extinguishment (13,893) (120) (17,901) (32,898) Gain on involuntary conversion — 3,029 3,222 4,312
Income from continuing operations before income taxes 506,146 71,520 772,862 131,119 Income tax (expense) benefit (6,381) 956 (15,237) 1,166
Income from continuing operations 499,765 72,476 757,625 132,285
Discontinued operations:Gain on sale of properties — 40 — 111
Income from discontinued operations — 40 — 111
Net income 499,765 72,516 757,625 132,396 Net income attributable to noncontrolling interests (4,948) (693) (7,629) (1,297)
Net income attributable to common shareholders $494,817 $71,823 $749,996 $131,099 Basic net income per common share:
Continuing operations attributable to common shareholders $1.30 $0.19 $1.99 $0.35 Diluted net income per common share:
Continuing operations attributable to common shareholders $1.30 $0.19 $1.98 $0.35 Weighted average number of common shares outstanding 379,220 371,082 376,323 369,375 Weighted average number of common shares and potential dilutive securities 384,624 374,834 381,811 373,091
6

Non- GAAP Reconciliations - FFO, Core FFO and AFFO (unaudited and in thousands)
Three Months Ended September 30,2021 2020
Amount Wtd. Avg.
Shares Per
Share Amount Wtd. Avg.
SharesPer
Share Net income attributable to common shareholders $ 494,817 $ 71,823 Less dividends on participating securities (298) (352) Net Income Per Common Share-Basic 494,519 379,220 $ 1.30 71,471 371,082 $ 0.19 Add back:
Noncontrolling interest in earnings of unitholders 4,848 3,761 638 3,330 Other potentially dilutive securities 298 1,643 — 422
Net Income Attributable to Common Shareholders-Diluted $ 499,665 384,624 $ 1.30 $ 72,109 374,834 $ 0.19 Reconciliation to FFO Net Income Attributable to Common Shareholders $ 494,817 379,220 $ 71,823 371,082 Adjustments:
Depreciation and amortization 88,033 88,596 Depreciation, amortization and other - unconsolidated joint ventures 2,241 2,259 Gain on sales of properties (439,212) (11,008) Gain on land sales (1,653) (2,346) Income tax expense (benefit) not allocable to FFO 6,381 (956) Gain on sales of real estate assets - unconsolidated joint ventures 29 (1,095) Noncontrolling interest share of adjustments 3,380 (671)
Nareit FFO Attributable to Common Shareholders - Basic 154,016 379,220 $ 0.41 146,602 371,082 $ 0.40 Noncontrolling interest in income of unitholders 4,848 3,761 638 3,330 Noncontrolling interest share of adjustments (3,380) 671 Other potentially dilutive securities 1,643 1,833
Nareit FFO Attributable to Common Shareholders - Diluted 155,484 384,624 $ 0.40 147,911 376,245 $ 0.39 Gain on involuntary conversion — (3,029) Loss on debt extinguishment 13,893 120 Non-incremental costs related to successful leases 3,334 4,058 Overhead restructuring charges 3,463 —
Core FFO Attributable to Common Shareholders - Diluted $ 176,174 384,624 $ 0.46 $ 149,060 376,245 $ 0.40 AFFO Core FFO - Diluted $ 176,174 384,624 $ 0.46 $ 149,060 376,245 $ 0.40 Adjustments:
Straight-line rental income and expense (8,535) (7,796) Amortization of above/below market rents and concessions (4,084) (1,836) Stock based compensation expense 2,523 2,736 Noncash interest expense 2,327 2,463 Second generation concessions (653) (58) Second generation tenant improvements (8,162) (3,685) Second generation leasing costs (7,050) (5,623) Building improvements (1,409) (413)
AFFO - Diluted $ 151,131 384,624 $ 134,848 376,245 Dividends/Distributions paid on common shares and non-controlling units (97,496) $ 0.255 (88,083) $ 0.235 Funds Available for Reinvestment $ 53,635 $ 46,765
7

Non- GAAP Reconciliations - FFO, Core FFO and AFFO (unaudited and in thousands)
Nine Months Ended September 30,2021 2020
Amount Wtd. Avg.
Shares Per
Share Amount Wtd. Avg.
SharesPer
Share Net income attributable to common shareholders $ 749,996 $ 131,099 Less dividends on participating securities (1,033) (1,064) Net Income Per Common Share-Basic 748,963 376,323 $ 1.99 130,035 369,375 $ 0.35 Add back:
Noncontrolling interest in earnings of unitholders 7,347 3,702 1,164 3,296 Other potentially dilutive securities 1,033 1,786 — 420
Net Income Attributable to Common Shareholders-Diluted $ 757,343 381,811 $ 1.98 $ 131,199 373,091 $ 0.35 Reconciliation to FFO Net Income Attributable to Common Shareholders $ 749,996 376,323 $ 131,099 369,375 Adjustments:
Depreciation and amortization 273,335 260,659 Depreciation, amortization and other - unconsolidated joint ventures 6,510 6,759 Gain on sales of properties (555,755) (20,016) Gain on land sales (12,791) (8,551) Income tax expense (benefit) not allocable to FFO 15,237 (1,166) Impairment charges — 5,626 Gain on sales of real estate assets - unconsolidated joint ventures (20,079) (787) Noncontrolling interest share of adjustments 2,860 (2,144)
Nareit FFO Attributable to Common Shareholders - Basic 459,313 376,323 $ 1.22 371,479 369,375 $ 1.01 Noncontrolling interest in income of unitholders 7,347 3,702 1,164 3,296 Noncontrolling interest share of adjustments (2,860) 2,144 Other potentially dilutive securities 1,786 1,821
Nareit FFO Attributable to Common Shareholders - Diluted $ 463,800 381,811 $ 1.21 $ 374,787 374,492 $ 1.00 Gain on involuntary conversion (3,222) (4,312) Loss on debt extinguishment - including share of unconsolidated joint venture 17,964 32,898 Non-incremental costs related to successful leases 10,319 10,617 Overhead restructuring charges 3,463 2,063
Core FFO Attributable to Common Shareholders - Diluted $ 492,324 381,811 $ 1.29 $ 416,053 374,492 $ 1.11 AFFO Core FFO - Diluted $ 492,324 381,811 $ 1.29 $ 416,053 374,492 $ 1.11 Adjustments:
Straight-line rental income and expense (23,739) (15,934) Amortization of above/below market rents and concessions (9,550) (5,934) Stock based compensation expense 22,527 20,335 Noncash interest expense 7,074 6,896 Second generation concessions (2,289) (394) Second generation tenant improvements (16,689) (10,073) Second generation leasing costs (23,819) (14,126) Building improvements (4,527) (1,306)
AFFO - Diluted $ 441,312 381,811 $ 395,517 374,492 Dividends/Distributions paid on common shares and non-controlling units (290,479) $ 0.765 (262,780) $ 0.705 Funds Available for Reinvestment $ 150,833 $ 132,737
8
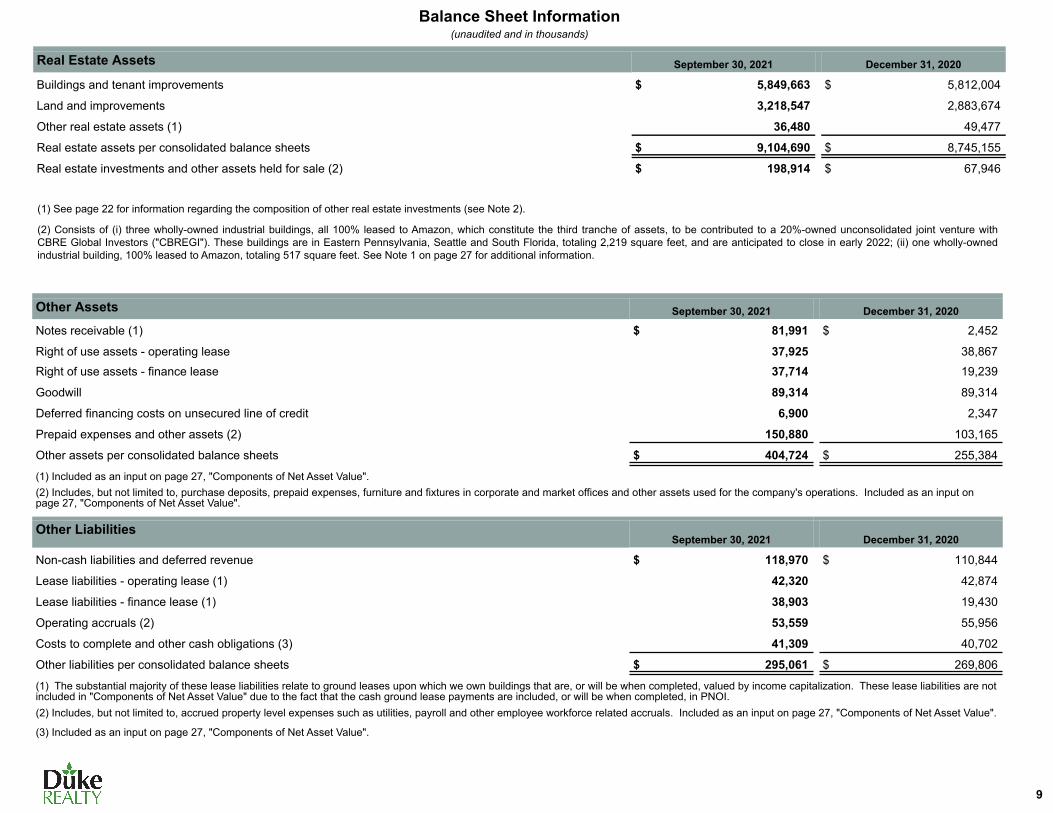
Balance Sheet Information(unaudited and in thousands)
Real Estate Assets September 30, 2021 December 31, 2020
Buildings and tenant improvements $ 5,849,663 $ 5,812,004
Land and improvements 3,218,547 2,883,674
Other real estate assets (1) 36,480 49,477
Real estate assets per consolidated balance sheets $ 9,104,690 $ 8,745,155
Real estate investments and other assets held for sale (2) $ 198,914 $ 67,946
Other Assets September 30, 2021 December 31, 2020
Notes receivable (1) $ 81,991 $ 2,452
Right of use assets - operating lease 37,925 38,867
Right of use assets - finance lease 37,714 19,239
Goodwill 89,314 89,314
Deferred financing costs on unsecured line of credit 6,900 2,347
Prepaid expenses and other assets (2) 150,880 103,165
Other assets per consolidated balance sheets $ 404,724 $ 255,384
(1) Included as an input on page 27, "Components of Net Asset Value".(2) Includes, but not limited to, purchase deposits, prepaid expenses, furniture and fixtures in corporate and market offices and other assets used for the company's operations. Included as an input on page 27, "Components of Net Asset Value".
Other LiabilitiesSeptember 30, 2021 December 31, 2020
Non-cash liabilities and deferred revenue $ 118,970 $ 110,844
Lease liabilities - operating lease (1) 42,320 42,874
Lease liabilities - finance lease (1) 38,903 19,430
Operating accruals (2) 53,559 55,956
Costs to complete and other cash obligations (3) 41,309 40,702
Other liabilities per consolidated balance sheets $ 295,061 $ 269,806
(1) The substantial majority of these lease liabilities relate to ground leases upon which we own buildings that are, or will be when completed, valued by income capitalization. These lease liabilities are not included in "Components of Net Asset Value" due to the fact that the cash ground lease payments are included, or will be when completed, in PNOI.(2) Includes, but not limited to, accrued property level expenses such as utilities, payroll and other employee workforce related accruals. Included as an input on page 27, "Components of Net Asset Value".
(3) Included as an input on page 27, "Components of Net Asset Value".
(1) See page 22 for information regarding the composition of other real estate investments (see Note 2). (2) Consists of (i) three wholly-owned industrial buildings, all 100% leased to Amazon, which constitute the third tranche of assets, to be contributed to a 20%-owned unconsolidated joint venture with CBRE Global Investors ("CBREGI"). These buildings are in Eastern Pennsylvania, Seattle and South Florida, totaling 2,219 square feet, and are anticipated to close in early 2022; (ii) one wholly-owned industrial building, 100% leased to Amazon, totaling 517 square feet. See Note 1 on page 27 for additional information.
9

Selected Financial Information(unaudited and in thousands)
Three Months Ended Nine Months Ended
September 30, 2021 September 30, 2020 September 30, 2021 September 30, 2020
Revenues from continuing operations $280,365 $262,028 $841,349 $726,908
Lease termination fees - wholly owned (included above in revenues from continuing operations and net of applicable straight line receivable write-off) $— $171 $246 $2,279
Non-GAAP Reconciliation - EBITDAre and Core EBITDANet income $499,765 $72,516 $757,625 $132,396 Add depreciation and amortization - continuing operations 88,033 88,596 273,335 260,659 Add non-real estate asset related depreciation 548 700 1,701 2,025 Add interest expense - continuing operations 20,003 23,059 63,582 69,394 Add income tax expense (benefit) - continuing operations 6,381 (956) 15,237 (1,166)
EBITDA $614,730 $183,915 $1,111,480 $463,308
Gain on sale of properties (439,212) (11,008) (555,755) (20,016) Gain on land sales (1,653) (2,346) (12,791) (8,551) Impairment charges — — — 5,626 Equity in earnings of unconsolidated joint ventures (2,966) (4,023) (29,824) (8,958) Company's share of unconsolidated joint venture EBITDAre 5,782 5,735 18,199 16,087
EBITDAre, as Defined by Nareit $176,681 $172,273 $531,309 $447,496 Gain on involuntary conversion — (3,029) (3,222) (4,312) Non-incremental costs related to successful leases 3,334 4,058 10,319 10,617 Loss on debt extinguishment 13,893 120 17,901 32,898 Overhead restructuring charges 3,463 — 3,463 2,063 Noncontrolling interest share of consolidated joint venture EBITDA 25 103 192 54
Core EBITDA $197,396 $173,525 $559,962 $488,816 Components of Fixed ChargesInterest expense - continuing operations $20,003 $23,059 $63,582 $69,394 Company's share of unconsolidated joint venture interest expense 394 448 1,076 1,390 Less noncontrolling interest share of consolidated joint venture interest expense (82) (82) (241) (216) Capitalized interest 8,858 5,664 26,586 19,360 Company's share of unconsolidated joint venture capitalized interest — — — 80
Total Fixed Charges $29,173 $29,089 $91,003 $90,008
Common dividends paid $96,537 $87,300 $287,619 $260,431 Non-controlling unit distributions paid $959 $783 $2,860 $2,349
Common shares outstanding 380,717 371,510 380,717 371,510 Non-controlling Partnership units outstanding 3,755 3,330 3,755 3,330
Total common shares and units outstanding at end of period 384,472 374,840 384,472 374,840
Common Equity Market Capitalization (1) $18,404,723 $13,831,596 $18,404,723 $13,831,596 Total Market Capitalization (2) $21,796,566 $17,012,028 $21,796,566 $17,012,028
Non-controlling share in gross assets of consolidated real estate joint ventures (excluding operating partnership) $15,079 $16,841 $15,079 $16,841 Non-controlling share in debt of consolidated real estate joint ventures (excluding operating partnership) $9,093 $9,459 $9,093 $9,459
Note: Amounts shown represent continuing and discontinued operations except where noted.
(1) Number of common shares and partnership units outstanding multiplied by the Company's closing share price at the end of each reporting period.
(2) Common Equity Market Capitalization plus face/redemption value of outstanding debt.
10

Leverage Metrics(dollars in thousands)
September 30, 2021 June 30, 2021 December 31, 2020Effective Leverage: (Debt + Company's Share of Unconsolidated Joint Ventures Debt - Noncontrolling Interest Share of
Consolidated Debt + Finance Lease Liabilities) / (Total Assets + Accumulated Depreciation + Company's Share of Unconsolidated Joint Venture Gross Assets - Noncontrolling Interest Share of Consolidated Gross Assets - Investments in and Advances to Unconsolidated Joint Ventures)
29 % 32 % 32 %
Debt to Total Market Capitalization: (Debt / Total Market Capitalization as defined on page 10) 16 % 17 % 19 %
Net Debt (Debt - Cash - 1031 Escrow + Finance Lease Liabilities + Share of Joint Ventures Debt - Noncontrolling Interest Share of Consolidated Debt) to Core EBITDA, Including Share of Unconsolidated Joint Ventures:Trailing twelve months 4.5 5.3 5.2 Current quarter annualized 4.2 5.0 4.8 Proforma current quarter annualized (*) 4.3
Fixed Charge Coverage Ratio (Core EBITDA, Including Share of Unconsolidated Joint Ventures/Total Fixed Charges, as calculated on page 10):Trailing twelve months 6.2 6.0 5.6 Most recent quarter 6.8 6.1 6.2
Three months ended September
30, 2021(*) Proforma Calculations - Core EBITDA and Net Debt
Core EBITDA, including share of unconsolidated joint ventures $ 197,396 Proforma EBITDA adjustment for current quarter acquisitions and developments placed in service 3,023 (1)Remove EBITDA related to properties sold during the quarter (4,381) (2)
Proforma Core EBITDA, including share of unconsolidated joint ventures $ 196,038 x4
Annualized proforma Core EBITDA, including share of unconsolidated joint ventures $ 784,152
Total debt, excluding deferred financing costs $ 3,391,843 Finance lease liabilities 38,903 (3)Less cash (9,874) Less cash held in 1031 escrow (156,000) (4)Less noncontrolling interest share of consolidated debt (9,093) Share of unconsolidated joint ventures debt 78,603 Proforma Net Debt $ 3,334,382
Proforma Net Debt to EBITDA 4.3
Notes to Proforma Calculations:
(1) Adjustment to current quarter acquisitions and developments placed in service in order to reflect a full quarter of actual operations for such properties. (2) Adjustment to current quarter properties sold to remove the pre-sale operations of these properties from EBITDA for the quarter.
(3) Lease liabilities associated with ground leases that are classified as finance leases as of September 30, 2021. See Note 1 under Other Liabilities on page 9.
(4) Funds held in escrow for future 1031 exchange, which totaled $273 million at September 30, 2021 (page 5), are assumed to repay the line of credit balance on September 30, 2021.
11

$1,050 $4,646 $4,893
$305,155
$5,102
$534,238
$2,533,158
2021 2022 2023 2024 2025 2026 Thereafter
(1) Scheduled amortizations and maturities represent only Duke's consolidated debt obligations.
Debt MaturitiesSeptember 30, 2021
(in thousands)
Weighted Average Effective Interest
RatesMortgages (1) Unsecured (1)
Credit Facility (2)Year Amortization Maturities Amortization Maturities Total
2021 $ 1,050 $ — $ — $ — $ — $ 1,050 5.53%
2022 4,646 — — — — 4,646 5.19%
2023 4,893 — — — — 4,893 5.21%2024 5,155 — — 300,000 — 305,155 3.92%
2025 5,102 — — — — 5,102 5.08%
2026 3,238 — — 375,000 156,000 534,238 3.38%2027 1,615 — — 475,000 — 476,615 3.18%
2028 1,307 — — 500,000 — 501,307 4.45%2029 1,359 — — 400,000 — 401,359 3.96%
2030 1,413 — — 350,000 — 351,413 1.86%
2031 1,469 — — 450,000 — 451,469 1.84%Thereafter 3,261 22,734 — 325,000 — 350,995 3.26%
$ 34,508 $ 22,734 $ — $ 3,175,000 $ 156,000 $ 3,388,242 3.25%
Commitment Balance O/S @ 9/30 Maturity * Rate @ 9/30
$1,200,000 $156,000 March 2026 L + .775% (0.87%)
*Date shown is final maturity date including extension options.
Fixed and Variable Rate Weighted Average Interest
RateWeighted Average
Maturity (yrs)Components of Debt BalanceFixed Rate Secured Debt $55,942 4.66% 7.4Fixed Rate Unsecured Debt 3,175,000 3.23% 9.1Variable Rate Debt 1,300 0.09% 2.5LOC 156,000 N/A 4.5
$3,388,242 3.25% 8.9Deferred Financing Costs (36,388)
Fair Value Adjustments 3,601Total Debt per Balance Sheet $ 3,355,455
(2) Comprised of the following: Total Maturities (in thousands)
12
(3) Weighted average interest rate excludes credit facility.
(3)
(3)

Unsecured Public Debt Covenants
ThirdQuarter 2021
SecondQuarter 2021
FirstQuarter 2021
FourthQuarter 2020Debt Covenants Threshold
Total Debt to Undepreciated Assets <60% 30 % 33 % 33 % 33 %Debt Service Coverage >1.5x 8.3 7.8 7.3 7.0 Secured Debt to Undepreciated Assets <40% 0.5 % 0.5 % 0.7 % 0.7 %Undepreciated Unencumbered Assets to Unsecured Debt >150% 328 % 293 % 298 % 298 %
Note: The ratios are based upon the results of Duke Realty Limited Partnership, the partnership through which Duke Realty conducts its operations, using calculations that are defined in the indenture and applicable supplemental indentures governing such indebtedness.
Three Months Ended
Unencumbered Consolidated Assets September 30, 2021 September 30, 2020
Number of properties 458 (1) 466
Total square feet (in thousands) 136,422 (1) 138,073
Gross book value (in thousands) $9,513,358 (1) $8,782,185
Annual stabilized NOI (in thousands) $740,018 (1) $694,767
Senior Unsecured Debt Ratings:Standard & Poor's BBB+, Stable OutlookMoody's Baa1, Stable Outlook
Note: A securities rating is not a recommendation to buy, sell or hold securities and is subject to revision or withdrawal at any time by the rating organization.
(1) Excludes 25 consolidated properties under development at September 30, 2021 which will be unencumbered upon completion. These properties totaled approximately 7.3 million square feet with total anticipated stabilized project costs of approximately $1,095.2 million and anticipated stabilized NOI of approximately $65.3 million.
13

Joint Venture Debt MaturitiesSeptember 30, 2021
(in thousands)
YearScheduled
Amortization Maturities TotalWeighted Average
Interest Rate
2021 $ 10 $ — $ 10 3.55%
2022 122 — 122 3.55%
2023 126 — 126 3.55%
2024 131 — 131 3.55%
2025 135 30,750 30,885 3.25%
2026 116 47,213 47,329 1.74%
2027 — — — —
2028 — — — —
2029 — — — —
2030 — — — —
2031 — — — —
Thereafter — — — —
$ 640 $ 77,963 $ 78,603 2.34%
BalanceWeighted Average
Interest RateWeighted Average
Maturity (yrs)
Fixed Rate Secured Debt $37,125 3.30% 3.9
Fixed Rate Unsecured Debt — N/A N/A
Variable Rate Debt and LOC's 41,478 1.48% 4.9
Total $78,603 2.34% 4.5
Note: Scheduled amortization and maturities reported at Duke's share.
14

Property Occupancyas of September 30, 2021(Square feet in thousands)
Stabilized In-Service Unstabilized In-Service Total In-Service Under Development Total Portfolio
Square Feet
Percent Leased
Percent Occupied
Square Feet
Percent Leased
Percent Occupied
Number of
BuildingsSquare
FeetPercent Leased
Percent Occupied
Number of
BuildingsSquare
FeetPercent Leased
Number of Buildings
Square Feet
Percent Leased
Southern California 16,160 100.0 % 91.8 % — — — 38 16,160 100.0 % 91.8 % 11 1,964 52.0 % 49 18,124 94.8 %Chicago 14,961 98.1 % 98.1 % — — — 42 14,961 98.1 % 98.1 % 4 2,526 85.3 % 46 17,487 96.3 %Dallas 17,212 98.5 % 98.0 % — — — 45 17,212 98.5 % 98.0 % — — — 45 17,212 98.5 %Atlanta 13,044 99.7 % 99.6 % — — — 43 13,044 99.7 % 99.6 % 2 557 100.0 % 45 13,601 99.7 %Indianapolis 13,402 97.4 % 97.4 % — — — 28 13,402 97.4 % 97.4 % — — — 28 13,402 97.4 %South Florida 8,748 98.1 % 96.4 % 501 0.0 % 0.0 % 68 9,249 92.8 % 91.2 % — — — 68 9,249 92.8 %Cincinnati 9,172 94.0 % 91.9 % — — — 24 9,172 94.0 % 91.9 % — — — 24 9,172 94.0 %New Jersey 8,086 100.0 % 100.0 % — — — 21 8,086 100.0 % 100.0 % 2 484 55.2 % 23 8,570 97.5 %Savannah 7,330 96.6 % 96.6 % — — — 24 7,330 96.6 % 96.6 % 2 934 0.0 % 26 8,263 85.7 %Columbus 5,837 100.0 % 100.0 % — — — 10 5,837 100.0 % 100.0 % 2 1,157 50.3 % 12 6,994 91.8 %Houston 5,824 97.1 % 97.1 % — — — 22 5,824 97.1 % 97.1 % — — — 22 5,824 97.1 %Pennsylvania 5,685 100.0 % 100.0 % — — — 9 5,685 100.0 % 100.0 % — — — 9 5,685 100.0 %Minneapolis-St. Paul 5,143 95.5 % 95.0 % — — — 24 5,143 95.5 % 95.0 % 1 221 100.0 % 25 5,364 95.7 %Central Florida 4,332 98.0 % 97.8 % — — — 27 4,332 98.0 % 97.8 % 1 112 100.0 % 28 4,444 98.1 %Seattle 3,025 100.0 % 100.0 % 685 0.0 % 0.0 % 10 3,710 81.5 % 81.5 % — — — 10 3,710 81.5 %Nashville 3,645 97.6 % 96.9 % — — — 20 3,645 97.6 % 96.9 % — — — 20 3,645 97.6 %DC-Baltimore 3,283 98.7 % 98.7 % — — — 20 3,283 98.7 % 98.7 % — — — 20 3,283 98.7 %Northern California 2,543 100.0 % 100.0 % — — — 7 2,543 100.0 % 100.0 % 2 488 28.9 % 9 3,032 88.6 %Raleigh 2,850 100.0 % 99.6 % — — — 24 2,850 100.0 % 99.6 % — — — 24 2,850 100.0 %
Total Portfolio 150,283 98.3 % 97.1 % 1,186 0.0 % 0.0 % 506 151,469 97.6 % 96.3 % 27 8,442 59.9 % 533 159,911 95.6 %
June 30, 2021 151,655 98.2 % 97.8 % 495 0.0 % 0.0 % 514 152,150 97.9 % 97.5 % 29 11,058 48.6 % 543 163,207 94.6 %March 31, 2021 151,054 98.1 % 97.4 % 705 0.0 % 0.0 % 517 151,759 97.6 % 97.0 % 26 10,406 64.9 % 543 162,165 95.5 %December 31, 2020 151,050 98.1 % 97.7 % 928 0.0 % 0.0 % 517 151,978 97.5 % 97.1 % 17 7,444 67.0 % 534 159,422 96.0 %September 30, 2020 150,840 97.5 % 96.8 % 707 7.6 % 7.6 % 514 151,546 97.1 % 96.4 % 12 6,979 63.1 % 526 158,525 95.6 %
Note: Percentage leased represents the percentage of total square feet where leases have been executed, without regard to whether the leases have commenced.
Note: Percentage occupied represents the percentage of total square feet where the leases have commenced.
Note: Joint Ventures are included at 100%.
Note: Excludes remaining non-core properties referenced on page 1.
15

Non-GAAP Reconciliations - PNOI and SPNOI(unaudited and in thousands)
Three Months Ended Nine Months EndedSeptember 30, 2021 September 30, 2021
Non-GAAP Reconciliation of PNOI Net Income Attributable to Common Shareholders (Page 6) $ 494,817 $ 749,996 Adjustments related to Nareit FFO Attributable to Common Shareholders - Diluted (339,333) (286,196) Nareit FFO Attributable to Common Shareholders - Diluted (Pages 7-8) $ 155,484 $ 463,800 Adjustments related to Core FFO Attributable to Common Shareholders - Diluted 20,690 28,524 Core FFO Attributable to Common Shareholders - Diluted (Pages 7-8) $ 176,174 $ 492,324
Add back: Interest expense, continuing operations 20,003 63,582 Add back: non-real estate asset related depreciation 548 1,701 Less: FFO attributable to unconsolidated joint ventures (5,405) (16,810) Add: Company's share of unconsolidated joint venture EBITDAre (Page 10) 5,782 18,199 Adjustments related to noncontrolling interest share of consolidated joint ventures 294 966
Core EBITDA (Page 10) $ 197,396 $ 559,962 General contractor and service fee revenue, net of related expenses (4,510) (9,815) General and administrative expense, excluding severance/restructuring 10,689 50,785 Non-real estate asset related depreciation (548) (1,701) Other operating expenses 1,290 2,773 Company's share of unconsolidated joint venture EBITDAre (5,782) (18,199) Noncontrolling interest share of consolidated joint venture EBITDA (25) (192) Interest and other income (1,433) (3,569) Revenues not allocable to operating segments (114) (295) Rental expenses and real estate taxes not allocable to operating segments (58) (124) Other adjustments (1) (11,804) (30,936)
PNOI, continuing operations, before joint ventures 185,101 548,689 Less noncontrolling interest share of consolidated joint venture PNOI (315) (921) Plus share of unconsolidated joint venture PNOI 5,965 16,827
PNOI, continuing operations, including share of joint ventures 190,751 564,595 PNOI of sold assets not in discontinued operations (2) (4,014) (24,429) Proforma PNOI adjustments (3) 1,514 3,612
Proforma PNOI (Page 17) $ 188,251 $ 543,778
Non-GAAP Reconciliation of SPNOI - CashIncome from continuing operations before income taxes (Page 6) $ 506,146 $ 772,862
Share of SPNOI from unconsolidated joint ventures 5,503 16,851 PNOI excluded from the "same property" population (25,943) (65,376) Earnings from Service Operations (4,510) (9,815) Rental Operations revenues and expenses excluded from PNOI (15,818) (55,365) Non-Segment Items (304,731) (183,422)
SPNOI - Cash (Page 19) $ 160,647 $ 475,735
(1) Represents adjustments for straight line rental income (net of collectability reserves) and expense, amortization of above and below market rents, amortization of lease concessions (net of reserve adjustment), intercompany rents and termination fees.(2) Represents all other sold properties that did not meet the criteria to be included in discontinued operations.(3) PNOI is adjusted to reflect a full quarter of operations for properties that were placed in service or acquired during the quarter.
16

Non-GAAP Reconciliation - PNOI(unaudited and in thousands)
Three Months Ended September 30, 2021
Wholly Owned and Joint Venture In-Service Logistics Portfolio: Rental revenues from continuing operations $ 255,315 (1) Rental and real estate tax expenses from continuing operations (59,492) (2) Less: Straight line rental income and expense (8,490) Other adjustments (3,350) (3) PNOI, continuing operations, before joint ventures 183,983 Less: noncontrolling interest share of consolidated joint venture PNOI (266) Share of unconsolidated joint venture PNOI 5,965 PNOI, adjusted for joint ventures 189,682 Less: PNOI from sold properties (not in discontinued operations) (4,014) Proforma property level NOI adjustments 1,514 (4)Proforma PNOI- Total In-Service Logistics Portfolio $ 187,182
PNOI- In-Service Non-Core assets 1,002 PNOI- Other real estate investments not valued by income capitalization (pages 9 and 27) 67
Total Proforma PNOI $ 188,251
Logistics PNOI in NAV Components (page 27): Proforma PNOI- Total In-Service (as shown above) $ 187,182 Adjustment to exclude PNOI from Held for Sale Properties (proceeds included on page 27) (345) Adjustment to exclude negative PNOI related to "Stabilized Properties - Economic" 535 (5) Adjustment to exclude negative PNOI from "Stabilized Properties - Pre-Economic" 97 (6) Adjustment to exclude Unstabilized In-Service Properties 127 (7)
Total Stabilized Operating Portfolio Generating Positive NOI (market detail page 18; NAV page 27) $ 187,596
Note: NOI information is for the most recently completed three month period and includes only wholly owned and joint venture in-service properties at the end of the reporting period. Joint venture property NOI is shown at economic ownership percentage.
(1) Rental revenues from continuing operations as included in the segment reporting disclosures in the notes to our consolidated financial statements. Revenues not allocated to reportable segments, which are not included above, totaled $114 for the three months ended September 30, 2021.
(2) Rental and real estate taxes as used in the computation of PNOI from the segment reporting disclosures in the notes to our consolidated financial statements. Rental expenses and real estate taxes not allocated to reportable segments, which are not included above, totaled ($58) for the three months ended September 30, 2021.
(3) Represents adjustments to add back intercompany rents and to remove the amortization of above and below market rents, amortization of lease concessions, lease termination fees and PNOI from other real estate investments not valued by income capitalization.
(4) NOI is adjusted to reflect a full quarter of operations for properties that were placed in service or acquired during the quarter.
(5) These properties are included in NAV Components on page 27 in the Real Estate Not Valued by Income Capitalization section at their total gross book basis of $41,212 as of the current quarter ended.
(6) These properties are included in NAV Components on page 27 at an estimated stabilized PNOI amount in the Real Estate Properties Valued by Income Capitalization section.
(7) These unstabilized in-service properties which have been in-service less than one year are included in NAV Components on page 27 at an estimated stabilized PNOI amount in the Real Estate Properties Valued by Income Capitalization section.
17

PNOI and Occupancy Metrics(dollars and SF in thousands and shown at economic ownership %)
MarketNOI at Economic
Ownership % % of NOI
Square Feet at Economic
Ownership %
3-Month Avg. PercentageOccupied
Ending Percentage Occupied
Ending Percentage
LeasedSouthern California $ 23,437 12.5 % 14,666 99.7 % 99.2 % 100.0 %New Jersey 19,087 10.2 % 8,086 100.0 % 100.0 % 100.0 %South Florida 17,711 9.5 % 8,458 98.0 % 97.0 % 98.9 %Chicago 14,972 8.0 % 14,095 97.6 % 98.0 % 98.0 %Dallas 14,084 7.5 % 13,756 98.5 % 98.8 % 99.0 %Atlanta 13,390 7.1 % 12,803 99.0 % 99.5 % 99.7 %Indianapolis 10,485 5.6 % 11,373 98.8 % 98.0 % 98.1 %Cincinnati 7,913 4.2 % 8,269 96.7 % 98.4 % 98.4 %Savannah 7,862 4.2 % 7,080 100.0 % 100.0 % 100.0 %Pennsylvania 7,541 4.0 % 5,270 100.0 % 100.0 % 100.0 %Houston 7,382 3.9 % 5,824 97.1 % 97.1 % 97.1 %Minneapolis-St. Paul 6,972 3.7 % 4,986 97.6 % 98.0 % 98.5 %Central Florida 6,746 3.6 % 4,332 99.0 % 98.0 % 98.0 %Seattle 5,878 3.1 % 3,025 100.0 % 100.0 % 100.0 %Nashville 5,357 2.9 % 3,645 96.6 % 96.9 % 97.7 %Columbus 5,029 2.7 % 5,837 100.0 % 100.0 % 100.0 %
Raleigh 4,851 2.6 % 2,850 99.6 % 99.6 % 100.0 %Northern California 4,532 2.4 % 2,333 100.0 % 100.0 % 100.0 %DC / Baltimore 4,367 2.3 % 2,191 98.1 % 98.1 % 98.1 %
Total $ 187,596 100.0 % 138,879 98.7 % 98.8 % 99.0 %
Note: NOI from one property classified as held for sale at September 30, 2021 is excluded from the table above (proceeds disclosed on page 27). NOI from the three properties to be contributed as part of Tranche 3 of the newly formed CBREGI joint venture is fully included in the table above (see page 9 for additional information).
Note: This schedule provides supplemental information for the stabilized logistics properties generating positive NOI for the three months ended September 30, 2021 as shown on page 17.
Note: Percentage occupied represents the percentage of total square feet where the leases have commenced.
Note: Percentage leased represents the percentage of total square feet where the leases have been executed, without regard to whether the leases have commenced.
18
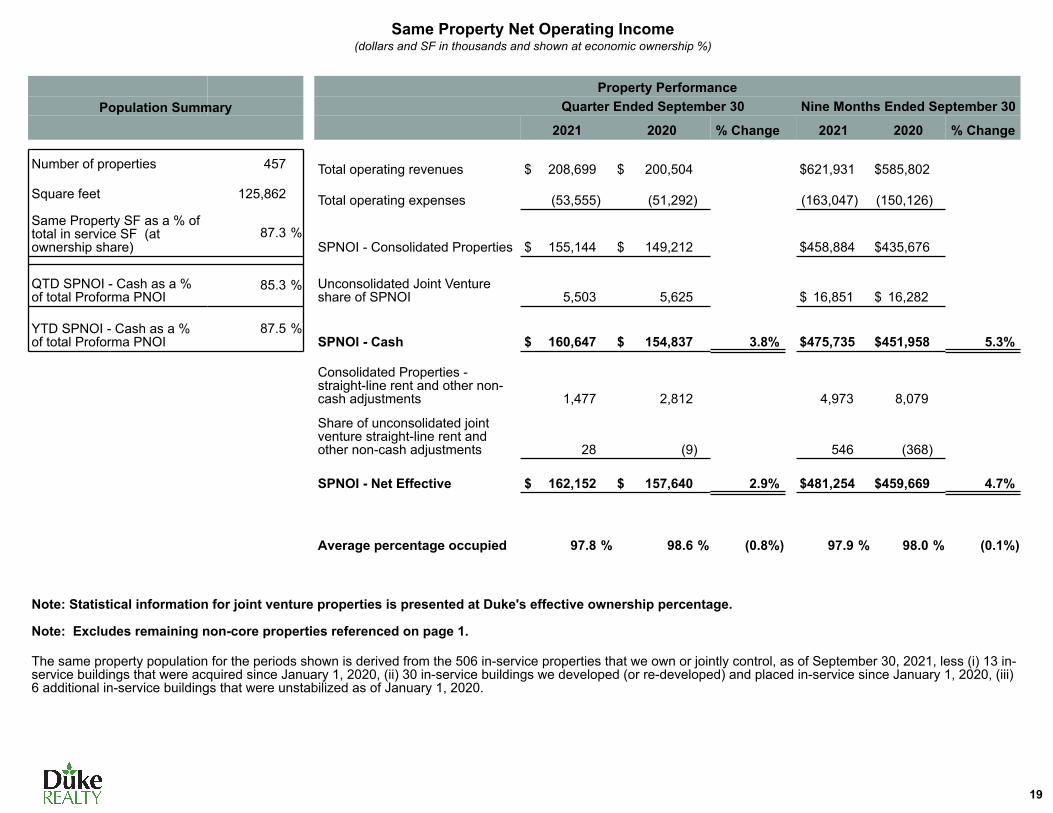
Same Property Net Operating Income(dollars and SF in thousands and shown at economic ownership %)
Population SummaryProperty Performance
Quarter Ended September 30 Nine Months Ended September 30
2021 2020 % Change 2021 2020 % Change
Number of properties 457 Total operating revenues $ 208,699 $ 200,504 $ 621,931 $ 585,802
Square feet 125,862 Total operating expenses (53,555) (51,292) (163,047) (150,126) Same Property SF as a % of total in service SF (at ownership share)
87.3 %SPNOI - Consolidated Properties $ 155,144 $ 149,212 $ 458,884 $ 435,676
QTD SPNOI - Cash as a % of total Proforma PNOI
85.3 % Unconsolidated Joint Venture share of SPNOI 5,503 5,625 $ 16,851 $ 16,282
YTD SPNOI - Cash as a % of total Proforma PNOI
87.5 %SPNOI - Cash $ 160,647 $ 154,837 3.8% $ 475,735 $ 451,958 5.3%
Consolidated Properties - straight-line rent and other non-cash adjustments 1,477 2,812 4,973 8,079
Share of unconsolidated joint venture straight-line rent and other non-cash adjustments 28 (9) 546 (368)
SPNOI - Net Effective $ 162,152 $ 157,640 2.9% $ 481,254 $ 459,669 4.7%
Average percentage occupied 97.8 % 98.6 % (0.8%) 97.9 % 98.0 % (0.1%)
Note: Statistical information for joint venture properties is presented at Duke's effective ownership percentage.
Note: Excludes remaining non-core properties referenced on page 1.
The same property population for the periods shown is derived from the 506 in-service properties that we own or jointly control, as of September 30, 2021, less (i) 13 in-service buildings that were acquired since January 1, 2020, (ii) 30 in-service buildings we developed (or re-developed) and placed in-service since January 1, 2020, (iii) 6 additional in-service buildings that were unstabilized as of January 1, 2020.
19

Lease ExpirationsIn-Service Properties as of September 30, 2021
(dollars and square feet in thousands)
Wholly Owned Joint Venture Total In-Service Portfolio
Square FeetAvg. Annual Rental
Revenue (1) Square FeetAvg. Annual Rental
Revenue (1) Square FeetAvg. Annual Rental
Revenue (1)Year of Expiration2021 1,621 $7,865 — — 1,621 $7,8652022 13,238 57,088 299 1,236 13,537 58,324 2023 14,968 75,502 434 1,883 15,402 77,385 2024 15,002 78,835 542 2,711 15,544 81,546 2025 14,903 83,984 388 1,883 15,291 85,867 2026 16,495 85,727 510 2,368 17,005 88,095 2027 13,973 72,783 274 1,428 14,247 74,211 2028 10,287 64,992 414 1,784 10,701 66,776 2029 7,172 38,739 1,273 5,104 8,445 43,843 2030 7,265 41,677 348 1,747 7,613 43,424
2031 and Thereafter 20,438 154,891 907 4,204 21,345 159,095 135,362 $762,083 5,389 $24,348 140,751 $786,431
Total Square Feet 138,534 5,650 144,184 Percent Leased 97.7 % 95.4 % 97.6 %Average Remaining Lease Term (by SF) 5.4 6.3 5.5 Average Remaining Lease Term (by ANLV) 6.0 6.3 6.0
Note: Joint Venture square feet and dollars shown at the Company's economic ownership percentage.
Note: Excludes remaining non-core properties referenced on page 1.(1) Annualized rental revenue represents average annual base rental payments, on a straight-line basis for the term of each lease, from space leased to tenants at the end of the most recent reporting period. Annualized rental revenue excludes amounts paid by tenants as reimbursement for operating expenses and real estate taxes.
% of Expiring Leases: Total In-Service Portfolio
1%
10% 11% 11% 11% 12%10%
8%6% 5%
15%
1%
7%10% 10% 11% 11% 10%
8%6% 6%
20%
% of Leased Square Feet % of Annualized Rental Revenue
2021 2022 2023 2024 2025 2026 2027 2028 2029 2030 Thereafter
20

Leasing Activityas of September 30, 2021
Second Generation
First Generation Square Feet
Short-Term or HFS Leases Square Feet
(a)
Early Renewals
Square Feet (b)
Square Feet
Average Term in Years
Average Net Effective
Rent
Average Capital
Expenditures per SF
Average Capital
Expenditures per SF per Year
Average NER
Growth
Cash Rent
Growth
Total Leasing
Square Feet
Year Ended 2020New leases 8,941,018 2,009,448 — 5,324,333 5.2 $ 6.27 $ 4.49 $ 0.86 16,274,799 Renewal leases — 2,349,136 2,739,704 7,288,944 4.6 5.58 2.49 0.54 12,377,784 Total 8,941,018 4,358,584 2,739,704 12,613,277 4.9 $ 5.87 $ 3.34 $ 0.68 28.8% 13.8% 28,652,583
1st Quarter 2021New leases 2,917,845 49,885 — 1,252,805 7.3 $ 4.95 $ 4.95 $ 0.68 4,220,535 Renewal leases — 344,516 136,240 2,737,412 4.7 5.68 1.94 0.42 3,218,168 Total 2,917,845 394,401 136,240 3,990,217 5.5 $ 5.44 $ 2.95 $ 0.54 26.2% 11.4% 7,438,703
2nd Quarter 2021New leases 330,535 168,540 — 1,437,700 4.3 $ 6.98 $ 4.07 $ 0.95 1,936,775 Renewal leases — 1,349,049 907,863 3,443,785 6.6 6.54 2.84 0.43 5,700,697 Total 330,535 1,517,589 907,863 4,881,485 5.9 $ 6.67 $ 3.20 $ 0.54 36.2% 19.2% 7,637,472
3rd Quarter 2021New leases 3,656,731 200,076 1,268,748 4.5 $ 6.59 $ 4.95 $ 1.11 5,125,555 Renewal leases — 283,397 1,125,691 2,978,862 5.3 5.75 2.79 0.52 4,387,950 Total 3,656,731 483,473 1,125,691 4,247,610 5.1 $ 5.98 $ 3.38 $ 0.66 34.8% 21.9% 9,513,505
Year to Date 2021New leases 6,905,111 418,501 — 3,959,253 5.3 $ 6.19 $ 4.62 $ 0.87 11,282,865 Renewal leases — 1,976,962 2,169,794 9,160,059 5.6 6.03 2.57 0.46 13,306,815 Total 6,905,111 2,395,463 2,169,794 13,119,312 5.5 $ 6.08 $ 3.18 $ 0.58 33.0% 17.9% 24,589,680
(a) Short-Term Leases include both new leases and renewals which have lease terms less than 12 months or were part of the held for sale portfolio.(b) Early Renewals represent renewals signed in which the renewal commencement date is greater than two years from the month of signing with no changes to the economics of the remaining term of the original lease.
Note: Activity is based on leases signed during the period and excludes non-core properties referenced on page 1.Note: All leasing square feet is shown at 100%.
Note: 2021 joint venture leasing metrics are included at ownership share for economic metrics: Net Effective Rent, CapEx, and both Average NER and Cash Rent Growth.
% Re-
leas
ed
Percent Renewed and Effective Percentage Re-Leased82.9% 94.1% 93.9% 86.2% 91.2%
69.5% 85.0% 77.5% 71.5% 77.4%
Leases Renewed (1)Expiring Leases Immediately Backfilled (2)
2020 Q1 2021 Q2 2021 Q3 2021 YTD 2021
(1) Percentage renewed is calculated by dividing the square feet of leases renewed by the square feet of leases up for renewal. The square feet of leases up for renewal is defined as the square feet of leases renewed plus the square feet of space vacated due to lease expirations.
(2) Represents the additional percentage of leases which were re-leased during the same quarter in which the prior lease expired.
Note: Percent renewed and effective percentage re-leased metrics exclude short-term leases and early renewals shown in the table above.
21

Land Held for DevelopmentSeptember 30, 2021
Potential BookNet Development Basis
Market Acres Square Feet (000s)
Undeveloped
Southern California 127 2,716,000
Northern California 41 828,000
Dallas 24 653,000
(1) Indianapolis 22 373,000
Chicago 24 348,000
Atlanta 26 343,000
Seattle 12 261,000
South Florida 9 149,000
Total Undeveloped 285 5,671,000 $333,398
Other Real Estate Investments (2)
Northern California 10 220,000
South Florida 10 149,000 Total Other Real Estate Investments 20 369,000 $36,480
(1) Includes 50% share of development land owned in joint ventures as disclosed on page 25.
(2) Consists of underutilized in-fill sites, which may have had buildings/structures on site when we acquired them, that are either (i) under lease to a third party and, after the lease ends, are expected to be redeveloped or will require significant capital expenditures before re-leasing; or (ii) industrial/logistics properties that we intend to re-lease after significant retrofitting and/or environmental remediation is completed.
(3) Based on Book Basis and includes undeveloped and other real estate investments combined.
Purchase/Development Options
Approximately 575 acres and 13 acres which can support the development of 10 million square feet and 330,000 square feet, respectively, of future development are controlled via purchase options in Columbus, Ohio, and Southern California, respectively. These acres and square feet are disclosed at ownership percentage, and are not included in either table of owned land above.
Book Basis GeographicConcentration (3)
97%
2% 1%
Coastal Tier 1 marketsNon-Coastal Tier 1 marketsOther major markets
22
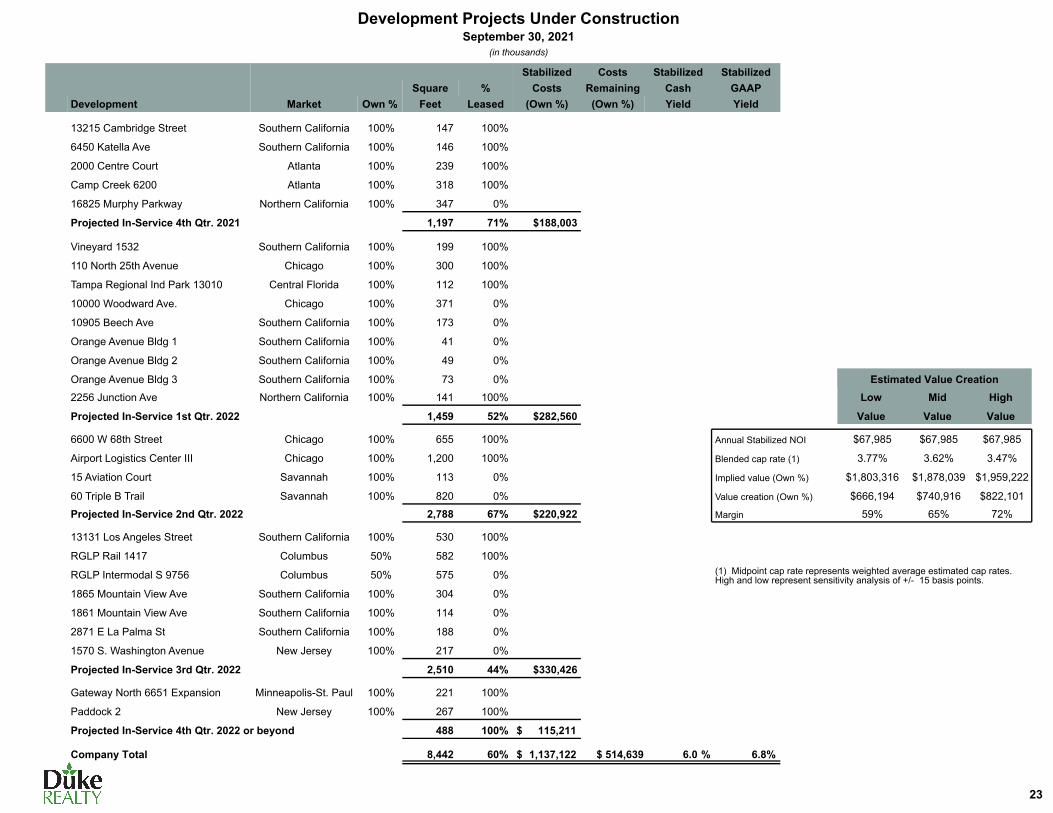
Development Projects Under ConstructionSeptember 30, 2021
(in thousands)
Stabilized Costs Stabilized StabilizedSquare % Costs Remaining Cash GAAP
Development Market Own % Feet Leased (Own %) (Own %) Yield Yield
13215 Cambridge Street Southern California 100% 147 100%
6450 Katella Ave Southern California 100% 146 100%
2000 Centre Court Atlanta 100% 239 100%
Camp Creek 6200 Atlanta 100% 318 100%
16825 Murphy Parkway Northern California 100% 347 0%
Projected In-Service 4th Qtr. 2021 1,197 71% $188,003
Vineyard 1532 Southern California 100% 199 100%
110 North 25th Avenue Chicago 100% 300 100%
Tampa Regional Ind Park 13010 Central Florida 100% 112 100%
10000 Woodward Ave. Chicago 100% 371 0%
10905 Beech Ave Southern California 100% 173 0%
Orange Avenue Bldg 1 Southern California 100% 41 0%
Orange Avenue Bldg 2 Southern California 100% 49 0%
Orange Avenue Bldg 3 Southern California 100% 73 0% Estimated Value Creation2256 Junction Ave Northern California 100% 141 100% Low Mid High
Projected In-Service 1st Qtr. 2022 1,459 52% $282,560 Value Value Value
6600 W 68th Street Chicago 100% 655 100% Annual Stabilized NOI $67,985 $67,985 $67,985
Airport Logistics Center III Chicago 100% 1,200 100% Blended cap rate (1) 3.77% 3.62% 3.47%
15 Aviation Court Savannah 100% 113 0% Implied value (Own %) $1,803,316 $1,878,039 $1,959,222
60 Triple B Trail Savannah 100% 820 0% Value creation (Own %) $666,194 $740,916 $822,101
Projected In-Service 2nd Qtr. 2022 2,788 67% $220,922 Margin 59% 65% 72%
13131 Los Angeles Street Southern California 100% 530 100%
RGLP Rail 1417 Columbus 50% 582 100%
RGLP Intermodal S 9756 Columbus 50% 575 0% (1) Midpoint cap rate represents weighted average estimated cap rates. High and low represent sensitivity analysis of +/- 15 basis points.
1865 Mountain View Ave Southern California 100% 304 0%
1861 Mountain View Ave Southern California 100% 114 0%
2871 E La Palma St Southern California 100% 188 0%
1570 S. Washington Avenue New Jersey 100% 217 0%
Projected In-Service 3rd Qtr. 2022 2,510 44% $330,426
Gateway North 6651 Expansion Minneapolis-St. Paul 100% 221 100%
Paddock 2 New Jersey 100% 267 100%
Projected In-Service 4th Qtr. 2022 or beyond 488 100% $ 115,211
Company Total 8,442 60% $ 1,137,122 $ 514,639 6.0 % 6.8%
23
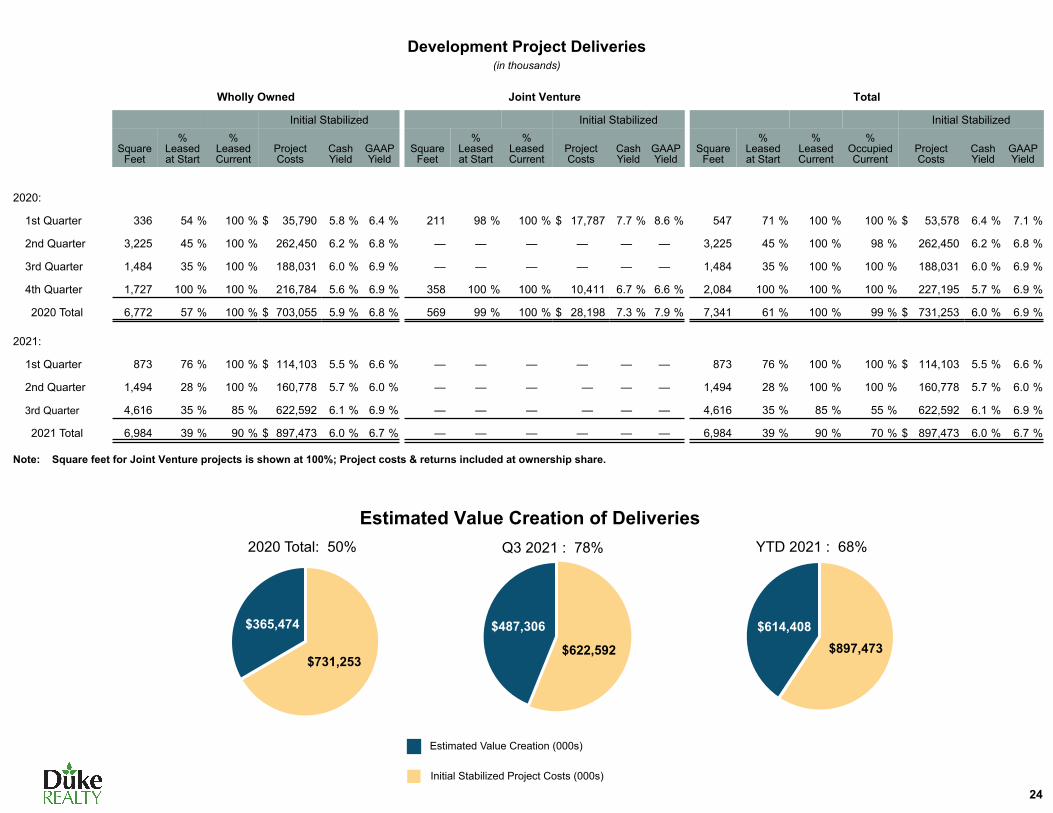
Development Project Deliveries(in thousands)
Wholly Owned Joint Venture Total
Initial Stabilized Initial Stabilized Initial Stabilized
Square Feet
% Leased at Start
% Leased Current
Project Costs
Cash Yield
GAAP Yield
Square Feet
% Leased at Start
% Leased Current
Project Costs
Cash Yield
GAAP Yield
Square Feet
% Leased at Start
% Leased Current
% Occupied Current
Project Costs
Cash Yield
GAAP Yield
2020:
1st Quarter 336 54 % 100 % $ 35,790 5.8 % 6.4 % 211 98 % 100 % $ 17,787 7.7 % 8.6 % 547 71 % 100 % 100 % $ 53,578 6.4 % 7.1 %
2nd Quarter 3,225 45 % 100 % 262,450 6.2 % 6.8 % — — — — — — 3,225 45 % 100 % 98 % 262,450 6.2 % 6.8 %
3rd Quarter 1,484 35 % 100 % 188,031 6.0 % 6.9 % — — — — — — 1,484 35 % 100 % 100 % 188,031 6.0 % 6.9 %
4th Quarter 1,727 100 % 100 % 216,784 5.6 % 6.9 % 358 100 % 100 % 10,411 6.7 % 6.6 % 2,084 100 % 100 % 100 % 227,195 5.7 % 6.9 %
2020 Total 6,772 57 % 100 % $ 703,055 5.9 % 6.8 % 569 99 % 100 % $ 28,198 7.3 % 7.9 % 7,341 61 % 100 % 99 % $ 731,253 6.0 % 6.9 %
2021:
1st Quarter 873 76 % 100 % $ 114,103 5.5 % 6.6 % — — — — — — 873 76 % 100 % 100 % $ 114,103 5.5 % 6.6 %
2nd Quarter 1,494 28 % 100 % 160,778 5.7 % 6.0 % — — — — — — 1,494 28 % 100 % 100 % 160,778 5.7 % 6.0 %
3rd Quarter 4,616 35 % 85 % 622,592 6.1 % 6.9 % — — — — — — 4,616 35 % 85 % 55 % 622,592 6.1 % 6.9 %
2021 Total 6,984 39 % 90 % $ 897,473 6.0 % 6.7 % — — — — — — 6,984 39 % 90 % 70 % $ 897,473 6.0 % 6.7 %
Note: Square feet for Joint Venture projects is shown at 100%; Project costs & returns included at ownership share.
$731,253
$365,474
2020 Total: 50%
Estimated Value Creation of Deliveries
$622,592
$487,306
Initial Stabilized Project Costs (000s)
Estimated Value Creation (000s)
Q3 2021 : 78%
24
$897,473$614,408
YTD 2021 : 68%
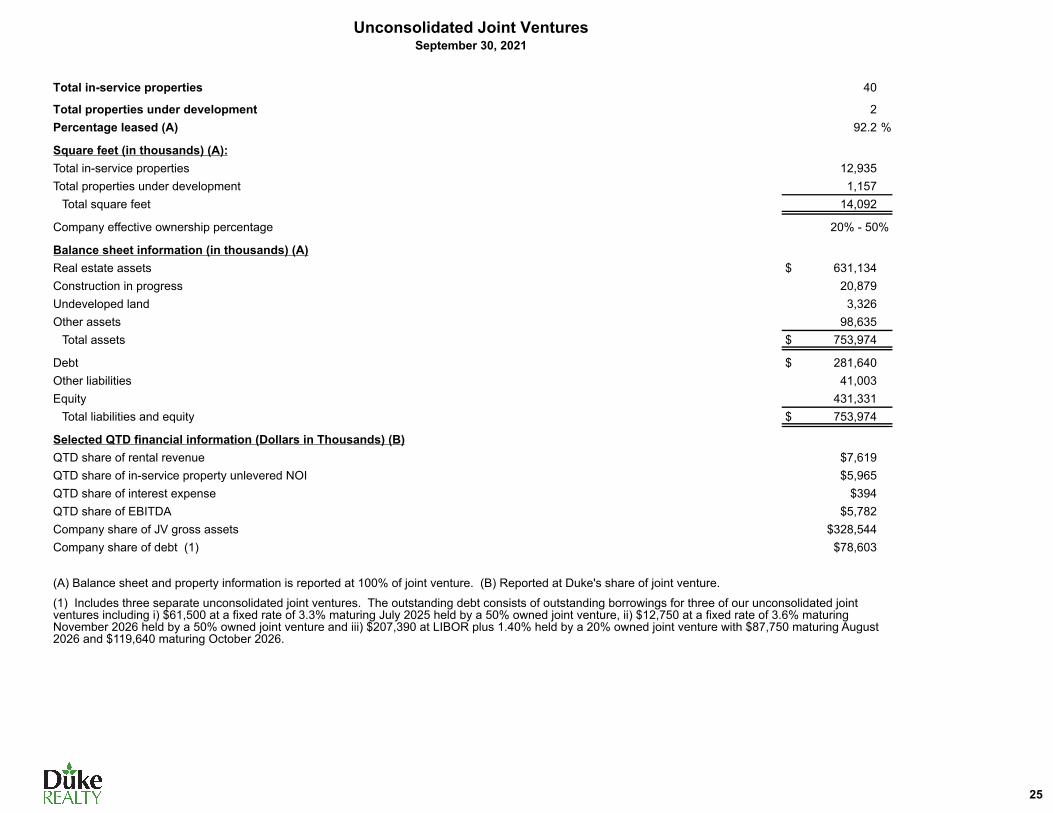
Unconsolidated Joint VenturesSeptember 30, 2021
Total in-service properties 40
Total properties under development 2 Percentage leased (A) 92.2 %
Square feet (in thousands) (A):Total in-service properties 12,935 Total properties under development 1,157
Total square feet 14,092
Company effective ownership percentage 20% - 50%
Balance sheet information (in thousands) (A)Real estate assets $ 631,134 Construction in progress 20,879 Undeveloped land 3,326 Other assets 98,635
Total assets $ 753,974
Debt $ 281,640 Other liabilities 41,003 Equity 431,331
Total liabilities and equity $ 753,974
Selected QTD financial information (Dollars in Thousands) (B)QTD share of rental revenue $7,619 QTD share of in-service property unlevered NOI $5,965 QTD share of interest expense $394 QTD share of EBITDA $5,782 Company share of JV gross assets $328,544 Company share of debt (1) $78,603
(A) Balance sheet and property information is reported at 100% of joint venture. (B) Reported at Duke's share of joint venture.
(1) Includes three separate unconsolidated joint ventures. The outstanding debt consists of outstanding borrowings for three of our unconsolidated joint ventures including i) $61,500 at a fixed rate of 3.3% maturing July 2025 held by a 50% owned joint venture, ii) $12,750 at a fixed rate of 3.6% maturing November 2026 held by a 50% owned joint venture and iii) $207,390 at LIBOR plus 1.40% held by a 20% owned joint venture with $87,750 maturing August 2026 and $119,640 maturing October 2026.
25

Dispositions and Acquisitions(in thousands)
Dispositions Acquisitions
Square Feet
Sales In-Place In-PlaceSquare
Feet
In-Place Acquisition In-Place Stabilized Stabilized CurrentProceeds Cap Rate % Leased % Leased Cost Yield Acquisition Acquisition % Leased
(1) (2) (2) (2) (3) Cost Yield (2)
2020
1st Quarter 540 $ 27,450 6.4% 100.0 % — — $ — — $ — — —
2nd Quarter — — — — — — — — — — —
3rd Quarter 280 18,450 5.0% 100.0 % 680 100.0 % 112,068 4.6 % 118,601 4.8 % 100.0 %
4th Quarter 3,530 275,900 3.5% 72.3 % 1,877 74.0 % 298,749 2.8 % 304,825 4.3 % 73.6 %
2020 Total 4,350 $ 321,800 3.8 % 77.5 % 2,557 81.0 % $ 410,817 3.3 % $ 423,426 4.4 % 80.6 %
2021
1st Quarter 1,127 $ 94,189 4.5% 100.0 % 680 100.0 % $ 51,447 5.2 % $ 51,648 5.2 % 100.0 %
2nd Quarter 1,331 182,750 4.2% 100.0 % 766 100.0 % 260,257 2.9 % 302,527 4.4 % 100.0 % (4)
3rd Quarter 7,456 738,220 4.8% 100.0 % 63 100.0 % 24,372 3.1 % 25,004 3.7 % 100.0 %
2021 Total YTD 9,914 $ 1,015,159 4.7 % 100.0 % 1,509 100.0 % $ 336,076 3.3 % $ 379,179 4.5 % 100.0 % (4)
Note: Joint venture properties are included at ownership share for all figures for both Dispositions and Acquisitions.
(1) Joint venture sales included at our ownership share and include any applicable preferred returns.
(2) Percentage leased represents the percentage of square feet where leases have been executed, without regard to whether the leases have commenced. In-Place figures for dispositions are as of the date of sale and as of the date of acquisition for acquisitions. Current figures represent the percent leased as of the current period ended.
(3) Includes real estate assets and net acquired lease-related intangible assets but excludes assumed debt and other acquired working capital assets and liabilities.
(4) Second quarter and YTD 2021 costs and returns include acquisition economics of a container yard adjacent to the Port of Newark. No square feet is included for the acquisition.
26

Components of Net Asset ValueSeptember 30, 2021(unaudited and in thousands)
Real Estate Properties Valued by Income Capitalization - Current Quarter Services Operations Net Income
Total stabilized properties generating positive NOI (page 18), (A) $ 187,596 Mid-Point of 2021 Full Year Guidance $ 12,000
Stabilized Properties - Future Additional PNOI Other Assets
Commenced Leases in Free Rent Period $ 4,865 Signed Leases Not Commenced for Entire Period 4,999 Cash (2) $ 9,874 Total Embedded PNOI $ 9,864 Restricted Cash Held for Like-Kind Exchange (2) 273,413 Estimated PNOI from remaining lease-up of "Stabilized Properties - Pre-Economic" 415 Accounts Receivable and Construction Receivables (2) 108,487 Additional PNOI - Stabilized Properties (A) $ 10,279 Notes Receivable (4) 81,991
Prepaid Expense and Other Assets (4) 150,880 Total Stabilized PNOI - Sum of (A) above $ 197,875 Subtotal Other Assets $ 624,645
Unstabilized Properties - Estimated PNOI upon Stabilization $ 2,185 Liabilities Total Debt, excluding deferred financing costs (page 11) $ 3,391,843
Non-Core Real Estate NOI $ 1,002 Share of JV Debt (page 25) 78,603 Other Tangible Liabilities (5) 436,103 Total Liabilities $3,906,549
Real Estate Not Valued Above by Income Capitalization Outstanding Shares and Share EquivalentsCommon Shares Outstanding (page 10) 380,717
Gross book value of "Stabilized Properties - Economic" with negative NOI (page 17) $ 141,406 Partnership Units Outstanding (page 10) 3,755 Other Potentially Dilutive Securities (page 8) 1,786
Estimated Proceeds from Property Sales (1) $ 78,901 386,258
Development and Land Notes Wholly Owned CIP (2) $ 617,887 (1) Consists of proceeds from a 517 square foot, 100% leased, property in Columbus that was sold in
early October.
The expected proceeds from the third tranche of properties to be contributed to a newly formed joint venture (see further information on page 8) are not included herein and the NOI from those properties is included in the section above titled "Real Estate Properties Value by Income Capitalization - Current Quarter".
Share of JV CIP 10,439 Estimated Development Value Creation at Own % (page 23) 740,916 Other Real Estate Assets (3) 36,480 Wholly Owned Development Land (2) 331,293 (2) As shown on Balance Sheets (page 5).
Share of JV Land 1,663 (3) Book value of "other real estate assets" as described on page 9.
$ 1,738,678 (4) "Notes receivable" and "Prepaid expenses and other assets", as shown on the Other Assets section on page 9.
(5) Consists of construction payables, accrued real estate taxes, accrued interest and tenant security deposits (all as separately presented on the Balance Sheets on page 5) plus "operating accruals" and "costs to complete and other cash obligations" as shown on the Other Liabilities section on page 9.
27

28
2021 Range of Estimates
(dollars in millions except per share amounts) Metrics
2020 2021 Range of Estimates Key Assumptions Actual YTD Pessimistic Optimistic
Net Income per Share Attributable to Common Shareholders - Diluted
$0.80 $1.98 $2.15 $2.29 – Previous guidance in a range of $2.13 to $2.39 per share.– Higher gains on property sales in 2021 compared to 2020.
Nareit FFO per Share Attributable to Common Shareholders - Diluted
$1.40 $1.21 $1.62 $1.68 – Quicker lease-up of new developments. – Less impact from debt transactions in 2021 compared to 2020.– Expense impact of internal leasing costs, $0.03 to $0.04.
Core FFO per Share Attributable to Common Shareholders - Diluted
$1.52 $1.29 $1.71 $1.75 – Previous guidance in a range of $1.69 to $1.73 per share.– Quicker lease-up of new developments.– Lower bad debt expense than previous estimates.– Strong rent growth.
Growth in AFFO - Share Adjusted 6.2% 9.4% 10.1% 13.0% – Driven by same factors impacting Core FFO.
Average Percentage Leased(stabilized portfolio)
97.6% 98.2% 98.1% 98.5% – Previous guidance in a range of 97.8% to 98.6%. – Demand exceeding previous estimates.– Less downtime from troubled tenant move-outs than previous
estimates.Average Percentage Leased(In-service portfolio)
97.0% 97.7% 97.5% 97.9% – Previous guidance in a range of 97.1% to 97.9%.– Driven by same factors impacting stabilized portfolio. – Quicker leasing of speculative development.
Same Property NOI - Cash 5.0% 5.3% 5.0% 5.4% – Previous guidance in a range of 4.75% to 5.25%.– Increased occupancy from previous estimates.– Continued strong rent growth, embedded lease escalations.
Same Property NOI - Net Effective 2.8% 4.7% 4.0% 4.4% – Previous guidance in a range of 3.75% to 4.25%.– Less downtime from troubled tenant move-outs than previous
estimates.– Lower straight-line rent bad debt than 2020.
Building Acquisitions(Duke share)
$411 $336 $450 $550 – Previous guidance in a range of $350 to $550.– Coastal markets focus.
Building Dispositions(Duke share)
$322 $1,015 $1,000 $1,200 – Better pricing than previous estimates.– Manage tenant concentration.
Development Starts(JVs at 100%)
$796 $960 $1,300 $1,450 – Previous guidance in a range of $1,100 to $1,300.– Leasing success driving speculative activity.
Service Operations Income $6 $10 $11 $13 – Previous guidance in a range of $9 to $11.– Third party development.
General & Administrative Expense $58 $51 $67 $63 – Previous guidance in a range of $65 to $61.– Compensation commensurate with performance.– Excludes overhead restructuring costs.
Effective Leverage (Gross Book Basis) 32% 29% 33% 29%Fixed Charge Coverage (TTM) 5.6X 6.2X 5.8X 6.2X
Net Debt to Core EBITDA (TTM) 5.2X 4.5X 5.2X 4.8X - Maintain Baa1/BBB+ ratings.