duncan faulkner - scottish hydrological group. faulkner... · flood and runoff estimation on small...
TRANSCRIPT
Flood and runoff estimation on small catchments
Duncan Faulkner

Flood and runoff estimation on small catchments
Duncan Faulkner and…
Oliver Francis, Rob Lamb (JBA)
Thomas Kjeldsen, Lisa Stewart, John Packman (CEH)
Funding from JBA, EA and CEH

Flood and runoff estimation on small catchments
Duncan Faulkner and…
Oliver Francis, Rob Lamb (JBA)
Thomas Kjeldsen, Lisa Stewart, John Packman (CEH)
Funding from JBA, EA and CEH
Initial results published in Journal of Flood Risk
Management: Faulkner et al. (2011)

Contents
• Why talk about small catchments?
• Sources of data
• Methods available
• Tests and results
• Plot-scale runoff
• Next phase of research
4

5
Why talk about small catchments?

What is a small catchment?
6

How low can you go?
7

What about brownfield sites?
8

And after the builders move in…
9
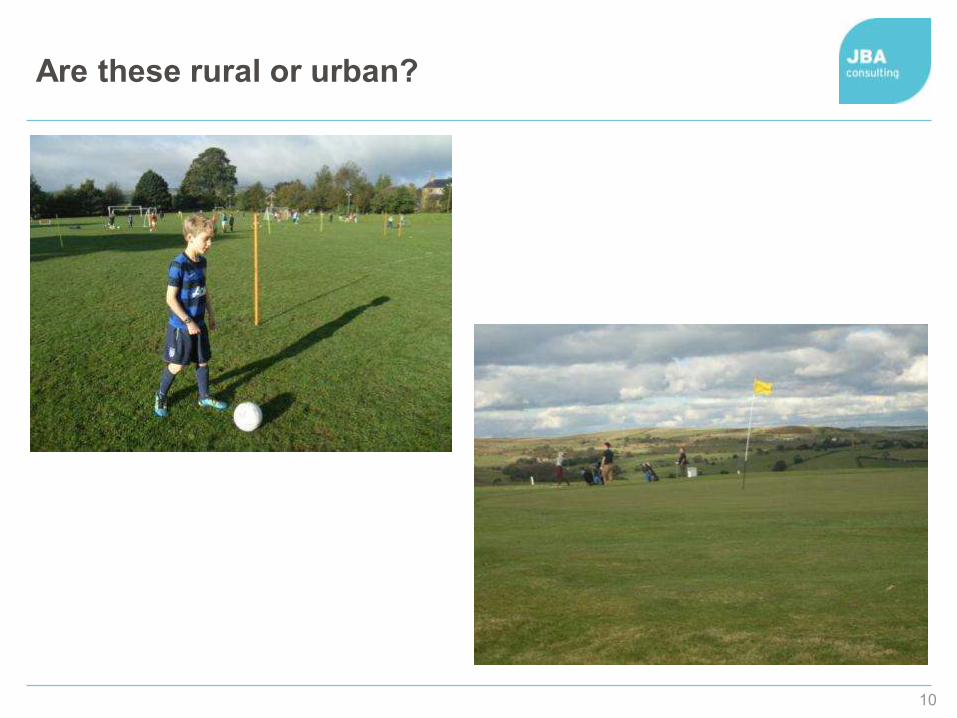
Are these rural or urban?
10

Why talk about them?
11
Because there are so many of them…

Why talk about them?
12

Why talk about them?
• Because there are so many flood studies on small catchments:
– Flood risk assessments and SUDS design;
– flood mapping;
– flood warning;
– design of storm sewers;
– design of road drainage and culverts;
– design of pumping stations and other infrastructure;
– appraisal of options for flood alleviation;
– reservoir studies.
13

Why talk about them?
• Because flow processes may be different from large catchments
– Is there a size at which the balance of flow processes within the catchment
changes?
14

Flow processes
• Upland catchment (Coalburn)
– 2.6km2
– Stream network
– Clear topographic boundary
– Mixture of riparian areas, hillslopes etc.
– Flow can be measured
• Standard flood estimation methods can be applied
– although with concern about applicability of regression equations given
scope for local conditions to dominate
15

Flow processes
• Lowland catchment
– No watercourse
– No stream data
– May not form a complete catchment
– Some catchment descriptors are
meaningless
– How much will it contribute to
downstream flooding?
• What methods are suitable for flood estimation?
– Can the model parameters be reasonably estimated from national-
scale gridded data on soils etc.?
16

Flow processes
• Processes:
– Infiltration-excess and saturation-excess
runoff
– Sub-surface flow paths
– Stream flow: concentrating and conveying
• What is surface runoff?
– Quick flow in streams may have originated
as infiltration and subsurface flow
– Even if an area does not appear to yield
local surface runoff, it may contribute to
storm flow in the stream network further
downstream
17

Flow processes
• Balance of processes changes with catchment size:
– Soil flows dominate for small plots and catchments
• Flow rates are cm/s
– In-stream processes become more important for larger catchments
• Flow rates are m/s
• So extrapolation of flood estimation across catchment scales is uncertain
• Need to think carefully about why we need estimates of greenfield runoff
18

Sources of data

HiFlows-UK
20
9% of total dataset

How representative is HiFlows-UK?
21
Graph and table
© Symonds Group

Other stream flow datasets on small catchments
• NRFA: 127 flow gauges on catchments under 25km2
• Other gauges: experimental sites, water companies etc.
• Level gauges on engineered channels in urban catchments – may be possible to derive rating
22

Runoff data at the plot scale
• Pontbren (Wales)
• North Wyke (Devon)
• ADAS (various)
• Forest of Bowland (Lancashire)
• Upper Teesdale (Durham)
– Mostly short records, problems
with long gaps during winter
months
23

24
Methods available

IH 124 (1994)
25

ADAS 345 (1982)
26

FEH (Statistical, rainfall-runoff, ReFH)
27

Sewer design methods for urban catchments
28

Guidance on choice of method (2005)
• “IH Report 124 should be used to calculate greenfield runoff peak flow rates”
– For catchments under 2km2
– Regression formula for QBAR
combined with growth curves from
FSR
• Reasons:
– Stronger empirical support than
ADAS 345
– “Meeting the pragmatic needs of
the industry”
29

Guidance on choice of method
• Recommendation to use IH 124 for rural runoff estimation in small catchments or for greenfield runoff is repeated in several subsequent guidance documents, including:
– Design Manual for Roads and Bridges (Highways Agency 2004);
– Exceedance in Urban Drainage (Balmforth et al. 2006);
– SUDS Manual (Woods-Ballard et al. 2007);
– Sewers for Scotland (Scottish Water 2007);
– Code for Sustainable Homes Technical Guide (Department for Communities
and Local Government 2009);
– Drainage Manual (Network Rail 2010).
30

Possible alternative reason for dominance of IH 124
• It’s got small in its title
31
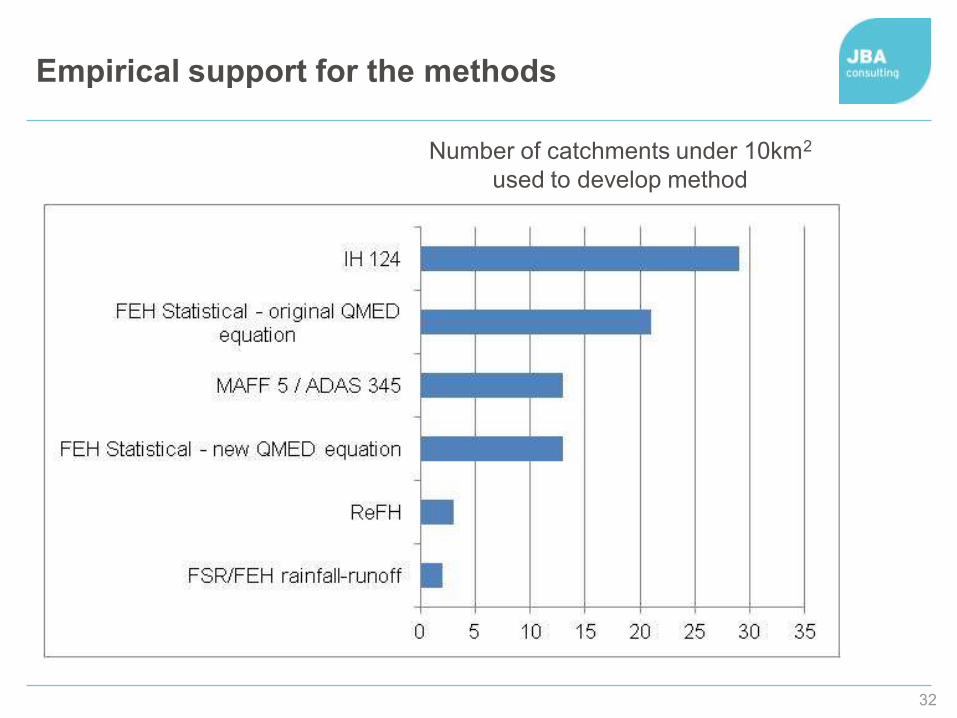
Empirical support for the methods
32
Number of catchments under 10km2
used to develop method

Empirical support for the methods
33
Number of small plots
used to develop method
Er – none (smallest catchment 0.9km2)
Maybe (large field drainage systems)
None
None
None
None

Performance tests

Catchments chosen for tests
• 73 catchments under 25km2
• 40 from HiFlows-UK
• All but 9 essentially rural
35
0
5
10
15
20
25
30
Nu
mb
er
of
Ca
tch
me
nts
SAAR (mm)
Braid Burn

Method for tests
36
• Compared predicted QMED with observed QMED from annual maximum flows
– QMED is the median of annual maximum flows (return period 2 years)
• Four methods:
– FEH Statistical
– ReFH (not FEH rainfall-runoff)
– IH 124
– ADAS 345

Results: comparison of QMED
37
0.001
0.010
0.100
1.000
10.000
100.000
0.010 0.100 1.000 10.000 100.000
Est
ima
ted
QM
ED
(m
3/s
)
Observed QMED (m3/s)
FEH Statistical
ReFH
IH 124
ADAS 345

Results: bias
38
0.5 1.0 2.0
FEH Stat
ReFH
IH124
ADAS
Bias in QMED
All catchments (73)
Urban only (9)
Excluding urban and permeable catchments (54)
Excluding high-rainfall catchments (44)

Results: mean error
39
0.0 0.5 1.0 1.5 2.0
FEH Stat
ReFH
IH124
ADAS
RMSE in log QMED
All catchments (73)
Urban only (9)
Excluding urban and permeable (54)
Excluding high-rainfall catchments (44)

Comparison of growth curves
40
2
3
4
5
0 5 10 15 20 25
Q100 o
ve
r Q
ME
D
AREA (km2)
FEH pooled growth factors for typical small catchment (FARL=1)
FSR growth factor for N Scotland
FSR growth factor for S Scotland
ReFH for selected small catchments

41
Conclusions on small rural catchments
• Scope to include more small catchments in HiFlows-UK and datasets used to develop FEH methods
• Guidance to use IH124 or ADAS 345 is related to ease of use and desire to avoid needing FEH software rather than appropriateness of the methodologies
• Continued use of IH124 cannot be justified
– especially using coarse FSR soil maps
• FEH Statistical works well for small catchments
• ReFH works well apart from on highly permeable catchments
41

42
Plot-scale runoff

What about greenfield runoff?
• Why do we need greenfield runoff estimates?
– Design of water management measures for:
• Site level of service protection (typically to a 30-year return period)
• River water quality protection
• River regime protection (ensuring that runoff does not exceed the greenfield rate
for common events, typically with a 1-year return period)
• River and site flood protection (typically to a 100-year return period)
(Kellagher, 2004)
43
Plot scale
Catchment
scale
Nearly all
data is at
this scale
“one of the most daunting scientific challenges in hydrology” (Wigmosta and Prasad, Encyclopedia of Hydrological Sciences, 2005)

What methods are suitable at the plot scale?
44
FEH No – based on
flow data from
catchments with
watercourses
What
about
Rational?
Assumes flow
proportional to area
– so why not just
scale down FEH
results by area?
Does peak
flow scale
linearly with
area?
Same true for IH 124
and ADAS 345.
If methods based on
data from watercourses
can’t be used,
what can?

Scaling of peak flow with area
• Large catchments:
– FEH statistical method :QMED varies with AREA0.85.
– IH 124: QBAR varies with AREA0.89.
– Catastrophe curve based on maximum peak discharges (Acreman 1989)
shows that specific discharge increases markedly as the catchment area
reduces from 10,000 km2 to 10 km2.
– Areal reduction effect / storm intensity decreasing / attenuation in channels
• Small catchments:
– More linear?
– Rainfall spanning whole catchment, less attenuation, runoff dominated by
hillslope processes
45

What does the small catchment data say?
• Nested pairs of small catchments at Plynlimon, Wales
46
River Ratio of
area
Ratio of
QMED
Severn 2.51 2.54
Hore 2.00 1.80
Cyff/Wye 3.39 2.98

And the plot-scale data?
• Nested catchments at Pontbren, Wales
– Hillslope drained by field drain (0.36ha) and overland flow (0.44ha)
– Stream flow from catchment of 3.2km2
– Ratio of areas is 1: 792
47
0.0
0.5
1.0
1.5
2.0
2.5
3.0
3.5
4.0
4.5
24 Jun 07 12:00 25 Jun 07 00:00 25 Jun 07 12:00 26 Jun 07 00:00 26 Jun 07 12:00
Dis
ch
arg
e (
l/s)
Discharge from plot Flow on watercourse scaled down by area
0.0
0.5
1.0
1.5
2.0
2.5
3.0
3.5
4.0
4.5
5.0
17 Jan 07 12:00 18 Jan 07 00:00 18 Jan 07 12:00 19 Jan 07 00:00
Dis
ch
arg
e (
l/s)
Discharge from plot Flow on watercourse scaled down by area
18 Jan 07 25 Jun 07

Heterogeneity
• Gradient of hillslope is more than twice that of whole catchment
• Substantial variations in soil properties and runoff processes even over very small scales
• Features such as macropores can have a large influence on runoff
– difficult to account for without intensive field study
• Need some consideration of site characteristics
– otherwise a greenfield runoff rate applied as an average across a small
catchment may be too high or too low for a particular development site
– Overestimation would result in the limiting discharge being set higher than
the actual rate, hence increase in downstream flood flows.
48

49
Conclusions on greenfield runoff
• Advantages of methods developed at catchment -scale:
– Well-founded, drawing on large datasets
– Focus attention on the downstream impact
– Avoid the need to subjectively define coefficients (e.g. in Rational method)
• But important to consider site-specific characteristics too
• More investigation in Phase 2 of project
49

50
Interim recommendations from Phase 1 of research
• Use FEH methods
• Assess results against information on flood history and channel capacity
• For catchments smaller than 0.5km2 and small plots, scale FEH estimates down by area
– “The decision to translate FEH estimates from catchment scale to plot scale
should be accompanied by an assessment
of whether the study site is representative
of the surrounding catchment area.”
50

Post-development runoff
• Current approach: often urban drainage design methods at plot scale
• As for greenfield runoff, risks losing focus on downstream flood risk
• Would be preferable to use consistent method for both pre and post-development runoff
• Methods such as FEH Statistical and rainfall-runoff are calibrated on urbanised catchments
– only represent net effect of urbanisation
• More work in Phase 2
51

52
Phase 2 of research

Plans for Phase 2
• Task 1: More data
– Up to 40km2
– Down to hectares
– Checks on ratings for non-HiFlows-UK gauges
– Urban catchments including possible ratings for level gauges
– Contributions welcome!
53
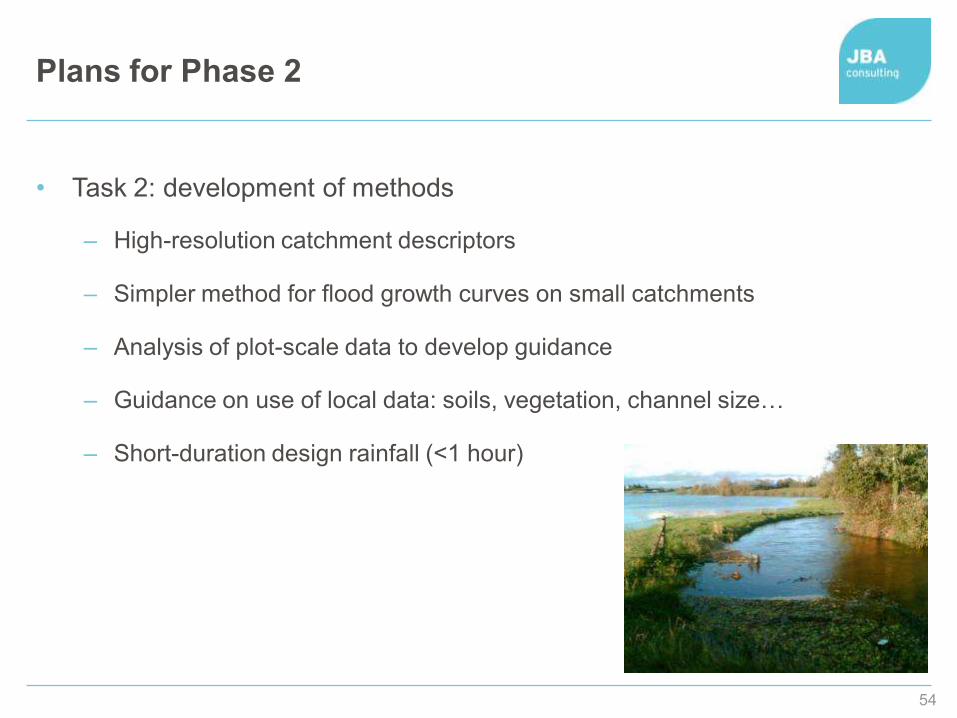
Plans for Phase 2
• Task 2: development of methods
– High-resolution catchment descriptors
– Simpler method for flood growth curves on small catchments
– Analysis of plot-scale data to develop guidance
– Guidance on use of local data: soils, vegetation, channel size…
– Short-duration design rainfall (<1 hour)
54

Plans for Phase 2
• Task 3: Reporting and recommendations
– Report
– User guidance
55

56

ReFH in Scotland
• SEPA’s concerns include:
– Shortage of Scottish calibration data
– Calibration to pooled growth curves - dominated by larger catchments
– 150 year return period limit of calibration
57

ReFH in Scotland: Time line
• Feb 2006: ReFH was released
– “Results specific to the use of the revitalised FSR/FEH rainfall-runoff
method in Scotland will be reported separately.”
• Oct 2006: Work to validate ReFH in Scotland “ongoing” (ReFH Forum)
• 2011 and July 2012: SEPA provided rainfall and flow data to WHS to aid in improving ReFH
• 2012: CEH are revising ReFH – want to avoid producing separate version for Scotland
58

ReFH in Scotland: my perspective
• Shortage of Scottish calibration data
– ReFH: 5 Scottish catchments. FSR RR: 10/11
• Calibration to pooled growth curves, mostly large catchments
– FSR RR calibrated to single-site curves, also mostly large catchments
• 150 year return period limit of calibration
– FSR RR: limit was 10 years.
• ReFH is extensively used in N Ireland – no calibration gauges there
– MSc by David Lee,
Leeds, 2010:
59