duodenal ph : new aspects of physiology and pathophysiology
TRANSCRIPT

Univers
ity of
Cap
e Tow
n
i
DUODENAL pH:
NEVI ASPECTS OF PHYSIOLOGY AND PATHOPHYSIOLOGY
CRAIG A. ERIKSEN
l'v1B ChB (Cape Town), FRCS (Edin)
A thesis submitted for the degree cf
Doctor of Medicine
University of Cape Town

The copyright of this thesis vests in the author. No quotation from it or information derived from it is to be published without full acknowledgement of the source. The thesis is to be used for private study or non-commercial research purposes only.
Published by the University of Cape Town (UCT) in terms of the non-exclusive license granted to UCT by the author.
Univers
ity of
Cap
e Tow
n

To my wife, India,
and my parents

List of Tables
List of Figures
List of Illustrations
Acknowledgements
Declaration
Abstract
Abbreviations
TABLE OF CONTENTS
Presentations and Publications
ii
Page
Vll
xi
xv
XVI
xviii
xix
XXl
XXll
CHAPTER 1 DUODENAL pH: STUDY AIMS AND HYPOTHESES 1
1.1 Introduction
1.2 Study Aims
Part 1
Study I
Study II
Hypothesis I
Study III
Hypothesis II
CHAPTER 2 : IYIEASUREMENT OF DUODENAL pH: A HISTORICAL
REVIE\V
2.1 Introduction
2
3
3
4
4
4
5
5
6
7

2.2 Aspiration Techniques
2.3 Electrode Techniques
2.4 pH Monitoring by Radiotelemetry
iii
Page
10
18
29
CHAPTER 3 : 24 HOUR AMBULATORY DUAL GASTRO-DUODENAL
pH MONITORING USING A COMPUTER-BASED SYSTEM
METHODS: DEVELOPMENT AND VALIDATION 32
3.1 The pH Monitoring system 33
3.1.1 The pH Electrodes 33
3.1.2 The pH Microlog Receiving Uriit 37
3.2 Responses of pH Monitoring System 42
3.3 In situ Placement of the Electrodes 44
3.4 Computer Operating System 49
3.4.1 Data Storage 50
3.4.2 Computer software 50
3.4.3 Analysis of pH Data 55
3.5 Statistical Analyses 59
3.6 In situ Use of the Dual Gastro-duodenal pH
Monitoring System 60
CHAPTER 4 :THE NORMAL PROFILE OF 24 HOUR AMBULATORY
DUAL GASTRO-DUODENAL pH IN HEAL THY SUBJECTS 68
4.1 Study Aim 69
4.2 Study Group 70

4.3 Study Design - Study I
4.4 Analysis and Statistics
4.5 Ethical Approval
4.6 Normal duodenal bulb pH profile
4.6.1 Fasting duodenal bulb pH
4.6.2 Total duodenal bulb acid exposure
4.6.3 Acid peaks within the duodenal bulb
4. 7 Normal gastric pH profile
4.7.1 Fasting Gastric pH
4.7.2 Intragastric acidity
4.8 The effect of modified sham feeding and an ingested
solid meal
4. 9 Discussion
iv
Page
70
74
74
75
75
75
77
83
83
83
89
91
CHAPTER 5 : 24 HOUR AMBULATORY DUAL GASTRO-DUODENAL
pH PROFILES OF PATIENTS WITH ACUTE DUODENAL
tJ"LCER 98
5.1 Hypothesis I 99
5.2 Study aim 99
5.3 Study group 100
5.4 Study design - Study II 101
5.5 Analysis and statistics 102
5.6 Ethical approval 102

5. 7 Duodenal bulb pH profile in duodenal ulcer
patients
5.7.1 Fasting duodenal bulb pH
5. 7 .2 Total duodenal bulb acid exposure
5.7.3 Acid peaks within the duodenal bulb
5.8 Intragastric acidity of DU patients
5.8.1 Fasting gastric pH
5.8.2 Intragastric acidity
5.9 The effect of modified sham feeding and an ingested
solid meal in DU patients
5.10 Discussion
V
Page
102
102
104
106
111
111
111
115
117
CHAPTER 6 : THE ROLE OF HORMONAL CONTROL OF GASTRIC
ACID SECRETION IN HEAL TH AND DUODENAL ULCER
DISEASE
6.1 Introduction
6.2 Gastrin
6.3 Secretin
6.4 Somatostatin
6.5 Radioimmunoassay techniques
CHAPTER 7 : EFFECT OF MODIFIED SHAM FEEDING AND
122
123
124
127
128
130
INGESTION OF }. SOLID MEAL ON PLAS~1A GASTRI:N, SECRETE'{
AND SOMATOSTATIN A.ND CONCURRENT CHANGES IN DUODENAL
BULB pH IN HEAL THY SUBJECTS AND PATIENTS 'WITH
DUODENAL ULCER 132

7.1 Hypothesis II
7 .2 Study aim
7.3 Study groups
7 .4 Study design - Study III
7 .4.1 Plasma gastrin radioimmunoassay
7 .4.2 Plasma secretin radioimmunoassay
7.4.3 Plasma somatostatin radioimmunoassay
7 .5 Ethical approval
7.6 Results
7 .6.1 Plasma gastrin
7 .6.2 Plasma secretin
7 .6.3 Plasma somatostatin
7.6.4 Correlation between these hormones
7 .6.5 Duodenal bulb acidity
7.7 Discussion
CHAPTER 8 : CONCLUSIONS AND THE FUTURE
8.1 Dual gastro-duodenal pH monitoring system
8.2 Gastro-duodenal pH profile in health
8.3 Gastro-duodenal pH profile in duodenal ulcer disease
8.4 The controls of gastric acid secretion
8.5 The future
APPENDIX
REFERENCES
vi
Page
133
134
134
135
136
136
137
137
138
138
144
149
154
155
163
171
172
173
173
174
175
176
L89

Tabie 4.1
Table 4.2
Table 4.3
Table 4.4
Table 4.5
Table 4.6
Table 4.7
Table 4.8
LIST OF TABLES
Cumulative percentage pH exposure in the
duodenal bulb in healthy subjects
Acid peaks within the duodenal bulb below pH
levels of 2,3 and 4 during the day and at night
in healthy subjects
: Acid peak analysis to below pH 4.0 in
healthy subjects
Analysis of acid peaks of varying duration
within the duodenal bulb in nine healthy subjects
Cumulative percentage of gastric pH data in
healthy subjects
Duration of rises in intragastric pH to above
pH levels of l, 2, 3, 4 and 5 in healthy subjects
Acid exposure in the duodenal bulb fallowing
cephalic stimulation and a meal in healthy subjects
Analysis of acid peaks within the duodenal
bulb following cephalic stimulation and a meal
in healthy subjects
Table 5.1 Fasting duodenal bulb pH of healthy subjects
and patients with active duodenal ulcer
Table 5.2 Acid peak analysis: Time spent below pH levels
of 4, 3 and 2 in healthy controls and duodenal
ulcer patients
Table 5.3 Acid peak analysis to pH <4.0 within the duodenal
bulb in DU patients and healthy subjects
vii
Page
77
78
79
81
85
86
90
90
103
106
107

Table 5.4 Acid exposure in the duodenal bulb following
cephalic stimulation and a meal in patients
with duodenal ulcer
Table 5.5 Analysis of acid peaks within the duodenal bulb
following cephalic stimulation and a meal in
patients with duodenal ulcer
Table 7 .1 Plasma gastrin responses to cephalic stimulation
(MSF) and a meal in "Hypergastrinaemic" (HRG) and
"Normogastrinaemic" (NOG) DU patients ar.d healthy
subjects (VOL)
Table 7.2 Frequency distribution of duodenal pH data after
cephalic stimulation and a meal in healthy subjects
vii::.
Page
116
117
143
(VOL), Hypergastrinaemic (HRG) and Normogastrinaemic
(NOG) duodenal ulcer patients 156
Table 7.3 Analysis of acid peaks in the duodenal bulb after
cephalic stimulation and a meal in healthy subjects
(VOL), Hypergastrinaemic (HRG) and Normogastrinaemic
(NOG) duodenal ulcer patients
Table A.l Cumulative percentage of total 24 hour duodenal
pH recordings in duodenal ulcer patients and
healthy subjects
Table A.2 Analysis of number of acid peaks of varying
duration within Lhe duodenal bulb in duodenal
ulcer patients
Table A.3 Cumulative pH percentage of gastric pH data
in patients with duodenal ulcer
157
177
178
179

Table A.4 Duration of rises in intragastric pH over 24
hours in healthy subjects and patients with duodenal
ulcer
Table A.5 Plasma gastrin responses to modified sham feeding
and a meal in duodenal ulcer patients and healthy
subjects
Table A.6 Plasma gastrin responses to modified sham feeding
and a meal in "Hypergastrinaemic" (HRG) and
"Normogastrinaemic" (NOG) duodenal ulcer
patients
Table A.7 Plasma secretin responses to modified sham feeding
and a meal in duodenal ulcer patients and healthy
subjects
Table A.8 Plasma secretin responses to modified sham feeding
and a meal in "Hypergastrinaemic" (HRG) and
"Normogastrinaemic" (NOG) duodenal ulcer
patients
Table A.9 Plasma somatostatin responses to modified sham
feeding and a meal in duodenal ulcer patients and
healthy subjects
Table A.10 Plasma somatostatin responses to modified sham
feeding and a meal in "Hypergastrinaemic" (HRG)
and "Normogastrinaemic" (NOG) duodenal ulcer
patients
Table A.11 Effect of cephalic stimulation (MSF) and a meal
on ·duodent1i pH in Hypergasn-inaemic (HRG) and
Normogastrinaemic (NOG) DU patients and controls.
I, II
ix
Page
180
181
182
183
184
185
186
187
Table A.12 Effect of cephalic stimulation (MSF) and a meal
on duodenal pH in Hypergastrinaemic (HRG) and
Normogastrinaemic (NOG) DU patients and controls.
III.IV
X
Page
188

LIST OF FIGtJRES
Figure 2.1 : Local factors that govern the neutralization
of acid in the duodenal bulb
Figure 3.1 Combined micro pH glass/reference electrode
Figure 3.2 Response of the electrodes in buffer solutions
Figure 3.3 The monitoring positions of the two electrodes
within the stomach and duodenum
Figure 3.4 : Change in pH values measured by the electrode
passing from the antrum (left) into tl1e
duodenum (right)
Figure 3.5 : Section of the duodenal bulb pH tracing,
showing the rapid fluctuations in pH and the
acidification following meals
Figure 3.6 : Frequency distribution of the total 24 hour
duodenal pH data, showing separately the
Xi
Page
8
~~:>
43
47
48
53
daytime (above) and nocturnal (below) recordings 54
Figure 3.7 : Detailed analysis of acid peaks within the
duodenal bulb to pH <4
Figure 3.8 : Summarised analysis of acid peaks within the
duodenal bulb to pH <4
Figure 3.9 : Tracing of fasting duodenal bulb pH, with
the sampling rate at 1 sec-1
Figure 3.10 : Tracing of duodenal bulb pH showing the
fasting and immediate post-prandial period
57
58
64
65

Figure 3.11 : Tracing of antral pH during the same
fasting and post-prandial periods as shown
in Figure 3.10
Figure 3.12 : Frequency distribution of the duodenal pH
data illustrated in Figure 3.10
Figure 4.1 Study design - Study I
Figure 4.2 Duodenal pH during the fasting period of
a healthy subject
Figure 4.3 : Comparison of short-lived to long-lived
acid peaks in the duodenal bulb of healthy
subjects
Figure 4.4 Antral pH during the fasting period
Figure 4.5 Effect of ingestion of a meal on antral pH
Figure 4.6 Recording of antral pH at night showing
spontaneous rises in pH of varying duration
Figure 5.1 Study design - Study II
Figure 5.2 Frequency distribution of cumulative
percentage of total duodenal pH data in
DU patients and healthy controls
Figure 5.3 : Analysis of number of acid peaks of varying
duration in healthy controls and DU patients
Figure 5.4 : Comparison of short-lived and long-lived
acid peaks in the duodenal bulb of healthy
subjects and duodenal ulcer patients
Figure 5.5 : Cumulative pH percentage of gastric pH
data in healthy subjects and duodenal
ulcer patients
xii
Page
66
67
71
76
82
84
87
88
101
105
109
110
113

Figure 5.6 : Duration of rises in intragastric pH over
24 hours in healthy subjects and duodenal
ulcer patients
Figure 7.1 : Study design - Study III
Figure 7.2 : Fasting plasma gastrin levels in DU
patients and controls
Figure 7.3 : Effect of modified sham feeding (MSF) and
a meal on plasma gastrin in duodenal ulcer
patients and healthy subjects
Figure 7.4 : Effect of modified sham feeding (MSF) and
a meal on plasma gastrin in Hypergastrinaemic
(HRG) and Normogastrinaemic (NOG) DU patients
and controls
Figure 7.5 : Effect of modified sham feeding (MSF) and
a meal on plasma secretin in duodenal ulcer
patients and healthy subjects
Figure 7.6 : Effect of modified sham feeding (MSF) and
a meal on plasma secretin in Hypergastrinaemic
(HRG) and Normogastrinaemic (NOG) DU patients
and controls
Figure 7.7 : Effect of modified sham feeding (MSF) and
a meal on plasma somatostatin in duodenal uk~r
patients (n=22) and healthy subjects (n=20)
Figure 7.8 : Effect of modified sham feeding (MSF) and
a meal on plasma somatostatin in
Hypergastrinaemic (HRG) and Normogastrinaemic
xiii
Page
114
135
139
141
145
147
148
151
(NOG) DU patients and controls 152

X:!.V
Page
Figure 7.9 Effect of MSF and a meal in DU patients and controls.
I: Onset of duodenal acidity 159
Figure 7.10 : Effect of MSF and a meal in DU patients and controls.
II: Time spent < pH 4 160
Figure 7.11 : Effect of MSF and a meal in DU patients and controls.
III: Time to peak duodenal acid response 161
Figure 7.12 : Effect of MSF and a meal in DU patients and controls.
IV: Time to return from peak duodenal acid
response to pre-meal pH values 162

LIST OF ILLUSTRATIONS
Illustration 3.1 : Combined micro glass/reference electrode
Illustration 3.2 : pH Microlog receiving unit and 4 button
detachable keypad
Illustration 3.3 : pH Monitoring system consisting of the
two pH electrodes strapped together and
the weighted bag
Illustration 3.4 : Graphics display of part of the 24 hour
pH data as shown on the computer screen.
The duodenal pH data (distal) is shown by the
pink dots, and the gastric pH data (proximal) by
the blue dots. The time of day is shown along the
X axis, with the start and finish times in the
bottom corners of the screen. The pH is shown on
the Y axis, with pH 1.0 at the top. The time
of a meal is illustrated
Illustration 4.1 : Standardized meal served for Modified
Sham Feeding
Illustration 4.2 : Standardized solid meal
xv
Page
34
38
45
52
72
73

ACKNO vVLEDGEMENTS
The work for this thesis was performed in the Department of Surgery
at Ninewells Hospital and Medical School, Dundee, Scotland. It was
commenced in October 1985, and completed in November 1987.
I would like to thank, most sincerely, Professor Alfred Cuschieri,
Head of the Department of Surgery, University of Dundee, for his
extremely valuable advice and support during th.e undertaking of this
work. I am also most grateful to him for teaching me the fundamentals
of clinical research, and for allowing me to use the faciiities of the
his department.
I would like to thank Mr Sarni Sadek for the use of his computer
software, for writing th.e necessary modifications in the programmes,
and for introducing me to computers.
I received a great deal of help from the following people, and I am
grateful for their co-operation:
Mr Robert Wood, Mr Paul Preece and Mr Michael Waiker, Senior
Lecturers in the Department of Surgery, University of Dundee, and
Professor Alfred Cuschieri for allowing me to investigate some of
their patients;
Miss Elizabeth Michel, Laboratory Technician, Department of Surgery,
for her valuable help in maintaining the microlog receiving units and
printing some of the study records, and Mr Angus Reid for preµc,.ring
the Trasylol test tubes for the plasma samples;
Professor Keith Buchanan, Department of Medicine, Queen's University,
Belfast, for arranging the plasma samples to be assayed in his
department;
xvi
Mr Mark Tulley, Department of Medical Physics, for modifying the
receiving units and keeping them fully serviced;
Dr Wynne Carter and Mr David Bryce, Department of Medical
computing, for their loaning me the word-processing software;
Dr Peter Baker, Department Of Surgery, for assisting me with the
statistical analysis and loaning me the necessary software;
xvii
Mrs Catherine Hali, Dietician, for her help in organising the two meals;
The staff of the Medical Illustration Department for the preparation of
most of the figures and the illustrations;
my warm thanks to all the volunteers who participated in the study.
In addition, I am most grateful to Professor Lynne Baker, Head of
Department of Surgery, University of Natal, Durban, for all he did to
make this possible 1 and for his support.
I would like to extend my appreciation to Smith, Kline and French
Laboratories, and the Tayside Health Board for financial support.
This thesis was typed and prepared by the author, on an Amstrad
PC1512 word processor, and printed using the laser printer of the
Department of Surgery.
Figure 2.1 After Rune 1981
Figure 3.1 After product information, Radiometer, Copenhagen.
xvi:i
DECLARATION
I, Craig Alexander Eriksen, hereby declare that the work on which this
t11esis is based is original ( except where acknowledements indicate
otherwise) and that neither the whole work nor any part of it has been,
is being, or is to be submitted for another degree in this or any other
University.
I empower the University to reproduce for the purpose of research
either the whole or any portion of the contents in any manner
whatsoever.
Signed: .................. .
Dated: ................... .

ABSTRACT
The pathogenesis of duodenal ulcer is believed to centre around the
presence of gastric acid, yet the exact role that acid plays is poorly
understood. Previous investigations of the duodenal pH have been
restricted by methodological and technical difficulties, and have, for the
most part, only monitored the pH in the short-term.
xix
A new reliable system for long-term ( twenty four hour), ambulatory,
simultaneous measurement of intra-luminal antral and duodenal bulb pH
has been developed. The system comprises two glass pH electrodes, a
small portable recording unit and a computer-based system for data
storage and analyses. Validation of this pH monitoring system was first
performed, and the 24 hour ambulatory profiles of antral and duodenal
pH of normal healthy subjects were subsequently recorded. Periods of
cephalic stimulation and ingestion of a solid meal were included during
the study period. Having established the normal profiles, the
investigation was repeated in patients with active duodenal ulcer, off
treatment.
The gastric pH profile was similar of both study groups. There were
no significant differences between the fasting duodenal bulb pH and the
total 24 hour duodenal acid exposure of the ulcer patients and healthy
subjects. Acid peak analysis demonstrated that the duodenal ulcer
patients exhibited a defect in the propulsive duodenal bulb motility.
Gastric stimulation caused a similar pattern of duodenal acidification m
the two groups. These results suggest that gastric acid is not of
primary pathophysiological importance in duodenal ulcer disease.

xx
The effects of cephalic stimulation and a meal on plasma gastrin,
secretin and somatostatin and duodenal pH were examined in healthy
subjects and duodenal ulcer patients. The results showed: vagally
released gastrin is not a significant contributor to stimulation of gastric
acid secretion in either health or duodenal ulcer disease; duodenal ulcer
patients have excessive basal and post-stimulation plasma gastrin levels
but a subset of ulcer patients exists, the "Hypergastrinaemic11 patients,
who exhibit exaggerated gastrin responses, vagal hyperactivity, a
defective somatostatin-induced inhibition of gastrin release and a defect
in the "switch-off" mechanism of gastric acid secretion. In addition, the
physiological role of secretin in inhibiting gastrin release in Man is
questionable. This study reveals new aspects in the physiology and
pathophysiology of the duodenal bulb pH.

ABBREVIATIONS
The follov1ing abbreviations have been used in this work:
VOL : Healthy subjects, volunteers
DU : Duodenal ulcer
HRG Hypergastrinaemic patients
NO G Normogastrinaemic patients
MSF : Modified sham feeding, cephalic stimulation
d.o.f. : Degrees of freedom
x:c:.
xxi i
PRESENTATIONS AND PUBLICATIONS
The following abstracts and papers had arisen from work done for this
this thesis:
1. Eriksen CA., Sadek SA., Cuschieri A.: Twenty four hour ambulatory
du&l gastroduodenal pH profiles in health and duodenal ulcer disease.
Gut 1986; 27: A1256.
Presented at the Congress of British Society of Gastroenterology, 25
Sept. 1986, Cardiff.
2. Eriksen CA., Buchanan KD., Cuschieri A.: Gastrin responses and
duodenal acidity after sham feedin~ and a meal in duodenal ulcer
disease. Presented at the Meeting of Academic Departments of Surgery
in Europe, 10 April 1987, Pavia, Italy.
3. Eriksen CA., Sadek SA., Cuschieri A.: The effect of modified sham
feeding and a meal on duodenal bulb pH: Evidence of increased vagal
tone in duodenal ulcer patients. Europ. Surg. Res. 1987; 19: 56-57.
Presented at th eCongress of European Society for Surgical Research,
12 May 1987, Aarhus, Denmark.
4. Eriksen CA., Buchanan KD., Cuschieri A.: Duodenal acidification and
gastrin responses after feding: a new look at the physiology. Gut 1987
(In Press). Poster presentation at the Congress of British Society of
Gastroenterology, 18 Sept. 1987, London.
5. Eriksen CA., Sadek SA., Cuschieri A.: 24 Hour ambulatory dual
gastro-duodenal pH monitoring: the role of acid in duodenal ulcer
disease. Submitted for consideration to Journal of Clinical Investigation.
6. Eriksen CA., Buchanan KD., Cuschieri A.: The effects of modified
sham feeding and a solid meal on plasma gas trin ar..d duodenal acidity m
normal subjects and patients with duodenal ulceration. Submitted for
consideration to Gastroenterology.

CHAPTER 1
DUODENAL pH:
STUDY AIMS AND HYPOTHESES
2
1.1 INTRODUCTION
Although, for the past century, the aetiology of duodenal ulcer disease
has eluded all investigators, the presence of gastric acid in the duodenal
bulb remains the major determining factcr. Amongst the evidence for
this~ is the very strong association between duodenal ulceration and the
gastric hypersecretion seen in patients with the Zollinger-Ellison
syndrome (Ellison and Wilson 1964 ), as well as, apart from rare
exceptions (Duberstein and Efrusy 1977), duodenal ulceration does not
occur in the absence of gastric acid. Tr.is emphasises what Sch\varz
stated in 1910: "no acid, no ulcer" (Schwarz 1910 cited in Kirk 1981),
and the fact that 70-80% of duodenal ulcers heal after two to six weeks
of treatment with an acid-inhibiting agent (Lam and Koo 1983, Lam
1984).
It is not understood the precisP. nature of the role that acid plays in this
disease: whether it is the hypersecretion of gastric acid (Rune 1983);
whether the exposure to a 11normal" amount of acid in the duodenal bulb
is prolonged; or whether there is an imbalance of the normal interplay
between acid, bicarbonate and other secretions. A further aspect in the
aetiology of the disease is the possible presence of a local mucosal
defect of the duodenal bulb, or abnormal mucosal cells (Lawson 1987)
which makes it susceptible to ulcer formation following the normal acid
exposure. The overall picture is, however, somewhat clouded due to the
association of duodenal ulcer with many other diseases OVormsley
1980).

3
1.2 STUDY AIMS
The aim of this investigation was to develop a reliable computer-based
system for continuous long-term simultaneous measurement of antral
and duodenal bulb pH. The system was required to be compact, fully
portable and comfortable, so that it might be used in as near
physiological conditions as possible.
A computer was employed for data storage and analysis, thus enabling a
large volume of raw pH data to be recorded. In this way, many
different types of analyses were able to be performed in a manner
more accurate and reproducible than by manual techniques. The
maximum amount of information was thus extracted from the raw data
and a critical detailed assessment of the study area was made.
The equipment used in this investigation included:
1. Two combined micro pH glass/ reference electrodes
(GK2801C, Radiometer, Copenhagen, Denmark)
2. A portable pH microlog receiving unit (Medical Physics,
University of Dundee Medical School, Dundee, Scotland)
3. IBM PC computer with software developed in the Department
of Medical Computing, University of Dundee, Dundee, Scotland.
The investigation was set up m four main parts:
PART 1
Develop:ment of the system and validation of the methods
The equipment for pH monitoring was selected, and developed for dual
monitoring over long periods ( twenty four hours). Likewise, a
computer-based system with appropiate analysis programmes \Vas

4
developed to accommodate the dual method of monitoring. The system
was assessed in vitro and then in vivo.
STUDY I
Assessment of the normal profile of 24 hour ambulatory dual gastro
duodenal pH
The study sought to avoid the shortcomings of previous investigations,
and set out to record, for the first time, a continuous, 24 hour
simultaneous profile of the antral and duodenal bulb pH in normal
healthy subjects. These profiles would describe the normal fluctuations
in daytime and nocturnal gastric acid secretion and the concurrent
changes in the exposure of the duodenal bulb to such acid secretion.
Included in this study, was the assessrr.ent of the effects of the
cephalic and gastric phases of gastric acid secretion on the gastro
duodenal pH.
STUDY II
Assessment of the 24 hour ambulatory dual gastro-duodenal pH profile
in patients with acute duodenal ulcer
The aim of the study was to record the 24 hour simultaneous profiles
of antral and duodenal bulb pH in patients with active duodenal ulcer,
off-treatment. The same periods of cephalic stimulation and ingestion
of a solid meal were incorporated. The results obtained from the study
were compared with those of the healthy subjects described in Study I,
and the hypothesis (below) for this study was examined.
Hypothesis I: Abnormal gastric hypersecretion has been dccumented m
duodenal ulcer disease (Baron 1973, Wormsley 1974), and excessive
amounts of acid have been noted in the duodenal bulb (Rhodes and
Prestwich 1966). More recently, this latter finding has been disputed

5
(Bendtsen et al 1986). As these studies have only been performed in the
short-term, the exposure of the duodenal bulb to acid over 24 hours is
thought to be prolonged.
STUDY III
Assessment of the controls of gastric acid secretion m relation to
plasma gastrin, secretin, somatostatin and duodenal pH
The hypothesis (below) enabled this study to be set up to assess the
effect of the cephalic and gastric phases of gastric acid secretion on
the plasma gastrin, secretin and somatostatin, and duodenal bulb pH m
healthy subjects and patients with duodenal ulcer. The interrelationships
of these three hormones were also examined.
Hypothesis II: Antral pH regulates gastric acid secretion by neural and
hormonal mechanisms, and a low pH inhibits further acid secretion and
gastrin release ('Woodward et al 1954, Befrits, Samuelsson and
Johansson 1984 ). In addition, vagally-released somatostatin inhibits acid
secretion and gastrin release (Johnson and Grossman 1971 ). This latter
inhibition is diminished in patients with duodenal ulcer (Harty, ~:Jaico
and McGuigan 1986). Acidification of the duodenum causes inhibition of
gastric acid secretion and gastrin release (Bloom and Ward 1975). It
has been postulated that secretin release is impaired in duodenal ulcer
disease (Sainz et al 1985).

6
CHAPTER 2
MEASUREMENT OF DUODENAL pH:
A HISTORICAL REVIEW

2.1 INTRODUCTION
The literature is abound with studies of gastric acid secretion in
patients with duodenal ulcer~ but only more recently has the acidity
within the duodenal bulb been studied. The reason for this discrepancy
is that the anatomy of the stomach allows for easy acid measurement
and the gastric pH is reasonably constant, generally, showing rises
only at meal-times. However, the converse applies to the first part of
the duodenum.
The ulcer-bearing part of the duodenur11 is the bulb. It is only a f ev,
centimetres long, has a narrow lumen and due to muscular
contractions, can be extremely mobile. Within this short length,
neutralization of the acid occurs. This process is governed by a
number of factors (Figure 2.1 ): a) the acidity of the gastric contents;
b) the rate of gastric emptying; c) the secretion into the duodenal
lumen of duodenal bicarbonate, pancreatic bicarbonate and bile; d) the
admixture of these secretions with the gastric contents by retropulsion
of the former and propulsion of the latter; and e) outward diffusion
from the duodenum of hydrogen ions and carbon dioxide (Rune 1981).
These processes lead to an extremely steep pH gradient within the
duodenal bulb. Rhodes and Prestwich showed there was a difference
of almost 3 pH units between the apex of the bulb and the base
(Rhodes and Preswich 1966). This has been more recently confirmed
by Rune (1981). Due to the intermittent nature of gastric emptying and
duodenal secretion, the acidity is not constant and has been shown to
fluctuate w,idely, up to 6 pH units (Rovelstad, Owen and ~Yiagath 1952,
Aynaciyan and Bingham 1969, Hannibal, Remvig and Rune 1980, McCloy,
Vickery and Baron 1980, Hannibal and Rune 1983, Sekiguchi et al
1985). In contrast, the pH within the
7

z CO~----- 0 Z
2 en 0 ...J en :J ...J a. :J 0 0.. O:'. 0 0.. O:'.
1-w O:'.
HCO 3
bile
pancreas
duodenum
8
GASTRIC EMPTYING OF ACID
Figure 2.1 : Local factors that govern the neutralization of acid rn the
duodenal bulb

second part of the duodenum is relatively steady at pH 5.5 - 7.0
(Andersson and Grossman 1965, Archambault, Rovelstad and Carlson
1967, Rune and Viskum 1969).
For these reasons, accurate and reproducible measurements of the
ducdenal bulb pH have been extremely difficult to obtain. There are
three recognized methods of studying the duodenal acidity: namely
aspiration techniques with m vitro pH determination; m situ
measurement using intraluminal glass pH electrodes; and thirdly in situ
measurement with a radiotelemetry capsule ("radio-pill"). Aspiration
techniques involve intubating the duodenum with a fine-bore tube.
Accurate placement of the tube and especially maintaining its position
within the duodenal bulb 1s very difficult. The negative pressure
required to obtain a sample of duodenal content may in fact draw
further gastric acid into the duodenum and reflux additional bicarbonate
and bile from lower down in the duodenum. This may then provoke
further physiological responses and alter the natural situation. A
further disadvantage is that this technique is intermittent, as ccntinuous
aspiration, for reasons given abcve, would yield unphysiological
results.
In situ measurement using small glass pH electrodes allows far more
accurate determination of the acidity. This method was used for the
first time in the gastrointestinal tract by McClendon in 1915, when he
developed a hydrogen electrode made of platinum with hydrogen
bubbling around it (McClendon 1915a, 1915b, 1915c). It was, however,
too thick to be placed in the duodenum. Since then, giass electrodes
have been designed and perfected. They allow for continuous or very
frequent pH measurements in as physiological conditions as possibie.
For accurate measurements and precise reproducibility, the most
9

important technical problem, due to the steep pH gradient, is to
maintain the electrode at exactly the same position within the duodenal
bulb.
The third method of pH measurement is by radiotelemetry as first
described in 1957 (Jacobson and Mackay 1957). The pH of the study
site is transmitted to a receiving urit. The advantages over the other
two methods are improved patient comfort, no possible stimulatory
effects as there is no naso- or ore-gastric tube and it may measure
acidity at any site of the gastro-intestinal tract. However, the
accuracy is in doubt due to techn.ical and developmental problems, and
maintaining the position in the duodenal bulb is more difficult than
with an in situ electrode.
A detailed review of each of these three methods of duodenal pH
measurement is given in the following sections.
2.2 ASPIRATION TECHNIQUES
Examination of the gastric contents was first perf armed by Kussmaul
in the 1870's, and later repeated by such workers as Ewald, Boas and
Leube ( cited in Einhorn 1910a). As the importance of the role of the
duodenum in the digestive process became increasingly evident,
attempts were made to study the duodenal contents.
Professor Einhorn, in 1908, constructed a "duodenal bucket" in order
to sampie the contents of the duodenum, and iater used this in the
diagnosis of ulcers (Einhorn 1909). However, in the following year, in
a paper presented to the Clinical Society of the German Hospital and
Dispensary, he alluded to the difficulties encountered whilst measuring
1 0

the duodenal aspirate (Einhorn 1910b). His earlier experiences with
the duodenal bucket and the aspiration catheter yielded unfavourable
results due to both the admixture of the duodenal aspirate with
stomach content, and the small volumes that could only be obtained. He
constructed an aspiration instrument specific for the task, the
"duodenal pump" or "digestive juice aspirator". It consisted of a small
perforated metal capsule attached to a thin rubber tube wJ:iich in turn
was connected an aspiration syringe. Confirmation of correct duodenal
position was made by the using radiography, aspiration, and the miik
test (aspiration performed after three swallows of milk). The
resultant aspirate from the duodenum was tested with litmus paper and
"usually" found to be faintly alkaline. On two occasions, however, a
positive hydrochloric acid (HCl) reaction was obtained in confirmed
duodenal contents.
Seven months later, Einhorn reported his results of the duoden2l
samples from 40 patients with various gastro-intestinal and hepatic
disorders (Einhorn 1910a). In these patients, he siphoned the duodenal
contents after an initial aspiration rather than using his former
technique of continuous aspiration. Five patients were found to have
acidic contents; three of these also had free HCl in the duodenum.
The samples from the remaining patients showed alkaline reactions on
litmus paper, the degree of which varied.
Continuing his investigations with the duodenal pump, Einhorn sought to
record the influence of various foods and drugs on the duodenal
contents /T'""• 1 1._cmnorn and Rosenbioom 1910). In the fasting state, all 4
patients showed a neutral pH. The ingestion of meat extract or tea
produced acidic duodenal fluid in 5 of the 22 tests pcrf ormed. He
later investigated changes in the characteristics of the duodenal
11

contents that accompanied gall bladder disease (Einhorn 1918) and
noted the colour, bile and pancreatic enzymatic content. During this
period, McClendon had developed his hydrogen electrode for
intraluminal pH monitoring (McClendon 1915a), and he plotted the
curves of pH levels in the stomachs and duodena of adults and infants
(McClendon 1915c).
The influence of pyloric motility on the duodenal pH was proposed by
Myers and McClendon when the latter author swallowed the Einhorn
duodenal tube (Myers and McClendon 1920). The first part of the
duodenum was studied for three to four hours after a meal. The mean
duodenal pH was approximately 7.0, but ranged between 3.20 and 7.82,
and sharp fluctuations in the pH from strongly acidic to strongly
alkaline were seen. The preponderance of acid peaks \Vere thought to
be due to the intermittent spurting deli very of gastric contents into the
duodenum. This was confirmed in later years by Bircher et al
(Bircher et al 1965) using simultaneous cinefluorography and pH
monitoring with an in situ glass electrode. The same authors
(McClendon et al 1920) went on to investigate the rest of the small
bowel to dispell the "prevalent erroneous impression that the intestinal
content is alkaline". With the duodenal tube in situ for 4 days, they
reported the pH to range from 4.1 to 6.5. Fifteen years later, a paper
from Philadelphia reported a more extensive investigation into the
analysis of small bowel contents (Karr, Abbott, and Sample 1935) and
showed similar results. Using a double-lumen tube, they studied the
whole of the small bowel. The duodenal pH varied between 4.7 and
6.5, and specimeas of pH 4.8 were obtained on occasions as far
distally as the ileum. The exact site of aspiration within the duodenum
was not, however, noted.
12

The technique of fractional examination of the duodenal content was
performed by Einhorn in 1921 when he aspirated the duodenal fluid of
40 peptic ulcer patients every 30 minutes for a two hour period
following a test meal of meat extract (Einhorn 1921). This method of
sampling and analysis was also employed in two other studies of the
same time (Friedenwald and Sindler 1921; McClure, Montague and
Campbell 1921). Of the 19 patients with duodenal ulcer, 8 (42.1%)
were found, intermittently, to have acidic duodenal aspirates. Four
patterns of fasting and post-prandial duodenal pH emerged to subdivide
the patient population, and ranged from always alkaline to always acid.
It was thought that the prevalence of acidity in the duodenum was due
to the fact that some peptic ulcer patients suffered from a disorder
of acid neutralisation.
Following on from the work of Myers and McClendon, Okada and
Arai examined 15 patients (none of whom had duodenal ulcer disease)
while fasting and after various meals ( Okada and Arai 1922). The
post-prandial time interval ranged from half an hour to six hours, and
an Einhorn duodenal tube was used for the aspiration. The fasting
duodenal pH varied from pH 6.59 to 7 .90, and dropped to 4.80 - 5.97
during the first two hours after eating. Thereafter, the pH returned
to vary between 6.05 and 7.95. Free hydrochloric acid (pH <4) vrns
not encountered. They concluded that there was no special relationship
between the acidity of the gastric and duodenal contents. A further
study regarding the effect of a meal on duodenal pH was carried out
in Boston (McClure, Montague and Campbell 1924 ). The responses to
protein (edestin), fat (olive oil) and carbohydrate (arrowroot starch)
and a mixture of these was determined in four volunteers. The
duodenum was siphoned through a duodenal tube, the tip of which was
positioned in the proximal end of the second part of the duodenum, and
1 3
the pH of the sample was determined externally using a hydrogen
electrode. The fasting duodenal pH was found to range between 6.7
and 8.1. The meal produced very little change in the pH which ranged
from 6.0 to 7 .8, and thirty minutes after the meal, between 6.0 and
6.8. The ingestion of protein produced an acidic duodenal sample, in
contrast to the alkaline pH that was associated fat or carbohydrate
ingestion.
One disadvantage of the Einhorn duodenal tube, was the long time
required to intubate the duodenum, and then to maintain th.is position.
On occasions, it took up to two hours or longer. :Morton reported a
low rate of successful duodenal intubations using a Rehfuss tube in
patients with duodenal ulcer (Morton 1929). He was only able to pass
the tube through the pylorus in only eight of his twenty three patients.
Because of this, Richards designed a modified tube and described its
use with a somewhat altered intubation technique (Richards 1929). He
claimed that adequate sampling of the gastric, duodenal and biliary
secretions was possible in half an hour, and fluoroscopic localization
was not necessary. However, there are no readily available subsequent
reports in the literature describing the use of this modified duodenal
tube.
The pathogenesis of peptic ulcer disease was investigated
experimentally in normal dogs by Morton, in 1927. He demonstrated the
formation of peptic ulcers at sites in contact with gastric acid
following the withdrawal of alkaline secretions. He concluded that
there was some relative balance at the pylorus bet,.veen the acidity of
the stomach and the alkalinity of the duodenum. \Vith these results, he
went on to study patients with and without peptic ulcer (Morton 1929).
Two Rehfuss aspiration tubes were used; the first in the duodenum,
14

the second in the stomach. The positions were checked by fluoroscopy
and maintained by keeping the patient lying on his right side. A Ewald
test meal of two slices of bread and a glass of water was served and
apirations made for approximately one hour afterwards. The results
were reported not as pH but rather as "acidity per cent". The
duodenum of th.e control group was found to be of low and relatively
constant acidity, whereas wide variations in the amounts of free
hydrochloric acid were encountered in the stomach. In contrast,
patients \Vith peptic ulcer showed higher and wider variations of
duodenal acidity, as well as the presence of free hydrochloric acid in
the duodenum. The gastric acidity of these patients was similar to the
control group. The absence of free hydrochloric acid in the duodenum
of the normals confirmed the hypothesis that complete neutralisation of
gastric acid normally occurs in the duodenum, and Lliere appeared to be
a relative acid-alkali imbalance in patients with peptic ulcer,
seemingly due to an abnormality of the pylorus. Five years later.
Morton confirmed the relationship between pyloric dysfunction and
duodenal ulcer disease (Morton 1934 ). In a study with dogs, he showed
that experimentally produced pyloric dysfunction was associated with
the subsequent development of duodenitis.
The importance of acid in the pathogenesis of peptic ulcer disease
prompted '\Vinkelstein to propose that gastric acid was most harmful
when undiluted by other secretions and foodstuffs (vVinkelstein 1935).
He studied nocturnal interdigestive gastric secretion of 169 subjects
( of these, 20 were controls and 62 were duodenal ulcer patients). The
group of normals exhibited small secretion rates, and 45% (9/20) had
no detectable free hydrochloric acid. In sharp ccntrast, 92% of the
duodenal ulcer patients showed abnormally high gastric acid secretion.
The two peaks of acidity amongst these patients occured at 9 pm and
15

1 am. and in six out of eight duodenal ulcer patients this nocturnal
acidity was not reduced by various pharmacological agents.
Kearney and colleagues noted the infrequent sampling rates of duodenal
aspiration recorded in previous studies, and the lack of correlation to
i;astric acidity (Kearney, Comfort and Osterberg 1941) . In their study
of seven normals and thirteen duodenal ulcer patients, they used a
technique of continuous aspiration of the second part of the duodenum
with pH determinations made externally by a glass electrode at two
minute intervals. They were thus able, for the first time, to plot the
pH profile within the duodenum. The control group experienced 18.2%
of the total duration of recordings at pH 4 or below, whereas this
figure was 70.2% in the patient group. The authors were able to show
that, in normal healthy volunteers, the neutralisation of acid within the
duodenum was both prompt and efficient, and the amount of gastric
acid entering the duodenum did indeed influence the pH of the latter.
However, their patient group showed a far more acidic duodenum, and
the longer duration of acid peaks was evidence of a lack of the same
duodenal secretory response as seen in the normals. They proposed
that the more acidic duodenum found in ulcer patients was due to a) a
larger acid load from the stomach, b) a deficiency of "neutralising
fluid", and c) a defective duodenal secretory response.
In 1942, Berk and co-workers (Berk, Rehfuss and Thomas 1942) re
emphasised the importance of acid in the aetiology of peptic uicer
disease, and stressed the need to investigate the simultaneous acidity
of the "ulcer-bearing area'' of the duodenum and that of the sr.omach.
In a group of 21 normal subjects, they used a specifically designed
double lumen tube to simultaneously aspirate, at ten minute intervals,
contents from the duodenal bulb and pyloric area. The study included
16

half-an-hour in the fasting state and two hours after an Ewald test
meal (toast and water). The mean intragastric pH ranged from pH
2.1 to 3.9 ( this low level of acidity was explained on the basis of
their inclusion of individuals with very low acid secretory levels).
The average fasting duodenal bulb pH was 5.6 (range 1.7-8.3), and
dropped to its lowest point of pH 3.8 ( range 2.2-6.8) fifty minutes
after tb.e meal. However, 31. 7% of the recordings were found to be
below pH 3.5 (the level the authors adopted for titratable free acid).
They concluded that the duodenal bulb is normally an acid area; the
neutralising ability in this area is ineffective at some time after a
meal; and gastric acidity is not a reliable index of duodenal bulb pH.
Further investigation of dual gastro-duodenal acidity was reported
from the same centre (King, Comfort and Osterberg 1944 ). They used
the same double-lumen tube and continuous aspiration technique to study
the effects of various drugs on the gastric and duodenal acidity m
three normal volunteers. The mean duodenal pH was higher than m
their earlier study and varied between 7.53 and 7.70. The intragastric
pH was lower and ranged from 1.50 to 1.70. On aspiration of the
duodenal content alone, allowing for its admixture with entering gastric
juices, the pH dropped to a mean of 5.53. Intravenous secretin
produced the greatest increase in the volume of duodenal contents, and
raised the pH to 8.45. This latter finding stimulated thought of the
possible value of secretin in the treatment of duodenal ulcer, a point
taken up 22 years later by Grossman (Grossman 1966).
Leng-term, 24 hour, simultaneous aspiration of gastric and duodenai
bulb content enabled Atkinson and Henley to demonstrate, for the first
time, the temporal relationship of the gastric and duodenai acidities
(Atkinson and Henley 1955). Mean intragastric acidity was higher
17

during the day in patients with duodenal ulcer, compared to normals,
but nocturnal levels were slightly lower. Although the acidity of the
duodenal bulb was higher than expected, it was not found to decrease
at night.
Although, by the mid-1960's, reliable glass electrodes had been
designed for in situ pH measurements, aspiration techniques were still
frequently used. Rune, from Copenhagen, assessed the value of the
post-prandial acid-base status in the duodenum for investigations of the
acid neutraiisation processes (Rune 1972). Aspirations from the second
part of the duodenum showed a significantly lower mean pH in
duodenal ulcer patients during the early post-prandial period compared
to normals, and the significantly higher Pco2 levels in the ulcer
patients showed a positive correlation with both the basal and peak
acid outputs. He concluded that the neutralisation capacity of the
duodenum in ulcer disease was not defective.
2.3 ELECTRODE TECHl'HQUES
At the same time as the aspiration catheters and techniques ~11ere being
refined, advances were made in designing an electrode to be used for
pH measurements of the gastrointestinal tract. The first description
of in situ pH measurement of the gastric content was made in 1915 by
McClendon (McClendon 1915a). He initially designed a hydrogen
electrode for measuring the hydrogen ion concentration of blood and
other body fluids. It consisted of a platinum foil and a small U-tube
of glass throl!g-!1 which hydrogen \Vas bubbled. He modified this
electrode so that it could be swallowed and used to determine the pH
of either the gastric or duodenal contents. The results, however, were
not as accurate as those obtained from larger electrodes, and reported
13

the pH of gasric juice as being "not far on the acid side of 4". The
measurements were recorded as hydrogen ion concentration and then
converted into the more convenient pH notation, although McClendon had
also designed a potentiometer that was able to read the pH directly
(McClendon 1915b). Using this electrode, he was able to draw the
acidity curves for the stomach and duodenum in adults and infants
(McClendon 1915c). Sampling cf the duodenum revealed a pH of
approximately 8.
Almost 25 years later, modification of an existing glass electrode was
made use of by Eyerly and Breuhaus for investigation into the
relationship between gastric acidity and protein digestion (Eyerly and
Breuhaus 1939). The electrode was relatively smail, 2.75 cm. long and
10 mm. in diameter, and had a liquid junction of saturated potassium
chloride solution to the calomel reference electrode. The end of this
liquid junction was placed 10 mm. above the glass bulb of the
electrode, •nhich was covered by a perforated hard rubber cap. The
presence of this shield around the bulb was found to produce a
considerable lag in the pH response of the electrode. Later, the
necessity of this cap became the subject of some dispute and was
finally dropped. Alongside the electrode was placed an aspiraticn tube,
and although no constant difference was encountered between the pH
re suits by aspiration and from the electrode, it was felt that
aspiration samples were not sufficiently accurate. In the following
year, Eyerly made a further minor alterations to the eiectrode design
(Eyerly 1940). A soft rubber shield replaced the firm one and, 4 cm.
distally, a small metal weight was attached to the assembly. The
weight facilitated entry into the duodenum and acted like an anchor to
maintain the position. This type of design provided the most
physiological method of in situ pH measurements and has been adopted,
1 9

with minor modifications, for present day studies. Eyerly studied the
gastric antrum, duodenal bulb and distal second part of duodenum of
two normal volunteers, and the pH was measured every 5 minutes
over a two hour period. The fasting pH in the bulb and second part
were 1.30, 1.60 and 5.47, 5.96 respectively, and frequer.:.t m3.rked
swings in pH were noted. These fluctuations were of particular
interest and were found to occur both in the fasting state and during
antacid therapy. Of the various antacid preparations studied,
magnesium trisilicate and aluminum hydroxide yielded the greatest pH
rise. Later studies (Rovelstad, Owen, Magath 1952; Rovelstad and
Maher 1962) were unable to confirm the magnitude of these pH rises.
The earlier studies utilized the calomel reference cell positioned on
the skin of the patient, usually the finger. This, however, produced
fluctuations in the measured pH of up to one pH unit due to
differences of potentials between skin and the gastro-intestinal tract,
and it was open to varying and unmeasured errors (Rovelstad, Owen
and Magath 1952; Andersson and Grossman 1965). Using a shielded
glass electrode and both cutaneous and enteric reference cells,
Rovelstad, Owen and Magath (1952) showed that more accurate results
were obtained by placing the reference cell alongside the electrode in
the stomach. The glass electrode was preferred as the hydrogen
electrode was f ocnd to alter the composition of the test solution and
the antimony electrode, described earlier (Kreiter and Pantlischko
1949), required elimination of dissolved oxygen and iaborious
standardization. Rovelstad went on to study the in situ gastro-duodenal
pH in 21 patients with and 23 without duodenai uicers (Rovelstad
1956). He selected the mid-point cf the second part of duodenum and
found that, aithough both groups demonstrated similar mean fasting
ducdenal pH levels, administration of histamine produced a
20

,,
significantly more acidic duodenal milieu in the ulcer patients than the
non-ulcer patients. He concluded that ulcer patients suff erect a
defective neutralization mechanism.
A further study from the same centre reported on the effect of diet,
antacids and anticholinergics on intragastric and intraduodenal pH in
patients with duodenal ulcer (Rovelstad and Maher 1962). Two
unshielded glass electrodes were used on this occasion. The fasting
duodenal pH was approximately 6, with only minor variations, and a
meal of bland food produced a significant fall in the pH to below 3.5.
This occasionally decreased further to pH 1.5, within 15 to 90 minutes
of eating. \Vide fluctuations were noted and these were considered to
be true pH changes, not artif actual recordings of an unshielded
electrode. Milk · and antacids elevated th.e post-cibal pH to above 5,
whilst anticholinergics also raised but stabilized the intraduodenal pH.
This latter finding suggested the influence of the gastric emptying rate
on duodenal pH; the hypothesis being strengthened by the results from
the same centre (Bircher et al 1965) shown by simultaneous
cinefluorography and pH monitoring.
Being concerned about the accuracy of the pH recordings, Tomenius
and Williams modified existing methods and 11sed this to investigate the
efficacy of some antacids (Tomenius and Williams 1960). Although the
advantages of having the reference electrode in close proximity to the
intra-luminal pH electrode had previously been described, the inside of
the patient's mouth was selected as the site of the reference cell. A
slight change in the patient's position produced a change in the pH
reading. As the mucous membrane of the gastro-intestinal tract had
been shown to be cf approximately pH 7.0 ( confirmed again later in
1965 by Bircher et al), the unexpected fluctuations of recorded pH
21

were thought to be due to the contact of a bare electrode with the
luminal surface of the gastro-duodenal region. For this reason, the
glass tip of the pH electrode was shielded by a rubber cap. In
contrast to earlier studies, their preliminary experiments showed that
such a shield did not hinder the recordings of the electrode and did not
clog with mucus. This question of whether the electrodes should or
should not be shielded was taken up five years later by Rovelstad's
group (Bircher et al 1965). In the study of first 4 dogs and then 31
duodenal ulcer patients, the pH of the duodenum was recorded by two
pairs of bare and shielded electrodes. The bare electrode showed
"inconsistent" and frequent pH fluctuations which seemed to be
associated with respiration, heart beat and peristalsis. However, the
range of duodenal pH was noted between 1.0 and 7.5. The shielded
electrode, on the other hand, produced a narrow pH range which was
low and stable, and in agreement with the results of Tomenius and
Williams (Tomenius and Williams 1960). This led the authors to
believe that more meaningful results were obtained with these
electrodes rather than with the bare unshielded electrodes. This,
however, appeared in contradiction to their earlier beliefs (Rovelstad
and Maher 1962). The vote for shielded electrodes was further
endorsed by Andersson and Grossman who also felt that bare
unshielded electrodes produced artefactual recordings (Andersson and
Grossman 1965).
Previous studies had not been able to identify the position of the
pylorus, as no manometrically defined area could be found and the
wide fluctuations in measured pH were unsatisfactory. The previously
recorded iow levels of bulbar pH (Tomenius and Williams 1960,
Rovelstad and Maher 1962) were considered doubtful due uncontroiled
maintainence of the electrode's exact position within the duodenum.
22

Andersson and Grossman developed a method of measuring intraluminal
electrical potential difference (PD) and identified the location of the
gastro-duodenal junction by changes in the transmural PD. A well
defined change in the PD to a more negative value was observed as
the duodenum was entered (Andersson and Grossman 1965). They also
measured the duodenal pH with shielded electrodes and found a
relatively steady pH range (6.5 - 7.5) with less than one pH unit of
fluctuation. The pH of the duodenal bulb, however, was more closely
related to the antral pH except when the latter showed a pH of above
3.5. They also noted that a steep pH gradient existed between the bulb
and the rest of the duodenum. This latter finding was elegantly
documented a year later by Rhodes and Prestwich (Rhodes and
Prestwich 1966).
In a detailed study using the antro-cutaneous and duodena-cutaneous
transmucosal potential differences, Archambault and co-workers were
able to accurately locate the pylorus (Archambault, Rovelstad, Carlson
1967). A PD of more than 15 mv indicated the entry into the
duodenum.
An alternative method of localizing the exact position of the duodenal
bulb and pylorus was reported by Rhodes and co-workers (Rhodes,
Apsimon, Lawrie 1966). Using a combination of two glass electrodes,
4 cm. apart, they found that the gastric antrum pH was relatively
constant at approximately 2.0, whereas that of the duodenal bulb either
. fluctuated widely or was nearer neutral. Thus, as the pH tracing
changed from being constantly acid, they were able to infer that the
distal electrode had entered the duodenum. The positions were checked
with fluoroscopy and contrast material outlining the pylorus. Orad
traction on the electrode assembly ensured the proximal electrode

remained in the antrum. A small mercury-filled bag was attached to
the distal electrode to assist in passage through the pylorus and the
effect of peristalsis on this bag maintained a caudal pull on the
assembly. In contrast to Tomenius and Williams, they found that the
shield around the electrode became blocked with mucus ar.d interfered
with the pH measurements. For this reason, they suggested that it not
be used. The duodenal bulb pH was recorded over a twelve to eighteen
hour period, and included the nocturnal measurements. The post
prandial pH fluctuations, initially small, were increased and irregular
at one hour after the meal, and continued for longer in duodenal ulcer
patients ( up to six hours). ·with the two electrodes closer together
9.25 cm. apart), Rhodes and Prestwich clearly documented for the
first time the steep gradient of pH within the duodenal bulb (Rhodes
and Prestwich 1966). The average pH at the base was 3.3 and that of
the apex was 5.1. No difference v1as found between duodenal ulcer
patients and controls, although the duration of acid exposure ( time <pH
2.5) was longer amongst the patient group. The importance of
maintaining the exact position of the electrode within the duodenal bulb
became increasingly evident.
Earlier m 1965, Nioore and Scarlata eluded to the controversy
regarding the lack of a clear relationship between pH and hydrogen
ion concentration ( free acid) (Moore and Scarlata 1965). They noted
that, by definition, the pH related to the negative logarithm of the
hydrogen ion concentration, whilst the pH as measured by the glass
electrode related to the negative logarithm of the hydrogen ion activity.
They introduced a small activity coefficient and we':e able to
demonstrate the· accurate conversion of gastric acid pH measurements
into true hydrogen ion concentrations. In a subsequent paper, lVIoore
24

published an extensive conversion table of pH values into hydrogen ion
concentration (Moore 1968).
The fluctuations in duodenal pH were considered to be due to the
pattern of gastric emptying. This hypothesis was examined by using
air-filled balloons to exert antral pressure (Rhodes, Goodall, Apsimon
1966). It was found that an increase in the antral pressure was
usually associated with a drop in the duodenal pH, but for the first
21 / 2 hours after eating, the duodenal pH decreased without any
increase in antral pressure. Reflux from the second and third parts of
the duodenum ·Nas shown to produce an elevation of the bulb pH.
The problems associated with m situ gastro-intestinal pH
measurements were becoming increasingly evident. To summarize:
a) the size of the electrode required to be suitable for in situ use.
b) the varying membrane potentials across the gastric and duodeaal
mucosa ranged from -30 to +30 m V and produced errors in the
measured pH values.
c) the pH of the mucosa and that of the intraluminal fluid varied up
to 7 pH units.
d) in view of this latter finding, a shield around the glass tip of the
electrode was considered preferential. But the shield was found to
clog with mucus and interfered with the pH measurements.
e) the siting of the reference electrode on the periphery ( skin or oral
mucous membrane) was liable to produce inaccurate pH readings.
f) the steep pH gradient within the duodenal bulp necessitated the
accurate placement of the electrnde and maintenence of this position.
In conjunction with a Danish company and bearing these problems in
mind, Rune developed an electrode for in situ measurement of gastro-
25

intestinal pH (Rune 1968). It was small enough to be passed nasally,
and although contraversial, had a shield of flexible nylon threads
surrounding the glass tip. It also incorporated a potassium chloride salt
bridge between the reference electrode and the gastro-intestinal fluid
enabling the liquid junction to be close to the glass electrode. This
negated the differences in transmucosal potentials. The electrode was
able to measure the change in potential between the reference
electrode alogside and a second cell placed on the skin. An abrupt 25 -
30 m V change in potential signified the glass electrode's position in the
duodenal bulb. Using this electrode, duodenal ulcer patients and controls
of similar gastric secretory capacity were studied (Rune and Viskum
1969). It was found that there was no significant difference between
the two groups in the fasting or post-prandial duodenal pH, and the
frequency of pH fluctuations of the control group was similar to that
of the patients. These results appeared to show that duodenal ulcer
patients had a sufficient duodenal secretory capacity of t>icarbonate, in
that the acid neutralization in the duodenum was similar to normals. It
is important to note that the second part of the duodenum was studied,
and not the ulcer-bearing bulb.
A study from Birmingham (Benn and Cooke 1971) compared the
results of shielded and bare electrodes and found no satisfactory
agreement between the two sets of readings. On withdrawal of the
electrodes, the wire shields were heavily coated with thick mucus and
this resulted in a significantly lower pH value when compared to
samples tested after aspiration.
A new method of long-term intraluminal pH monitoring was introduced
by McCloy, Vickery, Manjil and Baron in 1978 (McCloy et al 1978).
They used two glass electrodes in series attached distally lO a
26

weighted bag and employed the principle described by Rhodes and co
workers (Rhodes, Apsimon, Lawrie 1966) to maintain the position
within the duodenal bulb. The pH data was logged in digital form,
transferred to punched paper tape and analysed on a computerised
system. A fuller account of their method was reported two years later
(McCloy, Vickery, Baron 1980). The stability of the electrode position
was confirmed during a 5 hour test. Unshielded electrodes were used
and, although mucus was found to coat the glass tips, the response
time was unaltered and changes of 0.04 pH units were encountered
after washing. This effectively ended the controversy of the use of a
shield around the electrodes. Punch tape was chosen for data storage
as, with a sampling rate of every 5 - 10 minutes, it could easily
accommodate the numerous recordings. The previously noted peaks of
acidity were confirmed and found to last on occasions only a few
seconds.
Further use of a computerized system was described in the same
year, and the pH sampling rate was increased to be at every half
second (Hannibal, Remvig, Rune 1980). This was later elaborated on
by Rune (Rune 1982). Further attention was turned to the problem of
electrode placement within the duodenal bulb (Hannibal and Rune 1983).
They strapped four pH electrodes together at 1.5 cm. intervals and by
observing the analogue tracings from these electrodes, they were able
to identify the exact positions of each electrode within the "antro
pyloro-duodenal" channel. Fourteen healthy volunteers were studied for
6 to 8 hours to record the pattern of duodenal pH changes. Great
individual variation in pH fluctuations '\vere seen, except for during the
early post-prandial period. The steep gradient of pH between the
proximal and distal bulb was confirmed and became more obvious
when the values were converted to mean acidity.
27

The dual pH electrode system, with a sampling rate of every 10 or 20
seconds, was used in 11 ulcer patients and 8 volunteers in a study
investigating duodenal pH changes after a meal, smoking and
cimetidine (McCloy, Greenberg, Baron 1984). The mean duodenal pH
was similar for both groups, but ulcer patients experienced
significantly greater (11.8%) acid exposure at pH <4 than did
volunteers ( 6.2%). Interestingly, the patients showed significantly
longer alkalinization (63.3%) at pH >6 than volunteers (57.9%). The
meal produced the same changes in pH in both groups.
The role of interdigestive gastro-duodenal motility and gastric acid
delivery into the duodenum was investigated in an elaborate study from
Japan ( Sekigt:chi et al 1985). They measured simultaneously the antral
and duodenal bulb pH and the intraluminal pressure activity at six sites
in the stomach, duodenum and jejunum. The motility was shown to be
in three phases and the pH fluctuations were related to these phases.
Phase I, associated with near neutral pH, was a quiet phase and of
shorter duration in duodenal ulcer patients. However, Phase II was
considerably longer in these patients and consisted of irregular
contractions, and the emptying acid into the duodenum. During this
phase, the duodenal pH fluctuated widely. The strong regular antro
duodenal contractions of Phase III were absent in patients with
duodenal ulcer.
Two further studies from Rune's unit ( Ovesen et al 1986, Bendtsen et
ai 1986) described the addition of two more eiectrodes to the four
electrode syste!Il. Computerized sampling was set at once every second
for a digital pH record and simultaneously an analogue reading was
obtained. The 31;2 hour study, that included a milk meal, showed no
28

difference in the intraluminal duodenal bulb acidity and duodenal
neutralization between control subjects and duodenal ulcer patients.
The technical and methodologicai problems associated with duodenal
bulb pH measurements were finally being solved. Long-term studies
appeared possible and were needed to investigate the normal 24 hour
fluctuations in duodenal bulb pH. Armed with such results, the
pathophysiological situation in duodenal ulcer disease could be studied.
2.4 pH MOI\11TORING BY RADIOTELEMETRY
The mechanisms within the bladder during micturition stimulated
thought of the possibility of a radio transmitter that could be placed
within a person to relay the necessary information. Mackay and
Jacobson designed such a radio pill, or "endoradiosonde'', which being
28 by 9 mm. in size, could easily be swallowed and was found to
operate successfully within the gastro-intestinal tract (Mackay and
Jacobson 1957). It relayed pressure data by changes in frequency, and
temperature data by the rate of transmission of energy pulses. This
radio pill was modified with a glass electrode to become the first
pH-sensitive telemetry device described (Jacobson and Mackay 1957),
and the pH was transmitted as a frequency-modulated signal. The
response time was slow and it was of poor accuracy.
Using an antimony electrode as a pH transducer, Noller designed a
radio pill which became known as the Heidelberg capsule (Noller
1960). It consisted of a high frequency transmitter and a silYer
chloride reference electrode. The frequency change was linear over a
pH range of pH 2 - 7, and was accurate up to 0.5 pH units. Nailer
used this capsule as part of the gastric function tests; principally as a
29

marker of the end point of gastric acid neutralization of
intragastrically instilled bicarbonate. ConI1ell and Waters assessed the
accuracy and efficiency of the Heidelberg capsule in vitro and
evaluated its clinical application (Connell and Waters 1964 ). They
found a good correlation between the values for gastric acid secretion
obtained by aspiration 15 - 30 minutes after histamine and those
obtained by the pH capsule during the following 15 minutes. It was
able to distinguish between high and low rates of gastric secretion and
was clearly more comfortable to the patient than a naso-gastric tube.
Stack later evaluated the use of the capsule in routine measurement of
gastric acid secretion and found that, although it detected extremes of
secretion, it was not accurate for minor changes in acid production
(Stack 1969).
Watson and Paton, from Glasgow, were the first to describe the use
of the Heidelberg capsule for measuring specifically the pH of the
small bowel (Watson and Paton 1965). The pH of the proximal
jejunum was measured over a four hour period: mean fasting pH was
5.2 (range 3.1 - 6.8); post-prandial pH changes of 0.5 pH units.
Maxwell, Ferguson and Watson also reported their experiences in
monitoring jejunal pH (Maxwell, Ferguson, Watson 1971). A study
from Japan used an untethered radio piil to monitor the pH changes
from the stomach aborally through the small intestine (Kitagawa et al
1966).
Three years later, Aynaciyan and Bingham tethered the Heidelberg
capsule to a thin tape so as to measure the pH of the proximal
duodenum (Aynaciyan and Bingham 1969). They compared the results
of duodenal ulcer patients with those of normals and found no
30

significant differences. The disadvantages of the capsule were the
inaccuracy at levels pH <2 and >7, and a longer lag response,
The antimony electrode was found to deteriorate rapidly in the
presence of oxidising agents in the body and this made it unsuitable
for long-term studies ( Colson et al 1981). The glass electrode was
more accurate and stable, and had an in vivo operational life of one
month. The problem of signal loss was overcome with the use of 2 or
3 orthogonal aerial loops and an aerial switching unit. \Vatson
commented on this latter problem (Watson 1981), and it would appear
that the problem of tracking a free-floating radio pill in order to
maintain the correct signal strength had not been completely resolved.
A further unsolved problem is the ability to maintain the position of
the capsule in a certain area. Most of the studies had been performed
with untethered capsules and maintaining it in the stomach was ensured
by correct positioning of the patient. This is borne out by a recent
study assessing the effect of antacids on gastric pH ( 0 'Sullivan,
Harrison, Bullingham 1984). For duodenal measurements, the capsule
required to be tethered and control of placement and maintaining this
is far more difficult than with pH electrodes attached to naso- or
orogastric tubes.

CHAPTER 3
24 HOUR AMBULATORY DUAL GASTRO-DUODENAL pH
MONITORING USING A COMPUTER-BASED SYSTEM
METHODS: DEVELOPMENT AND VALIDATION
32

3.1 THE pH MOI',lTORING SYSTEM
The pH monitoring system consisted of two pH glass electrodes which
were connected to a portable pH microlog receiving unit.
Radiotelemetry techniques were not employed due to the difficulties in
placement that have been aluded to in Chapter 2.
3.1.1 THE pH ELECTRODES
The pH electrodes, selected for this investigation, were combined
micro pH glass/reference electrodes (GK2801C, Radiometer,
Copenhagen, Denmark) (Illustration 3.1). Their srP-all size, being 4.5
mm in diameter and 25 mm in length, made for easy insertion and
passage th.rough the pylorus. The electrode consisted of a pH-sensitive
glass bulb and, separated by glass fibres as a liquid junction, a built
in silver/silver chloride reference electrode (Figure 3.1). This "built
in" reference electrode obviated the necessity for an external
reference lead to the subject's skin, improved the reliability, and
minimized electrode drift of the recordings. It also enabled the
calibrations to be performed on the laboratory bench without requiring
the test subject. A IM solution of potassium chloride, approximately 30
ul in volume, saturated the reference electrode.
Each pH electrode was connected to a 1 mm diameter cable, 2.5 m m
length, which was covered with a protective silicone tube. This
covering served to prevent against external electrical interference as
well as cable damage in the patient's mouth.
Changes in temperature affect the pH readings of the electrodes and,
for this reason, calibration of the
33

34
Illustration 3.1 Combined micro glass/ reference electrode

35
Figure 3.1 Combined micro pH glass/ reference eiectrode

electrodes before and after each study was performed in buff er
solutions equilibrated m a waterbath at 37°C. However, the
intraluminal temperature of the gastro-duodenal segment is relatively
constant (nocturnal variation <1 °c) and the temperature of foodstuffs
entering the stomach rapidly equiiibrates with body temperature. Thus,
minor temperature changes were considered to have a negligible effect
on the pH readings. The electrodes were, however, responsive over a
temperature range of O - 60°C.
Prior to the start of each study, the microlog rece1vmg unit was
calibrated by placing the two electrodes in buffer solutions of pH 7.0
and 4.0 ( see Section 3.1.2 below). This was repeated at the end of
the study so as to check if any drift in the electrode response had
occurred. Such drift in the pH reading did sometimes occur, although
it was usually very small and did not appreciably alter the recording
over the twenty four hour study period. Larger d:-ifts we:-e most
commonly due to potassium chloride depletion of the reservoir
surrounding the reference electrode. This was avoided by regular
weekly flushing and refilling of the reservoir. The 0H1er major cause
of faulty readings from the electrode was damage to the wires
connecting the electrodes to the receiving unit. This was due firstly to
the delicate connection between the electrode wires a1;.d the female
plug which attached to the receiving unit. The wires were of one
millemeter diameter which made soldering of the plug difficult.
However, stability of the connection was achieved by covering it with
heavy duty rubber and looping the wire around the plug. This produced
sctisfactory results, and, as an adcleu pr·ecaution, tbe study subject w&..s
asked to take care of the connection on each occasion. The second
cause of damage was due to the patient accidently biting on the wires
whilst eating. This problem was overcome by ensuring the wires
36

looped lateral to t.'le upper set of molar teeth. In two patients the
wires were severely damaged due to grinding of teeth during sleep and
this resulted in one set of eiectrode wires being severed.
3.1.2 THE pH MICROLOG RECEIVING UNIT
The pH microlog receiving unit was designed and manufactured by the
Department of Medical Physics at Ninewells Hospital & Medical
School, Dundee (Illustration 3.2). It was the latest prototype of
recording units modified from an existing system which was originally
designed for pH monitoring from a single source. This modification
entailed the insertion of dual electrode monitoring facilities. The two
input electrodes were referred to as the proximal and distal
electrodes. The unit contained an 8-bit CMOS ( complementary metal
oxide semi-conductor) Motorola microprocessor which co-ordinated and
executed all functions. The machine code programme was held in
CMOS "read only memory" (ROM). The input from fae pH electrodes
was an analog signal, the voltage of which was proportional to the
measured pH. This voltage was amplified in the receiving unit,
filtered then converted to an 8-bit binary value by an analog-to-digital
converter (ADC). In order to restrict these digital readings to the
working range of the logging unit, the signal was corrected according
to the calibration values recorded at the beginning of each study. The
pH reading was then entered into the digital memory of the unit. The
present unit had a memory capacity of 16 kilo bytes, but due to
software limitations, each study in this present work utilised just over
half of this memory space.
The timing of the pH sampling was controlled by a calender-clock
integrated circuit incorporated into
37

Illustration 3.2 : pH Microlog receiving unit and 4 button
detachable keypad
38

the unit. This also enabled the current date and time of day to be
logged. The power source of the unit was six rechargeable nickel
cadium batteries ( 1.2 volt) which provided adequate and steady power
for up to five days between charges.
The front of the logging unit had a liquid crystal display screen,
which was able to display a message of up to thirty-two characters.
On this screen were shown the current time of day, dual mode of
sampling, and the voltage from the proximal electrode in digital form
with a range of 000 to 239. Next to this screen, was the "event"
button. vVith the receiving unit operating in the logging mode, the
"event" button, when pressed by the study subject, started a sequence
of four events - a) Had pain, b) Lay down, c) Stood up, d) Ate meal.
This allowed the subject to indicate, during the recording, changes in
posture and times of meals or drinks. Having pressed the button, the
appropriate message was selected by pressing the button a second
time. The information was immediately logged into the unit's memory,
between data points from the two electrodes. For the present
investigation, the subject was instructed to utilise "Lay down" when
going to bed at night, and "Stood up" when getting up in the morning.
This allowed dear separation of the daytime and nocturnai recordings.
The function mode of the receiving unit was controlled by a detachable
four-button keypad (Illustration 3.2), which was used at the: start and
end of each study. There were five function modes:
a) Idle mode: This was the unit's "off" mode and the mode
during which recharging of the batteries was undertaken.
b) Set-up mode: This allowed for the receiving unit to be pre
set according to the parameters of each study. This included the
source of input (pH electrode or radiotelemetry capsule), single or
39

dual sampling, parameters of time (year, month, day, hour, minute),
sampling rate ( range from every one to fifty nine seconds), and
setting of the upper limit of the data boundary.
c) Calibration mode: Both electrodes were first placed in
buffer solution of pH 7 .0 at 37°C and with the unit switched into the
calibration mode with sampling rate at once every ten seconds,
calibrating recording comm ens ed. The final ( tenth) reading from the
proximal electrode was stored in the unit's memory as the calibration
value for pH 7.0. The electrodes were then placed in buffer of pH
4.0, and the calibration process continued. Again the final reading was
stored as the calibration value for pH 4.0. After this final recording,
the unit automatically switched into the idle mode, and was ready for
use. For the "end" calibrations at the termination of each study, the
electrodes were placed again in the two buffer solutions ( first buff er
pH 7.0). 'With the receiving unit switched to the logging mode, further
recordings were made for 3-5 minutes in each buffer solution.
d) Logging mode: In this mode, the voltages from the pH
electrodes were recorded and sto:red in digital form in the memory of
the receiving unit. Once turned on, the keypad was detached, and
reapplied to end the study period to switch the unit into the idle mode.
e) Signal mode: The unit was tuned for each electrode using
this mode by adjusting screws on the side of the box. A measure of
the signal strength was provided, with voltage readings being displayed
at once every second. The voltage of the buffer solution pH 7.0 was
near 40, whilst that of buffer pH 4.0 was approximately 120. This
mode of function was also used for the accurate placement of the
electrodes within the duodenal bulb, m combination with the
fluoroscopic screening ( see Section 3.3 below).

As the electrodes varied slightly in sensitivity, it was possible that
different pH readings from the same pH buffer solutions might be
recorded by the receiving unit. To minimize this discrepency, the unit
was tuned for each electrode in turn by using two controls: offset
control, which adjusted the absolute voltage recorded for a particular
pH; and gain control, which adjusted the voltage change between two
pH levels. With the first electrode placed in a buffer solution of pH
i.O, the voltage reading from the electrode was corrected by adjusting
the off set control. The voltage was then read with the same electrode
placed in buffer of pH 4.0, and the unit was calibrated to the correct
rise in response using the gain control. The procedure was repeated
with the second electrode. This was done as accurately as possible to
ensure the same voltage readings from each electrode in the same
buffer solutions. To reduce to a minimum the extraneous interference
in the electrode reading, the unit had a built-in filter with a time
constant of less than one second. This smoothed the signal and
produced a step response of approximately 80% in one second.
The size of the unit was 19 x 13 x 4.5 cm and, weighing only 720
grams, it was readily transportable. The unit was placed in a sleeve
which enabled it to be worn on a belt around the subject's waist for
the duration of the study. This ensured freedom of movement and,
with the electrodes in situ, the subject was able to resume normal
daily activities.
The sampling rate of the unit could be selected from a range of 1 to
59 seconds. Fer this present study, the rate was set at once every 20
seconds. The software limited the upper boundary of memory to 8200
data points which, over a 24 hour period, aliowed the fastest sampling
rate for dual monitoring to be every 20 seconds.
41

The main problem encountered with the receiving unit was one of data
loss. Fortunately, this rarely occurred. The first instance when this
might occur is when the batteries lose charge. To prevent this, the
units were recharged twice weekly, but due to the normal lifespan of
the batteries, loss of charge can occur rapidly with older batteries. If
for some reason, the computer is unavailable for data transference
and storage, the receiving unit should be connected to the recharging
circuit to guarantee against loss of battery charge and hence data loss.
The second cause of data loss occurs when a new calibration sequence
is started accidently before the recorded data in the unit's memory has
been transferred to the computer for storage. Initiating the calibration
mode automatically resets the unit's memory counter to zero. If this
occurs, the set-up mode is entered, and the memory boundary is
brought forward to its original point. The recorded data can then be
transferred to the computer for permanent storage.
3.2 RESPONSES OF pH MONITORING SYSTEM
The response of the electrodes in buffer solutions of pH 1.0 through
to pH 8.0 at 37°C was investigated in vitro. Beakers with buffer
solutions of pH 1.0, 2.0 to 8.0 (pH Buffers, Russell pH Ltd., Fife,
Scotland) were placed in a water bath at 370c and allowed to
equilibrate to temperature. The two electrodes then were placed
sequentially in each of the buffer solutions for a period of 30 minutes
and the pH recorded. The response in these solutions is shown in
Figure 3.2, and is a linear one.
42

= C. "'C Q) :;:. ... Q) .,, ..0 0
8.0
7.0
6.0
5.0
4.0
3.0
2.0
1.0
1.0 2.0 3.0 4.0 5.0 6.0 7.0 8.0
Buffer pH
Figure 3.2 Response of the electrodes in buff er solutions
43

The response of the electrodes and receiving unit together was
measured by placing one electrode in buffer pH 7 .0 and rapidly
plunging it into buffer pH 4.0 then back into buffer pH 7.0. The
sampling rate of the receiving unit was set at one per second. The
step response was exponential and almost symmetrical for the rises
and falls, measuring 90% in one second. Similar responses were
obtained with the second electrode.
3.3 In Situ PLACEMENT OF THE ELECTRODES
Two pH electrodes were used simultaneously, and they were strapped
together such that their glass bulbs were 9 cm apart. Initially, black
silk sutures were used to tie the electrodes and their leads together
but this caused irritation in the subject's pharynx on swallowing. The
sutures were replaced by small rubber bands ( originally designed to
cover the refilling hole over the KCl reservoir on glass electrode) and
this made the assembly infinitely more comfortable.
A small rubber bag, filled with 14 gm of mercury, was attached to
the distal electrode by means of a 20 cm length of fine PVC tubing
(Portex, London) (Illustration 3.3). The bag was made from three
finger tips of a surgeon's glove; each being individually tied to prevent
leakage. At the beginning of the study, the bag was dipped into molten
latex rubber in order to secure the tear-drop shape. This process was
later not found to be necessary as it did not provide any advantages.
The size of each bag, approximately 3.5 cm in length and 8 mm in
diameter, was of great importance in order to negotiate passage
through the pylorus, especially in duodenal ulcer patients.
44

Illustration 3.3 : pH Monitoring system consisting of the
two pH electrodes strapped together and
the weighted bag
45

After an overnight fast, the subject's pharynx was sprayed with
XylocaineR Spray (Astra Pharmaceuticals Ltd., Kings Langley). The
weighted bag and pH electrodes were passed orally and swallowed by
the subject. Approximately 70 cm of electrode lead was then introduced
into the stomach. The subject was instructed to lie on his right side,
so as to position the bag in the antrum. After 15-20 minutes, the
rece1vmg unit was switched to the signal mode and the voltages from
the two electrodes were read on the liquid crystal screen. The
displayed voitages indicated the positions of the electrodes in terms of
the pH. As the distal electrode was pulled through the pylorus into the
duodenum by the weighted bag, the voltage changed abruptly from
approximately 190-210 to 70-80. The subject was then instructed to sit
up on two pillows while the weighted bag was pulled more caudally
into the jejunum. The exact positions of the electrodes were then
obtained by lying the subject flat. Using a combination of fluoroscopic
screenmg and the digital read-outs from the receiving unit, the distal
electrode was positioned in the apex of the duodenal bulb whilst the
proximal electrode lay along the lesser curve of the antrum. The
weighted bag came to lie in the region of the duodeno-jejunal flexure
(Figure 3.3). The excess length of electrode leads was withdrawn
without compromising the positions of the electrodes, and were
attached to the subject's cheek with adhesive tape. The positions of
the electrodes were maintained by the caudal peristaltic pull on the
weighted bag against fixation of the leads at the subject's cheek.
This method of maintaining the positions of the electrodes within the
gastro-duodenal segment using a weighted bag has previously been
shown to be reliable in producing a stable position (Eyerly 1942,
McCloy, Vickery and Baron 1980). These findings were confirmed in
the present study. At the end of each study period,
46

47
Figure 3.3 : The monitoring positions of the two electrodes within the
stomach and duodenum

1 2 3 4~
. · . ._
pH
5 6
. ....
. .·.
,~~
"·
.... ~~.
,,..'-
:,,,,-
,,,.t"
y,''·
.':v.
,,,"'
..,.
, ... ·,
., • •
• ..,,
,..,,,
-./"
¥,• \
.. •
V
,...,~
'.-
,'\
11
•1
I
'.
,,. ,; ...
. ··:
~
... · ..
. '
· ...
7-1
·"'-..
,. '
' · ... ',.,
. .
.... ·...,
8 9
·•.. .,
. ··,·
.1 .,.
11
Tim
e o
f da
y (h
ou
r)
12
13
Fig
ure
3.4
: C
hang
e in
pH
val
ues
mea
sure
d b
y th
e el
ectr
ode
pas
sin
g
fro
m
the
antr
um
(left
) in
to t
he d
uode
num
(r
igh
t)
~
CX>

the positions of the two electrodes were checked with fluoroscopic
screening and in only five out of the forty eight studies performed
was a shift in position encountered. One patient, during a coughing fit,
vomited both electrodes into the oesophagus. After a few swallows of
water and a short interval. the electrodes returned to the previous
positions in the duodenum and antrum and this was confirmed by the
pH tracing. The abrupt change in pH between the antrum and duodenal
bulb can readily be seen in Figure 3.4.
3.4 COMPUTER OPERATING SYSTEM
The use of computers in the field of medical research has rapidly
expanded over the last few years. The enormous amount of raw data
collected in modern investigations, while occupying a large storage
space, make analyses by hand tedious, time-consuming and possibly
open to human error. The often repetitive and meticulous data analyses
are far better suited to computers and the results are rapidly
obtainable. The system also allows for reliable reproducibility of the
results.
The present investigation ulitised the existing computer hardware (an
IBM PC computer, 256K of memory), of the University Department of
Surgery, for the storage and retrieval of the 24 hour pH data. Hard
copies of the results were obtained by an Epson RX-80 dot matrix
printer coru1ected to the IBM PC. These were shown both as graphic
and numerical forms. Two options of graphics were available: a
longitudinal plot of the 24 hour data, and a copy of the screen display.
49

3.4 1 DAT A STORAGE
Two methods of data storage were used: the hard disc, which has a
very large storage capacity; and the floppy disc, which has a small
limited capacity. The collected pH data was off-loaded from the
receiving unit to the IBM-PC computer and stored on hard disk. The
hard disc was of the Winchester type ( sealed units spinning
continuously), and part of the Medical School's "CORVUS 0Ml\1NET"
network. Each disc had eighteen mega bytes of storage space which
was shared with other departments of the Medical School. The
advantage of the hard disc, apart from tl1e increased capacity, was
that it allowed rapid access to the data, as well as access to other
software programmes on the network for various analyses. Towards
the iatter part of the study, the computer network was refurbished,
and subsequent pH studies were off-loaded from the receiving unit
directly to 5.25 inch floppy discs for storage. Each floppy disc had
storage capacity for approximately 36 studies ( each having 8200
readings). Data stored on hard disc was later copied to floppy discs
and all analyses were done using these discs. Backup copies of the
data from both storage units were made on to floppy discs and kept
separately. This is a vital part of any computer system as accidental
loss or data corruption can occur.
3.4.2 COMPUTER SOFTvV ARE
The computer programme (Department of Medical Computing,
Ninewells Hospital & Medical School, Dundee, Scotland) utilized the
"p-" operating system and PASCAL programming language. The
programme was divided, via the mam menu, into three main
components; these being the filing system, the graphics system and the
50

analysis system. As each system was entered, a number of options
were available, each of which branched out into further sub-divisions.
The filing system allowed for data storage together with manually
entered subject and record details of name, date of birth etc. Each pH
reading was stored in digital form, 001 to 239, with the events being
entered in a similar fashion, 240 to 255. Correction or alteration of
the events was possible and was used both for correction of the study
subject's mistakes ( event omission or wrong event) and for segmental
analysis of the record ( see below). The raw pH data were in no way
able to be altered with this programme. However, drift in the
electrode response can occur and can be significant over prolonged
periods. A correction programme was available that assumed the drift
was linear, and each data point was altered accordingly. In practice,
the drift in response that infrequently occurred was minimal and did
not require correction by the software. As for the receiving unit, the
programme was initially written for analysis of pH data from a
single source, and this was modified for the present study to
accommodate the dual pH monitoring system. It was set such that
alternate data points were analysed together: the first, third, fifth etc.
data points were obtained from the proximal (gastric) electrode, and
the second, fourth, sixth etc. data points were from the duodenal
electrode.
The graphics system allowed for the data to be either displayed on the
screen (Illustration 3.4 ), or plotted by the printer. The screen was
able to display approximately 300 data points at one time. The current
and elapsed times were shown in the corners of the screen. Sequential
segments of the recording could be displayed by movmg along the
tracing, and a cursor
51

Illustration 3.4 : Graphics display of part of the 24 hour
pH data as shown on the computer screen.
The duodenal pH data (distal) is shown by the
pink dots, and the gastric pH data (proximal) by
the blue dots. The time of day is shown along the
X axis, with the start and finish times in the
bottom corners of the screen. The pH is shown on
the Y axis, with pH 1.0 at the top. The time
of a meal is illustrated
52

facility was present to accurately identify times of particular events.
The profile of the full 24 hour record was plotted on a longitudinal
graph. The pH scale 1 - 9 was shown vertically, and the actual time,
in hours, was plotted on the X axis (Figure 3.5). Each pH reading
was plotted as a single dot, and the programme allowed for either tl1e
p1·oximal, distal or combined records to be plotted. The events were
also displayed at the appropiate times. The second graphics display
was that of the frequency distribution of the pH readings. The
software sorted the readings according to tb.eir digital incidence, i.e. l
- 239. The corresponding pH value was calculated from the calibration
values and the distribution as a frequency histogram was then plotted
(Figure 3.6).
3.4.3 ANALYSIS OF pH DAT A
The data was analysed in two main sections: firstly, to determine the
overall acid exposure, and secondly, to examine the pattern of this
exposure. In both analyses, the daytime and nocturnal data were
considered separately, and the results were available either on the
screen or as a printed hardcopy.
1. Cumulative Percentage of pH Exposure
This analysis was used to determine the pH profile as a frequency
distribution of the data. For the duodenal bulb pH, the incidence of
recordings from the duodenal electrode was calculated for each pH
level over the full pH range, and the exposure was expressed as the
cumulative percentage of the total pH readings. Thus, the percentage
of time that the pH of the duodenal buib was below levels pH 9 to pH
1 was reported on. The results were represented in graphic and
numerical format. For the graphics, the plot is m the form of a
frequency histogram with the range of pH levels shown along the X
53

pH
1 ·1 2, :J 5 6 7 8 9
...
\ \
.. ....
19 :/'+
,· ..... :
•• ·.'-
"'v,.
..... :·
_J
_J
<I
<I
w
w
I:
I:
-!,,
-!,, ·.,
. ,·,
'• · .
. ...
. ·, '
'v
I · ..
20
J,
.. .... '
"
; .. '
...
..' .· 21
Fig
ure
3.5
: S
ecti
on o
f th
e du
oden
al
bulb
pH
tr
acin
g,
show
ing
the
rapi
d
fluc
tuat
ions
in
pH
and
th
e ac
idif
icat
ion
foll
owin
g m
eals
.....
".
~ 22
•"
. ,.
' .,.
:
•• ,..
J
',
Tim
e o
f da
y (h
ou
r)
V1
.p.

CUHULAIIUE PERCENTAGE 100:.,;-
?SY.-
50:r.-
25X-
H
CUMULAIIUE PERCENTAGE 100Y.-
75Y.-
S0X-
25X-
H
PERCENTAGE OF DATA BELOW PH VALUE
pH q 8 7 b 5 4 3 2 RECORD:768 ERECT 100.0 100.0 97.8 68.b 36.b 21.4 12.4 7.0 1. ~' SUPINE 100.0 97.8 80.1 62.S 49.9 40.8 29.S 19.8 0.7 TOTAL lCO.O 99.2 91.1 66.3 41.6 23.8 18. 9 11. 9 1.2
Figure 3.6 Frequency distribution of the total 24 hou;- duodenal pH
data, showing separately the daytime (above) and nocturnal (below)
recordings

axis, and the cumulative percentage of total data points on the Y axis
(Figure 3.6). The daytime (erect) and nocturnal (supine) exposure are
reported separately. The exact percentages are shown numerically
under the graphics display.
For the gastric pH data, the computer calculated the frequency
distribution as described above. This gave figures for distribution
below particular pH levels. Thus, by subtracting these computed
results from 100, the frequency distribution of the data to above
particular pH levels could be obtained.
2. Analysis of Acid Peaks within the Duodenal Bulb
An acid peak was defined as two or more consecutive pH readings
below a particular "baseline" pH level; that is, with a pH sampling
rate of once every twenty seconds, the minimum time for such a peak
was 40 seconds. The end of each acid peak was determined by the
following two consecutive readings above the same pH level. The
computer programme allowed for the baseline pH level for this
analysis to be selected, thus enabling acid peaks to below pH 5
through to pH 1 to be determined. The acid peaks were considered to
be of short or long duration, and at the latter stages of this study, the
computer software was modified to enable the time limit of such acid
peaks to be pre-selected from a range of one to five minutes. Thus,
with a time limit of 4 minutes, short-lived peaks were those peaks
less than four minutes duration, whilst long-lived peaks were of
greater than four minutes.
The results were displayed either in detailed (Figure 3.7) or
summarised farm (Figure 3.8). For the latter, the data was
standardised to one hour. Five parameters were investigated:
56

REFLUX 24 H REFLUl TOTAL TOTAL EVENT£ HIIE POINTS 1mt. POINTS IUH.
12:0i - 13:30 1 12:06 2 0.7 2 0.7 2 12: 17 2 0.7 4 1.! 3 12:18 3 LO 7 2.3 4 12:22 c 2.v l3 4,..3
12:29 5 13:00 6 2.0 19 6.3 I:, 13:03 10 3.3 29 9.7 7 13:09 25 8.3 54 18.0 8 13: 18 3 1.0 57 19.0 q 13:20 'l 0.7 59 19.7 ...
10 13:23 2b 8.7 85 2B.3
{ REFLUt DETECTED WHEN PH<4} EREC1
DURINS STUDY 1. 51 H STANDARDISED l H
POINTS 95 TOTAL DURATION Jl.67 l'IINS
REFLUX POINTS 85 TGTAL DURATION 28. 33 !'!INS
RffLUI EVENTS 10 AVERAGE DURATION 2.83 NINS
LOST POINTS 0 O.Ol
DISTRIBUTION OF REFLUX EVENTS
< 5 NIH : 5.31 => 5 "IN : 1.33
Events per hour Events per hour
21. 03 l'IINS
18.82 IIINS
b.b4 2. 83 l'llliS
57
EVENT
lfEAL
Figure 3.7 Detailed analysis of acid peaks within the duodenal bulb to
pH <4

RECORD Til'IE NO. OF DURATION REFLUX PAiTERNino. of events) NO. pH <4 EVENTS PER EVENT <S IHNS > 5 l1INS
All data standardised 7t.,;i lain) i1inl -----------------------------for one hour
ERECT 11.16 3.50 3.19 2. 70 0.90 SUPINE 23.00 ~.SB 3.50 r ft
"'· 6 ' l.H
TOTAL 15.65 4.67 3.35 3.63 1. 04
Figure 3.8 : Summarised aI1alysis of acid peaks within the duodenal
bulb to pH <4
52

a) Time spent below below a the pre-selected pH level
(minutes per hour)
b) The number of acid peaks per hour
c) The mean duration of the acid peaks ( minutes per hour)
d) The number of short-lived acid peaks (no. per hour)
e) The number of long-lived acid peaks (no. per hour)
3. Analysis of pH rises within the stomach
The rises in pH within the stomach were analysed using the
programme described above, with one important alteration. The
direction of pH testing was changed from "lower than" to "higher
than" the pH level. As with the acid peaks, a rise in pH was defined
as two or more consecutive data points above a pre-selected pH level,
and ceased when two consecutive points subsequently fell below the
same pH level. The paramters for analysis were similar.
3.5 ST A TISTICAL ANALYSES
The results of data stored on the hard disc were transcribed on to
floppy discs, and the statistical analyses for all the pH records were
performed using these discs. The results of the pH measurements
were not normally distributed, making the use of means and standard
deviations inappropiate. For this reason, median values were selected
for analytical purposes. The data recorded during the day was
compared with that of the night using the Wilcoxon Matched-Pairs
Signed-Ranks test for non-parametric data. Having studied a cohort of
healthy subjects to obtain the normal pH profiles, a group of patients
with active duodenal ulcer were studied. Their results were compared
to those of the controls, and the analysis performed using the Mann
\Vhitney U test.
59

3.6 IN SITU USE OF THE DUAL GASTRO-DUODENAL pH
M0~1TORING SYSTEM
Intubation of the pylorus was the first difficulty encountered during
placement of the dual electrode system. The normal healthy pylorus
allowed for easy passage of the weighted bag, and this was borne out
by the author who swallowed the system on four separate occasions.
The mean time for this was approximately 35 minutes. Patients with
active duodenal ulcers invariably had a degree of oedema of the
pylorus which caused some obstruction to the passage of the weighted
bag. This problem was noted many years ago during studies with
aspiration catheters (Morton 1929). The size of t.lie bag was thus most
important, and three variations were constructed until a satisfactory
size and weight combination were obtained.
Limited fluoroscopic screening was used to aid in the correct
placement of the distal (duodenal) electrode and used a second time at
the end of the study period to re-check the positions. Ar1 attempt was
made to position the electrode using only the digital read-outs of
voltages displayed on the receiving unit, but this proved inaccurate and
unreliable in obtaining reproducible results. Previous investigations
have also employed fluoroscopic techniques ( Tomenius and vVilliams
1960, McCloy, Vickery and Baron 1980, Hannibal and Rune 1983), some
included the use of contrast media to outline the duodenal cap (Bircher
et al 1965, Rhodes and Prestwich 1966). Repeated use of fluoroscopic
screening is inappropiate in long-term studies. Measurement of the
potential difference across the pylorus has been used to indicate the
electrode remaining in the bulb (Andersson and Grossman 1965,
Archambault, Rovelstad and Carlson 1967, Rune and Viskum 1969). A
60

more elaborate method of placement has been described using a
"chain" of four electrodes strapped very closely together (Rune 1981).
Examination of the tracings enabled the exact postions of each
electrode to be determined. However, this would not be entirely
suitable for long-term pH monitoring as the presence of four
electrode leads in the subject's pharynx would help with compliance.
There was a learning curve for the correct placement of the
electrodes using the method described above. The mean time required
for this during the complete study was 50 minutes, but ranged from 30
to 100 minutes. The initial problem encountered was that the distal
· ( duodenal) electrode prolapsed back into the stomach, and this
occurred in four studies. These cases occurred early m the
investigation, and on examining the pH tracings, it was evident that, as
the subject sat up, the distal electrode prolapsed into the stomach with
not enough length of lead to enable it to pass back into the duodenal
bulb. A further problem was encountered in a single patient in whom
excess length of lead was placed in the stomach due to difficulty in
intubating the duodenum. This resulted in both electrodes being pulled
into the duodenum by the peristaltic action on the weighted bag.
Guards or shields around the electrode bulbs were not used in this
study. Suspicion that the high pH values recorded m the duodenum
were artefactual was increased by reports of widely differing pH
readings of the luminal contents and the duodenal mucosa (Bircher et
al 1965). However, as these shields were found to be clogged with
mucus at the end of the recordings, it was feit that the presence of a
shield "softened" the pH curve and were more likely to produce
artefactual readings than bare electrodes (Rune 1981). Evidence against
artefactual readings being caused by mucosa! contact can be seen in
61

the steady recordings made within the antrum. Contact with the mucosa
is as likely to occur as it is in the duodenum. Thus, the contact does
not influence the pH reading of the overlying fluid, and the measured
pH will be an accurate reading cf the acidity to which the mucm:a is
exposed.
There has been much debate whether the acidity should be analysed in
terms of pH or H+ ion activity (Bircher et al 1965, Moore and
Scarlata 1965, Lucas 1977, Rune 1981). H+ ion activity is not quite the
same as H+ ion concentration ("Walt 1986) and requires an activity
coefficient (Moore and Scarlata 1965). Conversion of pH to H+ ion
concentration can be obtained by using Moore's table (Moore 1968). As
H+ ion concentration is minimal at a level of below pH 5.0 ( Walt
1986), duodenal acidity (higher pH) 1s better suited to pH
measurements (Mitchell, Hunt and Grossman 1962). Either method may
be used for gastric acidity measurements, but comparisons here must
be made only between the same units (Walt 1986). For tliis present
study, measurements were made in pH units and not converted to H+
ion activity or concentration.
The sa!!lpling rate of pH measurements was set at once every twenty
seconds. As already mentioned, this was the fastest rate allowed with
the dual monitoring system over a full 24 hour time period, due to
software limitations. Extremely brief pH fluctuations have previously
been noted in the duodenum (McCloy, Vickery and Baron 1980, Rune
1981). But the importance of these rapid peaks in the pathophysiology
of duodenal ulcer disease is unknown. Due to their extremely short
duration, their influence in the acid exposure over a 24 hour period is
questionable. These rapid fluctuations were also noted in this
investigation when the pH was monitored in the fasting state with the
62

sampling rate increased to once every second. The tracing of the
duodenal pH from this subject is shown in Figure 3.9.
Figure 3.10 shows the duodenal pH tracing of a study perf armed
during the setting up period, with the sampling rate at 20 second-1.
The fluctuations in pH prior to the meal (a fasting period) can be
seen. The meal consisted of a 150 ml. drink of meat extract and the
subsequent rise in duodenal acidity is readily evident. The concurrent
gastric pH tracing is shown in Figure 3.11 which demonstrates the
rise in pH soon after the ingestion of the meal. This is followed by a
return to the pre-meal steady state. The frequency distribution plot of
the duodenal pH data illustrated in Figure 3.10 is shown in Figure
3.12.
63
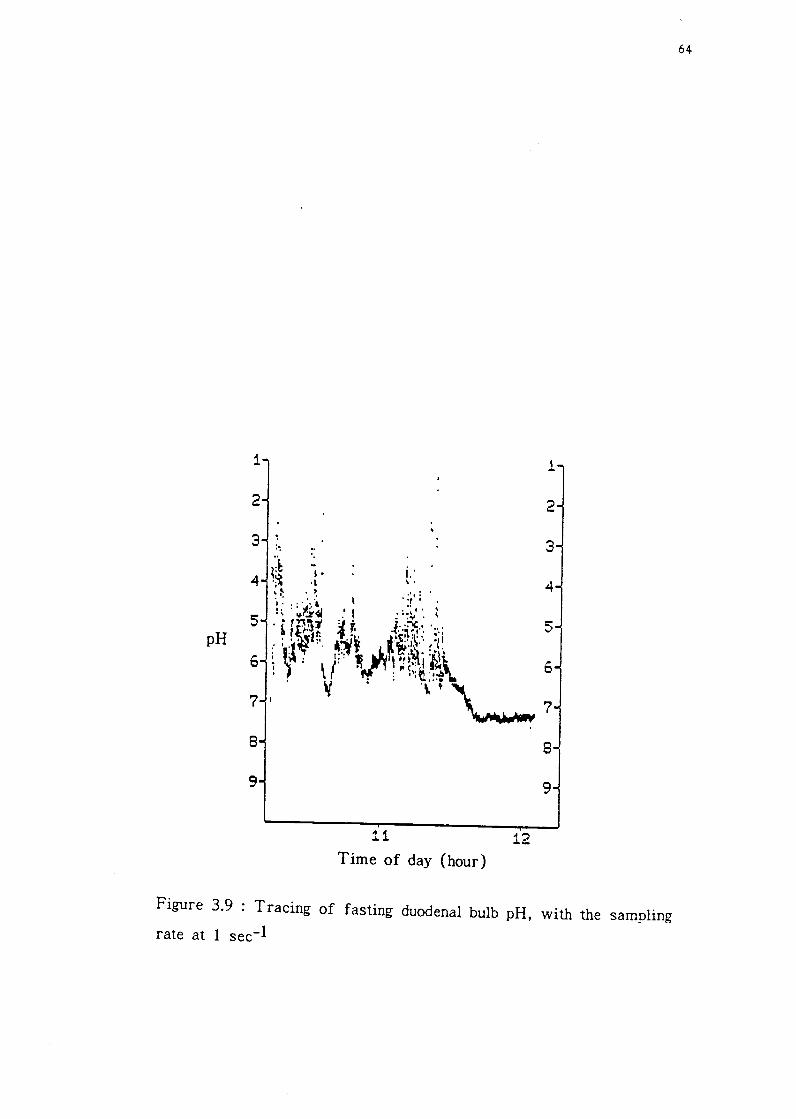
pH
1
2
3
8
9
:~
11
Time of day (hour) 12
1
2
3
8
9
64
Figure 3.9 : Tracing of fasting duodenal bulb pH, with the sampling rate at I sec-I

-0 . N -w l: ~
I-
I- I-c:: LI <I UJ I- c:: co UJ
1 ..........
2
3
4
s pH
6
7
8
9
: : ... : .. ·.,
.....,. .. .,·
,. ·'·,.
/', ,.:... . . .. . ,,'\.:~
Time of day (hour)
.,·
; ...
13
I•• • ', ~ . '·
65
1
2
3
4
5
·~ 0
7
8
9
Figure 3.10 : Tracing of duodenal bulb pH showing the fasting and
immediate post-prandial period

-0 . r-1 -LIJ E .... lo-
lo- lo-c::: u <r lJ.J lo- c::: en w
i '+' '+'
2
3
4
5 pH ,.
t:)
7
8
9
. : ............... , .,.. ... -,.~- . ' .... . " ''.I
.. ,.,.
:."'",·....._,. ... :::,• . '•
13 Time of day (hour)
.t·--·:;.'.'/1111'\.,.........,,,.. :.""'
66
i
2
3
4
s
6
7
8
9
Figure 3.11 : Tracing of antral pH during the same fasting and postprandial periods as shown in Figure 3.10

67
CUMULATIVE PERCENTAGE 100:;t;-
?SY.-
50X-
25Y.-
H
PERCENTASE OF DATA BELOW PH VALUE
pH 9 B 7 6 5 4 3 2 RECORD1hlS ERECT 100.0 100.0 90.7 b0, 1 4e.9 35.4 25.~ 12,3 o.o
TOTAL 100.0 100.0 90.7 60,1 48.9 35.4 25.v 12.3 o.o
Figure 3.12 : Frequency distribution cf the duodenal pH data illustrated
in Figure 3.10

CHAPTER 4
THE NORMAL PROFILE OF 24 HOUR AMBULATORY DUAL
GASTRO-DUODENAL pH IN HEAL THY SUBJECTS
68

4.1 STUDY AIM
As discussed earlier in Chapter 2, studies concerning the role of
gastric acid in the pathogenesis of duodenal ulcer disease have largely
concentrated on the pathophysiologkal abnormalities of gastric acid
secretion (Winkelstein 1935, Wormsley and Grossman 1965, Lam and
Sircus 1975, Malagelada et al 1977, Feldman, Richardson and Fordtran
1980). Using these results, the situation occurring in the duodenal bulb
has only been inferred. Following the development of nevv materials
and techniques, more recent studies regarding the exposure of the
duodenum to gastric acid have been performed (McCloy, Vickery and
Baron 1980, Bendtsen et al 1986). However, there are several limiting
factors of these studies: a) for the most part, they have been short
term (3 - 5 hours duration); b) not all the "normals" have been free
from gastro-intestinal disease; c) the studies have not truly reflected
the normal situation in that they have not been ambulatory, and the
subjects were studied in a somewhat artificial environment.
The present investigation sought to avoid these shortcomings. The
study was set out to achieve three main aims:
1. To record, for the first time, a continuous, ambulatory,
twenty four hour, simultaneous profile of gastric and duodenal bulb pH
in normal healthy subjects. The normal fluctuations in the daytime and
nocturnal gastric acid secretion would be reflected in changes in the
gastric pH, whilst the changes in the exposure of the duodenal bulb to
such acid secretion would also be recorded.
2. To record the influence that the cephalic phase of gastric
se·cretion might have on the respective gastric and duodenal bulb pH.
3. To record the respective gastric and duodenal bulb pH
changes in response to the gastric phase of gastric secretion.
69

4.2 STUDY GROUP
Nineteen normal healthy subjects were studied. This group comprised
healthy volunteers who had no symptoms, nor previous history, of
oesophageal, gastric, duodenal, pancreatic or other gastro-intestinal
disease. There were thirteen men and six women, and the mean age
was 28.7 years. The ages ranged from 19 to 79 years, and although an
even distribution through the ages was strived for, the younger
volunteers were more agreeable to undergo the study. Volunteers under
the age of 18 years were not accepted for the study.
4.3 STUDY DESIGN - STUDY I (Figure 4.1)
The two pH electrodes in tandem were first calibrated in the
laboratory in the buffer solutions of pH 7.0 and 4.0. After an
overnight fast, the dual gastro-duodenal pH monitoring system was
swallowed by the subject and positioned as described in Section 3.4.
With the electrodes in position, the wires were taped to the subject's
cheek and connected to the receiving unit. The unit was switched on to
the logging mode and the pH recording in the fasting basal state
commenced. The subject was allowed up to walk about.
70

Figure 4.1: Study design - Study I
start MSF* MEAL home end
I 0 1 2 3 4 5 6 7 ... ... 24
Time (hours)
(*MSF: modified sham feeding)
After one hour of recording in the fasting state, cephalic stimulation
by modified sham feeding was performed in order to demonstrate the
effect of the cephalic phase of gastric secretion on the intraluminal
pH. A standardised solid meal was served (Illustration 4.1), and this
consisted of two freshly cooked bacon rolls, one slice of buttered
toast and 160 ml of warm Oxo drink (Carbohydrate 54.3 g, Protein
37.5 g, Fat 52.8 g, 3456 kJ). The subject was informed in detail as to
the requirements of the test and was instructed to chew the food and
then spit it out, making stlre none was swallowed. The Oxo drink
was similarly allowed to be tasted but not swallowed. The duration of
the test was thirty minutes; thereafter the subject was kept fasted
until the second part of the test.
Two and a half hours later, a second standardised solid meal
(Illustration 4.2) was served and was eaten normally. This allowed
the effect of the gastric phase of gastric secretion to be monitored.
The meal consisted of 120 g minced meat, 120 g potatoes, 60 g peas,
180 g custard and peaches and 160 ml tea (Carbohydrate 55.7 g,
Protein 38.1 g, Fat 23.9 g, 2477 kj). Foliowing the meal, the subject
was not allowed to eat or drink for the following three hours.
71
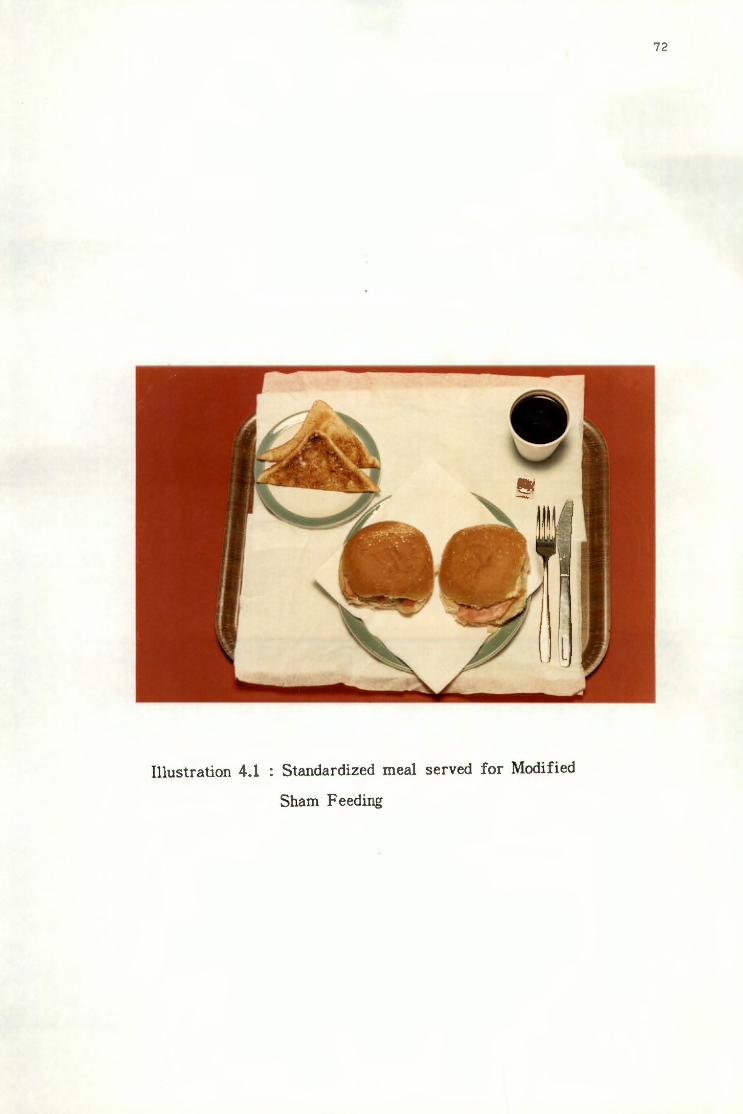
Illustration 4.1 : Standardized meal served for Modified
Sham Feeding
72
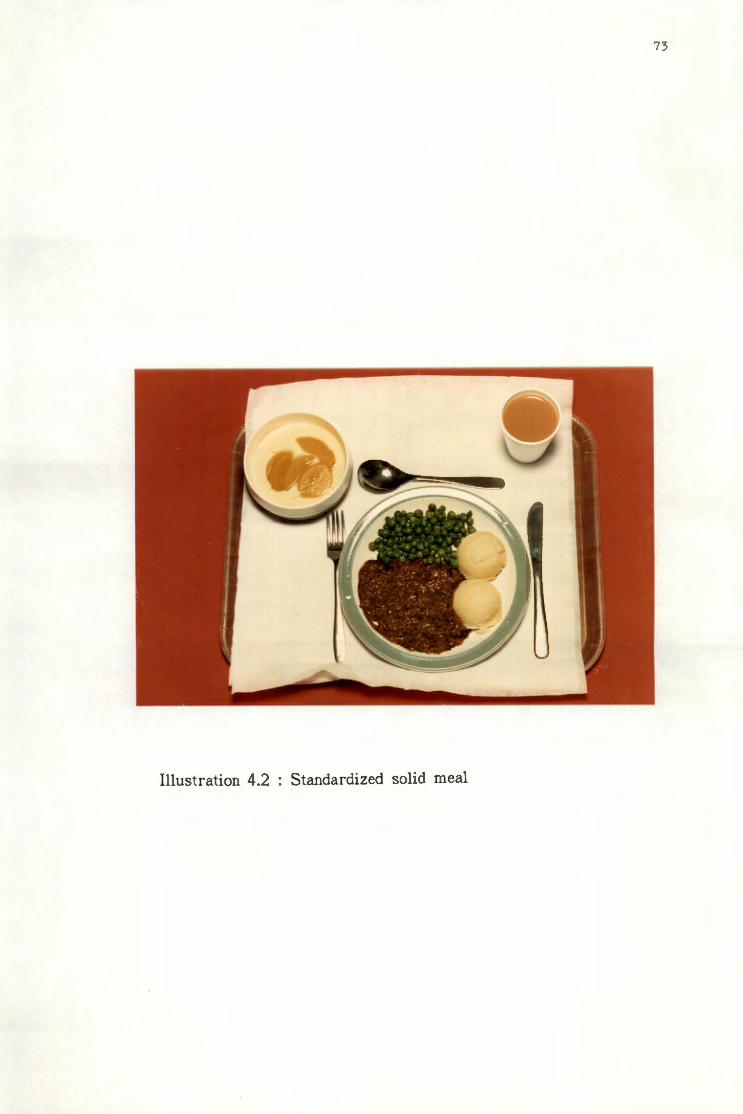
73
Illustration 4.2 Standardized solid meal
After the three hour post-prandial period, there were no restrictions
on eating or drinking for the remainder of the 24 hour study period.
The subject was allowed home, with the pH monitoring system in situ
and encouraged to resume normal daily activities. Instructions were
given regarding the use of the "event" button so that on-line recordings
could be made of the times of eating and drinking (meal), going to
bed (supine) and rising in the morning (erect). In order to check
possible mistakes in using the "event" button, the subject was also
asked to write the events on a diary sheet.
At the end of the study period, the subject returned to the hospital, and
the positions of the two electrodes were checked using fluoroscopic
screening. The keypad was reattached, and the receiving unit switched
to the idle mode. The two pH electrodes and weighted bag were
withdrawn, and returned to the lal::oratory for recalibration ("end"
calibration), ( see Section 3.1.2). The pH data stored in the receiving
unit was then transferred to the computer for permanent sto.rag~ and
result analysis.
4.4 ANALYSIS AND ST A TIS TICS
The recorded pH data was analysed using the computer software as
described in Section 3.4.3. The statistical methods were those outlined
in Section 3.5.
4.5 ETHICAL APPROVAL
The protocoi of this investigation was approved by the Ethics
Committee of the University of Dundee, and the Tayside Health Board.
74
4.6 NORMAL DUODENAL BULB pH PROFILE
4.6.1 Fasting duodenal bulb pH
A representative tracing of the fasting duodenal bulb pH is illustrated
in Figure 4.2. The rapid fluctuations in pH from the baseline level
were seen in all the subjects, although the median values tended to be
in the pH range of 5.0 to 7.0. These fluctuations were also noted in
the later part of the study and were more pronounced in the immediate
post-prandial period.
The fas ting period was during tb.e first hour of the study, and the
fasting pH was determined by the mode of the pH data recorded
during this interval. Results showed the mean fa sting duodenal bulb pH
to be pH 6.73, (SD 0.59); range of pH 5.1 - 7.4.
4.6.2 Total duodenal bulb acid exposure
The total acid exposure cf the duodenai bulb during the 24 hours of
the study was determined using the "Frequency Distribution" analysis.
The cumulative percentage of the total number of recordings made by
the duodenal electrode, to levels of pH iess than 5, 4, 3, 2, and 1
were analysed, and the results of daytime and nocturnal exposure were
compared.
Table 4.1 shows the cumulative pH exposure in the duodenal bulb at
pH levels 1.0 to 5.0. The acid exposure at each pH level was similar
during the day and at night, and the incremental increase to pH 5.0
was slightly exponential. There was no significant difference
encountered between the daytime and nocturnal exposure. However,
there was a tendency for a more acidic milieu to be present during
75

pH
0-N . 0-
w E .... i-
I- I-er. u <I w I- er. en UJ
1 "' "' 2
3
4 .....
s
6
7 - ,• '• .....
8
9
,: :
·.· . . .
.. ·:: ·.•·. . . , ... .• ,,. ..
10
· .. ·· , ...
...
Time of day (hour)
. ••, . . ' .
11
...
76
.. ..
~.
' . ..
Figure 4.2 : Duodenal pH during the fasting period of a healthy subject

the day rather than at night. This data is illustrated graphically in the
next chapter (Figure 5.1).
Table 4.1: Cumulative percentage pH exposure m the duodenal bulb in
healthy subjects.
CUMULATIVE PERCENTAGE* OF TOTAL DUODENAL pH DATA
** pH LEVEL DAY :NlGHT p Value_
<1 0.4 0.5 NS
(0.0 - 15.0) (0.0 - 28.5)
<2 8.4 45 NS
(0.0 - 31.8) (0.2 - 42.6)
<3 14.6 12.8 NS
(0.1 - 42.2) (2.2 - 61.0)
<4 23.9 25.4 NS
(1.0 - 60.6) (6.9 - 65.9)
<5 39.6 37.7 NS
(7.1 - 80.9) (12.6 - 71.4)
* d' me ian, range
** 'Wilcoxon Matched-Pairs Signed-Ranks test
4.6.3 Acid peaks within the duodenal bulb
As previously discussed in Chapter 3, an acid peak witI,in the duodenal
bulb was defined as being two or mo:re consecutive readings from the
duodenal electrode, below a particular pH level. The acid peak ended
when two consecutive readings occurred above the pre-determined pH
level. By altering the pH level on the computer, detailed analyses of
these acid peaks were available.
77
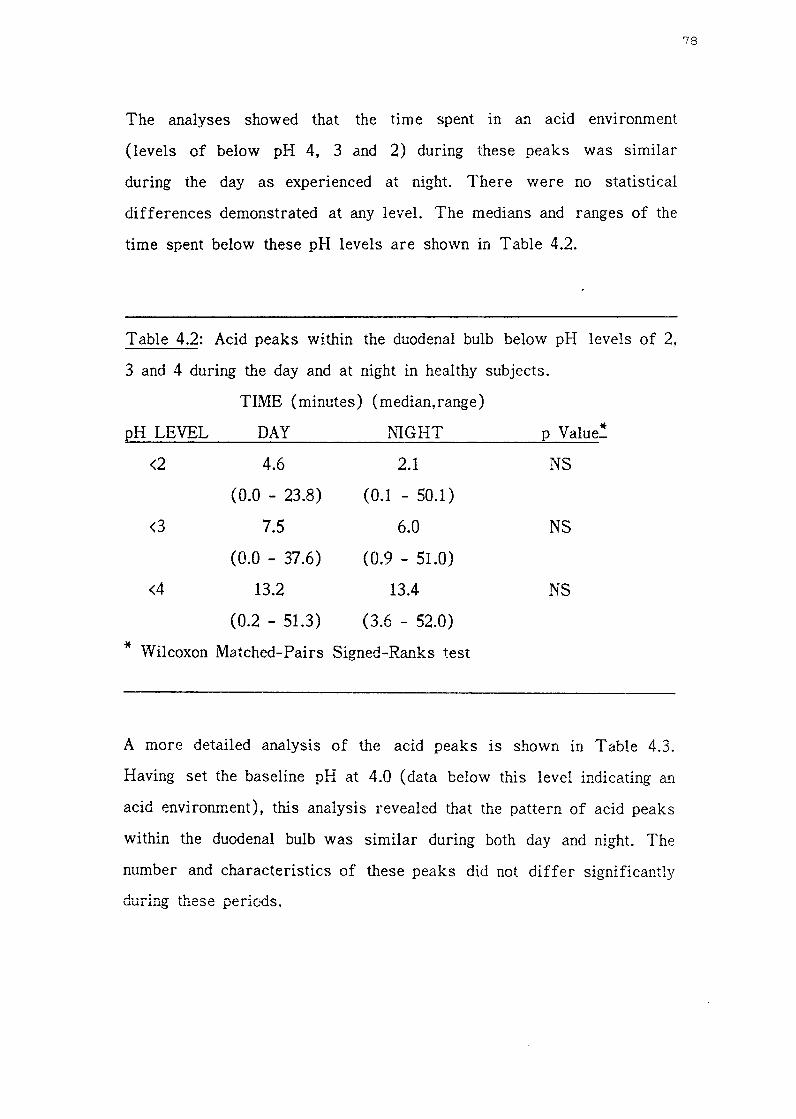
The analyses showed that the time spent in an acid environment
(levels of below pH 4, 3 and 2) during these peaks was similar
during the day as experienced at night. There were no statistical
differences demonstrated at any level. The medians and ranges of the
time spent below these pH levels are shown in Table 4.2.
Table 4.2: Acid peaks within the duodenal bulb below pH levels of 2,
3 and 4 during the day and at night in healthy subjects.
TIME (minutes) (median,range)
pH LEVEL DAY l'UGHT
<2 4.6 2.1
(0.0 - 23.8) (0.1 - 50.1)
<3 7.5 6.0
(0.0 - 37.6) (0.9 - 51.0)
<4 13.2 13.4
(0.2 - 51.3) (3.6 - 52.0)
* Wilcoxon Matched-Pairs Signed-Ranks test
* p Value_
NS
NS
NS
A more detailed analysis of the acid peaks is shown in Table 4.3.
Having set the baseline pH at 4.0 ( data below this level indicating an
acid environment), this analysis revealed that the pattern of acid peaks
within the duodenal bulb was similar during both day and night. The
number and characteristics of these peaks did not differ significantly
during these periods.
78

Table 4.3: Acid peak analysis to below pH 4.0 in healthy subjects.
DAY NIGHT * p Value_
Time (min.) 13.2 13.4 NS
pH <4 (0.2 - 51.3) (3.6 - 52.0)
Number of peaks 3.6 3.4 NS
(per hour) (0.1 - 7.6) (0.9 - 5.2)
Duration per event 2.8 2.9 NS
(min.) (1.3 - 8.6) (1.3 - 53.3)
Number of peaks 2.9 3.2 NS
shorter than 5 min. (0.1 - 6.2) (0.4 - 4.1)
Number of peaks 0.5 0.6 NS
longer than 5 min. (0.0 - 2.2) (0.0 - 1.5)
( Data standardized to one hour)
*Wilcoxon Matched-Pairs Signed-Ranks test
The above findings showed that there was no significant difference in
the overall acid exposure of the duodenal bulb during both day and
night. The frequency of acid exposure and the analysis of acid peaks
were similar for the daytime and nocturnal recordings. This posed the
question that: \Vas there, in fact, a differ enc~ in the pattern of the
acid exposure within the bulb? In order to address this problem, the
computer software was modified to analyse the number of acid peaks
that were greater than, and less than, specified durations of time. The
durations of the acid peaks selected for this part of the study were 1,
2, 3, 4 and 5 minutes. As performed eariier, the daytime and nocturnal
data were analysed separately.
79

The modified version of the software programme was only available
towards the end of this investigation. Thus, due to technical
difficulties with hard disc as outlined in Section 3.5.1, the records of
only nine of the healthy subjects were able to be analysed.
The numbers of short-lived acid peaks were first considered. These
peaks were those of durations of less than l, 2, 3, 4 and 5 minutes.
The number of acid peaks of less than three minutes' duration that
occurred during the day was the same as that which occurred at night.
Peaks of less than two and less than one minutes' duration were
slightly more frequent during daytime compared to nocturnal
recordings. The opposite occurred with acid peaks of less than four
and less than five minutes' duration, in that the nocturnal peaks were
slightly more frequent than those during the day. There was, however,
no significant difference between the daytime and nocturnal data at any
of the five measured levels (Wilcoxon Matched-Pairs Signed-Ranks
test). Table 4.4 shows the medians and ranges of the number of acid
peaks that occurred at the various durations of time. The results are
also shown in Figure 4.3 and repeated in Figure 5.3 in Chapter 5.
Marked and significant differences were noted when the numbers of
short-lived and long-lived acid peaks were compared (Table 4.4).
During daytime recordings, the short-lived peaks were more frequently
encountered than long-term peaks. Using statistical comparisons with
Wilcoxon Matched-Pairs Signed-Ranks test, these differences were
significant (p <0.01 and p <0.02). However, this was only the case for
peaks shoi-ter than / longer than 2, 3, 4 and 5 minutes. The situation
was reversed for the peak duration of one minute. There were
significantly (p <0.01) greater numbers of acid peaks lasting more
than one minute, than those lasting less than one minute. Analysis of
80

the nocturnal recordings produced very similar results. There were
significantly (p <0.01) more acid peaks of short duration over the
range of 3, 4 and 5 minutes ( significance was not reached for the
duration of 2 minutes), and significantly (p <0.01) greater numbers of
peaks longer than one minute. These results are displayed graphically
in Figure 4.3, and repeated in Chapter 5 (Figure 5.4 ).
Table 4.4: Analysis of acid peaks of varying duration within the
duodenal bulb in nine healthy subjects.
NUMBER OF ACID PEAKS**
Duration shorter than longer than
(min.) Day Night Day Night
1 1.2 0.7 2.8 2.5
(0.3-1.7) (0.2-1.8) (1.3-6.1) (2.1-4.4)
2 2.4 2.2 1.1 1.5
(0.7-4.6) (0.7-3.4) (0.3-4.1) (0.6-3.1)
3 2.6 2.6 0.9 1.0
(0.8-3.7) (0.8-5.2) (0.1-3.1 (0.5-2.0)
4 2.8 3.0 0.6 0.8
(0.9-5.4) (0.8-4.1) (0.1-2.5) (0.3-1.8)
5 2.9 3.2 0.5 0.6
(0.1-6.2) (0.4-4.1) (0.0-2.2) (0.0-1.5)
**Medians, ranges; data standardized to one hour
*Wilcoxon Matched-Pairs Signed-Ranks test
* p short/long
day night
<0.01 <0.01
<0.02
<0.01 <0.01
<0.01 <0.01
<0.01 <0.01
81
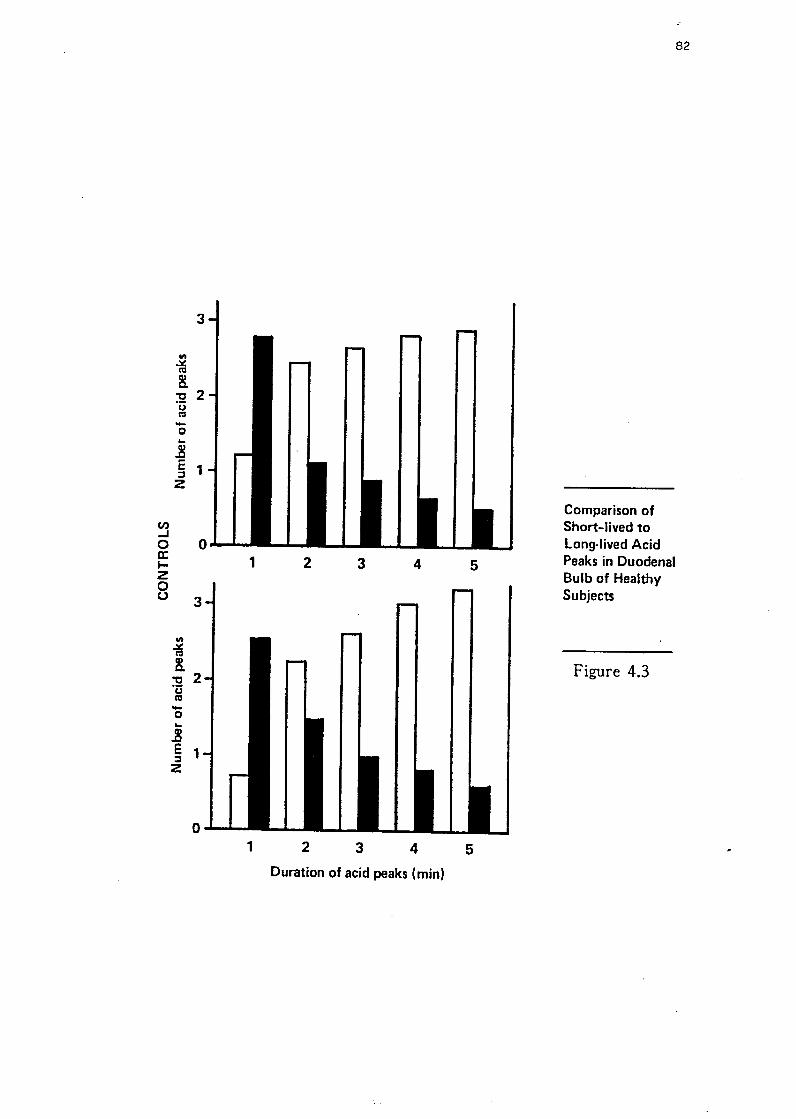
3
Ill ~ co !
"t:I 2 ·c:; co -0 .. .! E 1 :::, z
Cl) ..I 0 0 a: I-z 0 u 3
Ill
7d !
"t:I 2 ·c:; co -0 .. .8 E 1 :::, :z
1 2 3 4
1 2 3 4
Duration of acid peaks ( min)
5
5
82
Comparison of Short-lived to Long-lived Acid Peaks in Duodenal Bulb of Healthy Subjects
Figure 4.3

HE
AL
TH
Y C
ON
TR
OL
S (n =
12) H
EA
L T
HY
CO
NT
RO
LS
(n = 12)
12
0
~ 1
20
1
~
r, m 0.692, t =
3.0
34
(do
f 10), p < 0
.00
6
rs=
0.6
52
, t = 2
.72
0 (d
of 10), p <
0.0
2
"' E
. C
0
,
0,
.5 8
0
-~ 8
0
ii :a
~
~
C
·E ·5 ~
40
•
r1 •
"' •
• •
• E
1
I .·.:.
:a •
• a:
• •
0 0
DU
OD
EN
AL
UL
CE
R P
AT
IEN
TS
(n = 16)
DU
OD
EN
AL
UL
CE
R P
AT
IEN
TS
(n = 16)
12
0
1201 '
r5 = 0
.79
8,
t = 4.951 (d
of 14), p <
0.0001 ~
r5 =
0.8
40
, t = 5
.78
6 (d
of 1
4), p <
0.0001 "'
E.
• E
. •
0,
• 0
, •
C
80
C
80
·;:;
·~ :a
ca ~
• •
l ··~ •
• •
·E •
• •
• ~
40
•
• •
• "'
I I
• I •
• E
•
.. ••
• •
.. ..
0: a:
0 0
0 4
0
80
1
20
1
60
2
00
0
40
8
0
12
0
16
0
20
0
24
0
28
0
Plasm
a Ga
strin (M
SF
Peak) (ng/1)
Plasm
a Ga
strin (M
ea
l Peak) (ng/1)

4.7 NORMAL GASTRIC pH PROFILE
4.7.1 Fasting Gastric pH
In contrast to the pH fluctuations seen m the duodenum, the fasting
gastric pH was relatively constant Figure 4.4. The same pattern was
exhibited in all the subjects. As for the fasting duodenal pH, the
fa sting gastric pH was determined by the mode of the pH data
recorded during the first hour of the study (i.e. the fasting state).
The mean gastric pH during this period was pH 1.91 (SD 0.33);
range from 1.3 to 2.4.
4.7.2 lntragastric acidity
Analysis of the data from the gastric pH electrode was performed in
a similar fashion as for the duodenal pH data. The pH profile of the
gastric antrum was somewhat more acidic at night than exhibited
during the day. The buffering effects of meals and drinks would
explain these differences, which were statistically significant at pH 3
and 4. Table 4.5 shows the frequency distribution of the gastric pH as
the cumulative percentage of the total gastric pH data.
An alternative method of examining the pH profile within the gastric
antrum, is shown by the analysis of the duration of pH rises in the
antrum (Table 4.6). A pH rise was defined as two or more
consecutive data points above a pre-determined pH level, and was
completed by the first two consecutive data points to occur below the
same pH level. The time spent during these pH rises demonstrated a
pH profile similar to that shown by the cumulative pH percentage
analysis. The daytime exposure was longer than that experienced at
83

84
0 0 . 0 ... w E .... f-
f- I-0:: u
-' <I w <I f- 0:: UJ CJ) L&J E
i ,-1, .... i 1 .
2
3 3
4 oJ• 4
s 5 pH
6 6
7 ..... 7
8 8
9 9
Time of day (hour) 11
Figure 4.4 : Antral pH during the fasting period

Table 4.5: Cumulative pH percentage of gastric pH data in healthy
subjects.
CUMULATIVE PERCENTAGE* OF TOTAL GASTRIC pH DATA
pH LE'VEL DAY l'H G HT p Value~
>1 100.0 100.0 NS
(48.7 - 100.0) (71.2 - 100.0)
>2 61.9 47.6 NS
(19.4 - 99.1) (5.0 - 100.0)
>3 26.4 14.4 <0.002
(11.4 - 56.5) (0.4 - 28.8)
>4 11.4 2.8 <0.001
(3.5 - 29.3) (0.3 - 16.5)
>5 2.5 1.6 NS
(0.3 - 16.5) (0.0 - 10.1)
>6 0.3 0.0 NS
(0.0 - 9.3)
* median, range
**Wilcoxon Matched-Pairs Signed-Ranks test
85

night, and the differences reached significance (p <0.01) at the levels
of pH > 3 and pH >4.
Table 4.6: Duration of rises in intragastric pH to above pH levels of
1, 2, 3, 4 and 5 in healthy subjects.
TIME DURING pH RISES*
pH LEVEL DAY NIGHT
>1 59.2 59.9
(36.4 - 59.7) (28.2 - 59.9)
>2 39.4 24.6
(10.2 - 58.2) (2.4 - 59.9)
>3 15.1 6.8
(6.3 - 30.7) (0.1 - 14.0)
>4 6.6 1.6
(1.9 - 21.8) (0.0 - 9.7)
>5 1.7 LO
(0.0 - 16.9) (0.0 - 5.7)
*Median, range; Data standardized to one hour
**Wilcoxon Matched-Pairs Signed-Ranks test
** p Value
NS
NS
<0.01
<0.01
NS
The intragastric pH level was generally stable at the baseline pH and
rose on ingestion of food or drink. Figure 4.5 illustrates the rise in
gastric pH following a meal. The level to which the pH rose was
dependent upon the constituents of the meal and its volume. During
nocturnal recordings, the pH re:nained steady until morning. However,
six subjects demonstrated spontaneous rises in the intragastric pH
(Figure 4.6 ). Five subjects exhibited a single such episode, whilst the
sixth subject showed three episodes of pH rise. In each case, there
86
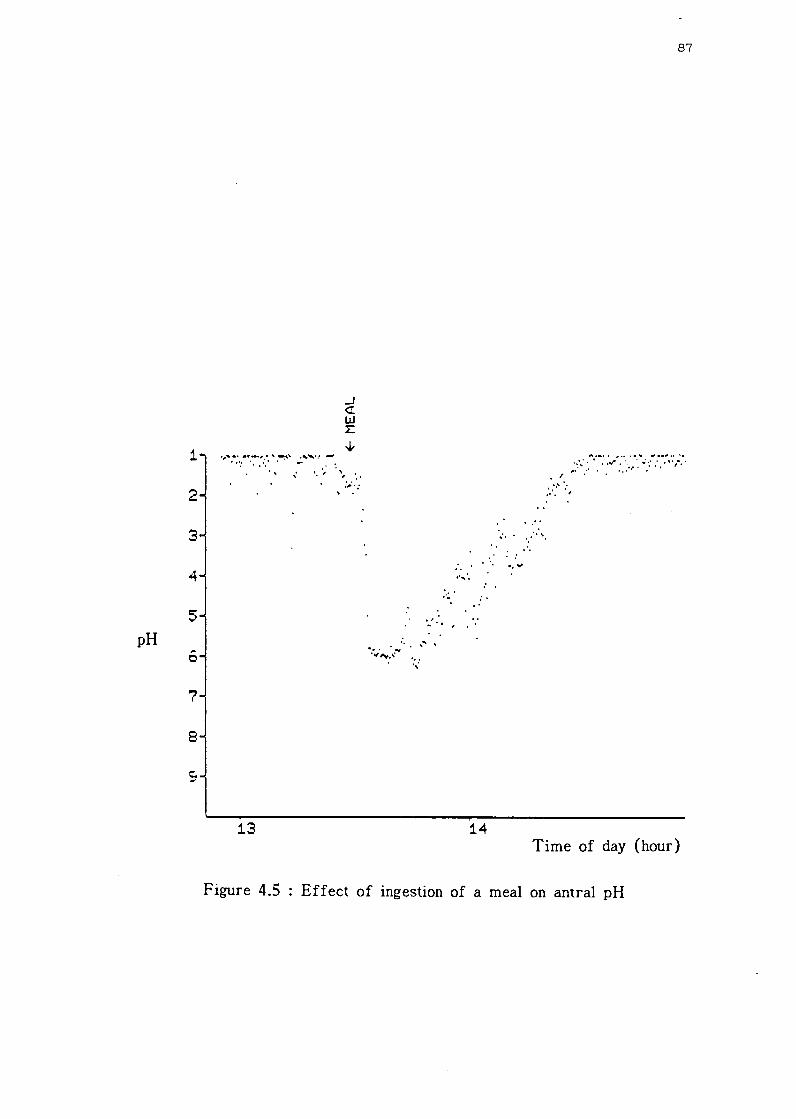
pH
1
2
3
4
5
6
7
8
13
..J <I w :E
... ' . ' ,• ., ...
' .
.. ··,·.
:,;. .
· ... '.. ,
. .·· ... ·. . '.·· '· ...
. ·. ··""'
: . ..
14
87
A,_,• ,•• ••._ "'••"'•• '•
. ' ;::· ... :. • . . · . ..r :.· ... ,. ·. ··:·:: .. ,., •..
:.··:'':,
Time of day (hour)
Figure 4.5 Effect of ingestion of a meal on antral pH

1 2 3 4 5-
pH
I
6 7 8 9
I • ..,
.. _:
.....
..... ,
•• ,'"
'·.,
;:':
, ,J
....
....
... \
'."
:..
\ ••
......
.... "
JA
,,,.:
'\..,,.
,.....
.,,__
~""'.
,...
., .._
,..,,,
,,_•.
,;;,
.,.._
,.,w
~.'1
r-.\'
/\ I,.
,:-
·~'
.· ..,,
'• •'
·, I 03
· ...
...
··1
\ . . \
.. ' \ '.
• I
,.,,""
,. \
,' ··, 0
4
·.:,·:
.. ., . \ ., .
...
, ._ . ._
. . ,_
. ·· ..
','
I
·" ,,
','' ...
.. : .. :
'
05
T
ime
of
day
(ho
ur)
F
igu
re 4
.6 :
Rec
ordi
ng o
f an
tral
pH
at
nigh
t sh
owin
g sp
onta
neou
s ri
ses
in p
lI o
f va
ryin
g du
rati
on
06
CD
CD

was no apparent precipitating cause for these pH rises, and prolapse
into the duodenal bulb was ruled out as the concurrent duodenal pH
tracing showed no sudden cl}.ange in pattern. These pH peaks occurred
between 1.00 am and 6.30 am, and lasted between seven minutes and
two hours, with a median of 20 minutes. The extent of each rise
ranged from pH 4.5 to pH 7.5 (median pH 6.7).
4.8 THE EFFECT OF MODIFIED SHAM FEEDING AND AN
INGESTED SOLID ME£.,*
The ingestion of the meal produced an initial rise in the gastric pH
which reached a peak level of mean pH 5.3 (SD 0.7). This was
followed by a gradual decrease in pH ( rise in intra-gastric acidity) to
return to the pre-meal pH level. The duration was variable but had a
median value of 98.0 minutes (range 59.5 - 130.5 minutes). The
effects, on the duodenal bulb pH, of cephalic stimulation by modified
sham feeding and the ingestion of a solid meal were analysed together,
and the remaining data of the 24 hours was excluded.
Following the two feeds, the exposure to acid in the duodenal bulb was
determined by the cumulative pH percentage analysis. This yielded the
cumulative percentage of the frequency distribution of the total pH
data during this period. The overall acid exposure was similar to that
experienced during the full duration of the study ( viz. Table 4.1),
although the ranges of pH values were slightly wider. These results
are shown in Table 4.7.
89
* Due to computer programme difficulties, the results of the two meals were analysed together.

Table 4.7: Acid exposure in the duodenal bulb following cephalic
stimulation and a I!leal in healthy subjects.
CUMULATIVE PERCENT AGE
pH LEVEL
<2
<3
<4
*Median, range
OF TOTAL pH DATA*
5.3 (0.0 - 36.7)
17.2 (0.0 - 53.1)
28.8 (0.9 - 78.8)
The pattern of acid peaks that occurred during this period was almost
identical to that experienced during the full 24 hour study ( viz. Table
4.3). The time spent in an acidic milieu (pH <4.0), the number of
acid peaks per hour and their average duration were remarkably
similar to that seen in the overall pattern. Only the duration of peaks
showed a wider range. The results of this analysis are shown in
Table 4.8.
Table 4.8: Analysis of acid peaks within the duodenal bulb following
cephalic stimulation and a meal in healthy subjects.
PARAMETER Median (range)
Time * pH <4 15.0 (0.1 - 46.7)
No. acid peaks/hour 3.7 (0.1 - 7.8)
Duration * per peak 2.9 (0.7 - 18.9)
No. peaks <5 !'nin. 3.0 (0.2 - 6.4)
No. peaks >5 min. 0.5 (0.0 - 1.5)
*minutes; Data standardized to one hour
90

4.9 DISCUSSION
This study shows that, with the improved tech.TJ.ology and methods,
long-term ambulatory dual gastro-duodenal pH monitoring is now
possible. For the first time, an accurate profile, in normal healthy
subjects, of the twenty four hour acid exposure within the duodenal
bulb has been recorded, and detailed assessment of the differences
between daytime and nocturnal exposure can be made. These results
enable new light to be shed on the physiology of the duodenum. In
addition, the concurrent gastric pH profile allows for better
understanding of the pH fluctuations in the duodenum.
The problems associated with pH measurements within the duodenal
bulb have been referred to in Chapter 2 and previously discussed by a
number of authors (Rovelstad and Maher 1962, Andersson and
Grossman 1965, Rune 1981). The most important of these factors is
placing and maintaining the electrode within the duodenal bulb at a
known and reproducible distance from the pylorus. This is vital due to
the steep pH gradient between the apex and the base of the bulb
(Rhodes and Prestwich 1966, Rune 1981). Measurement of the change
in transmural electrical potential difference across the pylorus was
proposed for identifying the gastro-duodenal junction (Andersson and
Grossman 1965). Using this method, the position of the duodenal
electrode was established. However, maintaining its position was the
drawback of this system and frequent repositioning of the electrode
,vas not practical over foe longer term. An alternative proposal was
the use of four electrodes strapped together at 1.5 cm. intervals (Rune
1981, Hannibal and Rune 1983). A four-channel analogue pH recorder
displayed the four pH tracings, and the pattern of tracings enabled the
91

positions of each electrode to be determined. Although accurate, the
system was too bulky to be portable and not suitable for long-term
recordings. The method employed in this present investigation was
relatively simple and ensured that the electrode was placed at a
reproducible distance from the pylorus. The apex of the duodenal bulb
was selected as the site for pH determination as it was the more
readily apparent site on the fluoroscopic screen. Accurate placement
was achieved by using the combination of voltage read-outs from the
receiving unit and fluoroscopic screening, as earlier described. It has
been shown earlier (McCloy, Vickery and Baron 1980) that the caudal
peristaltic pull on the weighted bag, which acted like a sheet-anchor,
maintained the electrode position most adequately in the short-term
(five hours) and this was confirmed during the 24 hours of this study.
In only five of the forty eight studies was shift of the electrode
position noted.
The mean fasting pH in the duodenal bulb of t.llis cohort of healthy
subjects was pH 6.73, and the individual values ranged from pH 5.1 to
pH 7 .4. These results are in agreement with those of other studies
(Berk, Rehfuss and Thomas 1942, Schaffaiitzky de Muckadell et al
1979, McCloy, Greenberg and Baron 1984) which reported a range of
mean duodenal bulb pH of 5.0 - 7.0. However, other studies invoiving
normal subjects have reported lower mean fasting pH values in the
bulb (Archambault, Rovelstad and Carlson 1967, Rune 1968, Hannibal
and Rune 1983, Bendtsen et al 1986, Ovesen et al 1986). These latter
reports found the mean bulb pH to vary between pH 2.4 and pH 4.5.
The discrepancy between the tvvo sets of values a.rises from the
differing positions of the recording electrodes. Rune's unit m
Copenhagen has al ways measured and reported the pH within 1.5 cm.
of the pylorus and lower pH values have always been found in. this
92

area. Nevertheless, the fourth (most distal) electrode of their
monitoring system was situated in the distal part ( apex) of the
duodenal bulb. This electrode recorded a fasting pH of approximately
6.5 (Hannibal and Rune 1983).
The pattern of fasting pH values in the present study was varied, and
showed multiple rapid fluctuations towards higher acidity. The median
values in all the subjects remained in the pH range of 5.0 - 7.0. By
increasing the sampling rate, the short duraticn of these fluctuations
was accentuated, as can be seen by comparing Figure 3.9 with Figure
4.2. The presence of these fluctuations were noted many years ago
and caused consternation as to the validity of the measured pH.
Because of this, the use of shields around the electrodes was
proposed. However, the pH fluctuations are considered to be a
reflection of the intense acid neutralization process that occurs in the
bulb following the intermittent emptying of gastric contents, especially
after a meal.
The fa sting gastric pH of 1.91 ( range 1.3 - 2.4), demonstrated in this
study, compared favourably with those levels reported previously: a
range from pH 1.0 to pH 3.9 (Berk, Rehfuss and Thomas 1942.
Rovelstad, Owen and Ma.gath 1952, Rhodes and Prestwich 1966, Fimmel
et al 1985, Oveson et al 1986). In contrast to the duodenal pH, no
fluctuations were observed in gastric pH during the fasting period, and
this confirms previous reports. The electrode in this investiga.tion was
placed in the antrum along the lesser curve. This point is important
for comparisons with other studies, as it has been established that the
gastric fundus has a lower pH than the antrum (Tomenius and
,Villiams 1960, Marcussen and Rygvold 1961). However, recentiy it
93

was found that the fa sting antral pH was similar to that of the fundal
pH (Fimmel et al 1985).
There have been no reports in the literature of the analysis of 24
hour pH monitoring of the gastro-cuodenal contents. Rhodes, Apsimon
and Lawrie (1966) investigated a small group of six normal subjects
for between four and fifteen hours. As the results are all analysed
together, it is not possible to construct a pH profile. More recently, a
new technique (McCloy, Vickery and Baron 1980) was described for
dual pH monitoring, but results from a group of healthy subjects was
not reported.
The profile of the duodenal bulb exposure to acid during the day took
on an exponential shape where almost 40% of the pH readings occurred
below pH 5.0 and approximately 8% were below pH 2.0. Although wide
individual variation occurred, the trend in exposure followed tte same
downward curve. Of interest, was the comparison of this daytime
profile with that which occurred at night. The nocturnal acid exposure
was found to be of similar profile as the daytime curve: almost 38%
of the data occurred below pH 5.0 and around 4% at a level of below
pH 2.0. The upper limit of the range of nocturnal exposure was
skewed slightly by the acidic exposure experienced by one of the
subjects. Nevertheless, there appeared a tendency for the daytime
exposure to be somewhat more acidic than that at night. This latter
tendency could be expected as the interdigestive secretory rate of
gastric acid is normally low at 2 - 3 mEq/hour. In contrast, patients
with duodenal ulcer were found to have significantly increased
nocturnal gastric secretory rates (Winkelstein 1935, Levin, Kirsner
and Palmer 1950).
94
The pattern of acidity within the antn1m differed during the daytime
recording from that at night. Although the mean pH ranged from pH
1.5 to pH 2.5, rises in antral pH du:-ing the day occurred only at
times of eating or drinking, and on occasions, reached a level of pH
6.0. On the other hand, at night, only a minority of recordings rose to
a level of above pH 3.0. Indeed, the exposure at night to levels above
pH 3.0 and 4.0 were significantly less than the daytime exposure.
Although the nocturnal gastric pH was usually constant, six subjects
exhibited spontaneous rises in antral pH to between pH 4.5 and pH
7.5. These episodes lasted behveen seven minutes and two hours. As
no apparent precipitating cause was encountered, the possibilty of
duodena-gastric reflux should be considered. These pH rises have been
noted by other workers (Shiratori et al 1983, Fimmel et al 1985,
Kapur 1987 [personal communication]). Previous studies have
encountered a decline in early morning acidity and its increase before
breakfast (Sandweiss et al 1946, Fimmel et al 1985), but this was not
found in the present study.
As previously mentioned, the pH pattern in the duodenal bulb is one of
"background" near-neutrality interrupted by rapid and frequent peaks
of acidity. The pattern of this fluctuating acidity was similar during
the day as it was at night. However, longer acid exposure was
demonstrated during the day. This slight increased exposure could be
expected due to the daytime ingestion of meals, and hence increased
gastric acid secretory rates. The acidity within t.1-ie duodenal bulb
depends upon three main factors: rate of inflow (gastric emptying
rctropulsicn from the second part of the duodenum);
neutralization processes; and rate of outflow ( duodenal propulsive
motility). As the number of acid peaks and their average duration did
not vary between day and night, it could be specuiated that the gastric
95

emptying rate is similar during day and night. Interestingly, rises m
duodenal acidity post-prandially have been demonstrated without
concurrent rises in antral pressure (Rhodes, Goodall and Apsimon
1966). The neutralization process and duodenal propulsive motility can
be examined by closer inspection of these acid peaks. For durations of
two or more minutes, the number of short-lived acid peaks
significantly outnumbered the number of long-lived peaks, both during
the day and at night ( see Table 4.4). However, with the duration set
at one minute, there were significantly more long-lived peaks. This
latter finding could be a result of the sampling rate being too slow. A
faster rate would have detected the rapid and brief peaks already
described. An example of this is shown in Figure 3.9 which illustrates
the fasting duodenal pH sampled at a rate of once every second.
However, the importance of these extremely rapid acid peaks in the
physiology of the duodenum remains unclear. The study by '\Vormsley
and Mahoney (1967) showed that in healthy subjects, adequate ammmts
of bicarbonate were secreted in response to exogenous secretin and
acid stimulation. They suggested that intraluminal buffering with
bicarbonate was the main mechanism for the removal of hydrogen ions
from the duodenum. This also suggests an explanation for the rapid
and brief peaks of acidity. As the ratio of short- to long-lived peaks
was the same during day and night, it suggests that the duodenal
propulsive motility is the same during day and night.
It is well established that gastric acid secretion is stimulated by vagal
activity (Mayer et al 1974, Stadil 1974, Feldman and Walsh 1980,
Brunner et al 1984), the mechanism of which is thought to be primary
direct stimulation of the parietal cells (Mayer et al 1974, Richardson
et al 1977, Konturek et al 1978). Vagal Stimulation alone is the result
of cephalic stimulation which encompasses thought, sight, smell and
')6

taste of food. It has been found that thought is the most powerful of
these stimulating factors (Feldman and Richardson 1986). Two
metllods may be employed to stimulate vagal activity, either
pharmacologically with insulin-induced hypoglycaemia, or physiologically
with either adequate sham feeding or modified sham feeding. The
former feed allows the normal consumption of a meal that is not
allowed to reach the stomach ( food is diverted away through a
gastrostomy). The latter feed uses the "chew-and -spit" technique.
These two feeding methods have been compared ( Stenquist, Knutson
and Olbe 1978) and both produced similar acid responses. Modified
sham feeding was used in this investigation for a feed duration of
tllirty minutes, as this has been shown to be the optimum time
(Konturek et al 1981).
The combination of cephalic stimulation by modified sham feeding and
the ingestion of a solid meal produced a duodenal exposure to acid that
was slightly greater than the full daytime exposure. This would be
expected with the increased gastric acid secretion. These figures
compare with some previous reports (Berk, Rehfuss and Thomas
1942, Hannibal and Rune 1983, Ovesen et al 1986), but not others who
showed less acidic post-prandial results (Rhodes and Prestwich 1966,
McCloy, Greenberg and Baron 1984). The pattern of acid peaks within
the bulb did not change during this post-prandial period. 0 f particular
note, is the similar number of recorded acid peaks. Hannibal and Rune
(1983) have also reported the numbers of peaks pre- and post-meal to
be similar, except for during the immediate post-prandial period.
97

CHAPTER 5
24 HOUR AMBULATORY DUAL GASTRO-DUODENAL pH PROFILES
OF PATIENTS WITH ACUTE DUODENAL ULCER
98

5.1 HYPOTHESIS I
The formation of duodenal ulcer is a result of an imbalance of the
normal interaction between gastric juice (acid and pepsin), duodenal
secretions (bicarbonate and mucus) and the duodenal mucosa. In
duodenal ulcer disease, abnormal gastric hypersecretion has been well
documented (Winkelstein 1935, Levin, Kirsner and Palmer 1950, Baron
1973, Fordtran and ·walsh 1973, Wormsley 1974), but there is much
overlap with normal subjects (Wormsley and Grossman 1965).
Excessive amounts of acid have been found in the duodenal bulb of
patients with duodenal ulcer (Rhodes and Prestwich 1966, Archambault,
Rovelstad and Carlson 1967), but more recent studies have not shown
this (McCloy, Greenberg and Baron 1984, Bendtsen et al 1986). As
these studies have all been perf armed in tl1e short-term, the hypothesis
is extended to encompass the full 24 hour period t.l-iat: duodenal ulcer
patients either are exposed to an excessive amount of gastric acid or
the exposure to a "normal" amount of acid is prolonged.
5.2 STUDY AIM
In order to test the above hypothesis, the investigation described in
Chapter 4 was repeated with patients with duodenal ulcer. The study
was set out to achieve two main aims:
1. To record, for the first time, the continuous, ambulatory,
twenty four hour, simultaneous profile of gastric and duodenal bulb pH
in patients with active duodenal ulcer, off-treatment. The study
incorporated periods of fasting, cephalic stimulation and ingestion of a
solid meal and the respective pH responses were recorded.
99
2. To compare these profiles of antral a..11.d duodenal bulb pH in
the duodenal ulcer patients with the cohort of healthy subjects
described in Chapter 4.
5.3 STUDY GROUP
Duodenal ulcer patients (n=27). There were eighteen men and and nine
women. The mean age was 45.9 years, and the range was from 23 to
75 years. All patients were diagnosed endoscopically as having active
duodenal ulcers, and were randomally selected on attendance at the
Endoscopy Clinic. (In most cases, the endoscopy was performed by the
author). Dual gastro-duodenal pH monitoring was performed within
three weeks of the upper gastro-intestinal endoscopy examination. Any
treatment with antacids or gastric anti-secretory drugs was stopped at
least 48 hours prior to the study, and not taken during the study
period. Those patients excluded from the investigaticn were: a)
patients who had a previous history of any form of ulcer surgery
being performed; b) patients with a concommitant gastric ulcer; c)
patients with other gastro-intestinal pathology; d) patients under the
age of 18 years.
An additional patient (A.R.) was studied. He was 23 years of age and
had, two years earlier, undergone a highly selective vagotomy for
duodenal ulcer disease. He had presented to the Clinic with a
recurrence of his ulcer symptoms, and an active duodenal ulcer on the
anterior wall of the duodenal bulb was seen at endoscopic examination.
His results, for comparative purposes, are presented separately.
100

5.4 STUDY DESIGN - STUDY II
The study was set out as for the investigation with the healthy subjects described in Chapter 4, Section 4.3 as shown in Figure 5.1. The dual pH monitoring system was first calibrated, then positioned in the patient's antrum and duodenal bulb in similar fashion. The same standardized meal (Illustration 4.1) was served for the modified sham feed, and great care was taken in explaining the requirements of this part of the study. The patients were instructed to perform the "chewand -spit" technique for a duration of thirty minutes.
Figure 5.1: Study Design - Study II
start MSF MEAL home end
I 0 1 2 3 4 5 6 7 ... ... 24 (MSF: modified sham feed) Time (hours)
Two and a half hours after the MSF, the same standardized solid meal (Illustration 4.2) was served. After the post-prandial recording period, the patients were allowed home with the pH monitoring system in situ. The same instructions were given regarding the use of the "event" button. At the end of the twenty four hour study period, the recording was stopped, re-calibration performed and the data transferred to the computer as earlier described.
101

5.5 ANALYSIS AND STATISTICS
Computer analysis of the pH data was performed as described in
Section 3.4.3. The statistical methods ( Section 3.5) used for within
group and between group analyses were the Wilcoxon Matched-Pairs
Signed-Ranks test and Mann-·Whitney U test.
5.6 ETHICAL APPROVAL
The protocol for this part of the investigation was approved by the
Ethics Comr.iittee of the University of Dundee, and the Tayside Health
Board.
5.7 DUODENAL BULB pH PROFILE IN DUODENAL ULCER
PATIENTS
5.7.l Fasting duodenal bulb pH
Of the twenty seven patients with duodenal ulcer (DU), twenty four
had complete duodenal pH tracings, as the distal electrode prolapsed
back into the antrum for the duration of the study in the remaining
three patients. As for the healthy subjects, the fasting pH was
determined by the mode of the pH data from the duodenal eiectrode
whilst recording in the fasting state. The DU patients demonstrated a
mean fasting duodenal bulb pH of 6.20 (SD 1.18). This was similar to
that shown by the normal subjects. The range of pH values amongst
the patients, however, was wider; this being 2.0-7.S (Table 5.1). 1T.,,;,..,... tt..o \/f,,,......, ~;Vt-,;+~"" TT +c.~+ -"~r n"Il parametr;C a'at"' thP.,...e \"aS DO v...:,.1..:..:.5 \..1..1.v .!..f.L{.\J.il.1- tr J.l.!.lJ..1.',,,,...J V lV.:>l .l.U l..i.;..I - 1. -L J u, ...;J. ,;
statistical difference between the values of the two groups.

103
Table 5.1: Fasting duodenal bulb pH of healthy subjects and patients
\Vith active duodenal ulcer.
CONTROLS (n=19) DU PATIENTS (n=24)
VOL pH PAT pH
AM 6.9 MM 6.6 p = NS
CE 7.4 GD 5.1 (Mann-'Whitney
IW 6.1 DD 6.9 U test,
FA 7.1 A\V 6.8 Z = 1.6875)
MD 7.2 TH 6.2
SM 6.9 RM 6.6
LR 7.4 RL 4.7
WF 5.9 EB 6.1
MZ 7.0 JF 2.0
DB 7.2 DM 6.8
RH 6.1 RC 6.5
CB 6.5 JM 5.8
GM 7.3 JS 6.3
RL 5.1 JT 7.0
SE 6.5 cw 6.8
:MM 6.7 DL 7.5
NL 6.8 JT 7.1
TM 6.7 JR 6.8
NW 7.1 LA 5.9
NE 7.1
MB 7.0
MM 7.2
DM 5.3
RS 4.8

The fasting duodenal bulb pH of Patient A.R., who had previously had
a highly selective vagotomy performed and had presented with an ulcer
recurrence, was pH 4.4.
5. 7 .2 Total duodenal bulb acid exposure
The frequency of distribution of the cumulative percentage of total pH
recordings from the duodenal electrode was calculated with the
software analysis as for the healthy subjects. The data to the pH
levels of less than 1, 2, 3, 4 and 5 were analysed.
The acid exposure at each pH level was similar during the day and at
night. These results, together with those of the control group for
comparison, are displayed graphically in Figure 5.2, while the tabular
form is presented in the Appendix (Table A.I). There was a tendency
for the daytime exposure to be slightly greater than at night, at pH
levels 4 and 5, and this was reversed at pH levels of 3 and 2, where
nocturnal exposure was somewhat more acidic. However, as for the
healthy subjects, there was no statistical difference in the exposure at
any pH level. Comparison of this data with that of the control group,
showed no significant differences at any of the pH levels (Mann
Wr.itney U test).
Patient A.R. (Past HSV and recurrent ulcer) experienced a far more
acidic environemnt in the duodenal bulb during the day compared to
both the other DU patients and healthy subjects. Fluctuations in the pH
level were extremely rapid and frequent. At night, the fluctuations
continued, although to a lesser degree, and the overall exposure to acid
was less than that exhibited by the other DU patients. These resuits
are shown below:

FR
EQ
UE
NC
Y D
IST
RIB
UT
ION
OF
CU
MU
LA
TIV
E P
ER
CE
NT
AG
E O
F T
OT
AL
D
UO
DE
NA
L p
H D
AT
A I
N D
U P
AT
IEN
TS
AN
D H
EA
LT
HY
CO
NT
RO
LS
50
, D
U P
AT
IEN
TS
5
0-l
C
ON
TR
OLS
Da
ytim
e
40
-i
40
-l
---
Noc
turn
al
\ 3
0-
Cum
. 301 \\
C
um.
%
%
20
2
0- I
\ ~ \
10
-f
\,
,oj ',,~
·' '
' 0-
1 I
I ·~
I
0 I
I I
I 5
4 3
2 1
5 4
3 2
1 pH
le
vel
pH L
evel
Fig
ure
5.2
: F
requ
ency
dis
trib
utio
n o
f cu
mul
ativ
e pe
rcen
tage
of
tota
l
duod
enal
plI
dat
a in
D
U p
atie
nts
and
heal
thy
cont
ro]s
0 Vl
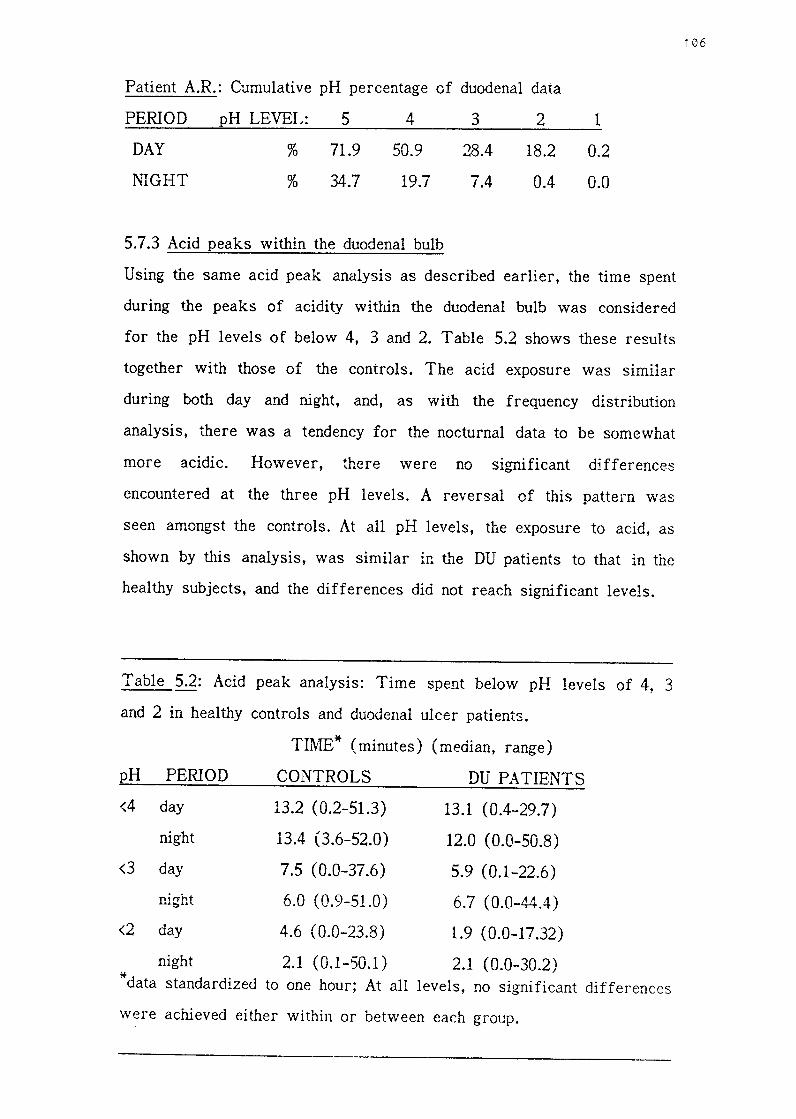
Patient A.R.: Cumulative pH percentage of duodenal data
PERIOD
DAY
NIGHT
pH LEVEL: 5
% 71.9
% 34.7
4
50.9
19.7
5.7.3 Acid peaks within the duodenal bulb
3
28.4
7.4
2
18.2
0.4
1
0.2
0.0
Using the same acid peak analysis as described earlier, the time spent
during the peaks of acidity within the duodenal bulb was considered
for the pH levels of below 4, 3 and 2. Table 5.2 shows these results
together with those of the controls. The acid exposure was similar
during both day and night, and, as with the frequency distribution
analysis, there was a tendency for the nocturnal data to be somewhat
more acidic. However, there were no significant differences
encountered at the three pH levels. A reversal of this pattern was
seen amongst the controls. At all pH levels, the exposure to acid, as
shown by this analysis, was similar in the DU patients to that in the
healthy subjects, and the differences did not reach significant levels.
Table 5.2: Acid peak analysis: Time spent below pH levels of 4, 3
and 2 in healthy controls and duodenal ulcer patients.
TIME* (minutes) (median, range)
pH PERIOD CONTROLS DU PATIENTS
<4 day 13.2 (0.2-51.3) 13.1 (0.4-29.7)
night 13.4 (3.6-52.0) 12.0 (0.0-50.8)
<3 day 7.5 (0.0-37.6) 5.9 (0.1-22.6)
nirrht 6.0 ( 0.9-51.0) 6.7 (0.0-44.4) .......... 0 .........
<2 day 4.6 ( 0.0-23.8) 1.9 (0.0-17.32)
night 2.1 (0.1-50.1) 2.1 (0.0-30.2) * data standardized to one hour; At all levels, no significant differences
were achieved either within or between each group.
106
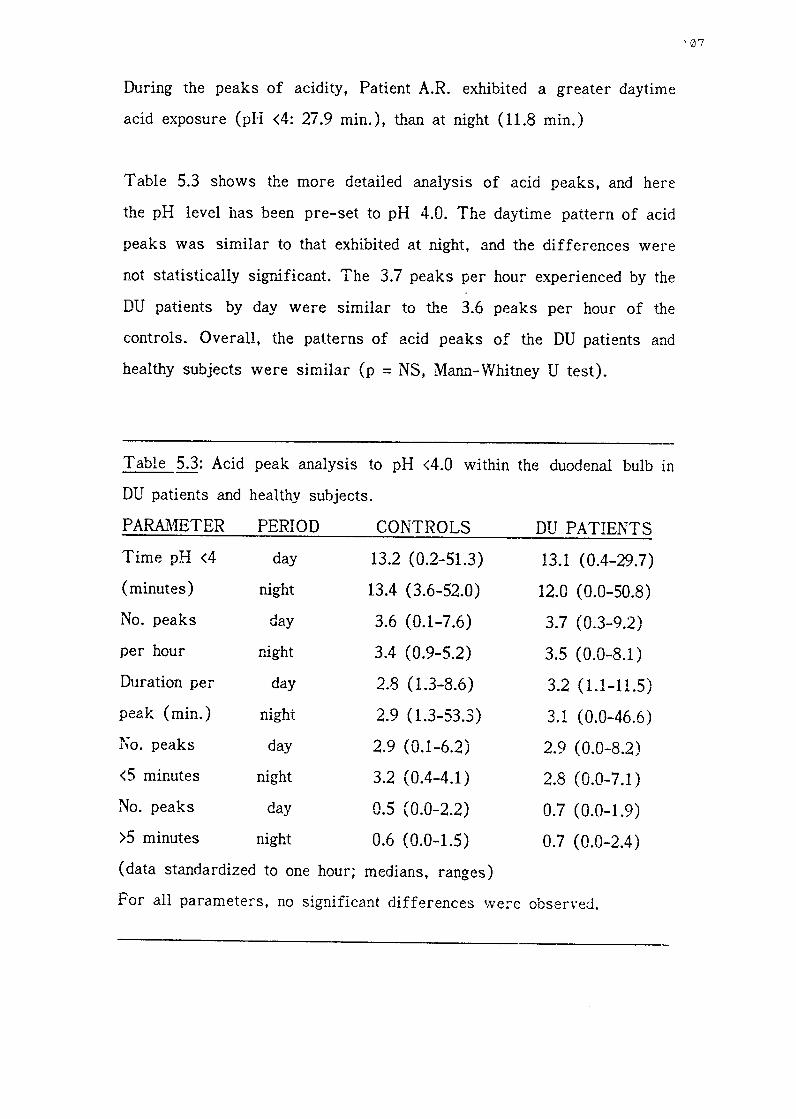
During the peaks of acidity, Patient A.R. exhibited a greater daytime
acid exposure (pH <4: 27.9 min.), than at night (11.8 min.)
Table 5.3 shows the more detailed analysis of acid peaks, and here
the pH level has been pre-set to pH 4.0. The daytime pattern of acid
peaks was similar to that exhibited at night, and the differences were
not statistically significant. The 3.7 peaks per hour experienced by the
DU patients by day were similar to the 3.6 peaks per hour of the
controls. Overall, the patterns of acid peaks of the DU patients and
healthy subjects were similar (p = NS, Mam1-"Whitney U test).
Table 5.3: Acid peak analysis to pH <4.0 within the duodenal bulb in
DU patients and healthy subjects.
PARAJ\IBTER PERIOD CONTROLS DU PATIENTS
Time pH <4 day 13.2 ( 0.2-51.3) 13.1 (0.4-29.7)
(minutes) night 13.4 ( 3.6-52.0) 12.0 (0.0-50.8)
No. peaks day 3.6 (0.1-7.6) 3.7 (0.3-9.2)
per hour night 3.4 (0.9-5.2) 3.5 (0.0-8.1)
Duration per day 2.8 ( 1.3-8.6) 3.2 (1.1-11.5)
peak (min.) night 2.9 ( 1.3-53.3) 3.1 (0.0-46.6)
No. peaks day 2.9 (0.1-6.2) 2.9 (0.0-8.2)
<5 minutes night 3.2 (0.4-4.1) 2.8 (0.0-7.1)
No. peaks day 0.5 (0.0-2.2) 0.7 (0.0-1.9)
>5 minutes night 0.6 (0.0-1.5) 0.7 (0.0-2.4)
(data standardized to one hour; medians, ranges)
For all parameters, no significant differences \Vere observed.
107

The above results showed that the patients with active duodenal ulcer
experienced a similar duration and pattern of acid exposure in the
duodenal bulb as did the healthy subjects. The question of whether or
not there was a difference in the pattern of this exposure within the
bulb was then addressed to the DU patient group. Seven records were
available for additional analysis by the new modified software
programme ( see Section 3.4.3). The durations of the acid peaks
selected here were l, 2. 3, 4 and 5 minutes.
Figure 5.3 shows the numbers of short-lived acid peaks in the
duodenal bulb for both the DU patients and controls; ( short-lived peaks
being less than 1, 2, 3, 4 and 5 minutes' duration). The number of
short-lived peaks exhibited by the DU patients during daytime recording
was similar to that of the healthy subjects, and no significant
differences were observed (Mann-Whitney U test). However, during
nocturnal recordings, the DU patients exhibited far fewer short-lived
peaks than during the day; the differences did not reach significance.
presumably because of the small numbers. Comparing these nocturnal
results, there would appear to be a marked difference between the
control and patient groups, but again due to the small numbers,
statistical significance was not reached.
Further differences were observed by comparing the numbers of
short-lived and long-lived acid peaks (i.e. shorter than and longer than
the pre-determined duration). The results are shown in Figure 5.4, as
well as in tabular form in Table A.2 in the Appendix. The daytime
recordings revealed significantly (p <0.01) more frequent short-lived
acid peaks of duration less than 3, 4 and 5 minutes. This pattern was
reversed for acid peaks of one minute's duration, as the long-lived
peaks were present in significantly (p <0.01) greater numbers. This

5
* 4
.,, ~
Ctl
a,
C.
:2
3 (.
) C
tl -0 t 2
.0
E
:,
z 1 0
AN
AL
YS
IS O
F N
UM
BE
R O
F A
CID
PE
AK
S O
F V
AR
YIN
G D
UR
AT
ION
IN
H
EA
LT
HY
CO
NT
RO
LS
AN
D D
U P
AT
IEN
TS
CO
NT
RO
LS
D
U P
AT
IEN
TS
(n
=9
) (n
=7
)
0 D
ayti
me
~
Noc
turn
al
<1
<
2
<3
<
4
<5
<
1
<2
<
3
<4
<
5
Du
rati
on
of
Aci
d P
eaks
(m
inut
es)
* D
ata
std.
to
on
e ho
ur.
Fig
ure
5.3
: A
naly
sis
of
num
ber
of
acid
pea
ks
of
vary
ing
dura
tion
(le
ss
than
1,
2,
3, 4
and
5 m
inut
es)
in h
ealt
hy c
ontr
ols
and
DU
pat
ient
s
IS>
\()

Cl)
...
I 0 a:
I- 2 0 u
3
~, ~~
rJ
Q.I
Cl.
:Q
2 u ro
-0 ... 1l
r, E
1
::,
z
ol I
g 1
3~
Cl)
~
co
Q) a.
:g
2 tl
co
.... 0 ... 1l
E
1 ::,
2
0 • .a
....
..L
-. 1
>- <(
0
-
LP.
I II
I I
I I •
I 2
3 4
5
.-,
n I
I- :c
0 2
2 3
4 5
Dur
atio
n o
f ac
id p
eaks
(m
in)
3
"' ~
co
Q)
2 a.
"C
·c:
; cu -0 ... Q
) .0
-1
E
::,
2
Com
pari
son
of
Cl)
S
ho
rt-l
ived
to
I o
I- 2 L
ong-
live
d A
cid
w
1 2
3 4
5 I-
Pea
ks i
n D
uode
nal
<(
Bul
b o
f H
ealt
hy
I 0
Sh
ort
c.
.
3 :::>
S
ubje
cts
and
0
Duo
dena
l U
lcer
II
Lon
g P
atie
nts
"' ~
co [
Fig
ure
5.4
2 "C
·u
I co
....
n 0
n ...
n ]
fll
1 E
::,
2
0 1
2 3
4 5
Du
rati
on
of
acid
pea
ks (
min
) 0

pattern compared favourably with that of the controls, and no
significant differences were observed between the two study groups.
The nocturnal recordings showed a similar pattern but somewhat
scaled down. Short-lived peaks were only present in significantly (p
<0.01) greater numbers at the duration of five minutes. Again, long
lived peaks of greater than one minute's duration were significantly (p
<0.01) more numerous than short-lived acid peaks.
Patient A.R. displayed a similar pattern of short- and long-lived aid
peaks, with short-lived peaks being more numerous between 2 - 5
minutes' duration, but long-lived peaks being predominant at 1 minute's
duration. This daytime pattern was repeated at night.
5.8 INTRAGASTRIC ACIDITY OF DU PATIENTS
5.8.1 Fasting gastric pH
As in the group of healthy subjects, the patients with duodenal ulcer
exhibited a steady gastric pH profile during the fasting period. The
mean pH (mode of the data) was 1.82 (SD 0.31). The range of
fasting pH levels was the same as that of the controls, being pH 1.3
- 2.4. There was no statistical difference between the fasting pH of
either group (Mann-Vvhitney U test, Z = 0.7701 ).
The fasting gastric pH of Patient A.R. was similar to the group 2s a
whole, at pH 1.9.
5.8.2 Intragastric acidity
The cumulative percentage of the total gastric pH data revealed an
exponential decrease in the profile of the daytime exposure as the pH
rose to 7.0. This profile matched that of the healthy subjects, although
1 ' 1 ''

the latter experienced a slightly more acidic exposure (Figure 5.5,
Table A.3). The pH profile of nocturnal readings was more acidic
and showed a steeper curve. Significant differences between the
daytime and nocturnal recordings were observed at pH 3, 4 and 5 (p
<0.01, Wilcoxon Matched-Pairs Signed-Ranks test). At night, the DU
patients experienced significantly (p <0.05) fewer data points above pH
3.0 than the healthy subjects, and above this pH level, the number of
readings was minimal.
The alternative analysis of determining the acid profile and exposure
is shown graphically in Figure 5.6., where the duration of pH nses
within the stomach is examined. The time spent during the pH rises
was significantly longer during the day compared to at night. As shown
by the cumulative pH percentage · analysis, th.e nocturnal recordings
were more acid as minimal time was spent at pH levels of above 3, 4
and 5. The time spent above pH 3 and 4 at night was significantly (p
<0.05) shorter among the DU patients when compared to controls. This
data is also shown in Table A.4.
Patient A.R. experienced less time during the day at the higher pH
levels of 3, 4 and 5 than the other DU patients. There was a sharp
drop in the exposure time when considering the levels of pH >2 and
pH >3. At night, a more steady gastric tracing was obtained and the
pH rarely rose to above pH 3.0.
112

CU
MU
LA
TIV
E p
H P
ER
CE
NT
AG
E O
F G
AS
TR
IC p
H D
AT
A I
N H
EA
L T
HY
SU
BJE
CT
S
AN
D D
UO
DE
NA
L U
LC
ER
PA
TIE
NT
S
10
0-1
H
EA
L T
HY
SU
BJE
CT
S
100 l
DU
PA
TIE
NT
S
\
\ D
ay
00-1
\ ao
I
\ --
--
Nig
ht
~ \
* p
< 0
.001
**
p <
0.0
02
' ' 6
0-1
\
\ ' 6
0 -
Cum
. _,
\\
Cum
. %
%
\
40
-1
\ \
40
\ \ \ \ \
20
-1
\ \
20
\ ' \ \ \ 0
J I
I I
I -
-,-:
?>-1
1
0 ..J
I
I '-
-..
I I
I -::
:;:=- I
1 2
3 4
5 6
7 1
2 3
4 5
6 7
Fig
ure
5.5
vi

60 5J
40 -
I
Tim
e 30
~ (m
in)L
\ (m
edia
n)
20
10 -
I
0 _
J
DU
RA
TIO
N O
F R
ISE
S I
N I
NT
RA
GA
ST
RIC
pH
OV
ER
24
HO
UR
S I
N H
EA
LT
HY
S
UB
JEC
TS
AN
D D
UO
DE
NA
L U
LCE
R P
AT
IEN
TS
~ ~
0 D
aytim
e
~
Noc
turn
al
I~
~
I~
*
p <
0.01
I fa 1
1
I~
**
p
< 0.
05
r·*
*,
r*
, ~ ~ ~
r-*
,
I V.
l'i I
t/'l
,-1<
·-,
[l r*
,
[L
[l r
*-o
~
L..
..L
Q
Cb
J
0..
..
>1
>
2
>3
>
4
>5
>
1
>2
>
3
>4
>
5
pH
pH
HE
AL
TH
Y S
UB
JEC
TS
D
U P
AT
IEN
TS
D. da
ta s
tand
ardi
zed
to o
ne h
our.
Fig
ure
5.6
~
-I'-

Patient A.R.: Duration of rises in intragastric pH to above pH levels
of 1, 2, 3, 4 and 5. ( data standardized to one hour)
pH LEVEL TIME (min.): DAY NIGHT
>1 59.5 59.9
>2 33.7 52.6
>3 9.4 0.8
>4 2.9 0.4
>S 1.2 0.2
Seven patients exhibited the spontaneous rises in nocturnal pH that
were observed amongst the healthy subjects. The pH tracings at night
of the remairiing patients showed a steady profile. Five DU patients
showed a single rise in pH and two experienced three episodes. The
range of pH rise was from pH 4.2 to pH 7.5, with a median value of
pH S.S. These episodes occurred between 1.30 am. and 5.55 am. and
lasted between 10 and 80 minutes. As with the control subjects, no
precipitating factors were evident, and no concommitant changes were
observed in the duodenal tracing.
5.9 THE EFFECT OF MODIFIED SHAM FEEDING AND AN
INGESTED SOLID MEAL IN DU PATIENTS
The ingestion of the solid meal caused an initial nse in antral pH,
due to the buffering effect of the food. The peak nse in gastric pH
reached a mean level of pH 5.5 (SD 0.9) and thereafter, the acidity
steadily increased to return to the pre-meal level. This time was
variable and ranged from 38.0 to 157.1 minutes. There was no
difference when compared to the controls. The acid exposure in the
duodenal bulb following the modified sham feed and solid meal was
similar to that experienced over the full duration of the study.
115
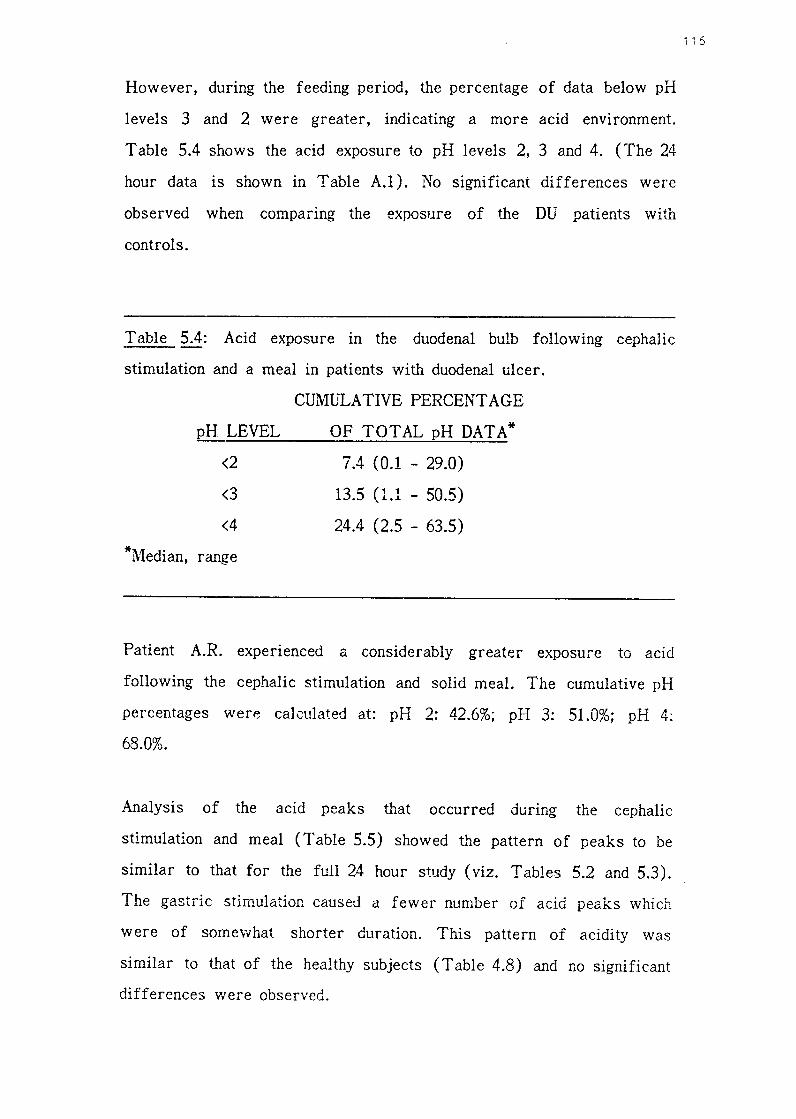
However, during the feeding period, the percentage of data below pH
levels 3 and 2 were greater, indicating a more acid environment.
Table 5.4 shows the acid exposure to pH levels 2, 3 and 4. (The 24
hour data is shown in Table A.l). No significant differences were
observed when comparing the exposure of the DU patients with
controls.
Table 5.4: Acid exposure in the duodenal bulb fallowing cephalic
stimulation and a meal in patients with duodenal ulcer.
pH LEVEL
<2
<3
<4
*Median, range
CUMULATIVE PERCENT AGE
OF TOTAL pH DATA*
7.4 (0.1 - 29.0)
13.5 (1.1 - 50.5)
24.4 (2.5 - 63.5)
Patient A.R. experienced a considerably greater exposure to acid
following the cephalic stimulation and solid meal. The cumulative pH
percentages were calculated at: pH 2: 42.6%; pH 3: 51.0%; pH 4:
68.0%.
Analysis of the acid peaks that occurred during the cephalic
stimulation and meal (Table 5.5) showed the pattern of peaks to be
similar to that for the full 24 hour study ( viz. Tables 5.2 and 5.3).
The gastric stimulation caused a fewer number of acid peaks which
were of someYvhat shorter duration. This pattern of acidity was
similar to that of the healthy subjects (Table 4.8) and no significant
differences v1ere observed.
i 16

Table 5.5: Analysis of acid peaks within the duodenal bulb following
cephalic stimulation and a meal in patients with duodenal ulcer.
PARAMETER Median (range)
Time* pH <4 13.1 (0.9 - 37.3)
No. acid peaks/hour 2.8 (0.4 - 9.1)
Duration* per peak
No. peaks <5 min.
No. peaks >5 min. * . mmutes
Data standardized to one hour
2.8 (1.1 - 13.2)
2.2 (0.0 - 8.1)
0.4 (0.0 - 1.6)
A similar pattern of acid peaks was exhibited by Patient A.R. and his
data occurred in the upper half of the ranges displayed by the other
DU patients.
5.10 DISCUSSION
It is important to note at the outset that the patients investigated in
this study suffered from acute duodenal ulcer. They were diagnosed
endoscopically, and the dual pH monitoring was performed within three
weeks of the endoscopic examination. This is an important
consideration as it has been shown that patients with active
symptomatic duodenal ulcer have different rates of acid output
compared to inactive duodenal ulcer patients (Sandvik et al 1985).
( Achord 1981 )
The level of fasting pH in the duodenal bulb experienced by the
patients in this investigation confirmed the results of some previous
117

studies (Rovelstad and Maher 1952, McCloy, Greenberg and Baron
1984 ). Other studies have recorded more acidic fasting levels (Eyerly
1940, Atkinson and Henley 1955, Archambault, Rovelstad and Carlson
1967, Bendtsen et al 1986, Rosenkilde-Gram et al 1986). As discussed
fully in the previous chapter, the discrepancy arises from the
differing positions of the recording electrode within t..lie duodenal bulb.
However, a significant finding was that there was no appreciable
difference in the fasting duodenal bulb pH between the DU patients and
healthy subjects, except that the range of individual vaiues was wider
amongst the patients. It has been shown that the basal gastric acid
output of DU patients is significantly greater than controls (Wormsley
and Grossman 1965, Feldman, Richardson and Fordtran 1980), but trJs
was not reflected in increased duodenal acid levels in the fasting
state.
The mean fa sting gastric pH of 1.82, with a range of pH 1.3 - 2.4,
was similar to that reported previously: a range from pH 1.2 to pH
2.1 (Rhodes, Apsimon and Lawrie 1966, Greenberg et al 1982,
O'Sullivan, Harrison and Bullingham 1984, Fimmel et al 1985). In this
study, no difference was found between the pH levels of DU patients
and healthy subjects, and in both groups, the pH was steady during this
period.
Abnormal gastric hypersecretion not only occurs m the basal state, but
in some DU patients the hypersecretion occurs at night ( Winkelstein
1935, Levin, Kirsner and Palmer 1950), and has been associated with
the pathophysiology of duodenal ulcer disease (Baron 1973). This
hypersecretion involves the production of abnormally large volumes of
gastric juice that contain normal concentrations of acid ( Wormsley
1974 ). This latter observation helps to explain the finding from the
118

present study that the duodenal bulb exposure to acid at night was not significantly greater than that which occurred during the day. Only at levels of below pH 3 and 2, was this exposure slightly greater. The overall nocturnal pH profile within the bulb was similar to the daytime profile, which like the healthy subjects, followed an exponential curve. Contrary to previous hypotheses, this investigation has shown that the duodenal bulb exposure to acid over the 24 hour period in patients with duodenal ulcer is similar to the exposure experienced by healthy subjects.
Accepting this above finding raises the question of whether the pattern of acid exposure in the bulb is different from that seen in control subjects. The acid peak analysis showed this not to be the case as the overall pattern of acid peaks was similar for DU patients and healthy subjects. However, differences did exist. The DU patients experienced slightly increased exposure during these peaks at night, at the more acidic levels of pH 2 and 3. The similar number of daytime and nocturnal acid peaks suggests that, as in the healthy subjects, the gastric emptying rate in similar during day and night. The rapid and brief fluctuations in acidity appear to be adequately neutralized by duodenal bicarbonate, the secretion of which has been shown to be sufficient in duodenal ulcer patients (Rune and Viskum 1969t However, at night, the ratio of short- to long-lived peaks was different from that experienced during the day. There were relatively fewer short-lived peaks. This finding suggests that there is a defect in the duodenal propulsive motility at night in patients with duodenal ulcer. It would appear that this dysmotility is present during the interdigestive phase of gastro-duodenal motor activity. This is supported by evidence presented in an elaborate paper from Japan ( Sekiguchi et al 1985).
* This has recently been contested (Isenberg et al 1987: New Engl. J. Med. 316: 374-379).
119

The daytime intragastric acidity of the DU patients was very similar
to that of the controls, with some readings as high as pH 5 - 7.
These rises occurred during eating and drinking. The nocturnal profile
was more acidic with minimal readings above pH 3.0. Spontaneous
rises in pH at night were also demonstrated in the patient group, and
presumably relate to duodeno-gastric reflux.
The effect of gastric stimulation ( cephalic stimulation and ingestion of
a meal) only produced a slight acidic increase in the pH proflie in the
duodenum, and this effect was similar to that experienced by the
controls. Likewise, the pattern of acid peaks was similar to the full
daytime pattern and not unlike that of the controls. This confirms
earlier reports (Rune and Viskum 1969, Bengtsen et al 1986 ), whereas
two further studies (Rhodes and Prestwich 1966, McCloy, Greenberg
and Baron 1984) reported significant differences at levels of pH <4
and <2.5. The rises in gastric pH were to levels in agreement ,;,vith
those previously reported (Fimmel et al 1985), and the return to pre
meai baseline pH values was also similar ( Greenberg et al 1982,
Rosenkilde-Gram et al 1986).
The findings of this part of the investigation have shown three
important facts. Firstly, patients with duodenal ulcer exhibit a duodenal
bulb exposure to acid during the full 24 hour period that is similar to
that experienced by healthy subjects. Secondly, the pattern of duodenal
acidification is similar in DU patients and controls. These two facts
suggest that the pathogenesis of duodenal ulcer disease is not primarily
related to acid exposure m the duodenal bulb, and that gastric acid
plays a secondary role m this disease. The third finding is that
120

patients with duodenal ulcer exhibit a defect in the duodenal propulsive
motility during the interdigestive phase of gastro-duodenal motor
activity.
121

CHAPTER .6
THE ROLE OF HORMONAL CONTROL OF GASTRIC ACID
SECRETION IN HEAL TH AND DUODENAL ULCER DISEASE
122

6.1 INTRODUCTION
It has been shown, in the preceding part of this investigation, that the
exposure of the duodenal bulb to gastric acid is dependent upon a
number of factors. These encompass the rate of gastric acid
secretion, the rate of gastric emptying, and the integrity of the local
defence mechanisms within the duodenal bulb. These latter defensive
factors include the bicarbonate secretion, the state of the duodenal
mucosa and the motility of the duodenal bulb. Gastric secretion is
controlled and maintained by several interacting forces which may be
classified (Hirschowitz 1982) as:
~ neurohumoral: The central figure is the vagus nerve with its
secretomotor function. It stimulates gastric secretion and gastric
musculature and sphincters by means of transmitters including
acetylcholine, bombesin, ga~trin and enkephalin, as well as Substance
P and vasoactive intestinal peptide (VIP). It operates via the
intramural plexuses of Auerbach and Meissener.
~ endocrine: The secretory function of reieased hormones 1s
stimulatory ( gastrin, parathormone via Ca++), inhibitory ( secretin,
somatostatin, VIP, insulin, ? glucagon) and trophic (gastrin, ?
epidermal growth factor).
c) paracrine: These effects are difficult to document and have largely
been inferred by the presence of the hormone in gastric juice, or the
close proximity of the hormone-producing cells to the parietal cells.
Implicated in this role has been gastrin, somatostatin and histamine.
d) mucosal: The bicarbonate ions that are formed in the parietal cells
after HI- secretion, are transported into the interstitial fluid, where
they are dependent upon their active removal into the circulation.
Reduction in mucosal blood flow causes a reduction in acid secretion.
i23

~ luminal: Factors influencing gastric secretion include the type of food ingested, gastric distension, osmolality of the contents, and the
gastric intraluminal pH.
f) cellular: The integrity of the parietal cells, and up-regulation of H2
and other receptors.
The heterogeneity of duodenal ulcer disease is well-recognised (Malagelada 1979, Rotter 1981, Wormsley 1983, Lam 1984, Lam 1985), and an abnormality of any one, or a combination, of the above factors may be found in patients with duodenal ulcer. These abnormalities may be aetiologically significant.
The third part of this present investigation sought to examine the role played by gastrin, secretin and somatostatin in the physiology and pathophysiology of duodenal bulb acidity. The study protocol, results and discussion are set out in Chapter 7.
6.2 GASTRIN
Early animal experiments regarding the control of gastric acid scretion were performed at the turn of the 20th century, and in 1905, Edkins demonstrated that intravenous injections of antral mucosal extracts stimulated gastric acid secretion in anaesthetized cats (Edkins 1905). He named the active principle "gastrin". However, as the extracts also contained histamine, there fallowed great controversy as to the presence of gastrin. In 1938, Komarov produced histamine-free extracts that still stimulated acid secretion (Komarov 1938, cited in Ardill 1973), but his methods and results were contested by other workers. "Edkin's hypothesis" was finally proved when, in 1964, Gregory and Tracy, from Liverpool, isolated pure gastrin from hog antral mucosa ( Gregory and Tracy 1964 ). They identified two
124

heptadecapeptides, gastrin I and II ( the difference between them being
the presence of a sulfate on the tyrosine of gastrin II). Both gastrins
were found to be many times more potent than histamine in stimulating
gastric acid secretion. The structures of these peptides were
determined ( Gregory et al 1964), and they were successfully
synthesized (Anderson et al 1964). Two years later, two gastrins (H I
and H II) were isolated from human antral mucosa ( Gregory and
Tracy 1966), their structures determined (Bentley, Kenner and
Sheppard 1966) a.11d they were also synthesized (Beacham et al 1966).
Fractionation studies (Yalow and Berson 1970) showed the presence of
a larger molecular form of gastrin, which had 34 amino acid residues
and was called "big gastrin" ( G34 ). This was found to be the main
form of plasma immunoreactive gastrin in patients with pernicious
anaemia and Zollinger Ellison (ZE) syndrome. Gregory and Tracy's
originally isolated gastrin was referred to e.s G 17, or "little gastrin'',
and its 17 amino acid sequence of made up the 18-34 sequence of the
biologically active C-terminal end of G34. This C-terminal end is a
tetrapeptide amide and its sequence is also found in the structurally
related, but distinct, hormone cholecystokinin ( CCK) (Bryant and
Adrian 1982). The third naturally occuring gastrin, G 13 or "mini
gastrin", has 13 amino acid residues, which correspond to amino acids
22-34 of G34, and 5-17 of G17. (This gastrin has also been referred
to as G 14 (Bryant and Adrian 1982). An approximately six to eight
times greater dose in the molar concentration of G 34 than G 17 was
required to produce the same rate of acid secretion ( ,v alsh and
Grossman 1975a), and, despite its lower concentration m the
circulation, G 17 is probably more important than G 34 for stimulation
of post-prandial gastric acid secretion (Bryant and Adrian 1982). The
gastrin producing cells are the G cells and are distributed from the
125
gastric corpus to the jejunum. However, the highest concentration of
gastrin is in the antrum (predominantly Gl7, up to 10 nmol/g) and to
a lesser extent in the duodenum (predominantly G34) (Malmstrom,
Stadil, Rehfeld 1976). The major physiological action of gastrin is the
release of gastric acid; the mechanism of which is complex and
interrelated with acetylcholine and histamine. The second physiological
action is a trophic effect on the gastric mucosa, and to a lesser extent
that of the upper small intestine and pancreas. Gastrin also affects
most major gastro-intestinal functions, including secretion, absorption
and motility.
Thr release of gastrin is controlled by a combination of a number of
factors including peptides and amino acids , gastric distension, vagal
stimulation ( via bombesin), and to a far smaller extent, blood-borne
calcium and adrenaline (\Valsh and Grossman 1975a, Richardson et al
1977, Hirschowitz 1982). Meals rich in protein produce larger rises in
gastrin than those meals rich in carbohydrate or fat. The vagal effect
is mainly seen during the cephalic phase of gastric secretion and after
gastric distention, and is also elicited by insulin hypoglycaemia
(Hansky et al 1971). In the cat and dog, vagally-released gastrin 1s
required for effective direct vagal stimulation of the parietal cells. In
man, however, this interaction is not as important. During the
interdigestive phases, the gastrin levels return to basal values (Jorde
and Burhol 1985). No diurnal variation has been noted (Moore and
vVolfe 1973, Ellis et al 1975). A negative feedback loop modulates the
release of gastrin; the gastric acid secreted in response to gastrin
release reaches the antrum and inb.ibits further gastrin secretion (Fe
Thein and Schofield 1959). The threshold pH is believed to be pH 2.5
(Nilsson 1979). The presence of acid also inhibits all stimulants of
gastrin release, as well as gastrin itself either by direct interaction
126
with the open end of the G cell or by the release of somatostatin
(Hirschowitz 1982). The vagus, via somatostatin (Reichlin 1986), acts
to inhibit gastrin secretion. In addition, the endogenous peptides,
secretin, glucagon, vasoactive intestinal peptide and gastric inhibitory
peptide, act to inhibit the release of gastrin from the G cells, but
their capability to do so at their normal plasma concentrations has
been doubted (Walsh and Grossman 1975b).
6.3 SECRETIN
Evidence for pancreatic secretion to be stimulated by the presence of
"acid chyme" in the duodenum inspired Bayliss and Starling to
investigate the mechanism of such secretion. They demonstrated that
acidification of denervated small bowel caused the prompt secretion of
alkaline pancreatic juice. Their studies led to the discovery of
secretin (Bayliss and Starling 1902), which they proposed to be a
blood-borne messenger in being absorbed from the duodenal mucosa
into the circulation and carried to the pancreas where it stimulated the
secretion of pancreatic juice, rich in bicarbonate. They called it a
"hormone", a term which is derived from the Greek for "I arouse to
activity". Their paper was the first to propose the chemical co
ordination of bodily functions, and was the beginnings of endocrinology.
The structure of secretin 1s that of a polypeptide chain of 27 ammo
acids, all of which are necessary for biological activity. Great
similarities in structure have been reported between secretin and
glucagon, gastric inhibitory polypeptide and vasoactive intestinal
polypeptide such that these four polypeptides may be considered as one
hormonal family ( Greenberg 1982). Secretin is localized to the S cell
127
which is found in highest concentration in the duodenal mucosa and
somewhat smaller amounts in the jejunum (Bloom and Polak 1980).
The release of secretin is stimulated by acid in th~ duodenum (Ward
and Bloom 1975, Kurokawa et al 1982); the threshold pH of which is
recognised to be pH 4.0 or less (Rhodes and Prest\vich 1966, Dalton et
al 1976, Pelletier et al 1978). The responses to duodenal acidification,
although significant, are small and transient (Pelletier et al 1978,
Greenberg et al 1982) but are clearly detected by the recently
improved radioimmunological techniques which yield greater assay
sensitivity. Inhibition of secretin release is produced directly by
somatostatin (Boden et al 1975, 'Wolfe, Reel and McGuigan 1983), and
indirectly by gastric acid suppression by H2 antagonists. Although the
main effect of secretin is stimulation of pancreatic secretion of
bicarbonate, an effect potentiated by CCK, its gastric effect is to
inhibit the acid-producing effect of gastrin (Wormsley and Grossman
1964, Johnson and Grossman 1971 ). The action is one of non
competitive inhibition, as secretin acts on a different receptor site
compared to gastrin (Johnson and Grossman 1971 ).
6.4 SOlVTATOST ATIN
Somatostatin was first isolated m 1973 by Brazeau et al from the
bovine hypothalamus (Brazeau et al 1973), and has since been
identified in many mammalian tisst1es especially brain, gut (highest
concentration in ant rum) and pancreas. It is predominantly found in
neurones throughout the brain and spinal cord and in the endocrine D
cells of the gut mucosal layer, and at the periphery of the islets of
Langerhans in the pancreas (Lucey 1986). In the foetal and neonatal
pancreas, it is the second most abundant hormone after insulin
128

(O'Shaughnessy 1982). Its fourteen amino acids are held in a ring
cystine bridge - Somatostatin-14. A larger precursor form has been
identified: Somatostatin-28 with twenty eight amino acids (Lucey
1986). Apart from its neurotransmitting and neurohumeral regulatory
actions, it has powerful inhibitory actions on the gut, pancreas and
gastro-intestinal hormones.
Somatostatin 1s released into the peripheral circulation fallowing the
ingestion of food, especially fat and protein (Lucey et al 1984 ). The
importance of the vagus in mediating circulating somatostatin release
is evidenced by the releasing effects of insulin hypoglycaemia and
atropine. Post-prandially, the levels return to basal values (Jorde and
Burhol 1985). The vagus in man has an important control in the
circulating somatostatin release. Gastric acid does not appear to be a
major stimulant (Lucey 1986). This latter finding contrasts the
response in dogs. Animal studies have demonstrated direct secretion of
the hormone into the gut lumen, and this, together with the close
proximity of the D and G cells, suggests a paracrine effect.
The release of all gut peptides are inhibited by somatostatin, and it
appears to regulate gastric acid secretion by both paracrine and
endocrine effects (Lucey 1986). It has been suggested that somatostatin
is an "enterogastrone" a circulating hormone released by
intraduodenal fat which inhibits acid secretion. In addition, somatostatin
and gastrin are thought to be linked within the stomach as part of a
local negative feedback loop interacting via the vagus (Reichlin 1986).
129

6.5 RADIOIMMUNOASSAY TECHJ.'HQUES
The principle of radioimmunoassay is one of competition between the
radio-labelled and unlabelled hormone for specific binding sites of an
antibody. The higher the concentration of the unlabelled hormone, the
smaller the amount of radio-labelled hormone is bound to the antibody.
As the amounts of radio-labelled hormone and antibody are fixed and
known, the concentration of the unlabelled hormone sample may be
calculated indirectly by separating the bound from free hormone and
counting the radioactivity of the bound portion. Standard curves are
prepared by using known concentrations of pure hormone, and these
are compared with the unknown hormone sample. Ideally, the standards
should be prepared from hormones of the same species as the sample,
as significant differences occur between species. In some cases,
porcine hormones are used due to the lack of isolated human hormones
( eg. secretin). The sensitivity of the assay increases with the
increasing steepness of the standard curve and high reproducibility,
thus detecting small differences in concentrations of samples. A longer
incubation period, up to a maximum of six days, increases the assay
sensitivity and this is used when measuring hormones of low plasma
concentrations. The levels detected by radioimmunoassay are far
smaller than those detected by most bioassays. The optimum
temperature for performing the assay is 4 Oc. as at this temperature,
bacterial contamination and proteolytic degradation is minimized. Three
main methods of separation of bound from free hormone exist:
immunoprecipitation, chemical precipitation and absorption. Charcoal is
used commonly in the la.ttcr method as it is simple, rapid and cheap.
The addition of dextran to the charcoal prevents absorption of the
antibody complex.
130
In the following chapter, the interrelationship of these three hormones
to intraluminal pH and their responses to feeding are investigated.
1 3 i

CHAPTER 7
EFFECT OF MODIFIED SHAM FEEDING AND INGESTION OF A
SOLID MEAL ON PLASMA GASTRIN, SECRETIN AND
SOMATOST ATIN AND CONCURRENT CHANGES IN DUODENAL
BULB pH IN HEALTHY SUBJECTS AND PATIENTS WITH
DUODENAL ULCER
1 32

7.1 HYPOTHESIS II
Antral pH regulates gastric acid secretion by activation of neural and
hormonal mechanisms. Vagal stimulation causes the secretion of
gastric acid by a direct effect on the parietal cells and an indirect
effect by stimulating the production of gastrin. The resultant acid pH
in the gastric antrum inhibits both further gastric acid secretion and
gastrin release ( Woodward et al 1954, ·w alsh, Richardson and F ordtran
1975, Fiddian-Green and Vinik 1976, Befrits, Samuelsson and
Johansson 1984 ). In addition, both gastrin and gastric acid secretion
are inhibited by somatostatin (Johnson and Grossman 1971), the
release of which is stimulated by the vagus (Lucey et al 1985). The
inhibition via somatostatin is diminished in patients with duodenal ulcer
(Harty, Maico and McGuigan 1986). It has been postulated that the
defect in somatostatin inhibition 1s responsible for the acid
hypersecretion and post-prandial hypergastrinaemia seen in duodena.l
ulcer patients (Stadil et al 1975, Calabro et al 1986).
It is well established in dogs that acidification of the duodenum causes
inhibition of gastric acid secretion (Uvnas 1971, Lanas et al 1985).
This negative feedback also occurs in man (Shay et el 1942, Johnston
and Duthie 1964, Wormsley and Grossman 1964, Bochenek, Rodgers
and Balint 1971) but the response is variable (Wormsley 1974, Sainz
et al 1985). It has been suggested that this inhibition by duodenal
acidification 1s defective in duodenal ulcer patients (Johnston and
Duthie 1964, Malagelada et al 1977). The process of inhibition is
thought to be humeral via the release of secretin which then inhibits
the gastric acid secretion and further gastrin release (Bloom and
Ward 1975, Sainz et al 1985). It has been postulated that the release
133

of endogenous secretin is dimnished in patients with duodenal ulcer
(Fiddian-Green and Hobsley 1974, Bloom and Ward 1975, Kurokawa et
al 1982, Sainz et al 1985).
7 .2 STUDY AIM
In order to examine the above hypotheses, this study ( Study III) was
set out to assess the effect of the cephalic and gastric phases of
gastric secretion on plasma gastrin, secretin and somatostatin and
duodenal bulb pH m patients with active duodenal ulcer and healthy
subjects. The interrelationship of the three hormones to one another
was also investigated.
7.3 STUDY GROUPS
Group !: Normal healthy subjects (n=20). This group consisted of
most of the subjects from Study I of this investigation ( Chapter 4)
plus two additional subjects. The same criteria for inclusion and
exclusion applied. There were 13 males and 7 females, and the mean
age was 25.2 years (range 19-67). The oldest subject, FA, from Study
I was not included in this third study.
Group 2: Duodenal ulcer patients (n=22). These patients formed a sub
group of those studied in Study II (Chapter 5). The criteria for
inclusion and exclusion were the same. The discrepancy in numbers
between Studies II and III is due to the fact that Study III was
commenced later. Patient A.R., who had previously undergone a highly
selective vagotomy for duodenal ulcer disease and presented with a
recurrent ulcer, was also investigated in this study. His results, for
comparative purposes, are reported separately.
The mean age of the patient group was 43.5 years ( range 23 - 72 ).
134

7.4 STUDY DESIGN (Figure 7.1)
This study lasted six and a half hours. The design was similar to that
described in Study L The dual pH monitoring system was used in
similar fashion, and the study period incorporated a fasting period,
cephalic stimulation by modified sham feeding and the ingestion of a
solid meal. The same two meals (Iilustrations 4.1 and 4.2) for the
modified sham feeding and the ingested solid meal \Vere served. The
duration of the modified sham feed was thirty minutes.
Figure 7.1: Study design - Study III: The arrows indicate the time of
venous blood sampling ( see text)
start MSF MEAL end
1111 I I l 111 i -1 0 1 2 3 4 5 6
Time (hours)
At the start of the study, an 18G VenflonR catheter was inserted into
a vein in the ante-cubital fossa for repeated blood sampling. The
catheter did not required to be heparinised nor flushed with saline
before sampling. Serial blood samples were taken at times as
indicated in Figure 7.1; at 60, 30 and O minutes before, every 10 minutes during, and at 15, 30, 45 and 60 minutes after first cephalic
stimulation by modified snam feeding, and the ingestion of the
standardised solid meal.
1 35
The blood samples were collected in heparinised tubes on ice,
centrifuged as soon as possible at 2500 rpm and 4°C for 15 minutes
and the plasma was then pipetted into a test tube containing 1000 U of
TrasylolR. The sample was stored at -20°C until assayed.
The radioimmunoassays for gastrin, secretin and somatostatin were
performed in the Department of Medicine (Professor K.D. Buchanan),
Queen's Hospital of Belfast, Belfast, Northern Ireland. The plasma
samples were packed frozen into a polystyrene box, filled with dry
ice, and transported by courier post to Belfast. The transit time was
short, being approximately sixteen to eighteen hours, and prevented
thawing of the samples before assaying was ready.
7.4.1 Plasma Gastrin Radioimmunoassay
An antibody was raised in rabbits against synthetic human gastrin I
(ICI), and this was used in the assay, 0098, at an approximate final
dilution of 1:10 000. This antibody did not cross-react with other
gastro-intestinal peptides except cholecystokinin-pancreozymin ( CCK),
but greater than 10 000 times concentration of CCK was required to
produce a similar fall in bound counts as did standard gastrin. The
antibody also recognized Big gastrin ( G34 ). The standards used for
the assay were gastrin human-type synthetic 68/439. Hormone-free
human plasma, separated by charcoal, was added to the standards so
as to equilibrate the conditions between plasma samples and standards.
The radioimmunoassay (Ardill 1973) was then performed.
7.4.2 Plasma Secretin Radioimmunoassay
Plasma for the secretin assay was extracted using ethanol. Pork
synthetic secretin (SG 18773), used for the standards, was labelled
with 1251 and antibodies were raised against bovine natural secretin.
136

The antibody, BBlOl, was used at a final titre of 1 :36 000 and was
specific for secretin, as no cross-reactivity was observed with other
peptides (pancreatic glucagon, insulin, gastric inhibitory polypeptide,
motilin, vasoactive intestinal polypeptide, human synthetic gastrin and
99% pure cholecystokinin-pancreozymin). The sensitivity of the assay
was established at 6 ng/1 with a highly purified 1251 secretin.
7.4.3 Plasma Somatostatin Radioimmunoassay
The frozen plasma samples were reconstituted prior to the assay in
0.04 M phosphate buffer of pH 7.4. Synthetic cyclic somatostatin was
used as the standard, to which the antibody, OB 5(1), was raised.
This antibody was then used in a final dilution of 1:15 000 for the
assay. There was no cross-reactivity with any other gut peptides. N
tyrosylated somatostatin was first iodinated then purified on a cation
exchanger, \Vhatman CM52, using 0.05 M and 0.25 M acetate buffers.
In order to equilibrate conditions between the standards a.nd plasma
samples, horse serum was first charcoaled to remove endogenous
peptides, extracted by alcohol, then added to the calibration samples.
The separation of the antibody-bound peptide from free peptide was
achieved using dextran-coated charcoal. The sensitivity of the assay
was 3 ng/1 (95% confidence).
7.5 ETHICAL APPROVAL
The protocol of Study III was approved by the Ethics Committee of
the University of Dundee, and the Tayside Health Board.
137

7.6 RESULTS
7.6.1 Plasma Gastrin
The control group of healthy subjects exhibited a median fasting
plasma gastrin level of 20.0 ng/1, ( range 5.0 - 110.0 ng/1). This level
was fairly constant, as demonstrated by the median levels taken during
the fasting period (at -60, -30, and O minutes): 22.5, 20.0 and 25.0
ng/1. The values of medians and ranges were used due to the
skewness of the data. As four extreme values existed, the sample
mean of the fasting gastrin data was calculated at 29.3 ng/1 with 1
standard deviation of 22.03. This data was skewed to the right, and
the test of skewness gave a value of +2.06; ( data of the ideal normal
distribution has a skewness value of 0.00, while a skew to the right
(positive) has an upper tail gre2ter than the lower tail, and a skew to
the left a lower tail greater than the upper tail). The distribution of
the fasting gastrin data is illustrated in Figure 7.2.
In order to normalize the distribution, this data was transformed by
natural logarithms. The geometric mean of the fasting plasma gastrin
level of the control group was 23.8 ng/1, and the skevmess value 0.09.
(The sample median using this transformation was 19.99 ng/1.) Thus,
the fasting plasma gastrin data of the healthy subjects showed a log
normal distribution.
The fa sting plasma gastrin level of the patients with duodenal ulcer
had a median value of 55.0 ng/1 and a range of individual values from
~a o + 1 o- o '1 "'' • • ~ . ,.o ~ ~- ng1 . 1 ne 1evet was also f airiy constant; the three
median fasting values being 65.0, 55.0 and 50.0 ng/1. This fasting level
was significantly higher than that of the healthy subjects (p <0.01,
Mann- \Vhitney U Test).
138

Fas
ting
pl
asm
a ga
stri
n (n
g/1)
FA
ST
ING
PLA
SM
A G
AS
TR
IN L
EV
EL
S I
N D
U P
AT
IEN
TS
AN
D C
ON
TR
OLS
120
I m
edia
n •
• •
100-
1 ....
.... •
• ..
• •
80
•
.....
ON
M
• •
.....
. ... •
.....
0 ....
60
.......
. .....
.... 0
0
.. •
... ...
• 0
40
9
8
oe
e.
00
00
0
• 0
....
. u ...
M
•lli
MH
II
-00
00
00
00
00
-.....
...
00
0
20
-;
_....
....._
~
DN
O
OC
X)O
()()
~ .... ••
0 C
ontr
ols
DU
N
orm
o-
Hyp
er-
L P
atie
nts
gast
rina
emic
ga
s tri
naem
ic
DU
Pat
ient
s D
U P
atie
rits
p
< 0.
001
Fig
ure
7.2
\.>I
\l)

Whilst the control subjects displayed data skewed to the right, the DU
patients exhibited a mere normal distribution of fasting gastrin data
with a skewness value of +0.30. However, the pattern showed a
definite bimodal distribution ( discussed below), as can be seen m
Figure 7 .2. The data was also transf armed by natural logarithms so
as to further normalize the distribution and this yielded a geometric
mean of the patient data of 54.99 ng/1. The skewness of the
transformed data was similar at -0.35.
At all times during the 6.5 hour study, Hie DU patient group exhibited
significantly higher plasma gastrin levels compared to the controls
(Figure 7.3). Cephalic stimulation by modified sham feeding (MSF)
produced a negligible increase in plasma gastrin of the healthy
subjects, to a median level of 25.0 ng/1 (range 5.0 - 120.0) after 10
minutes. This stabilized at 22.5 ng/1 (range 5.0 - 140.0) after 30
minutes and represented an increase over fa sting levels of 12.5%. The
response of the DU patients to cephalic stimulation was greater, and it
caused Lh.e plasma ~strin level to rise to a median peak value of 70.0
ng/1, ( range 20.0 - 200.0), after 30 minutes. This was an increase of
27.3% over fasting levels but failed to reach statistical significance.
This peak level was, however, significantly higher than the peak of
the healthy subjects (p <0.001, Mann-Whitney U test).
During the two hours foliowing completion of the modified sham feed,
the median plasma gastrin level of the controls did not show any
appreciable fluctuation. The gastrin levels of the DU patients remained
somewhat elevated and decreased to a median value of 40.0 ng/1 prior
to the start of the second feed. This final level was still significantly
greater than that of the controls (p <0.01).

EF
FE
CT
OF
MO
DIF
IED
SH
AM
FE
ED
ING
(M
SF
) A
ND
A M
EA
L O
N P
LA
SM
A G
AS
TR
IN
IN D
UO
DE
NA
L U
LCE
R P
AT
IEN
TS
AN
D H
EA
L T
HY
SU
BJE
CT
S
C: ro
240
20
0
·c
Q)
160
E
C: =
·;:
c'>
12
0-
...
C:
:S
c,
ru E
VI ro
D.
80
-
40·-
0
Fas
ting
M
SF
I 1c
::::J
M
eal
I J **
* * --
----
-, __
____
____
__ _
-1
0 1
2 3
Tim
e (h
ours
)
Fig
ure
7.3
--
DU
Pat
ient
s (n
= 2
2)
--
-C
ontr
ols
(n =
20)
4
* p
<0
.00
1
** p
< 0
.01
.'-....
----
--
5 6
.fo>
The ingestion of a solid meal caused an increase in plasma gastrin
amongst the healthy subjects to a median peak value after 20 minutes
of 70.0 ng/1 (range 20.0 - 300.0). This represented a significant
increase over pre-meal values of 180.0% (p <0.001, Wilcoxon Matched
Pairs Signed-Ranks test). The patients with duodenal ulcer responded
in a significantly greater fashion. The plasma gastrin level increased
sharply to a median peak value after 30 minutes of 167 .5 ng/1 ( range
20.0 - 325.0). This was a significant 318.8% increase over pre-meal
levels (p <0.001 ). In both study groups, the meal peak was
significantly higher than the peak following cephalic stimulation (p
<0.001, Wilcoxon Matched-Pairs Signed-Ranks test).
The plasma gastrin levels of the controls decreased initially during the
post-prandial period but remained slightly elevated until the end of the
study. The DU patients demonstrated a more prolonged elevation in
plasma gastrin, and at three hours after the meal, the levels were
still raised compared to pre-meal values.
Closer inspection of the patient data revealed two separate populations
of duodenal ulcer ?atients. As noted above, the fasting gastrin data
showed a bimodal distribution (Figure 7.2) with those patients in the
high group showing minimal overlap with those in the low group. On
the basis of this data, the DU patient group was divided into two sub
groups. The high group (n=ll), due to their exaggerated gastrin levels,
were termed the "Hypergastrinaemic" (HRG) patients. The low group
(n=ll) displayed gastrin levels similar to the healthy subjects and
were termed the "Normogastrinaemic 11 (NOG) patients. As shown in
Figure 7.2, the median fasting plasma gastrin level of the HRG DU
142

patients was 70.0 ng/1 ( range 50.0 - 105.0) compared to a median
fasting level of 30.0 ng/1 ( range 20.0 - 65.0) in the NOG DU patients.
Table 7.1 shows the fasting gastrin levels in the Hypergastrinaemic
and Normogastrinaemic DU patients and healthy subjects, as well as
the respective responses to cephalic stimulation and ingestion of the
solid meal.
Table 7.1: Plasma gastrin responses to cephalic stimulation (MSF) and
a meal in "Hypergastrinaemic" (HRG) and "Normogastrinaemic"
(NOG) DU patients and healthy subjects (VOL).
PLASMA GASTRIN (ng/1) [median(range)]
Fasting MSF Peak Meal Peak p value *
F/MSF MSF/M
HRG 70.0 90.0 225.0 <0.02 <0.001
(n=ll) (50-105) (70-200) (150-325)
NOG 30.0 35.0 92.5 NS <0.001
(n=ll) (20-65) (20-60) (20-175)
VOL 20.0 22.5 70.0 NS <0.001
(n=20) (5-110) (5-140) (20-300)
*Wilcoxon Matched-Pairs Signed-Ranks Test for Fasting vs MSF,
MSF vs Meal.
Only the Hypergastrinaemic patients demonstrated a significant rise in
plasma gastrin over fasting levels following cephalic stimufotion.
Thirty minutes after ingestion of the meal, the HRG patients
experienced an exaggerated gastrin response to a median peak value of
225.0 ng/1 (:range 150.0 - 325.0). This was an increase of 309.1% over
j 4- 3

the pre-meal value. Thereafter, the gastrin level dropped sharply then
plateaued to remain elevated until the end of the study. The
Normogastrinaemic patients exhibited a median peak gastrin level, 45
minutes after the meal, of 92.5 ng/1 ( range 20.0 - 175.0). This was a
208.3% increase over pre-meal values. This group of patients also
showed sustained elevated levels of gastrin in the post-prandial period.
The differences in responses are more readily appreciated when
illustrated graphically and are shown in Figure 7.4. The full plasma
gastrin data for the DU patients as a group, the HRG and NOG sub
sets and healthy subjects are shown in the Appendix in Tables A.5 and
A.6.
Patient A.R. (previous HSV, and recurrent ulcer) showed a mean
fasting plasma gastrin level of 120 ng/1. This levei rose to a peak of
150 ng/1 twenty minutes after the sham feed, and returned to basal
levels in one hour. The response to the ingested meal was greater
than any of the other patients studied, and reached the peak level of
385 ng/1 twenty minutes after the meal. At the end of the study, the
plasma gastrin level remained elevated at 250 ng/1.
7 .6.2 Plasma Secretin
The median fasting plasma secretin level in the healthy subjects was
25.0 ng/1 and this ranged from 5.0 to 55.0 ng/1. This level remained
constant throughout the fasting period. The data distribution was more
normal (skewness value 0.47); (the mean value was 24.89 ng/1, SD
11.16). Transformation of the data by natural logarithms did not
provide any advantage to the distribution. The patients with duodenal
ulcer, as a group, exhibited the median fasting plasma secretin level
of 25.0 ng/1, and the range was wider than the controls at 0.0 - 75.0
i 4-4
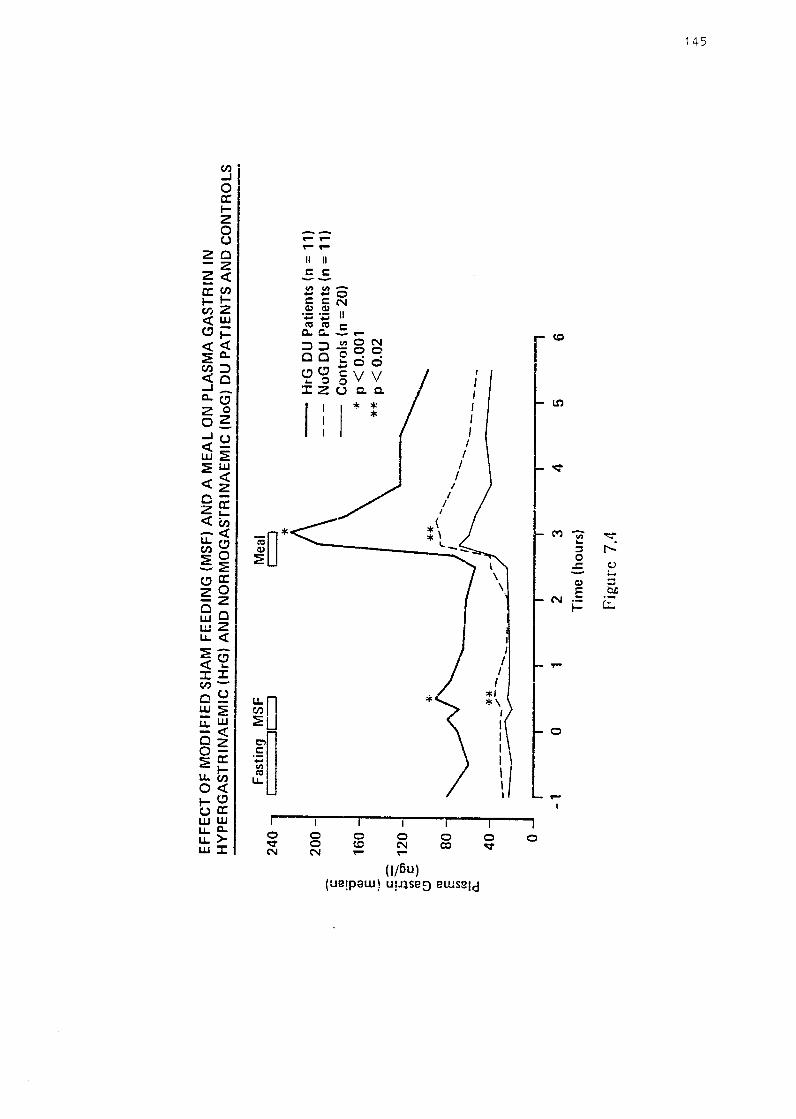
EF
FE
CT
OF
MO
DIF
IED
SH
AM
FE
ED
ING
(M
SF
) A
ND
A M
EA
L O
N P
LA
SM
A G
AS
TR
IN I
N
HY
PE
RG
AS
TR
INA
EM
IC (
HrG
) A
ND
NO
RM
OG
AS
TR
INA
EM
IC (
NoG
) D
U P
AT
IEN
TS
AN
D C
ON
TR
OL
S
Fast
in!J
M
SF
2
40
-,
r ::
::JC
=:J
20
0 -
C:
C1l ~
160
-E
C
: :::
::-
"E cn
120
-.,
, i:
: 1
1l-
C!) C1
l E
80
.,, co
a.
40
0
-1(-
-K·* ,,,,,.--
...._ ...
.... -----~
-1
0 1
2
Mea
l c:
:::::J
* **
__....
-. .....
.....
3 T
ime
(ho
urs)
Fig
ure
7.4
.... ,
---- 4
-H
rG D
U P
atie
nts
(n =
11)
-
--
NoG
DU
Pat
ient
s (n
= 1
1)
--
Co
ntr
ols
(n
= 2
0)
·If
p <
0.00
1 **
p <
0.0
2
..........
. ___ _
5
-, 6
_,
-f~
,Jl
ng/1. The distribution was skewed slightly to the left ( value -0.91),
and, as with the controls, transformation by natural logarithms was
not beneficial. Comparison of the fasting levels of both study groups
showed no statistical difference.
Figure 7 .5 shows the responses of plasma secretin to cephalic
stimulation and ingestion of a meal in the DU patients and controls.
Cephalic stimulation produced a small decrease in plasma secretin
after 30 minutes, among the healthy subjects and this returned to the
fa sting level fifteen minutes later. The DU patients experienced an
initial slight fall in plasma secretin which, after returning to the
fasting level, was followed by a rise of the same magnitude fifteen
minutes after stimulation. During this period of stimulation, there was
no statistical difference between the groups. The ingestion of a meal
caused a decrease in plasma secretin after ten minutes in the controls,
and this dropped to a minumum level of 17.5 ng/1 (range 5.0 - 35.0)
75 minutes after the start of the meal. The decreased level was
prolonged to the end of the study. The patients with duodenal ulcer
showed a smaller decrease in plasma secretin twenty minutes after
eating which was less prolonged than in the controls. There were no
significant differences in the plasma secretin levels between the two
groups. The data is presented in Table A.7.
Using the fasting gastrin data to divide the DU patients into the two
previously defined groups, the secretin data was re-examined. The
distributions of the fasting secretin values were not improved by log-
t ,.ansf'or""a+;,......., p;,...,,~,,. .&. .a. .1. ~.&..,;. \..1.v.u .• .1. i5u1;., 7 /:.. MkMu-3 +t..~ ~ 1~M-1a ---~re•1"r1 res_nonses to the I .'J uHV vv lHC !--)1a;::,u ;::,c:;1_; l _
cephalic stimulation and ingestion of the meal m the
"Hypergastrinaemic" and "Normogastrinaemic" patients and the cohort
of healthy subjects. The HRG ulcer patients exhibited slightly higher
146

:::
ca =u O
J E - c:-
EF
FE
CT
OF
MO
DIF
IED
SH
AM
FE
ED
ING
(M
SF
) A
ND
A M
EA
L O
N P
LA
SM
A S
EC
RE
TIN
IN
DU
OD
EN
AL
UL
CE
R P
AT
IEN
TS
AN
D H
EA
LT
HY
SU
BJE
CT
S
60
50
-
40
Fas
ting
MS
F
.__ _
_ ...
..,c:
::::J
Mea
l c:
:::J
-D
U P
atie
nts
(n =
22
) -
--
Co
ntr
ols
(n
= 20
)
·;:;::::
. ~ g
> 30
u
-.,..
., ,,
/'
\ (]
.)
U) ro E
20
"' --
----
---~
co
a: 10
0 ]
] J
J -1
0
1 2
3 4
5 6
Tim
e (
hour
s)
Fig
ure
7.5
~
.p
--l

C .~ "C
Q) E - c--
EF
FE
CT
OF
MO
DIF
IED
SH
AM
FE
ED
ING
(M
SF
) A
ND
A M
EA
L O
N P
LA
SM
A S
EC
RE
TIN
IN
H
YP
ER
GA
ST
AIN
AE
MIC
(H
rG)
AN
D N
OR
MO
GA
ST
RIN
AE
MIC
(N
oG
) D
U P
AT
IEN
TS
AN
D C
ON
TR
OL
S
Fas
ting
MS
F
Mea
l 60
I
::JC
:-_:
] c::
:J
50
-H
rG D
U P
atie
nts
(n =
11)
-
---
NoG
DU
Pat
ient
s (n
= 1
1)
--
Co
ntr
ols
(n
= 2
0)
40
·~~
., 3
0 ,_
C
: U
--
Q,)
C/)
:'J
20
E
"' ro a.
10
0 I
I
-1
0 1
2 3
4 5
6 T
ime
( h
ours
)
Fig
ure
7.6
-· .p,.
(l)

median fasting levels compared to the NOG group: 25.0 ng/1 (range
10.0 - 75.0) versus 22.5 ng/1 (range 0.0 - 50.0); these levels were not
significantly different. Following cephalic stimulation, the
Hypergastrinaemic patients demonstrated a small rise in plasma
secretin which was followed by a larger rise at fifteen minutes after
completion of the sham feed. The return to fasting levels occurred
after 75 minutes. The Normogastrinaemic patients experienced an
initial decrease in plasma secretin and a subsequent rise co-inciding
with that of the HRG patients.
The ingestion of the meal produced an initial increase in the plasma
secretin levels of the HRG patients, while those of the NOG group
decreased. Thereafter, there was no difference between the responses
of the two groups. At no time during the study, were the differences
in plasma secretin responses between the three groups (HRG, NOG,
Controls) statistically significant. The full data of the plasma secretin
responses are shown in the Appendix in Table A.8.
Patient A.R. showed a mean fasting secretin level of 11.7 ng/1, and a
small peak at twenty minutes after MSF of 20.0 ng/1. He showed no
response to ingestion of the meal as the secretin level remained at
10.0 ng/1.
7 .6.3 Plasma Somatostatin
The median fasting plasma somatostatin level of the healthy subjects
was 10.0 ng/1, and this ranged widely from 1.0 to 105.0 ng/1. The
median values obtained during the fasting period showed minimal
variation (10.0, 10.0 and 9.0 ng/1). As with the gastrin data, the
distribution was skewed to the right and showed a skewness value of
+2.25. Transformation of this data by natural logarithms improved the
149

distribution to near-normal (skewness value of +0.18). The geometric
mean was calculated to be 10.28 ng/1 (SD 2.75, SEM 1.15). As a
group, the patients with duodenal ulcer demonstrated a higher median
fasting plasma somatostatin level at 15.0 ng/1, and the range of values
was similar to the controls being from 1.0 to 90.0 ng/1. The
difference between the fasting levels of the two groups was
significant (p <0.01, Mann-Whitney U-test). Like the controls, there
was minimal variation in the three fasting values. The distribution of
the patient data was not normal ( skewness value +1.15). Logarithmic
transformation improved tl1e distribution to more normal ( value -0.37),
and the geometric mean of this data was 16.45 ng/1 (SD 2.44, SEM
1.12).
Figure 7.7 shows the plasma somatostatin responses to the cephalic
stimulation and ingestion of the meal in the DU patients as a group and
the healthy subjects. There was no appreciable change in the plasma
somatostatin level of the healthy subjects after cephalic stimulation,
although some fluctuation was observed. The DU patients exhibited a
definite response at ten minutes after stimulation and a median peak
value of 20.0 ng/1 ( range 2.0 - i25.0) was measured. The difference
between the two study groups remained significant at p <0.05 level. A
similar response was observed after the mea.l. The controls
experienced a short-lived drop in plasma somatostatin at twenty
minutes after the start of the meal, whilst the DU patients showed a
second 33.3% increase to 15.5 ng/1. The post-prandial somatostatin
plasma levels were similar for the two groups. Table A.9 shows
these resuits in tabular form.
The two sub-sets of duodenal ulcer patients showed markedly
different plasma somatostatin responses. The Hypergastrinaemic ·
150

EF
FE
CT
OF
MO
DIF
IED
SH
AM
FE
ED
ING
(M
SF
) A
NO
A M
EA
L O
N P
LA
SM
A S
OM
AT
OS
TA
TIN
IN
DU
OD
EN
AL
UL
CE
R P
AT
IEN
TS
(n
= 2
2) A
ND
HE
AL
TH
Y S
UB
JEC
TS
(n
= 2
0)
C:
(ti
"C
0, E
C:
·;; co
+
J -
60
50
40
-
V)
---
s g>
30
-2-
' 0 tr)
20
-CI
J E
V)
CIJ n:
10
Fas
ting
MS
F
1 lc
::::
J
*
0·-
' r-
-1
0 1
2
Mea
l t=
::']
3 T
ime
(hou
rs)
Fig
ure
7.7
-D
U P
atie
nts
(n =
22)
---
Co
ntr
ols
(n=
20
)
* p
< 0
.05
4 T
5
.., 6
Vl

EF
FE
CT
OF
MO
DIF
IED
SH
AM
FE
ED
ING
(M
SF
) A
ND
A M
EA
L O
N P
LA
SM
A S
OM
AT
OS
TA
TIN
IN
HY
PE
RG
AS
TR
INA
EM
IC (
HrG
) A
ND
NO
RM
OG
AS
TR
INA
EM
IC (
NoG
) D
U P
AT
IEN
TS
AN
D C
ON
TR
OL
S
C: ro
-0
Q) E
C:
60
50
40
-~=
ta,
30
0
C:
+-'
-«:
I E
0 20
C
l.)
c,:, E
II) ro
0..
10
0
Fas
ting
MS
F
c=::=
==ic
,
Mea
l t=
:J
* ' ,, I '
I \
I \
,,..
" I
\ /
' /\
I l
"'
' \
' /
' I
,....,
I
"' '
-H
rG
DU
Pat
ient
s (n
= 1
1)
--
-N
oG D
U P
atie
nts
(n =
11)
--
Con
trol
s (n
= 2
0)
* p
< 0.
05
~\
.. ,,,,
' ,,,-:-'
I '
,,
' ....
_ ,/
__
::_
\
I '-
....
-"'
..,
',
.,>
', ..
-C
'.'.
.=..
....
...~
~
... -'-
7
------=
=-----=
-===
*
-1
0 1
2 3
4 5
Tim
e (
hour
s)
Pig
ure
7.8
-, 6
V1
N

patients (Figure 7.8) showed a lower median fasting plasma
somatostatin level than that of the Normogastrinaemic patients; the
difference being significant (p <0.05, Mann-Whitney U test). Compared
to the control group, the fasting ievel of the NOG patients was
significantly higher (p <0.01). The response to cephalic stimuiation
was similar for both HRG and NOG patient groups but the latter
group experienced a stronger response. The median peak value after
ten minutes of cephalic stimulation of the NOG patients was 28.0 ng/1
(range 5.0 - 65.0) and this was significantly higher (p <0.05) than that
of the HRG patients (median 20.0 ng/1, range 2.0 - 125.0), as well as
the controls (p <0.01 ). Following stimulation, the NOG patients
exhibited plasma somatostatin levels similar to the fasting levels,
whereas the HRG patients experienced a decrease in the levels.
Following the ingestion of the meal, the Normogastrinaemic patients
demonstrated an immediate increase in plasma somatostatin to a
median peak vaiue of 40.0 ng/1 ( range 5.0 - 60.0) at twenty minutes.
The post-prandial period was characterized by a persistently elevated
plasma somatostatin level, punctuated by a second rise 45 minutes
after completion of the meal. The Hypergastrinaemic patients showed
a quite different response which was very similar to that of the
healthy subjects. The tabular format of this data is presented in Table
A.10.
Patient A.R. showed minimal plasma somatostatin responses to
stimulation. The fasting level was 8.7 ng/1, and cephalic stimulation
produced a decrease in the level to a lmv of 3.0 ngil. Likewise, the
meai caused a fall in plasma somatostatin levels to 1.0 ng/1 which
later returned to basal levels.
153
7.6.4 Correlation between these hormones
Both secretin and somatostatin produce an inhibition of gastrin release.
In dogs, a positive correlation between secretin and gastrin leveis has
been demonstrated, but in man, similar evidence is lacking. Gustavsson
and co-workers found no correlation between gastrin and somatostatin
levels in ulcer patients, but only fa sting levels were investigated
( Gustavsson et al 1982). In order to test the hypotheses, the
correlation between post-stimulation plasma gastrin and plasma
secretin levels, and plasma gastrin and plasma somatostatin levels
were calculated from the results of this investigation.
i) Gastrin : Secretin
Following feeding stimulation (modified sham feeding and ingestion of
the meal), the healthy subjects exhibited a significantly negative
correlation between plasma gastrin and plasma secretin levels,
( Spearman' s rank correlation coefficient rs == -0.218, t value = -3.555
with 254 degrees of freedom [d.o.f .], p <0.001 ). Thus, an inverse
relationship between plasma gastrin and secretin appeared to exist
amongst the controls. The distribution of data, however, is variable,
with the gastrin data being negatively skewed and the secretin data
being near--normally distributed. For greater accuracy, the log
transformed plasma gastrin data and the original plasma secretin data
were used for the analysis by simple linear regression. The
correlation between the log-gastrin and secretin appears to be a linear
one, with the slope of the line being -3.69 (p <0.001).
showed no significant correlation
between the plasma gastrin and plasma secretin levels, ( Spearman' s
rank correlation coefficient rs = -0.049, t value = -0.594 with 147
d.o.f., p = NS). Although statistical significance was not reached, the
154

relationship between these two hormones was inversely inclined. The
Normogastrinaemic patients, on the other hand, displayed a highly
significant negative correlation between plasma gastrin and plasma
secretin levels ( Spearman's rank correlation coefficient rs = -0.332, t
value = -4.116 with 137 d.o.f ., p <0.001 ). After transforming this
latter gastrin data by naturai logarithms, a simple linear regress10n
appears to exist with the slope of the line -0.41 (p <0.001 ).
ii) Gastrin : Somatostatin
The healthy subjects demonstrated no significant correlation between
these two hormones ( Spearman' s rank correlation coefficient rs =
0.033, t value 0.537 with 262 d.o.f., p = NS). The correlation did,
however, appear to be positive rather than negative.
A similar relationship existed amongst the Hypergastrinaemic DU
patients. The correlation between plasma gastrin and somatostatin was
positive, but did not reach statistical significance ( Spearman's rank
correlation coefficient r 5 = 0.152, t value = 1.808 with 138 d.o.f., p =
NS). A negative correlation between plasma gastrin and somatostatin
was evident in the Normogastrinaemic patients but this did not quite
reach significant levels (Spearman's rank correlation coefficient rs =
-0.129, t value = -1.511 with 134 d.o.f., p = 0.068).
7 .6.5 Duodenal bulb acidity
The acid exposure within the duodenal bulb was analysed m three
ways:
a) the cumulative pH percentage at the acidic pH levels;
b) analysis of the acid peaks to below pH 4.0;
c) the pattern of the onset, duration and cessation of duodenal
acidification. The results of the three groups of healthy subjects,
155

Hypergastrinaemic DU patients and Normogastrinaemic DU patients
were compared.
The frequency distribution of the data points from the duodenal
electrode was calculated with the cumulative pH percentage analysis,
and results to pH levels 4.0, 3.0 and 2.0 were considered. Table 7.2
shows the results of this analysis. The Hypergastrinaemic patients
experienced a greater exposure to acid compared to the
Normogastrinaemic patients, but the differences did not quite reach
statistical significance probably due to the relatively small numbers.
Compared to the healthy subjects, the Hypergastrinaemic patients
demonstrated an increased acid exposure at the higher acid levels of
below pH 3 and 2. This increased exposure also failed to reach
statistical significance.
Table 7.2: Frequency distribution of duodenal pH data after cephalic
stimulation and a meal in healthy subjects (VOL), Hypergastrinaemic
(HRG) and Normogastrinaemic (NOG) duodenal ulcer patients.
CUMULATIVE PERCENTAGE OF DUODENAL pH DATA*
pH Level VOL HRG NOG
<4
<3
<2
*Median (range)
28.8
(0.9-78.8)
17.2
(0.0-53.1)
5.3
(0.0-36.7)
28.3
(7.4-63.5)
20.4
(1.5-50.5)
11.3
(0 ... .......... O' , • I-L,';I. )
9.5
(2.5-39.2)
4.7
(1.1-23.1)
1.4 f' n 1 1 '°' ,- '\ \. U.l-1.).:)J
At all levels, p value = NS (Mann-Whitney U-Test)

The analysis of the acid peaks within the duodenal bulb to below the
pH level 4.0 is shown in Table 7.3, and this revealed a similar
pattern of duodenal bulb acid exposure in the control and HRG patient
groups. However, the NOG DU patients experienced not only reduced
duration of acid exposure ( as shown by the time spent at pH <4 and
the duration of each acid peak), but also reduced numbers of acid
peaks. The overall range of the numbers of acid peaks was, however,
similar to the other two groups.
Table 7.3: Analysis of acid peaks in the duodenal bulb after cephalic
stimulation and a meal in healthy subjects (VOL), Hypergastrinaemic
(HRG) and Normogastrinaemic (NOG) duodenal ulcer patients.
VOL HRG NOG
Time (minutes) 15.0 15.2 4.7
at pH <4 (0.1-46.7) ( 4.1- 37.3) (0.9-9.1)
Duration (min.) 2.9 3.6 2.5
per peak (0.7-18.9) (1.6-13.2) (1.1-6.1)
No. of acid 3.7 3.8 1.9
peaks (0.2-7.8) (0.4-7.5) (0.7-9.1)
No. of peaks 3.0 3.4 1.8
<5 minutes (0.2-6.4) (0.0-6.8) (0.3-8.1)
No. of peaks 0.5 0.7 0.3
>5 minutes (0.0-1.5) (0.2-1.3) (0.0-1.6)
Data standardized to one hour
At all levels, p value = NS (Mann-Whitney U Test)
157
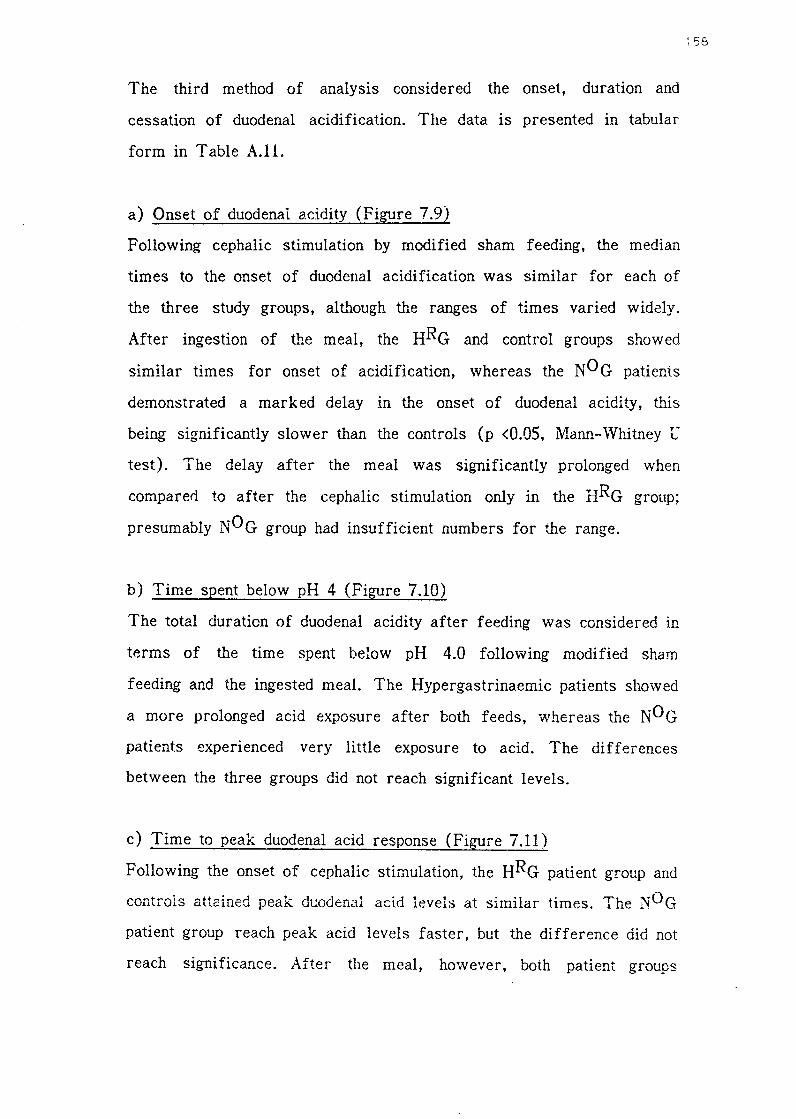
The third method of analysis considered the onset, duration and
cessation of duodenal acidification. The data is presented in tabular
form in Table A.11.
a) Onset of duodenal acidity (Figure 7.9)
Following cephalic stimulation by modified sham feeding, the median
times to the onset of duodenal acidification was similar for each of
the three study groups, although the ranges of times varied widely.
After ingestion of the meal, the HRG and control groups showed
similar times for onset of acidification, whereas the NOG patients
demonstrated a marked delay in the onset of duodenal acidity, this
being significantly slower than the controls (p <0.05, Man.Tl- 'Whitney U
test). The delay after the meal was significantly prolonged when
compared to after the cephalic stimulation only in the HRG group;
presumably NOG group had insufficient numbers for the range.
b) Time spent below pH 4 (Figure 7.10)
The total duration of duodenal acidity after feeding was considered in
terms of the time spent below pH 4.0 fallowing modified sham
feeding and the ingested meal. The Hypergastrinaemic patients showed
a more prolonged acid exposure after both feeds, vvhereas the NOG
patients experienced very little exposure to acid. The differences
between the three groups did not reach significant levels.
c) Time to peak duodenal acid response (Figure 7.11)
Following the onset of cephalic stimulation, the HRG patient group and
controls attained peak duodenal acid levels at similar times. The NOG
patient group reach peak acid levels faster, but the difference did not
reach significance. After the meal, however, both patient groups
~58
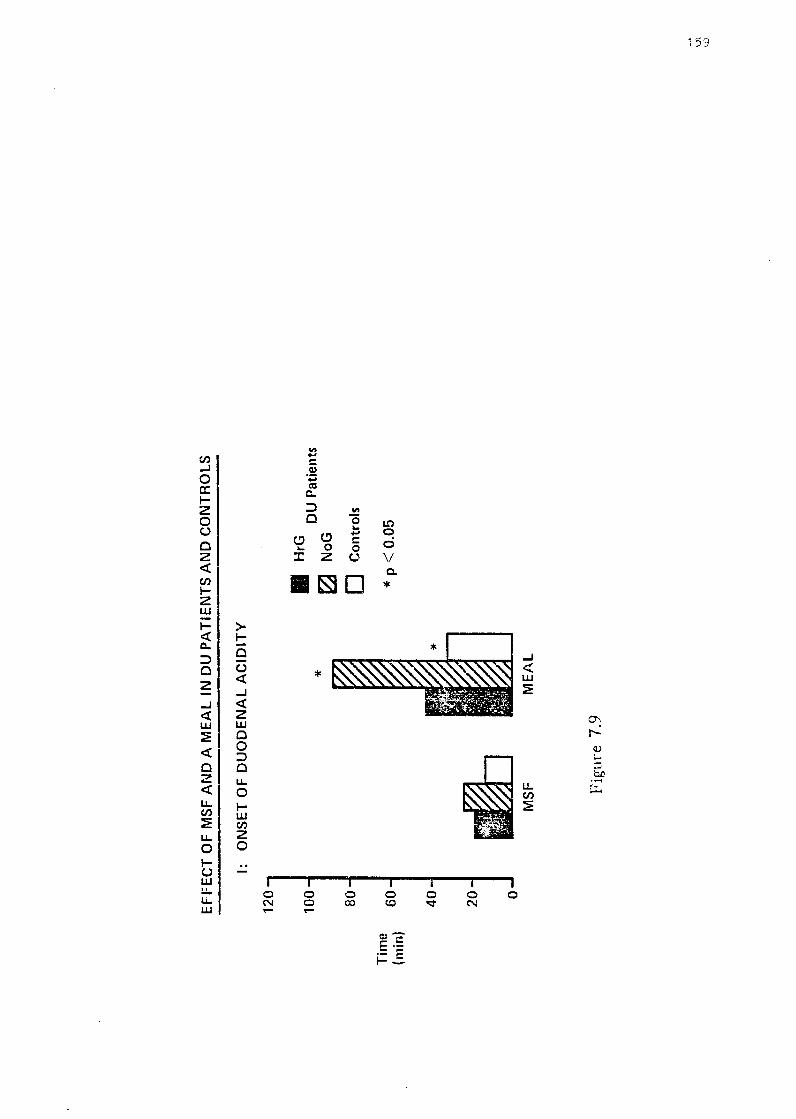
Tim
e (m
in}
EF
FE
CT
OF
MS
F A
ND
A M
EA
L I
N D
U P
AT
IEN
TS
AN
D C
ON
TR
OLS
I:
ON
SE
T O
F D
UO
DE
NA
L A
CID
ITY
12
0
100J
• H
rG
* D
U P
atie
nts
~
NoG
BO]
~ D
Con
trol
s
60
* p
< 0.
05
40
20J
if&]
0-'
MS
F M
EA
L
Fig
ure
7.9
IJl
,o

Tim
e
(min
)
EF
FE
CT
OF
MS
F A
ND
A M
EA
L I
N D
U P
AT
IEN
TS
AN
D C
ON
TR
OLS
11:
TIM
E S
PE
NT
< p
H 4
120
100 J
• H
rG
DU
Pat
ient
s ~
NoG
80
1
D C
ontr
ols
60 -
40
-
20 -
0 M
SF
ME
AL
Fig
ure
7. L
O
-· °' 0

Tim
e
(min
)
EF
FE
CT
OF
MS
F A
ND
A M
EA
L ll
'J D
U P
AT
IEN
TS
AN
D C
ON
TR
OLS
120
10
0
80
60
40
20
0
111:
T
IME
TO
PE
AK
DU
OD
EN
AL
AC
ID R
ES
PO
NS
E
MS
F M
EA
L
Fig
ure
7.11
• H
rG
DU
Pat
ient
s N
oG
~
D C
ontr
ols
_, °'

Tim
e (m
in)
EF
FE
CT
OF
MS
F A
ND
A M
EA
L I
N D
U P
AT
IEN
TS
AN
D C
ON
TR
OLS
IV:
120
100 80
60
40
20 0
TIM
E T
O R
ET
UR
N F
RO
M P
EA
i< D
UO
DE
NA
L A
CID
RE
SP
ON
SE
TO
PR
E-M
EA
L p
H V
AL
UE
S
*
MS
F M
EA
L
Fig
ure
7.12
• H
rG
DU
Pat
ient
s
0 N
oG
D C
ontr
ols
* p
<0
.01
~
0-,
N

showed prolonged times compared to the control group, and again the
differences were not significant, presumably because of the numbers.
For all three groups, the times to peak response after the meal were
significantly slower than that after cephalic stimulation (HRG and
NOG: p <0.01; VOL: p <0.02, Wilcoxon Matched-Pairs Signed-Ranks
test).
d) Time to return from peak duodenal acid response to pre-meal pH
values (Figure 7.12)
The time taken from the peak acid response to return to the pre-meal
pH value is an indirect measure of the "switch-off" mechanism of
gastric acid secretion. Following cephalic stimulation, the three groups
showed similar times. However, after the meal, the time to return to
pre-meal pH levels was significantly slower amongst the
Hypergastrinaemic patients compared to the Normogastrinaemic patients
(p <0.01, Mann-Whitney U test), but not quite as marked when
compared to the control group. In addition, only the HRG group showed
a significantly slower time after the meal compared to after the sham
feed.
7.7 DISCUSSION
The values for fasting plasma gastrin obtained in this study are at
variance with other reports (Hansky and Cain 1969, Stadil and Rehfeld
1971, McGuigan and Trudeau 1973, Levine et al 1976). These
variations are not thought to be due to population differences ("Walsh
1979), although it should be noted that almost ali of the subjects
studied in this investigation were of Celtic origin, and Scots have been
found to have an increased parietal cell mass (Lam 1984). The more
likely reasons for the differences in gastrin levels are: differing
163

techi--iiques of gastrin radioimmunoassay with a tendency for the newer
improved assays to yield lower values (Berson and Yalow 1972); and
the skewed distribution (Byrnes et al 1970, Berson and Yalow 1972)
with wide ranges in the gastrin levels for patients and control subjects
(Hansky and Cain 1969, Stadil and Rehfeld 1971).
In this present investigation, the patients with duodenal ulcer, as a
group, exhibited significantly higher fasting plasma gastrin levels
compared to the healthy subjects. This finding confirms the results of
some reports (Byrnes et al 1970, Reeder et al 1970, Ganguli and
Hunter 1972, Mayer et al 1974, Gedde-Dahl 1975), but is not in
keeping with others (McGuigan and Trudeau 1973, Steen et al 1980,
Poulsen, Eisum and Amdrup 1986). Indeed, some authors have reported
fa sting plasma gastrin levels of duodenal uicer patients to be lower
than controls (Korman, Soveny and Hansky 1971, Trudeau and
McGuigan 1971, Feldman, Richardson and Fordtran 1980). These
differing reports illustrate that there is considerable overlap in the
gastrin levels not only between duodenal ulcer patients and healthy
subjects, but also between the DU patients themselves. The distribution
of fasting plasma gastrin data was not normal, and transformation by
natural logarithms normalised the distribution. This has been obse:rved
previously (Ardill 1973).
It is well recognized that cephalic stimulation via the vagus induces a
strong gastric acid secretory response (Richardson et al 1977,
Konturek et al 1978, Jarhult, Graffner and Bloom 1984). However, the
response of plasma gastrin to such stimulation has not been
consistently reported. Some studies has not shown any appreciable
increase in plasma gastrin following modified sham feeding (Feldman
et al 1979, Stenquist, Rehfeld and Olbe 1979, Konturek et al 1981,
164

Jarhult, Graffner and Bloom 1984, Kohn et al 1985), while others have
demonstrated a significant rise over basal levels (Mayer et al 1974,
Knutson, Olbe and Ganguli 1974, Feldman, Richardson and Fordtran
1980). In the present study, both the control subjects and the patients
with duodenal ulcer failed to show a significant increase in plasma
gastrin over basal levels, after cephalic stimulation. These results
would suggest that vagally-released gastrin is not a significant
contributor to the stimulation of gastric acid secretion in either health
or duodenal ulcer disease. The roles of somatostatin and duodenal
acidification ( via secretin) in inhibiting gastrin release are discussed
below.
Following the ingested meal, the plasma gastrin levels were
significantly raised in both the controls (by 180.0%) and DU patients
(by 318.8%); these results being well established (Byrnes et al 1970,
Hayes et al 1973, Mayer et al 1974, Fritsch, Hausaman and Rick 1976,
Richardson et al 1977). The response amongst the patients was
sigPificantly stronger than the controls and, in addition, the gastrin
levels of the DU patients remained significantly higher than those of
the controls. It would, therefore, appear that patients with duodenal
ulcer do have excessive basal and post-stimuiation levels of plasma
gastrin.
However, closer examination of the fasting gastrin data in this study
showed there to be a bimodal distribution (Figure 7.2), and two
clearly defined populations of duodenal ulcer patients appeared to exist.
The "H ~ . . •• ypergas Lnnaenuc patients exhibited exaggerated gastrin
responses to both cephalic stimulation and the ingestion of the meal.
On the other hand, the "Normogastrinaemic" patients demonstrated
gastrin responses that approximated to those of the healthy subjects.
165

Similar hypergastrinaemic patients have previously been noted (Berson
and Yalow 1972, Mayer et al 1974, Montoro, Garcia and Samitier
1985), but not fully described. In contrast to patients with Zollinger
Ellison syndrome who experience no rise in plasma gastrin after
feeding (Berson and Yalow 1972, Malagelada 19n), these
hypergastrinaemic DU patients exhibited marked and significant
increases in plasma gastrin after both ingestion of a meal and cephalic
stimulation. The exaggerated response to cephalic stimulation suggests
a vagal hyperactivity in these patients.
The triad of duodenal ulceration, hypergastrinaemia and hyperacidity
has been described (Hansky 1977, Walsh 1977). The usual causes in
unoperated patients are gastrinoma, hyperparathyroidism, antral G cell
hyperplasia and, in some cases, gastric outlet obstruction (Ebeid and
Fisher 1976). The increased gastrin response to feeding is thought to
be due to increased gastrin stores, increased number of G cells
(Fiddian-Green and Vinik 1983), some autonomy in release of gastrin
(Hansky 1979), or a diminished inhibition of gastrin release by antral
acid (Wormsley 1979). Indeed, high gastrin levels in the presence of
hyperacidity in ulcer patients favours the latter explanation. This
defective inhibition of gastrin release was confirmed in a study from
Denmark (Steen et al 1980) in which a significant negative correlation
was demonstrated between gastrin levels and acid output in controls
but not in duodenal ulcer patients. It has also been suggested that these
patients with hypergastrinaemia, hyperacidity and no gastrin-producing
tumour, have an over-sensitive or overactive G cell-bearing antro
duodenal mucosa (Berson and Yalow 1972).
The "Normogastrinaemic" ulcer patients had fasting gastrin levels
similar to the healthy subjects, and likewise experienced no increased
1 66

response to cephalic stimulation. This group of ulcer patients may conceivably represent the majority of "ordinary" DU patients, thereby
confirming findings of earlier reports (Konturek et al 1978, Stenquist, Rehfeld and Olbe 1979, Kisfalvi, Foldvari and Szucs 1983). The mealstimulated peak gastrin response in these patients was also similar to that exhibited by the controls. Similar results have been found by other workers (McGuigan and Trudeau 1973, Stern and Walsh 1973).
The reported (McGuigan and Trudeau 1973, Walsh and Grossman 1975b, Wormsley 1979) sustained increased levels of post-prandial plasma gastrin were only observed, in this study, amongst the subset of HRG patients. This would confirm that it is this subset of duodenal ulcer patients that have a defective inhibition of gastrin release, whereas the NOG patients react in similar fashion to healthy subjects. In a study on the mechanism of inhibition of gastric acid secretion, Sainz and co-workers (1987) distinguished two groups of DU patients, one group who showed a clearly defective inhibition. It would be interesting to investigate this group further by measuring their plasma gastrin responses.
The fasting plasma secretin levels were not significantly different between healthy controls and the two groups of DU patients. As with the plasma gastrin levels, the secretin levels of DU patients have previously been reported as being significantly higher than (Chey, Hendricks and Tai 19n), significantly lower than (Ward and Bloom 1974, McLoughlin, Green and Buchanan 1978), and similar to controls ( Greenberg et al 1982, Kurokawa et al 1982). The distribution of fasting data, however, was near-normal, log-transformation did not add any benefit. The data has been logged by other authors prior to analysis ( Greenberg et al 1982). It has been shown that, following
167
duodenal acidification, plasma secretin levels rise briefly ( Greenberg
et al 1982, Jorde and Burhol 1985), only to fall during the first post
prandial hour. In the present study, only the Hypergastrinaemic patients
showed any appreciable increase in plasma secretin after duodenal
acidification by either cephalic stimulation or a meal. As the post
prandial plasma gastrin levels were prolonged in these patients and
neither the controls nor NOG patients exhibited rises in plasma
secretin after the meal, the physiological role of secretin in inhibiting
gastrin release in Man is questionable. This proposal is supported by
the significant negative correlation demonstrated between plasma
gastrin and secretin in the healthy subjects and the NOG DU patients.
The doubts concerning the role of secretin in Man have previously
been raised (vVard and Bloom 1974, Kleibeuker et al 1984 ), although
its case has been proved in dogs (Johnson and Grossman 1968). That
duodenal acidification inhibits gastrin-stimulated gastric acid secretion
( Wormsley 1971, Sainz et al 1985) is not disputed, although this
inhibition is defective in some duodenal ulcer patients (Shay et al
1942, vValsh, Richardson and Fordtran 1975, Malagelada et al 1977,
Sainz et al 1985). The presence of a second hormone to fill this role
has been sought, and an in11ibitory agent called bulbogastrone has been
proposed (Uvnas 1971 ).
The fasting plasma somatostatin levels shown in this study were
similar to those reported in some studies ( Colturi, Unger and Feldman
1984, Lucey et al 1985) but were lower Llian in others ( Gustavsson et
al 1982, Lucey et al 1984, Kishimoto et al 1985). The
Normogastrinaemic patients exhibited the highest levels, being
significantly greater than both the HRG DU patients and controls. The
influence of the vagus on the somatostatin release was confirmed in
part by the responses to cephalic stimulation, as only the duodenal
168

ulcer patients experienced rises in plasma somatostatin after such
stimulation; this being significant amongst the NO G group. Previous
studies (Colturi, Unger and Feldman 1984, Lucey et al 1985, Calabro et
ai 1986) have demonstrated significant post-prandial somatostatin rises
in normal subjects but not in DU patients. However, in the present
study, the meal response was markedly raised and prolonged in the
NOG group, while the HRG patients and controls exhibited minimal
responses. There was no significant correlation between post
stimulation plasma gastrin and somatostatin levels in either the healthy
subjects or DU patient groups. However, the correlation tended to be
negative in the NOG DU patients which was unexpected.
The higher plasma somatostatin levels experienced by the
Normogastrinaemic DU patients might explain their relatively lower
plasma gastrin levels and responses. Conversely, the differences in
somatostatin responses might be explained on the basis of the
Hypergastrinaemic DU patients exhibiting a defect in somatostatin
induced inhibition of plasma gastrin release. The foregoing findings of
this investigation would favour the iatter explanation.
Gastric emptying has been reported to be increased in duodenal ulcer
patients (Lagerlof, Rudewald and Perman 1960, Griffith et al 1968,
McLaughlin, Green and Buchanan 1978), but this has not been
confirmed by a recent report (Holt et al 1986) in which such patients
were studied before and after medical treatment. The present study
confirmed this latter finding, and provided evidence to the contrary.
The onset of duodenal acidity was longer in both patient groups after
cephalic stimulation and even slower foilowing the ingested meal.
Likewise, the time to peak duodenal acid response after the meal was
slm,ver in both patient groups. This would suggest a hold-up in the
169

normal emptying of gastric acid from the stomach in duodenal ulcer
patients, and this appears to be more pronounced in the
Normogastrinaemic sub-group of patients.
Following both cephalic stimulation and ingestion of a meal, the HRG
patients exhibited a delay in the return to pre-meal pH levels. The
possible reasons for this observation are: these patients may have a
defect in the neutralizing mechanisms within the duodenal bulb; the
clearing mechanism of the antro-duodenal segment may be defective;
and these Hypergastrinaemic patients have a defect in the "switch-off"
mechanism of gastric acid secretion. The data f ram presented in this
study, including the sustained gastrin release, favour the last
explanation.
In conclusion, vagally-released gastrin does not appear to be a
significant contributor to the stimulation of gastric acid secretion in
either health or duodenal ulcer disease. The results of this study show
that duodenal ulcer patients, as a group, have excessive basal and post
stimulation levels of plasma gastrin. There is, however, a clearly
defined sub-group of duodenal ulcer patients, the "Hypergastrinaemic"
patients who respond in a different manner compared to the "ordinary"
duodenal ulcer patients. These HRG DU patients demonstrate:
significantly greater increases in plasma gastrin in response to
cephalic stimulation and a meal; vagal hyperactivity; defective inhibition
of gastrin release by both antral acidification and via somatostatin; and
an inpaired "switch-off" mechanism of gastric acid secretion. In
addition, the physiological roie of secretin in iIL1iibiting gastrin release
in Man is questionable.
172)

171
CHAPTER 8
CONCLUSIONS AND THE FUTURE

172
8.1 DUAL GASTRO-DUODENAL pH MO~lTORING SYSTEM
The pH monitoring system developed and described m this investigation
produced a reliable and accurate recording of the antral and duodenal
bulb pH. The numerous problems encountered in the past, which
hampered previous studies, have largely been overcome with the advem
of improved pH monitoring equipment and recording techniques. The
small glass pH electrodes are the most suitable for intra-luminal pH
monitoring and are accurate over long periods of time as they do not
exhibit a significant drift in response over 24 hours. If such drift does
occur and requires correction, it is generally linear and readily
correctable by the appropiate computer software. The major problem of
placement of the duodena.I electrode at a known and reproducible
distance from the pylorus, can be overcome by the use of a weighted
bag attached to the electrode. The peristaltic pull on the bag, in the
region of the duodeno-jejunal flexure, against fixation of the electrode
wires at the subject's mouth, maintains the position of the electrode
within the bulb. However, accurate placement is only possible towards
the apex of the bulb. Siting the electrode in this manner at the base of
the bulb is liable to be complicated by prolapse of the electrode into the
stomach. Rune's method (Rune 1981) of utilizing a "chain" of four
electrodes overcomes this problem but it does not appear to be suitable
for long-term monitoring.
The computer-based storage and analysis allowed for large amounts of
data to be recorded, and detailed assessment of the respective pH
patterns was possible. Nevv modified software programines provided
additional analysis of the peaks of acidity within the duodenal bulb
which described the pattern of motility of the antro-duodenal segment.

173
8.2 GASTRO-DUODENAL pH PROFILE IN HEAL TH
The profile of gastric pH in the cohort of healthy subjects was steady
throughout the duration of the 24 hour study, except for rises in pH
levels that occurred at the times of eating and drinking. A small
percentage of normals experienced spontaneous rises in pH in the early
hours of the morning, and these rises were possibly related to duoden
gastric reflux.
The pH within the duodenal bulb demonstrated the frequent fluctuations
that have been noted in previous studies. The profile of daytime acid
exposure exhibited an exponential curve and that of nocturnal exposure
was similar. Of note, was the similar exposure to acid during both day
and night, although there was a slight tendency for the daytime exposure
to be greater. The pattern of acid peaks within the bulb was also
similar during day and at night. The effect of gastric stimulation
produced only a slight increase in the acid exposure in the bulb.
8.3 GASTRO-DUODENAL pH PROFILE IN DUODENAL ULCER
DISEASE
Patients with active duodenal ulcer exhibited a profile of gastric pH
over the 24 hours that was similar to the healthy subjects. Spontaneous
rises in pH were also noted at night in a small percentage of patients.
The fasting duodenal bulb pH of the DU patients was similar to that of
the no:rmals, and the fluctuating pattern was also noted. The daytime
exposure to acid showed the same exponential profile as the controls
and no significant difference was observed. A simiiar picture was
shown for the nocturnal acid exposure, and, contrary to earlier reports,

174
the nocturnal exposure was not significantly greater than that
experienced during the day. Gastric stimulation produced the same
effect as seen in the healthy subjects, but the analysis of the acid
peaks suggested a defect in the propulsive duodenal motility in the DU
patients. These results suggest that gastric acid is not of primary
pathophysiological importance in duodenal ulcer disease.
8.4 THE CONTROLS OF GASTRIC ACID SECRETION
The responses of plasma gastrin, secretin and somatostatin and the
concurrent duodenal bulb pH changes to the cephalic and gastric phases
of gastric acid secretion have demonstrated some important
pathophysiological abnormalities present in duodenal ulcer patients.
These patients exhibited excessive basal and post-stimulation plasma
gastrin levels. A clearly defined subset of duodenal ulcer patients
existed , the "Hypergastrinaemic" patients, who behaved in a different
fashion compared to the "ordinary" "Normogastrinaemic" patients and
they demonstrated a number of abnormalities: an exaggerated response
to cephalic stimulation, suggesting vagal hyperactivity; a defect in the
inhibitory mechanism of gastrin release, which appeared to be due an
impaired somatostatin response; and a defect in the negative feedback
of duodenal acidification on gastric acid secretion. In addition, the
vagally-released gastrin did not appear to be a significant contributro to
the stimuiation of gastric acid secretion in either health or duodenal
ulcer disease. The results also suggest that the physiological role of
secretin in inhibiting gastrin release in Man in questionable.

175
8.5 THE FUTURE
The use of the dual gastro-duodenal pH monitoring system is, at this
stage of development and investigation, more for research work, rather
than to be used as a diagnostic tool. However, as reduction of gastric
acid levels produces healing of duodenal ulcers, the next study suited
for the system would be assessment of duodenal acidity following acid
reduction therapy. As a corollary, the efficacy of newer drugs can be
assessed. This would yield more meaningful results in documenting the
change in duodenal acidity following medication. At present, these
studies are being perf armed by monitoring 24 hour intra-gastric pH only
(Walt et al 1981, Walt et al 1983, Etienne et al 1985).
The plasma gastrin results have shown that there is a definite subset
of duodenal ulcer patients that respond quite differently to gastric
stimulation. It might prove beneficial to identify these patients as they
may prove to be in the group of non-responders. It seems feasible
the ref ore, after many patients have been studied, to construct a list of
predictive parameters of those patients who might not respond to
therapy, or those who might benefit from early surgery.
A further area of study with this monitoring system is the condition of
ducdeno-gastric reflux. In this regard, the system may be adapted for
clinical testing. In addition, the receiving unit has space for two further
input sources. These may be added and adapted to monitor intra-luminal
pressure changes. Thus, the collected data of simultaneously measured
gastro-duodenal pH and intra-luminal pressure changes ,vould be of
importance in furthering the understanding of the physiology of the
gastro-duodenal segment.

176
APPENDIX

Table A.1: Cumulative percentage of total 24 hour duodenal pH
recordings in duodenal ulcer patients and healthy subjects.
CUMULATIVE % OF TOT AL DUODENAL pH RECORDINGS*
pH time Controls DU Patients
<5 day 39.6 (7.1-80.9) 37.8 (3.7-68.8)
night 37. 7 (12.6-71.4) 34.S (0.0-85.6)
<4 day 23.9 (1.0-60.6) 24.8 ( i.2-51.3)
night 25.4 (6.9-65.9) 22.2 (0.0-74.6)
<3 day 14.6 (0.1-42.2) 11.7 (0.4-39.2)
night 12.8 (2.2-61.0) 12.5 ( 0.0-57 .2)
<2 day 8.4 ( 0.0-31.8) 3.3 (0.0-29.9)
night 4.5 (0.2-42.6) 5.0 (0.0-35.8)
<1 day 0.3 (0.0-15.0) 0.1 (0.0-9.1)
night 0.5 (0.0-28.5) 0.1 (0.0-22.2)
* median (range)
At all levels, p = NS, Mann=Whitney U Test
177

178
Table A.2: Analysis of number of acid peaks of varying duration within the
duodenal bulb in controls and duodenal ulcer patients.
a) CONTROLS: NUMBER OF PEAKS**
Duration shorter than longer than * short/long p
(min.) Day Night Day Night day night
1 1.2 0.7 2.8 2.5 <0.01 <0.01 (0.3-1.7) (0.2-1.8) ( 1.3-6.1) (2.1-4.4)
2 2.4 2.2 1.1 1.5 <0.02 NS
(0.7-4.6) (0.7-3.4) (0.3-4.1) (0.6-3.0)
3 2.6 2.6 0.9 0.9 <0.01 <0.05 (0.8-3.7) (0.8-5.2) (0.1-3.1) (0.5-2.0)
4 2.8 3.0 0.6 0.8 <0.01 <0.02 (0.9-5.4) (0.8-4.l) (0.1-2.5) (0.3-1.8)
5 2.9 3.2 0.5 0.6 <0.01 <0.01 (0.1-6.2) (0.4-4.1) (0.0-2.2) (0.0-1.5)
b) DUODENAL ULCER PATIENTS:
1 0.9 0.5 3.1 1.7 <0.01 NS
(0.3-2.2) (0.3-2.7) (0.9-5.6) (0.2-5.1)
2 2.1 1.1 1.8 1.0 NS NS (1.1-4.3) (0.4-6.l) (0.2-3.4) (0.1-2.2)
3 2.5 1.2 1.4 0.7 <0.01 NS (1.1-5.7) (0.4-6.7) (0.2-2.0) (0.0-1.8)
4 2.9 1.4 1.1 0.7 <0.01 NS (1.1-6.0) (0.4-6.7) (0.1-1.6) (0.0-1.4)
5 2.9 2.9 0.7 0.7 <0.01 <0.01 (0.0-8.2) (0.0-7.1) (0.0 2.0) (0.0-2.4)
**Medians, ranges; data standardised to one hour
*Wilcoxon Matched-Pairs Signed Ranks test

179
Table A.3: Cumulative pH percentage of gastric pH data in patients
with duodenal ulcer.
CUMULATIVE PERCENTAGE"* OF TOTAL GASTRIC pH DATA
pH LEVEL DAY NIGHT p VALUE~
>1 99.9 100.0 NS
(59.7 - 100.0) (27.6 - 100.0)
>2 52.5 52.4 NS
(18.1 - 97.9) (0.3 - 94.4)
>3 20.9 1.5 <0.001
(7.0 - 45.1) (0.0 - 49.0)
>4 12.7 0.75 <0.001
(3.2 - 29.8) (0.0 - 38.5)
>5 4.8 0.1 <0.001
(0.8 - 14.7) (0.0 - 29.9)
>6 2.0 0.0 NS
(0.1 - 7.5)
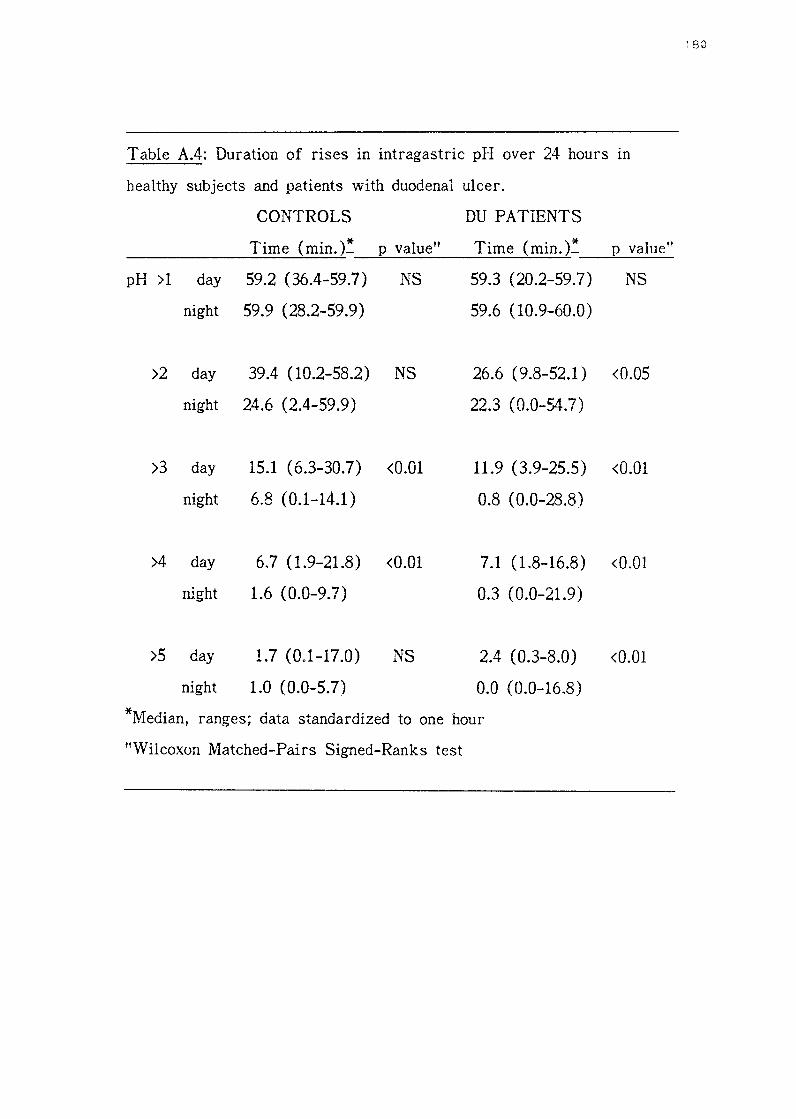
Table A.4: Duration of rises in intragastric pH over 24 hours in
healthy subjects and patients with duodenal ulcer.
CONTROLS
Time (min.t p value"
pH >1 day 59.2 (36.4-59.7) NS
night 59.9 (28.2-59.9)
>2 day 39.4 (10.2-58.2) NS
night 24.6 (2.4-59.9)
>3 day 15.1 (6.3-30.7) <0.01
night 6.8 (0.1-14.1)
>4 day
night
>5 day
night
6.7 (1.9-21.8) <0.01
1.6 (0.0-9.7)
1.7 (0.1-17.0)
1.0 (0.0-5.7)
NS
DU PATIENTS
Time (min.t p value"
59.3 (20.2-59.7) NS
59.6 (10.9-60.0)
26.6 (9.8-52.1) <0.05
22.3 (0.0-54.7)
11.9 (3.9-25.5) <0.01
0.8 (0.0-28.8)
7.1 (1.8-16.8) <0.01
0.3 (0.0-21.9)
2.4 ( 0.3-8.0) <0.01
0.0 (0.0-16.8)
*Median, ranges; data standardized to one hour
"Wilcoxon Matched-Pairs Signed-Ranks test

TABLE A.5: Plasma gastrin responses to modified sham feeding
(MSF) and a meal in duodenal ulcer patients and healthy subjects.
PLASMA GASTRIN (ng/1) (median, range)
Time~ DU Patients(n=22) Controls(n=20) _____ _,___--'--' ______ ...,____._
-1.00 65.0 (20-100) 22.5 (10-80)
-0.30
0.00
0.10
0.20
0.30
0.45
1.15
2.00
2.30
55.0 (20-105)
so.a (20-100)
60.0 (20-185)
50.0 (20-170)
70.0 (20-200)
55.0 (20-160)
52.5 (20-110)
40.0 (20-80)
40.0 (20-90)
2.40 60.0 (15-180)
2.50 120.0 (20-285)
3.00 167.5 (20-325)
3.15 150.0 (20-310)
3.45 100.0 (30-270)
4.30 100.0 (20-175)
5.30 65.0 (20-130)
Fasting 20.0 (5-90)
25.0 (5-110)
25.0 (5-120)
MSF 20.0 (5-200)
22.5 (5-140)
22.5 (5-130)
22.5 (5-90)
25.0 (5-70)
25.0 (50-70)
37.5 (10-240)
MEAL 70.0 (20-300)
60.0 (20-160)
55.0 (20-350)
40.0 (20-240)
45.0 (20-200)
40.0 (10-210)
*Time of sampling (hr,min)
** 1 p_vame
<0.001
<0.001
**Mann-Whitney U Test: At all levels, a significant difference (min.
<0.01) observed between the two groups
181

TABLE A.6: Plasma gastrin responses to modified sham feeding
(MSF) and a meal in "Hypergastrinaemic" (HRG) and
''Normogastrinaemic" (NOG) duodenal ulcer patients.
PLASMA GASTRIN (ng/1) (median, range)
Time" HRG~ (n=ll) NOG** (n=ll)
-1.00 80.0 (50-100) 27 .5 ( 20-65)
-0.30 60.0 (50-105) Fa3ting 30.0 (20-65)
0.00 70.0 (50-100) 30.0 (20-60)
0.10 80.0 (60-185) 30.0 (20-50)
0.20 70.0 (65-170) MSF 30.0 (20-50)
0.30 90.0 (70-200) 35.0 (20-60)
0.45 77.5 (55-160) 35.0 (20-50)
1.15 65.0 ( 45-110) 25.0 (20-55)
2.00 62.5 ( 40-80) 25.0 (20-40)
2.30 55.0 ( 30-90) 30.0 (20-60)
2.40 75.0 (60-180) 42.5 (15-70)
2.50 200.0 (100-285) l\.1EAL 87.5 (20-120)
3.00 225.0 (150-325) 87.5 (20-175)
3.15 175.0 (110-310) 92.5 (20-175)
3.45 125.0 (70-270) 75.0 (30-120)
4.30 125.0 (75-175) 60.0 (20-115)
5.30 100.0 (50-130) 52.5 (20-80)
*Hypergastrinaemic DU patients
**Normogastrinaemic DU patients
"Time of sampling (hr ,min)
1 32

183
TABLE A.7: Plasma secretin responses to modified sham feeding
(MSF) and a meal in duodenal ulcer patients and healthy subjects.
PLASMA SECRETIN (ng/1) (median, ra:ige)
T" * DU Patients( n=22) Controls( n=20) ** 1me_ P- value ---1.00 20.0 (5-75) 25.0 (5-50)
-0.30 25.0 (0-50) Fasting 25.0 (10-60)
0.00 25.0 (0-60) 25.0 (10-55)
0,10 20.0 (5-100) 25.0 (10-40)
0.20 25.0 (5-55) MSF 25.0 (5-45)
0.30 25.0 (0-55) 20.0 (5-45)
0.45 30.0 (5-60) 25.0 (5-50) NS
1.15 27.5 (10-62) 25.0 (10-60)
2.00 25.0 (5-60) 25.0 (10-55)
2.30 25.0 (5-45) 30.0 (10-45)
2.40 25.0 (5-40) 30.0 (10-45)
2.50 25.0 (10-55) MEAL 25.0 (5-50)
3.00 22.5 (5-65) 20.0 (10-45)
3.15 25.0 (5-55) 20.0 (5-40) NS
3.45 20.0 (5-60) 17.S (5-35)
4.30 25.0 (5-85) 20.0 (5-65)
5.30 25.0 (5-40) 22.5 (5-55)
*Time of sampling (hr.min)
**Mann-Whitney U Test: at all levels, no significant differences noted

TABLE A.8: Plasma secretin responses to modified sham feeding
(MSF) and a meal in "Hypergastrinaemic" (HRG) and
"Normogastrinaemic" (NOG) DU patients.
PLASMA SECRETIN (ng/1) (median, range)
T" * 1me_ HRG (n=ll) NOG (n=ll)
-1.00 20.0 (15-75) 25.0 (5-40)
-0.30 25.0 (10-50) Fasting 20.0 (0-50)
0.00 25.0 (10-60) 25.0 (0-40)
0.10 25.0 (5-100) 20.0 (5-35)
0.20 30.0 (10-55) MSF 25.0 (5-40)
0.30 25.0 ( 15-55) 25.0 (0-45)
0.45 32.5 (15-60) 30.0 (5-50)
1.15 30.0 (10-62) 20.0 (10-50)
2.00 25.0 (15-60) 25.0 (5-45)
2.30 25.0 (15-45) 27.5 (5-40)
2.40 25.0 (5-40) 25.0 (5-40)
2.50 30.0 (10-55) Meal 22.5 (10-50)
3.00 25.0 (10-65) 20.0 (5-50)
3.15 30.0 (15-55) 25.0 (5-40)
3.45 20.0 (10-60) 20.0 (5-45)
4.30 25.0 (10-85) 25.0 (5-40)
5.30 25.0 (10-35) 25.0 (5-40)
*Time of sampling (hr,min)
At all levels, no statistical difference observed (Mann-Whitney U
Test)
184
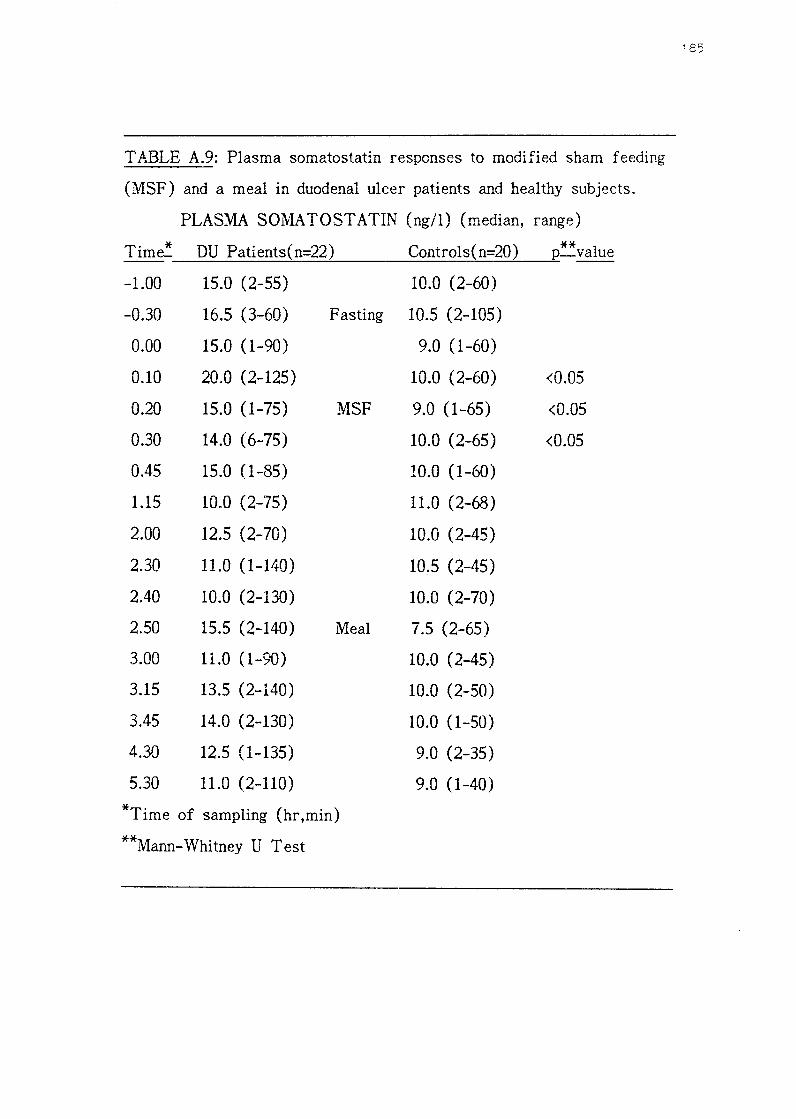
185
TABLE A.9: Plasma somatostatin responses to modified sham feeding
(MSF) and a meal in duodenal ulcer patients and healthy subjects.
PLASMA S01VIA TOST ATIN (ng/1) (median, range)
T' * DU Patients(n=22) Controls( n=20) ** 1me_ p_value ---1.00 15.0 (2-55) 10.0 (2-60)
-0.30 16.5 (3-60) Fasting 10.5 (2-105)
0.00 15.0 (1-90) 9.0 (1-60)
0.10 20.0 (2-125) 10.0 (2-60) <0.05
0.20 15.0 (1-75) MSF 9.0 (1-65) <0.05
0.30 14.0 (6-75) 10.0 (2-65) <0.05
0.45 15.0 (1-85) 10.0 (1-60)
1.15 10.0 (2-75) 11.0 (2-68)
2.00 12.5 (2-70) 10.0 (2-45)
2.30 11.0 (1-140) 10.5 (2-45)
2.40 10.0 (2-130) 10.0 (2-70)
2.50 15.5 (2-140) Meal 7.5 (2-65)
3.00 11.0 (1-90) 10.0 (2-45)
3.15 13.5 (2-140) 10.0 (2-50)
3.45 14.0 (2-130) 10.0 (1-50)
4.30 12.5 (1-135) 9.0 (2-35)
5.30 11.0 (2-110) 9.0 (1-40)
*Time of sampling (hr,min)
**Mann-Whitney U Test

TABLE A.10: Plasma somatostatin responses to modified sham feeding
(MSF) and a meal in "Hypergastrinaemic" (HRG) and
"Normogastrinaemic" (NO G) duodenal ulcer patients.
PLASMA SOMATOSTATIN (ng/1) (median, range)
T. * HRG (n=ll) NOG (n=ll) ** 1me- p_value ---1.00 15.0 (2-50) 13.0 (7-55)
-0.30 15.0 (3-50) Fasting 19.0 (10-60)
00.00 15.0 (1-90) 17.0 (9-60)
00.10 20.0 (2-125) 28.0 (5-65)
00.20 10.0 (1-75) MSF 24.0 (10-60) <0.05
00.30 14.5 (6-75) 12.0 (7-75)
00.45 12.5 (1-80) 20.0 (10-85)
01.15 10.0 (2-45) 16.0 (7-75)
02.00 9.0 (2-70) 22.0 (10-70)
02.30 8.5 (1-140) 17.0 (8-60)
02.40 6.0 (2-130) 27.5 (6-85)
13.50 7.0 (2-140) Meal 40.0 (6-60)
14.00 9.5 (1-25) 25.0 (9-90)
14.15 9.5 (2-140) 22.5 (7-60)
14.45 12.0 (2-130) 29.5 (5-75)
15.30 9.0 (1-135) 20.0 (4-65)
16.30 10.0 (2-110) 12.0 (2-70)
*Time of sampling
**Mann-Whitney U Test
186

Table A.11: Effect of cephalic stimulation (MSF) and a meal on
duodenal pH in Hypergastrinaemic (HRG) and Normogastrinaemic
(NOG) DU patients and controls.
I: Onset of duodenal acidity
II: Time spent below pH 4
ONSET* OF DUODENAL ACIDITY TIME* AT pH <4
MSF MEAL MSF Meal
18.5 42.0 21.0 40.2
187
(3.0 - 34.0) (3.0 - 131.0) (0.0 - 85.0) (0.0 - 145.6)
24.0 89.0
( 1.0 - 64.0) (24.0 - 147.0)
VOL 14.0 32.0
(1.0 - 78.0) ( 3.0 - 101.0)
** p value NOG/VOL
<0.05
*Minutes ( median, range)
**Mann-Whitney U test
7.2 4.1
(0.0 - 68.3) (0.0 - 53.0)
27.6 27.1
(0.0 - 88.0) (0.0 - 168.6)

Table A.12: Effect of cephalic stimulation (MSF) and a meal on
duodenal pH in Hypergastrinaemic (HRG) and Normogastrinaemic
(NOG) DU patients and controls.
III: Time to peak duodenal acid response
IV: Time from peak acid response to return to pre-meal pH levels
TIME* TO PEAK RESPONSE TIME* TO PRE-MEAL pH
MSF Meal MSF Meal
HRG 42.5 111.1 48.4 76.2
01.1 - n.o) (32.0 - 152.0) (13.7 - 100.5) (25.0 - 114.0)
NOG 18.5 108.1 35.5 33.0
(9.0 - 68.0) (71.0 - 175.0) (9.0 - 115.0) (20.0 - 72.7)
VOL 47.6 82.3 44.9 42.0
(9.0 - 109.0) (17.0 - 207.0) (7.0 - 140.0) (10.7 - 122.0)
** value HRG;NOG p
<0.01
*Minutes (median,range)
**Man.'1-\Vhitney U test
188

189
REFERENCES

Anderson JC., Barton MA., Gregory RA., Hardy PM., Kenner GW.,
Macleod JK., Preston J., Sheppard RC. (1964) : Synthesis of gastrin.
Nature 204: 933-934
Andersson S., Grossman MI. (1965) : Profile of pH, pressure and potential difference at gastroduodenal junction in man. Gastroenterology
49: 364-371
Archambault AP., Rovelstad RA., Carlson HC. (1967) : In situ pH of the duodenal bulb contents in normal and duodenal ulcer subjects. Gastroenterology 52: 940-947
Ardill JES. (1973) : Radioimmunoassay of gastrin. PhD. Thesis, Queen's University of Belfast, Belfast
Ardill J ., Buchanan KD., Kenndey TL. (1971) Fasting plasma gastrin levels in man. Gut 12: 860
Atkinson M., Henley KS. (1955) Levels of intragastric and intraduodenal acidity. Clin. Sci. 14: 1-14
Aynaciyan AV., Bingham JR. (1969) : pH of the duodenum of patients with and without duodenal ulcers measured with a radiotelemetering capsule. Gastroenterology 56: 476-482
Baron JH. (1973) : The clinical application of gastric secretion measurements. Clin. Gastroenterol. 2: 293-314
Bayliss WM., Starling EH. (1902)
secretion. J. Physiol. 28: 325-353
The mechanism of pancreatic
190
Achord JL. (1981): Gastric pepsin and acid secretion in patients with acute and healed duodenal ulcer. Gastroenterology 81: 15-18

Beacham ]., Bentley PH., Gregory RA., Kenner GW., MacLeod JK.,
Sheppard RC. (1966) : Synthesis of human gastrin I. nature 209: 585-
586
Befrits R., Samuelsson K., Johansson C. (1984) : Gastric acid
inhibition by antral acidification mediated by endogenous prostaglandins.
Scand. J. Gastroenterol. 19: 899-904
Bendtsen F., Rosenkilde-Gram B., Tage-Jansen U., Ovesen L., Rune
S. (1986) : Duodenal bulb pH in health and duodenal ulcer disease.
Scand. J. Gastroenterol. 21 Suppl 120: 59
Benn A., Cooke WT. (1971) : Intraluminal pH of duodenum and
jejunum in fa sting subjects with normal and abnormal gastric or
pancreatic function. Scand.J. Gastroenterol. 6:313-317
Bentley PH., Kenner GvV., Sheppard RC. (1966) Structures of human
gastrins I and II. Nature 209: 583-585
Berk JE., Rehfuss ME., Thomas JE. (1942) : The acidity of the
"ulcer-bearing area" of the duodenum in normal persons. Am. J. Dig.
Dis. 9: 276-281
Berson S., Yalow RS. (1972) : Radioimmunoassay in gastroenterology.
Gastroenterology 62: 1061-1084
Bircher J ., Mann CV., Carlson HC., Code CF., Rovelstad RA. (1965) :
Intraluminal and juxtamucosal duodenal pH. Gastroenterology 48: 472-
477
1 91

Bloom SR., Polak JM. (1980) : Alimentary endocrine system. In:
Sircus \V ., Smith AN. (Eds.): Scientific foundations of
gastroenterology. William Heineman medical books Ltd., London
Bloom SR., 1vVard AS. (1975) : Failure of secretin release in patients
with duodenal ulcer. Br. Med. J. 1: 126-127
Bochenek \V., Rodgers JB., Balint JA. (1971) Inhibition of
pentagastrin-stimulated gastric secretion by duodenal acidification or
administration of fat in normal subjects and in patieats with duodenal
ulcer. Am. J. Dig. Dis. 16:865-872
Boden G., Wilson RM., Essa-Koumar N., Owen OE. (1978) : Effects
of a protein meal, intraduodenal HCl, and oleic acid on portal and
peripheral venous secretin and on pancreatic bicarbonate secretion. Gut
19: 277-283
Brazeau P., Vale W., Burgus R., Ling N., Butcher M., Rivier J.,
Guilleman R. (1973) : Hypothalamic polypeptide that inhibits the
secretion of immunoreactive pituitary growth hormone. Science 173:
77-79
Brunner H., Ghember-Chalubinska KV., Scheithauer W., Schiessel R.
(1984) : Stimulation der magensaureskretion durch scheinfutterung bei
patienten mit ulcus duodeni var und nach selektivproximaler v::.1gotomie.
\,V;.,,.., T<l.n W a;:.. l~b-_ 158 ,,..,,.._,.1..A.e .Lltr....&..L.l..1e JT• ./V• -' J..
192

Bryant MG., Adrian TE. (1982) : Gastrin. In: Bloom SR., Long RG.
(Eds.): Radioimmunoassay of gut regulatory peptides. WB. Saunders,
London; 51-59
Byrnes DJ., Young JD., Chisholm DJ., Lazarus L. (1970) : Serum
gastrin in patients with peptic ulceration. Br. Med. J. 2: 626-629
Calabro A., Ceccatelli P., Brocchi A., D' Agata A., Masini R., Sani S.,
Surrenti C. (1986) : Evidence cf impaired somatostatin response to a
protein meal in duodenal ulcer patients. Ital. J. Gastroenterol. 18: 47
Chey WY., Hendrick J., Tai HH. (1977) : Plasma secretin in fasting
and post-p:randial state in Man. Gastroenterology 72: 1156
Chey WY., Lee YH., Hendricks JG., Rhodes RA., Tai H-H. (i978) :
Plasma secretin concentrates in fasting and post-prandial state in man.
Am. J. Dig. Dis. 23:981-987
Colson RH., Watson BW., Fairclough PD., Walker-Smith JA.,
Campbell CA., Bellamy D., Hinsull SM. (1981) : An accurate, long
term, pH-sensitive radio pill for ingestion and implantation. Biotelem.
Patient Monit. 8: 213-227
Colturi T J., Unger RH., Feldman M. (1984) : Role of circulating
somatostatin in regulation of gastric acid secretion, gastrin release and
islet cell function. Studies in healthy subjects and duodenal ulcer
patients. J. Clin. Invest. 74: 417-423
193

Comfort MW. (1945) : Acidity of the duodenal contents in health and
disease: a review of clinical investigations. Gastroenterology 4: 135-
146
Coni,ell AM., Waters TE. (1964) : Assessment of gastric function by
pH telemetering capsule. Lancet ii: 227-230
Dalton MD., Einstein AM., "Walsh JH., Fordtran JS. (1976) : Effect of
secretin on gastric function in normal subjects and in patients with
duodenal ulcer. Gastroenterology 71: 24-29
Duberstein DL., Efrusy ME. (1977) : Benign gastric ulceration with
pentagastrin-f ast achlorhydria (the first reported case).
Gastroenterology 72: 1369-1370
Ebeid AM., Fisher JE. (1976) : Gastrin and ulcer disease: What is
known. Surg. Clin. N. Am. 56: 1249-1265
Edkins JS. (1905) : On the chemical mechanism of gastric secretion.
Proc. R. Soc. (Land.) 76:376
Einhorn M. (1909) : A new method of recognizing ulcers of the upper
digestive tract and of localizing them. Med. Rec. 75: 549-552
Einhorn M. (1910a) : Experiences with the duodenal contents. J .A.M.A.
55: 6-9 (143)
Einhorn M. (1910b) : A practical method of obtaining the duodenal
contents in Man. Med. Rec. Jan 15: 98-101
Einhorn M. (1918) : Further experiences with the direct examinatyion
of the duodenal contents in affections of the gall-bladder and allied
organs. Med. Rec. 93: 885-888
Einhorn M. (1941) : Fractional examination of the duodenal contents in
peptic ulcer. J .A.M.A. 77: 1471-1474
Einhorn M., Rosenbloom J. (1910) A study of the duodenal contents
in man. Arch. Int. Med. 6: 666-676
Ellis BW., Russel RCG., Bloom SR., Dudley HAF. (1975)
rhythm of gastrin and glucagon. Br. J. Surg. 62: 664
Diurnal
Ellison EH., ·wilson SD. (1964) : The Zollinger-Ellison syndrome: Re
appraisal and evaluation of 260 registered cases. Ann.Surg. 160: 512-
528
Etienne A., Fimmel CJ., Bron BA., Loizeau E., Blum AL. (1985) :
Evaluation of pirenzepine on gastric acidity in healthy volunteers using
ambulatory 24 hour intragastric pH-monitoring. Gut 26: 241-245
Eyerly JB. (1940) : Comparative pH values within the stomach,
pylorus and duodenum in antacid therapy. Arn. J. Digest. Dis. 7: 431-
434
Eyerly JB., Breuhaus HC. (1939) : A method of measuring acidity and
protein digestion within the hurnau stomach. Am. J. Digest. Dis. 6:
187-194

Feldman M., Richardson CT. (1986) : Role of thought, sight, smell and
taste of food in the cephalic phase of gastric acid secretion in
humans. Gastroenterology 90: 428-433
Feldman M., Richardson CT. (1986) : Total 24-hour gastric acid
secretion in patients with duodenal ulcer. Comparison with normal
subjects and effects of cimetidine and parietal cell vagotomy.
Gastroenterology 79: 540-544
Feldman M., Richardson CT., Fordtran JS. (1980) : Effect of sham
feeding on gastric acid secretion in healthy subjects and duodenal ulcer
patients: evidence for increased basal tone in some ulcer patients.
Gastroenterology 79: 796-800
Feldman M., Richardson CT., Taylor IL., Walsh JH. (1979) : Effect
of atropine on vagal release of gastrin and pancreatic polypeptide. J.
Clin. Invest. 63: 294-298
Fiddian-Green R., Hobsley M. (1974) : Defective bicarbonate secretion
in response to duodenal acid loads. Br. J. Surg. 61: 330-331
Fiddian-Green RG., Vinik AL (1983) : The mearing of a gastrin
response to a test meal. Surgery 94: 1038-1042
Fimmel CJ., Etienne A., Cilluffo T ., Ritter V., Dasser T ., Rey J-P.,
Caradonna-Moscatelli P., Sabbatini F., Pace F., Buhler HW.,
Bauerfeind P., Blum AL. (1985) : Long-term ambuiatcry gastric pH
monitoring: Validation of a new method and effect of H')-antagonists. ""'
Gastroenterology 88: 1842-1851

Fordtran JS., Walsh JH. (1973) : Gastric acid secretion rate and
buffer content of the stomach after eating. J. Clin. Invest. 52: 645-657
Friedenwald J ., Sindler J. (1921) : Fractional analysis of the duodenal
contents in normal individuals. J .A.M.A. 77: 1469-1471
Fritsch W-P., Hausamen T-U., Rick ·w. (1976) : Gastric and
extragastric gastrin release in normal subjects, in duodenal ulcer
patients, and in patients with partial gastrectomy (Billroth I).
Gastroenterology 71: 552-557
Ganguli PC., Hunter WM. (1972) : Radio-immunoassay of gastrin m
human plasma. J. Physiol. 220: 499-510
Gedde-Dahl D. (1975) : Serum gastrin responses to food stimulation
and gastric acid secretion in male patients with duodenal ulcer. Scand.
J. Gastroenterol. 10: 187-191
Greenberg GR. (1982) : Secretin. In: Bloom SR., Long RG. (Eds.):
Radioimmunoassay of gut regulatory peptides. WB. Saunders, London;
66-73
Greenberg GR., McCloy RF., Baron JH., Bryant MG., Bloom SR.
(1982) : Gastric acid regulates the release of plasma secretin in man.
Europ. J. Clin. Investig. 12: 361-372
Gregory RA., Ha:-dy PM., Jones DS., Kenner G·N., Sheppard RC.
(1964) : Structure of gastrin. Nature 204: 931-933
1 97

Gregory RA., Tract HJ. (1964a) : The constitution and properties of
two gastrins extracted from hog antral mucosa. Gut 5: 103-117
Gregory RA., Tracy HJ. (1964b) : Isolation of two gastrins from
human antral mucosa. Nature 209: 583
Griffith GH., Owen GM., Campbell H., Shields R. (1968) : Gastric
emptying in health and gastroduodenal disease. Gastroenterology 54: 1-7
Gross RA., Isenberg JI., Hogan D., Samloff IM. (1978) : Effect cf
fat on meal-stimulated duodenal acid load, duodenal pepsin load and
serum gastrin in duodenal ulcer and normal subjects. Gastroemterology
75: 357-362
Grossman MI. (1966) : Treatment of duodenal ulcer with secretin: a
speculative proposal. Gastroenterology SO: 912-913
Gustavsson S., Adami H-0., Bjorklund 0., Enander L-K., Lundqvist
G., Loaf L., Nordahl A. (1982) : Fasting blood levels of gastrin,
somatostatin, and pancreatic polypeptide in peptic ulcer disease. Scand.
J. Gastroenterol. 17: 81-85
Hannibal S., Remvig L., Rune SJ. (1980) : The effect of antacid on
gastric and duodenal bulb acidity. Scand. J. Gastroenterol. Suppl 58:
29-36
Hannioal S., Rune SJ. (1983) : Duodenal bulb pH rn aormaJ. subjects.
Europ. J. Clin. Investig. 13: 455-460
198

Hansky J., Korman MG., Cowley DJ., Baron JH. (1971) : Serum gastrin in duodenal ulcer. Part II Effect of insulin hypoglycaemia. Gut 12: 959-962
Hansky J. (1977) : Hypergastrinaemia, hyperacidity and peptic ulcer. Rendic. Gastroenterol. 9: 61
Hansky J. (1979) : Gastrin in duodenal ulcer disease. In: Gastrins and the vagus: Rehfeld JF., Amdrup E. Eds.; Academic press, London, New York; 273-276
Hansky J ., Cain MD. (1969) : Radioimmunoassay of gastrin in human serum. Lancet ii: 1388-1390
Harty RF., Maico DG., McGuigan JE. (1986) : Antral release of gastrin and somatastatin in duodenal ulcer and control subjects. Gut 27: 652-658
Hayes JR., Kenndey TL., Ardill J., Buchanan KD. ( 1973) An important duodenal role in gastrin release. Br. J. Surg. 60: 320
Hirschowitz BI. (1982) : Controls of gastric secretion. A roadmap to the choice of treatment for duodenal ulcer. Am. J. Gastroenterol. 77: 281-293
Holt S., Heading RC., Taylor TV., Forrest JA., Tothill P. (1986) : Is gastric emptying abnormal in duodenal ulcer? Dig. Dis. Sci. 31: 685-692
Isenberg JI., Selling JA., Hogan DL., Koss MA. (1987): Impaired proximal duodenal mucosa! bicarbonate secretion in patients with duodenal ulcer. New Engl. J. Med. 316: 374-379
199

Jacobson B., Mackay RS. (1957)
1224
A pH-endoradiosonde. Lancet i:
Jarhult J ., Graffner H., Bloom SR. (1984) : The influence of
modified sham feeding on plasma polypeptide ( CCKi gastrin, motilin,
neurotensin, and somatostatin) concentrations in duodenai ulcer disease.
Acta. Chir. Scand. 150: 141-144
Johnson LR., Grossman MI. (1968) Secr-etin: the enterogastrone
released by acid in the duodenum. Am. J. Physiol. 215; 885-888
Johnson LR., Grossman MI. (1971) : Intestinal hormones as inhibitors
of gastric secretion. Gastroenterology 60: 120-144
Johnston D., Duthie HL. (1964) : Effect of acid in the duodenum on
histamine-stimulated gastric secretion in man. Gut 5: 573-580
Jorde R., Burhol PG. (1985) : Diurnal profiles of gastrointestinal
regulatory peptides. Scand. J. Gastrcenterol. 20: 1-4
Karr WG., Abbott WO., Sample AB. (1935) : Intubation studies of
human small intestine: Chemical characteristics of intestinal contents
in fasting state and as influenced by administration of acids, of
alkalies, and of water. J. Clin. Investig. 14: 893-900
Kearney R\V., Comfort MW., Osterberg AE. (1941) : Hydrogen ion
concentration of the duodenal contents under fasting cca1ditions in
normal persons and in patients with duodenal ulcer: a comparative
study. J. Clin. Investig. 20: 221-227
200

King HE., Comfort MW., Osterberg AE. (1944) : The effect of
Atropine sulphate, Morphine sulphate, Pilocarpine hydrochloride,
Prostigmine methylsulfate, sodium salt of dehydrocholic acid and
Secretin on the gastric and duodenal secretions of normal persons
when fasting. Am. J. Dig. Dis. 11: 31-40
Kisfalvi I., Foldvari P., Szucs K. (1983) : Gastric acid and serum
gastrin response to sham feeding and the effect of cimetidine on the
response to sham feeding in duodenal ulcer patients. Acta. Med. Hung.
40: 215-220
Kishimoto S., Takaba N., Ogawa M., Konemori R., Kambara A.,
Okamoto K., Shimizu S., Sumioka M., Koh H., Sumii K., Kajiyama
G., Miyoshi A. (1985) : Gastrin and somatostatin in patients with
hyperchlorhydric duodenal ulcer. Hiroshima J. Med. Sci. 34: 441-449
Kirk Ri\1. (1981) : Are gastric and duodenal ulcers separate diseases
or do they form a continuum? Dig. Dis. Sci. 26: 149-154
Kitagawa K., Nishigori A., Murata N., Nishimoto K., Takada H. (1966)
: Radiotelemetry of the pH of the gastrointestinal tract by glass
electrode. Gastroenterology 51: 368-372
Kleibeuker JH., Eysselein VE., Maxwell VE., Walsh JH. (1984) : role
of endogenous secretin m acid-induced inhibition of human gastric
function. J. Clin. Invest. 73: 526-532
Knutson U., Bergegardh S., Olbe L. (1974) The effect of
intragastric pH variations on the gastric acid response to sham feeding
in duodenal ulcer patients. Scand. J. Gastroenterol. 9: 357-365
201

Knutson U., Olbe L., Ganguli PC. (1974) : Gastric acid and plasma
gastrin responses to sham feeding in duodenal ulcer patients before
and after resection of antrum and duodenal bulb. Scand. J. Gastroenterol. 9: 351-356
Kohn A., Annibale B., Suriano G., Severi C., Spinella S., Della Pave
G. (1985) : Gastric acid and pancreatic polypeptide responses to
modified sham feeding: indication of an increased basal vagai tone in a
subgroup of duodenal ulcer patients. Gut 26: 776-82
Konturek SJ., Kwiecien N., Obtulowicz W., Mikos E., Sito E.,
Oleksy., Popiela T. (1978) : Cephalic phase of gastric secretion in
healthy subjects and duodenal ulcer patients: role of vagal innervation.
Gut 20: 875-881
Konturek SJ., Swierczek J., Kwiecien N., Obtutowicz W., Dobrzanska
M., Kopp B., Oleksky J. (1981) : Gastric secretory and plasma
hormonal responses to sham-feeding of varying duration in patients
with duodenal ulcer. Gut 22: 1003-1010
Korman MG., Soveny C., Hansky J. (1971) Serum gastrin in
duodenal ulcer. Part I Basal levels and effect of food and atropine.
Gut 12: 899-902
Koster KH., Rune SJ. (1963) Antral control of gastric acid
secretion. Lancet ii: 1183-1188
202

Krawiec J., Odes HS., Schwartz B., Lamprecht SA. (1983) Regional
difference in ambient intraluminal gastric acidity after cimetidine
monitored by intragastric pH-metry. Am. J. Gastroenterol. 78: 272-275
Kreitner H., Pantlischko M. (1949) Untersuchungen der
magenfunktion <lurch direkte pH bestimmungen im lebenden magen.
\-Vien. Ztschr. Inn. Med. 30: 160-165
Kurokawa M., Saito R., Shinomura Y., Takahashi S., Hamabe S.,
Himeno S., Shima K., Tarui S. (1982) : Effect of intraduodenal load
of endogenous acid on secretin release in patients with peptic ulcer.
Am. J. Gastroenterol. 77: 471-476
Lagerlof HO., Rudewald M-B., Perman G. (1960) : The neutralization
process in duodenum and its influence on gastric emptying in Man.
Acta Med. Scand. 168: 269-284
Lam S-K. (1984) : Pathogenesis and pathophysiology of duodenal ulcer.
Clin. Gastroenterol. 13: 447-472
Lam S-K. (1985) : Heterogenous origin of hyperacidity in duodenal
ulcer. In: Pepsinogens in Man: Clinical and genetic advances. Alan R.
Liss Inc. pp255-271
Lanas A., Alcalde J., Montoro M., Gomollon F., Bueno J., Sainz R.
(1985) : Role of gastrin in duodenal mechanisms of inhibition of
203

Lanas A., Montoro M., Gomollon F ., Lopez J ., Abos D., Sainz R.
(1985) : Infleuncia de la gastrina en la patogenesis del ulcus duodenal.
Rev. Esp. Enf erm. Apar. Dig. 68: 43-49
Lanas A., Morandeira JR., Abos M., Martinex T., Sainz R., Lozano R.
(1987) : The role of the vagus in the duodenal machanisms that inhibit
gastric acid secretion in dogs. Eur. Surg. Res. 19 Suppl 1: 55-56
Lawson HH. (1987) : The duodenal mucosa m health and in chronic
duodenal ulceration. S. Afr. Med. J. 72: 70
Levin E., Ki:rsner JB., Palmer WL. (1950) : The continuous twelve
hour nocturnal gastric secretion in normal individuals and in patients
with duodenal ulcer after a 24-hour fast. Gastroenterology 15: 454-457
Levine BA., Greenberg AG., Peskin GW., Saik RP. (1976) Antral
gastrin release. J. Surg. Res. 20: 509-514
Lucey MR. (1986) : Endogenous somatostatin and the gut. Gut 27: 457-
467
Lucey MR., Fairclough PD., Wass JAH., Kwasowski P., Medbank S.,
Webb J., Rees LH. (1984) : Response of circulating somatostatin,
insulin, gastrin and GIP to intraduodenal infusion of nutrients in
normal man. Clin. Endocrin. 21: 209-217
Lucey MR., Wass JAIL, Fairclough P., Webb j., Vi/ebb S., Medbank
S., Rees LH. (1985) : Autonomic regulation of post-prandtal plasma
somatostatin, gastrin and insulin. Gut 26: 683-688
204-

MacKay RS., Jacobson B. (1957) : Endoradiosonde. Nature 179: 1239-
1240
Malagelada J-R. (1977) : Paradoxical inhibition of gastric secretion
after meals in Zollinger-Ellison Syndrome. Gastroenterology 72: 1092
Malagelada J-R., Go VLW., Bailey J., Michener S. (1977)
Macromolecular hypergastrinaemia. Gastroenterology 72: 1092
Malagelada J-R. (1979) : Pathophysiology of duodenal ulcer. Scand. J.
Gastroenterol. 14 Suppl. 55: 39-48
Malagelada J-R., Longstreth GF., Deering TB., Summerskill WHJ.,
Go VLW. (1977) : Gastric secretion and empting after ordinary meals
in duodenal ulcer. Gastroenterology 73: 989-994
Malmstrom J., Stadil F., Rehfeld JF. (1976) : Gastrins in tissue.
Concentration and component pattern in gastric, duodenal, and jejunal
mucosa of normal subjects and patients with duodenal ulcer.
Gastroenterology 70: 697-703
Marcussen JM., Rygvold O. ( 1961) : Intragastric pH recording m
controlled series of double tests. Acta. Med. Scand. 169: 617-621
Maxwell JD., Ferguson A., Watson WC. (1971) : The effect of
gastric secretory status on jejunal pH measured by radiotelemetering.
Digestion 4: 345-352
205

Mayer G., Arnold R., Feurle G., Fuchs K., Ketterer H., Track NS.,
Creutzfeldt W. (1974) : Influence of feeding and sham feeding upon
serum gastrin and gastric acid in control subjects and duodenal ulcer
patients. Scand. J. Gastroenterol. 9: 703-710
McClendon JF. (1915a) : New hydrogen electrodes and rapid methods
of determining hydrogen ion concentrations. Am. J. Physiol. 38: 180-
185
McClendon JF. (1915b) : A direct reading potentiometer for measuring
hydrogen ion concentrations. Am. J. Physiol. 38: 186-190
McClendon JP. (1915c) : Acidity curves in the stomachs and duodenums
of adults and inf ants, plotted with the aid of improved methods of
measuring hydrogen ion concentration. Am. J. Physiol. 38: i91-199
McClendon JF., Bissell FS., Lowe ER. (1920) Hydrogen-ion
concentration of the contents of the small intestine. J .A.M.A. 75: 1638-
1641
McCloy, Vickery, Manjil TV., Baron JH. (1978) : A new method of
continuous 24 hour recording and analysis os simultaneous gastric and
duodenal intraluminal pH in Man. Br. J. Surg. 65: 819-820
McCloy Rit:.'., Vickery JC., Baron JH. (1980) : Long-term recording
and computer analysis of simultaneous gastric and duodenal pH under
normal conditions in man. Clin. Phys. Physiol. Meas. 1: 151-162
206

McCloy RF., Greenberg GR., Baron JH. (1984) Duodenal pH in
health and duodenal ulcer disease: effect of a meal, Coca-Cola,
smoking and Cimetidine. Gut 25: 386-392
McClure CW., Montague OC., Campbell LL. ( 1924) : The pH and
buffer values of duodenal contents derived from normal men. Arch.
Int. Med. 33: 525-532
McGuigan JE., Trudeau WL. (1973) : Differences in rates of gastrin
release in normal persons and patients with duodenal-ulcer disease. N.
Engl. J. Med. 288: 64-66
McLaughlin JC., Green WER., Buchanan KD. (1978) : Gastric emptying
of ingested acid and its effects on plasma gastrin and secretin m
duodenal ulcer patients. Scand. J. Gastroenterol. 13: 313-319
Meyer JH., Way LW., Grossman MI. (1970) : Pancreatic bicarbonate
response to various acids in the duodenum of dogs. Am. J. Physiol.
219: 964-970
Mitchell RD., Hunt JN., Grossman l\-IT. Inhibition of basal and
postprandial gastric secretion by poldine and atropine in patients \Vith
peptic ulcer. Gastroenterology 43: 400-406
Montoro M., Garcia FG., Samitier RS. (1985) : Gastrina y ulcera
duodenal. Rev. Esp. Enferm. Apar. Dig. 68: 273-281
Moore EW. (1968) : Determination of pH by the glass electrode: pH
meter calibration for gastric analysis. Gastroenterology 54: 501-507
207

Moore EW., Scarlata RW. (1965) : The determination of gastric
acidity by the glass electrode. Gastroenterology 49: 178-188
Moore JG., Wolfe M. (1973) : The reiation of plasma gastrin to the
circadian rhythm of gastric acid secretion in Man. Digestion 9: 97-105
Morton CB. (1929) : Observations on peptic ulcer. VI. Preliminary
report of clinical experiments with gastroduodenal analysis. Am. J.
Med. Sci. 177: 65-72
Morton CB. (1934) : Peptic ulcer. IX. Chronic lesions of the duodenum
following experimentally produced pyloric dysfunction. Arch. Surg. 28:
467-478
Myers FJ., McClendon JF. (1920) : Note on the hydrogen ion
concentration of the human duodenum. J. Biol. Chem. 41: 187-190
Nilsson G. (1979) : Some mechanisms with an iniliibitory effect on
gastric acid secretion. Scand. J. Gastroenterol. 14 Suppl 55: 39-48
Noller HG. (1960) : Clinical applications of telemetering techniques.
Proceedings of the 3rd International Conference on Medical
Electronics, Institution of Electrical Engineers, London: 111-114
Nyhus LM., Chapman ND., De Vito RV., Harkins HN. (1960) The
control of gastrin release. An experimental study illustrating a new
concept. Gastroenterology 39: 582-589
Okada S., Arai M. (1922) : The hydrogen ion concentration of the
intestinal contents. J. Biol. Chem. 51: 135-139
208

O'Shaughnessy DJ. (1982) : Somatostatin. In: Radioimmunoassay of gut
regulatory peptides. WB. Saunders, London; 138-145
O'Sullivan G., Harrison BJ., Bullingham RES. (1984) : The use of
radiotelemetry techniques for the in vivo assessment of antacids.
Anaesthesia 39: 987-995
Ovesen L., Bendtsen F ., Tage-J ensen U., Pedersen NT., Gram BR.,
Rune SJ. ( 1986) : Intraluminal pH in the stomach, duodenum and
proximal jejunum in normal subjects and patients with exocrine
pancreatic insufficiency. Gastroenterology 90: 958-962
Pelletier MJ., Chayvialle JAP., Minaire Y. (1978) : Uneven and
transient secretin release after a liquid test meal. Gastroenterology
75:1124-1132
Petersen H., Schrumpf E., Myren J. (1975) : Fasting serum gastrin
and basal gastric acid secretion. Scand. J. Gastroenterol. 10: 721-724
(203)
Pe Thein M., Schofield B. (1959) : Release of gastrin from the
pyloric ant rum following vagal stimulation by sham feeding in dogs. J.
Physiol. 148: 291-305
Poulsen J., Eisum A., Amdrup E. (1986) : The fasting and food
stimulated serum gastrin concentration in 43 patients with pre-pyloric-
pyloric ulcer compared to patients with duodenal ulcer and normals.
Scand. J. Gastroenterol. 21 Suppl. 120: 62
209
Reeder DD., Jackson BM., Ban ]., Clendinnen BG., Davidson WD.,
Thompson JC. (1970) : Influence of hypercalcaemia on gastric
secretion and serum gastrin concentrations in Man. Ann. Surg. 172:
540-546
Reichlin S. (1986) Somatastatin: Historical aspects. Scand. J.
Gastroenterol. 21 Suppl 119: 1-10
Rhodes J ., Apsimon HT., Lawrie JH. (1966) : pH of the contents of
the duodenal bulb in relation to duodenal ulcer. Gut 7: 502-508
Rhodes J., Goodall P., Apsimon HT. ( 1966)
gastroduodenal emptying. Gut 7: 515-520
Mechanics of
Rhodes J., Prestwich CJ. (1966) : Acidity at different sites in the
proxijal duodenum of normal subjects and patients with duodenal ulcer.
Gut 7: 509-514
Richards CV. (1929) : An improved duodenal tube. Its advantages, with
a brief outline of duodenal intubation. Arch. Int. Med. 44: 71-72
Richardson CT., Walsh JH., Hicks MI., Fordtran JS. (1976) : Studies
on the me~hanism of food-stimulated gastric acid secretion in normal
human subjects. J. Clin. Investig. 58: 623-631
Richardson CT., \Valsh JH., Cooper KA., Feldman M., Fordtran JS.
( 1977) : Studies on the role of cephalic-vagal stimulation in the acid
secretory response to eating in norm~l healthy subjects. J. Clin. Invest.
60: 435-441
210

Rosenkilde-Gram B., Amdrup E., Sorenson FH., Rune S. (1986) :
Effect of HSV on intraluminal pH in the stomach and duodenal bulb.
Scand. J. Gastroenterol. 21 Suppl 120: 60
Rotter JI. (1981) : Gastric and duodenal uicer are each many different
diseases. Dig. Dis. Sci. 26: 154-160
Rovelstad RA. (1956) : Continuously recorded in situ pH of gastric and
duodenal contents in patients with and without duodenal ulcers .
Gastroenterology 31: 530-537
Rovelstad RA., Maher FT. (1962) : Problems associated with
assessment of the effects of diet, antacids and an.ticholinergic agents
on gastric and duodenal acidity, as measured by the glass electrode in
situ. Gastroenterology 42: 588-594
Rovelstad RA., Owen CA., Magath TB. (1952) : Factors influencing
the continuous recording of in situ pH of gastric and duodenal
contents. Gastroenterology 20: 609-624
Rune SJ. (1968) An electrode for pH measurement in the
gastrointestinal tract. Scand. J. Gastroenterol. 3: 91-94
Rune SJ. (1972) : Acid-base parameters of duodenal contents in man.
Gastroenterology 62: 533-539
Rune SJ. (1973) : pH in the human duodenura. Its physiological and
pathophysiological significance. Digestion 8: 261-268
211

Rune SJ. (1981) : Problems associated with in situ measurement of
duodenal pH. In: Domschke \V., Wormsley KG. (Eds): Magen und
Magenkrankheiten, Stuttgart,New York , Georg Thieme Verlag pl50-
161
Rune SJ. (1982) : In vivo investigations by continuous measurements of
gastric and duodenal pH. Scand J. Gastroenterol. Suppl. 75: 48-49
Rune SJ., Viskum K. (1969) : Duodenal pH values in normal controls
and in patients with duodenal ulcer. Gut 10: 569-571
Russell RCG., Bloom SR., Davies WA., Polak JA., Reed PI. (1975) :
Hypergastrinaemia in a peptic ulcer patient with antral gastrin cell
hyperplasia. Br. Med. J. 4: 441
Sainz R., Lanas A., Martinez T ., Montoro M., Bueno J. (1985) :
Physiopathological heterogeneity of the duodenal mechanisms that inhibit
gastric acid secretion in duodenal ulcer patients. Am. J. Gastroenterol.
80: 673-677
Sainz Samitier R., Montoro M., Gomollon F., Loriente R., Abos D.,
LOpez J. (1987) : Mechanism of inhibition of gastric acid secretion
evoked by intraduodenal fat in duodenal ulcer patients. Eur. Surg. Res.
19 Suppl 1: 56
Sandvik A., Kaul BK., Waldrum H., Peterkin H. (1985) : Gastric acid
and pepsin secretion in response to modified sham f eedi,1g in active
and inactive duodenal ulcer disease. Scand. J. Gastroenterol. 20: 602-
606
2i2
Sandweiss DJ., Sugarman MH., Podolsky HM., Friedm ... n MHF. (1946)
: Nocturnal gastric seretion in duodenal ulcer. J .A.M.A. 130: 258-265
Schaffalitzky de Muckadell OB., Farenkrug J., Matzen P., Rune SJ.,
Warning H. (1979) : Physiological significance of secretin in the
pancreatic bicarbonate secretion. II: Pancreatic bicarbonate response to
a physiological increase in plasma secretin concentration. Scand. J.
Gastroenterol. 14: 85-90
Schwarz K. (1910) : Ueber penetrierende magen-und jejunalgeschwure.
Beitr. 2 Klin. Chir. 67: 96-128
Sekiguchi T ., Nishioka T ., Kogure M. et al (1985) : Difference of
interdigestive gastroduodenal motility and duodenal pH between duodenal
and gastric ulcer patients. J ap. J. Smooth Muscle Res. 21 Suppl: 113-
124
Shay H., Gershon-Cohen J., Fels SS. et al (1942) : A self regulatory
duodenal mechanism for gastric acid controi and an explanation for the
pathologic gastric physiology in uncomplicated duodenal ulcer. Am. J.
Dig. Dis. 9:124-128
Shiratori K., \Vatanabe S., Maruyama M., Kurokawa K., Takeuchi T.
(1983) : 24-hour intragastric pH with two regimens of cimetidine
therapy in patients with duodenal ulcer. Gastroenterology 84: 1308
Stack BHR. (1969) : Use of the Heidelberg pH capsule in the routine
assessment of gastric acid secretion. Gut 10: 245-246
213

Stadil F. (1974) : Gastrin and insulin hypoglycaemia. Scand. J. Gastroenterol. 9 Suppl 23: 1-49
Stadil F., Rehfeld JF. (1971) : Radioimmunoassay of gastrin in human
serum. Scand. J. Gastroenterol. Suppl 9: 61-65
Stadil F ., Rehfeld JF ., Christiansen LA., Malmstrom J. (1975) :
Patterns of gastric components in serum during feeding in normal
subjects and duodenal ulcer patients. Scand. J. Gastroenterol. 10: 863-
868
Steen J., Berning M., Christiansen PM., Rehfeld JF. (1980) :
Relationship between basal serum gastrin concentrations and gastric
acid secretion in peptic ulcer disease. Scand. J. Gastroenterol. 15:
949-952
Stenquist B., Knutson U., Olbe L. (1978) : Gastric acid responses to
adequate and modified sham feeding and to insulin hypoglycaemia m
duodenal ulcer patients. Scand. J. Gastroenterol. 13: 357-362
Stenquist B., Rehfeld JF ., Olbe L. (1979) : Effect of proximal gastric
vagotomy and anticholinergics on the acid and gastrin responses to
sham feeding in duodenal ulcer patients. Gut 20: 1020-1027
Stern DH., Walsh JH. (1973) : Gastrin release in postoperative ulcer
patients: evidence for release of duodenal gastrin. Gastroenterology 64: ·::u:, ~ ~t.O .JV..J-- .JV./
214

Thompson JC., Reeder DD., Bunchman HH., Becker HD., Brandt EN.
(1972) : Effect of secretin on circulating gastrin. Ann. Surg. 176:
384-393
Tomenius J., Williams G. (1960) : Continuously recorded pH of
gastric and duodenal contents in situ with an evaluation of the efficacy
of some antacids in vivo. Acta. Med. Scand. 166: 25-34
Trudeau WL., McGuigan JE. (1971) : Relations between serum gastrin
levels and rates of gastric hydrochloric acid secretion. N. Engl. J.
Med. 284: 408-412
Uvnas B. (1971) : Role of duodenum in inhibition of gastric acid
secretion. Scand. J. Gastroenterol. 6: 113-125
Walsh JH. (1977) : Role of gastrin in normal and abnormal gastric
acid secretion. Rendic. Gastroenterol. 9: 61
,v alsh JH. (1979) : Pathogenetic role of the gastrins. In: Gastrins and
the vagus: Rehfeld JF ., Amdrup E. Eds.; Academic press; London, New
York; 181-198
\Valsh JH., Grossman MI. (1975a) Gastrin (First of two parts). N.
Engl. J. Med. 292: 1324-1334
Walsh JH., Grossman MI. (1975b) Gastrin (Second of two parts).
N. Engl. J. Med. 292: 1377-1384
215

Walsh JH., Richardson CT., Fordtran JS. (1975) : pH dependence of
acid secretion and gastrin release in normal subjects. J. Clin. Invest.
55: 462-468
Walt R. (1986) : Twenty four hour intragastric acidity analysis for
the future. Gut 27: 1-9
Walt RP., Gomes M., Wood EC., Logan LH., Pounder RE. (1983) :
Effect of daily oral omerprazole on 24 hour intragastric acidity. Br.
Med. J. 287: 12-14
Walt RP., Male P-J., Rawlings J., Hunt RH., Milton-Thompson GJ.,
Misiewicz JJ. (1981) : Comparison of the effects of ranitidine,
cimetidine and placebo on the 24 hour intragastric acidity and nocturnal
acid secretion in patients with duodenal ulcer. Gut 22: 49-54
\-Yard AS., Bloom SR. ( 197 4) : The role of secretin in the inhibition
of gastric secretion by intraduodenal acid. Gut 15: 889-897
\Yard AS., Bloom SR. (1975) : Effect of vagotomy on secretin release
in Man. Gut 16: 951-956
Watson BW. (1981) Clinical uses of radio pills. Br. J. Hosp. Med.
25: 618-624
·watson WC., Paton E. (1965)
radiotelemetering. Gut 6: 606-612
Studies on intestinal pH by
Winkelstein A. (1935) : One hundred and sixty-nine studies in gastric
secretion during the night. Am. J. Dig. Dis. 1: 778-782
21 6

·wolfe MM., Reel GM., McGuigan JE. (1983) : Inhibition of gastrin
release by secretin is mediated by somatostatin in cultured rat antral
mucosa. J. Clin. Invest. 72: 1586-1593
Woodward ER., Lyon ES., Landor J ., Dragstedt LR. (1954) : The
physiology of the gastric antrum. Experimental studies on isolated
antrum pouches in dogs. Gastroenterology 27: 766-785
Wormsley KG. (1970) : Response to duodenal acidification in man. III
Comparison with the effect of secretin and pancreozymin. Scand. J.
Gastroenterol. 5: 353-360
\Vormsley KG. (i971) : Reactions to acid in the intestine in health and
disease. Gut 12: 67-84
\Vormsley KG. (1972) : Response to duodenal acidification in man. IV
Effect on gastric emptying. Scand. J. Gastroenterol. 7: 631-637
Wormsley KG. (1974) The pathophysiology of duodenal ulceration.
Gut 15: 59-81
Wormsley KG. (1979) : Duodenal ulcer, vol. 2. Montreal: Eden Press,
& Edinburgh: Churchill-Livingstone 55-73
Wormsley KG. (1980) : Association between duodenal uicer and other
diseases. Scand. J. Gastroenterol. 15 Supp162:27-35
\Vormsley KG. (1983) : Duodenal ulcer: does pathophysiology equal
aetiology? Gut 24: 775-780
217

Wormsley KG., Grossman MI. (1964): Inhibition of gastric acid
secretion by secretin and by endogenous acid in the duodenum.
Gastroenterology 47: 72-81
Wormsley KG., Grossman MI. (1965) : Ma'{imal histalog test in
control subjects and patients with peptic ulcer. Gut 6: 427-435
\Vormsley KG., Mahoney MP. (1967) : Acid and bicarbonate secretion
in health and disease. Lancet i: 657-658
Yalow RS., }3erson SA. (1970) : Size and charge distinctions between
endogenous human plasma gastrin in peripheral blood and
heptadecapeptide gastrins. Gastroenterology 58: 609-615