durham e-theses mathematical model of a pulsating combustor
TRANSCRIPT

Durham E-Theses
Mathematical model of a pulsating combustor
Craigen, J. G.
How to cite:
Craigen, J. G. (1975) Mathematical model of a pulsating combustor, Durham theses, Durham University.Available at Durham E-Theses Online: http://etheses.dur.ac.uk/8200/
Use policy
The full-text may be used and/or reproduced, and given to third parties in any format or medium, without prior permission orcharge, for personal research or study, educational, or not-for-pro�t purposes provided that:
• a full bibliographic reference is made to the original source
• a link is made to the metadata record in Durham E-Theses
• the full-text is not changed in any way
The full-text must not be sold in any format or medium without the formal permission of the copyright holders.
Please consult the full Durham E-Theses policy for further details.
Academic Support O�ce, Durham University, University O�ce, Old Elvet, Durham DH1 3HPe-mail: [email protected] Tel: +44 0191 334 6107
http://etheses.dur.ac.uk
M A T H EM A T I G A L M O D E L
O F A
P U L S A T I N G 0 0 K B U S T 0 R
B Y
J.G.Craigen B.Sc.
Thesis submitted for the degree of Doctor of Philosopli^- i n the University of Durham
Department of Engineering Science The University Durham April 1975

A B S T R A C T
A pulsating combustor producing longitudinal acoustic o s c i l l a t i o n s was constructed and a mathematical model of the system developed. The combustor was a closed - open tube, combustion taking place at the closed end into which were fed a i r and propane. The two lowest modes of longitudinal, acoustic vibration were obtained. The fundamental occurring at low fuel flowrate up to a maximum flowrate corresponding to an energy • input of 12Kw, at which either the fundamental or f i r s t harmonic occurred and above which only the f i r s t haraonic was obtained up to the maximum flowrate of the system corresponding to an energy input of 20 Kw.
The a n a l y s i s of the system used the conservation equations of mass,
momentum and energy from these suitably formed equations could be derived
which were solved by the method of c h a r a c t e r i s t i c s . The combustion model
was governed by a simple overall-reaction rate equation. Plug flow was
assumed with perfect r a d i a l mixing and no a x i a l mixing, conduction or
diffusion . The convective heat transfer coefficients were evaluated by
means of the quasi-steady-state theory.
The mathematical model predicted the gas temperature gradient and
the d i s t r i b u t i o n of pressure and vel o c i t y standing waves. Owing to the
use of a much si m p l i f i e d combustion model, i t was not possible to predict
the acoustic energy required to determine the amplitude and frequency of
o s c i l l a t i o n . The amplitude was found to be highly dependent on the fuel
i n j e c t i o n system, Air/Fuel r a t i o and mode of o s c i l l a t i o n .
The p r a c t i c a l r e s u l t s confirmed the higher rates of heat transfer
associated with pulsating flow.
I would l i k e to acknowledge the guida,nce and encouragement
given "by my supervisor, 3)r, P.H. Clarke, throughout t h i s investigation.
Thanks are due. also to I ^ . «Sam' Eeale and Dr, S^L, Hirst
for many long discussions.
I wish to thank the technical s t a f f of the Department of
Engineering Science, e s p e c i a l l y Px, L. Pleet, for his assistance with
the experimental work.
I would l i k e to thank Anne Sowerhy for typing the t h e s i s .
I am indebted to Union Carbide Limited for providing the
f i n a n c i a l support for the ^research.

TABLE eg COm'EI^'S T i t l e Page
Abstract
Acknowledgements
Table of Contents
Nomenclature
Chapter Number
Introduction
Previous Work 2.1 H i s t o r i c a l Background of Pulsating
Combustion 2.2 Ana l y t i c a l Approaches 2.5 Numerical Solution of the Equations
Theory 5«1 Fundamental D i f f e r e n t i a l Equations 3.2 Basic P r i n c i p l e of Method of Characteristics
5•2.1 Characteristic Equations 3.2.2 Determination of ^
5.3 Combustion Model 3«4 Boundary Conditions 3'5 Operating Frequency 3 N u m e r i c a l Solution
3*6•! Numerical Solution i n the Heat Transfer Section
3«6»2.Calculating Ca at a central g r i d point in the combustion section
3«7 Computer Program
Experimental Method 4.1 Experimental Apparatus 4.2 A i r Supply 4.3 21'uel Supply 4.4 Fuel I n j e c t i o n System 4.5 Cooling ViTater Flowrate 4«6 Pressure Measurement 4«7 Wall Temperature Measurements 4•8 Time-independent gas temperature measurements 4.9 Silencing Chamber 4.10 Experimental Procedure 4.11 E r r o r Analysis
Page Number
1
6
11
13
16 16 21 21 25 26 28
35
38
40 40 40 42 43 43 43 46 47 48 48 50
Chapter Number
Results and Discussion
5.1 The Oombustors Characteristics 5.2 Test Results 5.3 Non-pulsating conditions 5.4 Pulsating Conditions 5e5 Frequency Measurements 5.<> l^ine-independent Axial Gas Temperature
measurements i n the combustion chamber
Conclusion
Reference s
Page Number
52 56 56 57. . 57 58
99
101
Appendices
I '• e determination of step length AX 107
Measurement of High Gas Temperatures 115

NOMENCLATURE
Symbol.
A As c c
Ca
r
N h K
L
U
m
M n
N Nu
A
p.
ft
Cross-sectional, area of combustor
Surface area
Velocity of sound
Time^independent v e l o c i t y of.- sound
Speed of sound after isentropic change of state to reference pressure
Mass fuel concentration/unit volume
Spe c i f i c heat at constant pressure
Diameter of thermocouple wire
Diameter of combustor
Activation energy-
Frequency of acoustic o s c i l l a t i o n
C a l o r i f i c value of propane
Heat transfer c o e f f i c i e n t
Frequency factor
Thermal conductivity
Length of combustor
Acoustic length
Mixture mass flowrate
Propane flowrate
Rate of change of sound for l i n e a r variation
Integer n=1,2,3
Velocity of sound at X=0
Nusselt number
Pressure
Pressure amplitude
Pressure amplitude X=0
Atmospheric pressure
Prandtl Number
Energy transfer/unit mass/unit time
Units
m2
.m2
m/s
m/s
m/s
Kg/n?
KJ/Kg K
m
ffi
KJ/Kg-mol
1/S
KW/H?K
KW/mK
m
m
Kg/S
Fm?/h
1/S
m/s
1
N/n^
N/ir?
N/ra2
N/n^
1
KW/Kg

Symbol a Ener^vy transfer/Unit time
Units Kw
R Gas constant Kj/KgK. Re E l e c t r i c a l r e s i s t i v i t y ohm-cm Rn Reynolds Number 1
Universal gas constant Kj/r{g-mol K > Inner radius of combustor m
Reaction rate Kg/m^S S Specific entropy KJ/KgIC t Time S
Period of o s c i l l a t i o n S T X
Gas temperature , K *\ •
T Gas temperature amplitude K "a Time-independent a x i a l gas temperature K
Time-independent wall temperature K
Time-independent mean gas temperature K u P a r t i c l e v e l o c i t y m/s u P a r t i c l e v e l o c i t y amplitude IH/S
w Angular frequency 1/s
XCH Kass f r a c t i o n of propane 1
x o a llass f r a c t i o n of oxygen 1 X Co-ordinate direction m
Ratio of s p e c i f i c heats 1 6 Flame emissivity 1 .
Effectiveness of the heat exchanger 1 e Puel to a i r r a t i o 1 X Wavelength m
Dynamic V i s c o s i t y Kg/ms e Density Kg/m e
Density at atmospheric pressure Kg/m
Stefan-Boltzmann constajit j/m^S K ^

CHAPTKii 1
1.0 Introduction

• 1 1«Q Introduction > .
Rayleigh (^S ) was the f i r s t to advance a hypothesis
regarding the driving of o s c i l l a t i o n s by a periodic heat release
i n d gaseous medium,. This hypothesis states that for a heat-
driven o s c i l l a t i o n to occur, there must be a varying rate of
heat release having a component i n phase with the varying component
of the pressure. Although the v a l i d i t y of t h i s hypothesis has
been questioned where large pressure amplitude and energy inputs
are involved, i t serves well as an i n i t i a l c r i t e r i o n of whether
or not o s c i l l a t i o n s w i l l occur. Putinan ( 5 ) has suggested the
following mathematical formulation of the above c r i t e r i o n
O 1 F> h > o
where 9 i s the instantaneous heat release rate, P the o s c i l l a t i n g
component of the pressure and "fc the time.
The treatment of flames i n enclosures has received a
great deal of attention under the general heading of combustion
i n s t a b i l i t y . I n t h e i r review of i n s t a b i l i t y phenomena Barrere and
Williams (^4-) defined the three main forms of i n s t a b i l i t y , these "
have been summarised as ;
1) I n s t a b i l i t i e s that are s p e c i f i c to the geometry and
acoustic character of the combustion chamber, (combustion chamber
i n s t a b i l i t y ) ,
2) I n s t a b i l i t i e s involving interaction of the dynamics of
the combustion process 8.nd the components of the system, (system
i n s t a b i l i t y ) .
5) I n s t a b i l i t y involving only the reactants ( i n t r i n s i c
i n s t a b i l i t y ) ,
mm )
An increasing i n t e r e s t i s being shown i n pr a c t i c a l
applications of combustion driven acoustic o s c i l l a t i o n s mainly
due to the higher combustion inte n s i t y and heat transfer rates
associated with such a process, leading to the p o s s i b i l i t y of
constructing compact, high e f f i c i e n c y combustion units.
Combustion driven acoustio o s c i l l a t i o n s can be
c l a s s i f i e d into three basic types :
a) Longitudinal
The gases move back and forth along the axis of the
chamber (referred to as organ-pipe j o s c i l l a t i o n s ) .
b) Radial
The gases o s c i l l a t e between the axis of the tWdmWer ty.r\A the ujowW.
c) Tangential
The gases, o s c i l l a t e around the perimeter of the
chamber.
I n addition combined modes are possible.
This investigation i s only concerned with the longitudinal
type. Such o s c i l l a t i o n s are produced i f the combustion i s designed
so that a periodic heat release i s obtained at a point corresponding
to a pressure antinode. I f t h i s varying heat release i s in phase
with the pressure o s c i l l a t i o n the pressure amplitude, can be driven
to high values (The Rayleigh C r i t e r i o n ) . ' he frequency of
o s c i l l a t i o n being related to the length of the combustor and the
vel o c i t y of sound i n the combustion gases. ^he aim of t h i s
investigation was to construct such a corabustor as shomi i n Figure
( M ) and to develop a mathematical model of the system.
The combustor was of the organ - pipe type with the i n l e t
end acoustically closed and the outlet end f u l l y open. Combustion
taking place at the closed end where a i r and propane were fed.
Such an acoustic system i f fed with a broadband noise, i n t h i s
case the flame, can select and amplify certain narrov/ frequency
bands characterised by various acoustic modes of the system.
As acoustic modes can couple with and be driven by a varying heat
release rate from the flame, the condition having to s a t i s f y the
Rayleigh c r i t e r i o n . The varying heat release rate can be affe cted
by many factors such as, a regular variation of pressure, changing
i n mixing pattern or vortex shedding from a fla.me holder^ A
more detailed discussion of such mechanisms being given i n
references (^^-^T).

0
Ul .J u
4
to
U
ISC h
ce Ul a:
in
to
/a o
ut
X o
o h y to
t o to m
O
G:
O la
CHAFi'ER 2
Previous Work
2.1 H i s t o r i c a l JSackground of Pulsating Combustion
2.2 Analytical Approaches
2.3 Numerical Solution of the Equations
2.0 Previous '«Vork
There has been a vast amount of experimental work on
pulse combustion. However, theoretical studies except of the
most rudimentary kind are l a r g e l y lacking. The reason i s
mainly due to the working complexity of such combustors
which v/hen combined with the unknowns cause the mathematics to
become formidable.
2.1 H i s t o r i c a l Ba^ckgyound of Pulsating Combustion
The f i r s t reported work on" combustion-driven o s c i l l a t i o n s
was made by Byron Higgins i n 1777> when he enclosed a hydrogen
diffusion flame i n a large tube open at both ends. He found
o s c i l l a t i o n s occurred f o r c e r t a i n lengths of the fuel supply.
No major work i n the f i e l d , though, was carried out u n t i l the
beginning Of the 20th centuiry and t h i s work i s recorded i n a
number of German, Swiss and French patents dating from 1900 to
1910. General i n t e r e s t appears to have been lacking and the
study of pulse combustion again drifted into oblivion u n t i l
1930, when Schmidt i n Germany and Reynst i n Germany and France
revived the phenomenon of pulsating combustion and i t s p r a c t i c a l
apj)lications. From these basic ideas, designs have been
produced for the use of pulsating combustbrs i n aeronautical
engines, domestic heating and grain dryers. The f i e l d has
been reviewed recently by Putraan ( l ) and Beale (2) with s p e c i f i c
applications being dealt with i n references (3 - 6 ) ,
2•2, Analytical Approaches
I t i s convenientj; to divide the analysis into two main
areas •-
2,2,1 '-ghe Gas Dynamics of the System
The physcial laws v/hich primarily govern the process
i n question are those of mass, momentum and energy conservation,
these, when coupled with the relations describing the
thermodynamic properties of the gas form a set of quasi-linear
hyperbolic p a r t i a l d i f f e r e n t i a l equations. This type of
equation i s obtained whenever the problem i s associated with
wave propagation and so has received considerable attention.
I f i t i s assumed that the flow i s a steady one with
small perturbations superimposed then the equations become
l i n e a r . The solution of the l i n e a r equations has been highly
developed i n the study of the theory of sound. As the
equation i s l i n e a r , the complete solution of a problem may
be obtained by superimposing the- solutions of a number of
simple cases, thus the actual pressure var i a t i o n may be
expressed as a f o u r i e r s e r i e r and the p a r t i a l solutions for
each term superimposed. Much of the development of t h i s
theory was due to Rayieigh (25) whose text book i s s t i l l a
standeird work on the subject. Put man (5) and Raushenbakh (6)
having applied t h i s method to pulsating combustion problems.
The fundamental problem of f i n i t e waves followed the
e a r l y development oft^ie theory of sound. Poisson and Eamshaw
f i r s t extended the theory of sound to the case of f i n i t e aunptitude
disturbances propagating i n one direction. Riemahn introduced
the method of c h a r a c t e r i s t i c s by presenting the theory i n a
form suitable for c a l c u l a t i n g the propagation of waves of f i n i t e
amplitude proceeding i n both directions.
During World War 11 a considerable impetus was given
to t h i s subject from two sources. F i r s t , there was considerable
i n t e r e s t i n explosions and t h e i r resultant pressure waves,
V/artime research i n t h i ^ direction by the group working with
Courant and F r i e d r i c h s has been summarised i n t h e i r book ( 7 ) .
This work contains a general mathematical treatment of the
method of c h a r a c t e r i s t i c s but a good text with emphasis on a
v a r i e t y of engineering systems i s given by Abbott ( 8 ) ,
A second source of in t e r e s t in waves of f i n i t e
amplitude was the wairbime German development of the Schmidt
tube which v/as developed to power the Yl f l y i n g bomb.
For t h i s purpose the method of c h a r a c t e r i s t i c s was developed
using numerical integration. This method having been
developed and applied to one-dimensional nonsteady flow
problems by many workers (7 - l 6 ) and i s the basis of the
method employed by t h i s investigation.
8
An alternative approach to the pro^blem i s t o use a
f i n i t e difference method "based on the fundamental hyperbolic
equations. Methods of t h i s type have been known since the
work of Gourant and Friedrichs hut seems to have been neglected
u n t i l the development of the d i g i t a l computer. . The main
obje ction to t h i s approach being the appearance of
unrea l i s t i c features i n the solution of the equations such as .
improbable peaks i n pressure p r o f i l e s and sometimes the f l u i d
v e l o c i t y being given the wrong sign.
2.2.2 General Aspects of the Combustion
The priraa2:y problem i n modelling any practical
combustion system i s to simultaneously account f o r mixing and
chemical reaction. At present, no accurate formulation
considering both exists, but thi:ee major theories are at
present being developed. One method employs the calculations
of turbulent flame speed based on the turbulent param.eters of
the flow and the chemical reaction rate introduced by the use
of the la,rainar flame speed. A second approach uses a microvolume
burning concept by i d e n t i f y i n g eddies of size and l i f e t i m e
dependent on the turbulence parameters, these eddies are
assumed to bum either from the surface at the laminar flame
speed or homogenously throughout the volume, but perhaps the
most suitable approach f o r t h i s investigation i s based upon
reaction rate theory and i s the method adopted. This method
assumes the turbulence l e v e l t o be so high that mixing i s
instantaneous, thus the mixing rate i s so fast compared t o
the reaction rate that mixing can be neglected and the
performance can be determined by reaction rate alone.
The combustion model assumes a plug flow reactor which i s a
continuous series of i n f i n i t e s i m a l l y s t i r r e d reactors through
which the flow passes. A more comprehensive review of the
ahove techniques i s given i n reference ( l ? ) .
Early workers i n t h i s f i e l d (18) attempted a reaction
rate equation "based upon a single step. '-he application
of computer techniques has f a c i l i t a t e d the treatment of
multistep' reactions and recently (17) a nine-step mechanism
has been treated. For the present investigation a simple
one-step model i s proposed since there i s s t i l l i n s u f f i c i e n t
knowledge t o be able t o propound a proven Kinetic. scheme,
The investigation assumes heat transfer i n the
combustion section to be mainly by convection and radiation, and
i n the heat transfer section by convection alone.
kt the present time, no complete analytical solution
of predicting conve c t i v e heat transfer coefficients i n un
steady turbulent flow e x i s t s . However, a simple semi-
empirical approach, the quasi-steady state theory, has been
used by several workers (19 - 21) to describe the effe cts on
heat transfer rates. This treatment i s based on the
assumption that the heat transfer coefficient at any instant
can be calculated from the instantaneous value of the velocity
by means of the appropriate steady state relationship.
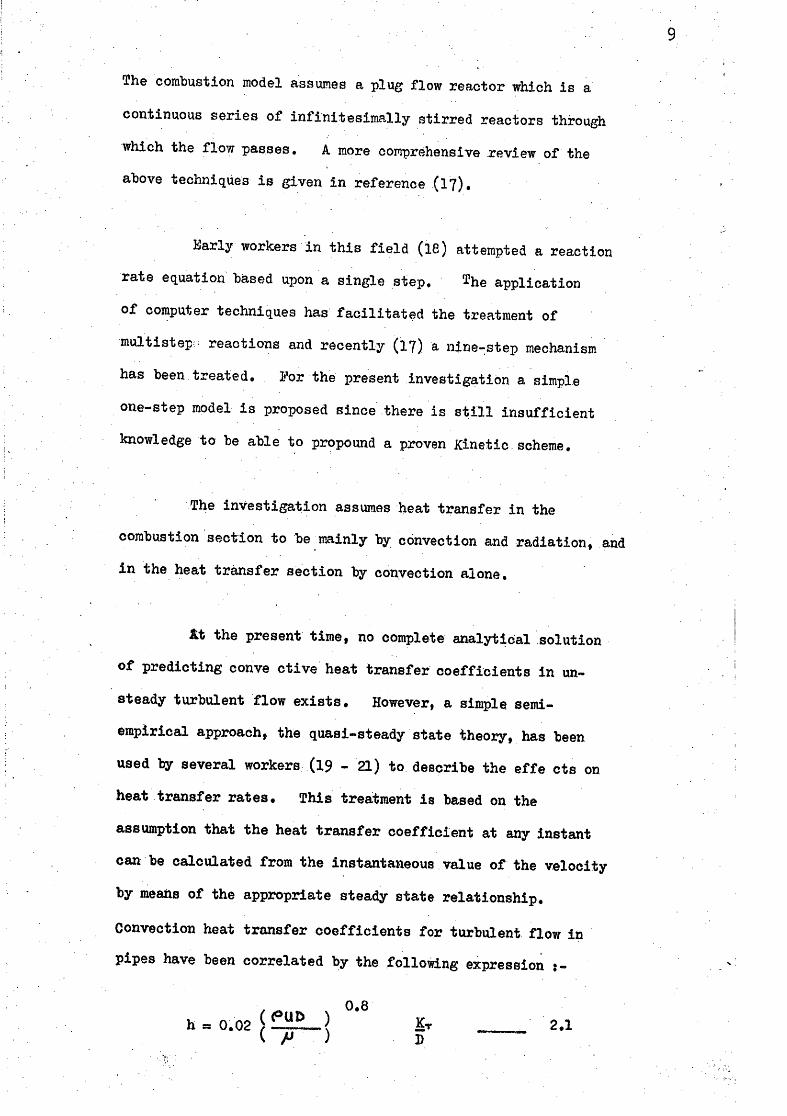
Convection heat transfer coefficients f o r turbulent flow i n
pipes have been correlated by the follovdng expression
10
The main f a u l t i n such an analysis i s due to the thermal capacity
of the f l u i d causing a phase l a g between d r i v i n g temperatures
difference and r e s u l t i n g f l u x at the surface which has been
observed experimentally by Overbye., who noted that temperature
difference and transfer rate did not pass through zero
simultaneously as reported by A^nand. (20).
The workers who have used t h i s analysis have shown
the method to be adequate and have achieved good correlation
between predicted and experimental values .
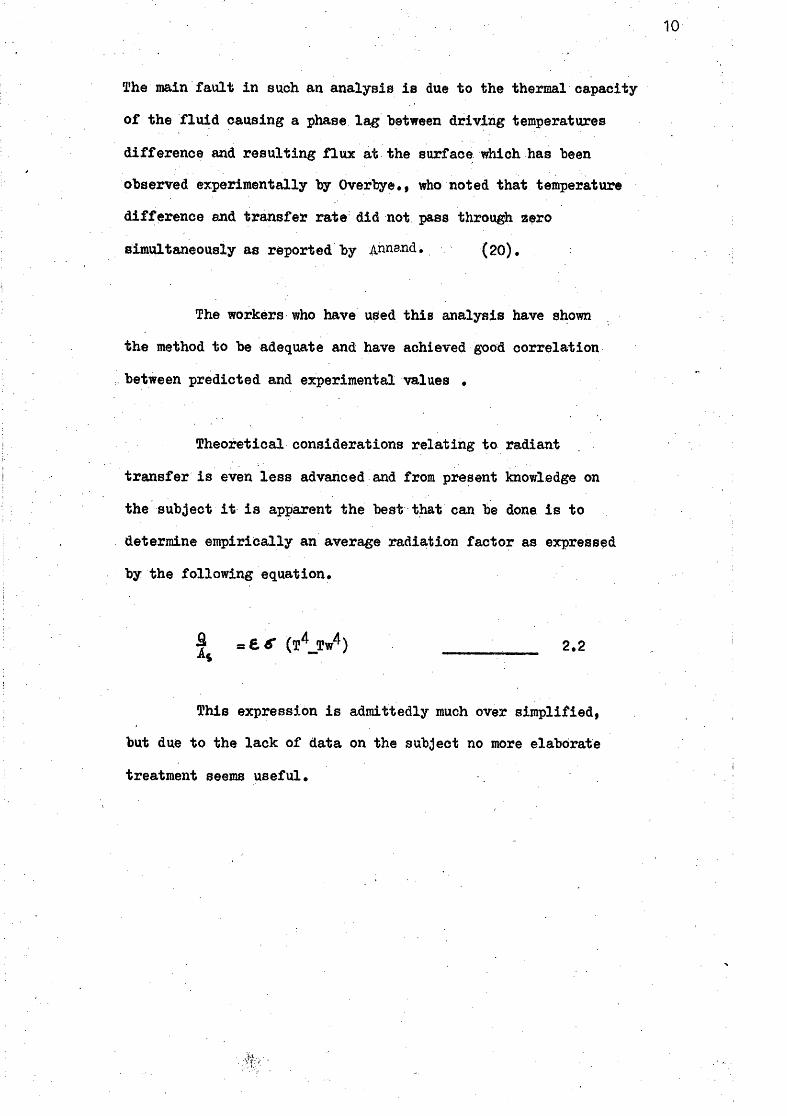
Theoretical considerations r e l a t i n g t o radiant
transfer i s even less advanced and from present knowledge on
the subject i t i s apparent the best that can be done i s to
determine empirically an average radiation factor as expressed
by the following equation.
f = 6 5- (T'^JPw^) _ _ _ _ 2.2
This expression i s admittedly much over simplified,
but due t o the lack of data on the subject no more elaborate
treatment seems useful.
11
2.3 Numerical Solution of the Equations
Numerical procedures f o r solving the hyperbolic
equations of unsteady compressible flow are of two basic kinds
characteristic methods and fi x e d - g r i d or f i n i t e - d i f f e r e n c e
methods.
The method of characteristics focuses attention on
the fact that, i n processes governed by hyperbolic equations,
disturbances to the f l u i d are transmitted only i n discrete
d i r e c t i o n s . These directions form a network of l i n e s ,
known as characteristics which cover the domain of integration.
For unsteady one-dimensional flow, they comprise three sets of
li n e s on the dista.nce - time plane , the lines of a particular
set do not intersect, but the lines of one set intersect the
li n e s of another. \ hen the flow i s isentropic, i t i s
necessary to consider only two of the sets of characteristics
as the t h i r d set i s made redundant.
The main objection t o characteristic methods i s that
the locations of intersections of the characteristics often
f a i l to correspond with those at vMch boundary condition
information i s available or flow predictions are required.
With f i x e d - g r i d methods the great advantage i s
tha t t h e i r g r i d points are predetermined. When the grid
has been chosen, a set of algebraic equations are formed which connect the values of theftow variables f o r a
12
p a r t i c u l a r g r i d point w i t h the values f o r neighbouring points
on the distance time plane . These are the f i n i t e difference
equations. However, when they are applied to the
prediction of flow phenomena, unrealistic features sometimes
appear i n the solutions, thus, improbable peaks may appear i n
the pressure p r o f i l e s and sometimes the f l u i d v e l o c i t y may be
given the wrong sign. Numerous ways have been t r i e d t o
eliminate t h i s behaviour, but none are e n t i r e l y free from
undesirable features. So i t seems that the characteristics
form the only natural co-ordinate set f o r the equations, and
also f i x e d - g r i d systems tend to lose some of the information
tha t the characteristics convey, and to replace i t with
spurious information of t h e i r own.
^he method which forms the basis of the present
investigation i s basically the one suggested by Hartree (22)
and developed by Benson ( l O ) , t h i s method combines the
best features of both the characteristics and fixed - g r i d
methods, f o r i t uses a f i x e d g r i d , but the relations between
the dependent variables at adjacent grid points are f i r m l y
based on the information that i s conveyed only along the
di r e c t i o n of the characteristics.

CHjlPPER 3
Theory
3*1 Fundamental D i f f e r e n t i a l Equations
3«2 Basic Principle of Method of Characteristics 3*2.1 Characteristics Equations 3.2.2 Determination of ^
3»3 Combustion Model
3*4 Bounda.ry Conditions
3»5 Operating Frequency
5*6 Numerical Solution 3. .1 Numerical Solution i n the heat transfer section 3*6.2 Calculating Ca at a central grid point
i n the combustion section
3»7 Computer Program
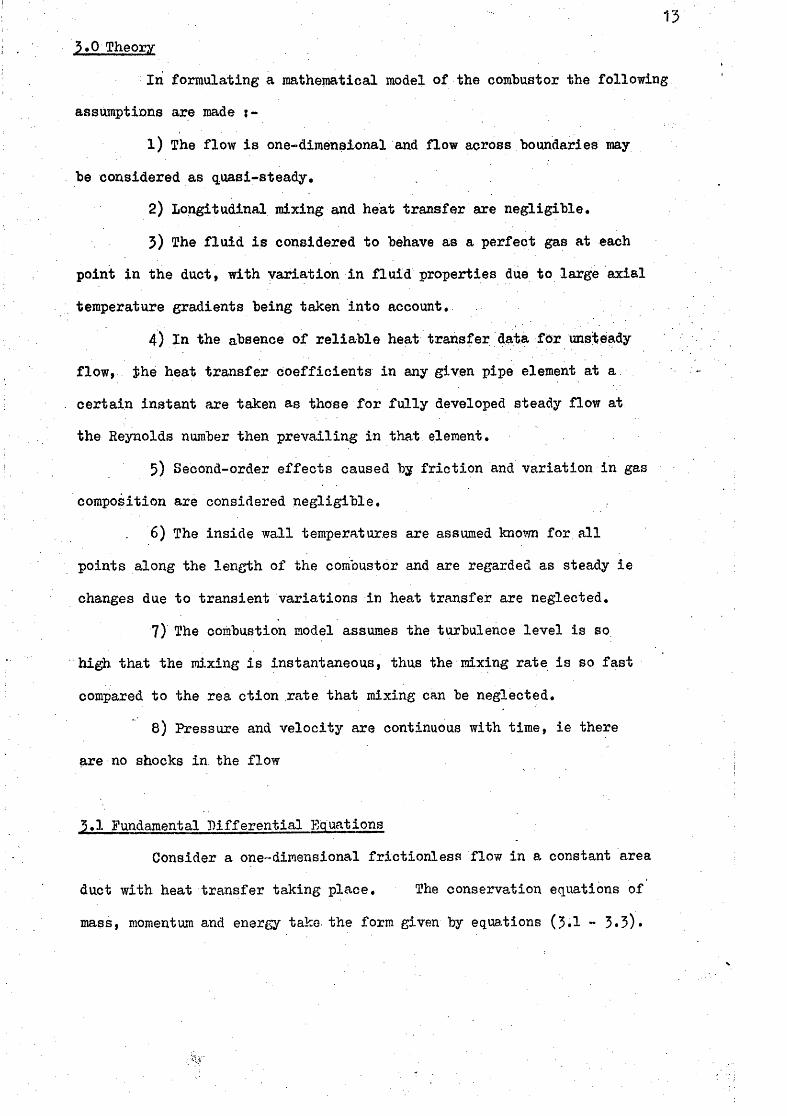
15 3*0 Theory
I n formulating a mathematical model of the combustor the following
assumptions are made :-
1) The flow i s one-dimensional and flow across boundaries may
be considered as quasi-steady,
2) Longitudinal mixing and heat transfer are negligible.
5) Tile f l u i d i s considered to behave as a perfect gas at each
point i n the duct, with v a r i a t i o n i n f l u i d properties due to large axial
temperature gradients being taken i n t o account.
4) I n the absence of r e l i a b l e heat transfer data f b r unsteady
flow, Jhe heat transfer c o e f f i c i e n t s i n any given pipe element at a
certain instant are taken as those f o r f u l l y developed steady flow at
the Reynolds number then prevailing i n that element.
5) Second-order effects caused by f r i c t i o n and variation i n gas
composition are considered n e g l i g i b l e ,
6) The inside wall temperatures are assumed known for a l l
points along the length of the combustor and are regarded as steady i e
changes due t o transient variations i n heat transfer are neglected.
7) The combustion model assumes the turbulence level i s so
high that the mixing i s instantaneous, thus the mixing rate i s so fast
compared to the rea c t i o n rate that mixing can be neglected.
8) Pressure and vel o c i t y are continuous with time, ie there
are no shocks in. the flow
3,1 Fundamental D i f f e r e n t i a l Equations
Consider a one-dimensional f r i c t i o n l e s s flow i n a constant area
duct v;ith heat transfer taking place. The conservation equations of
mass, momentum and energy take, the form given by equations (3.1 ~ 3*3) •
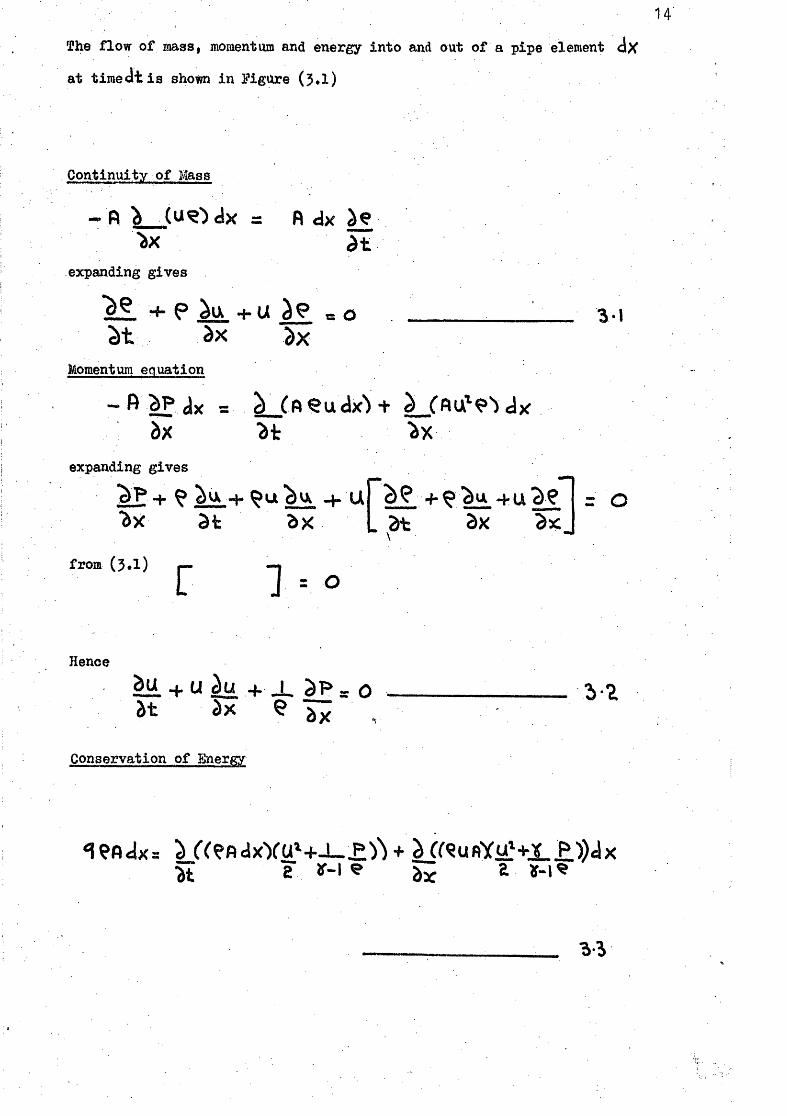
14
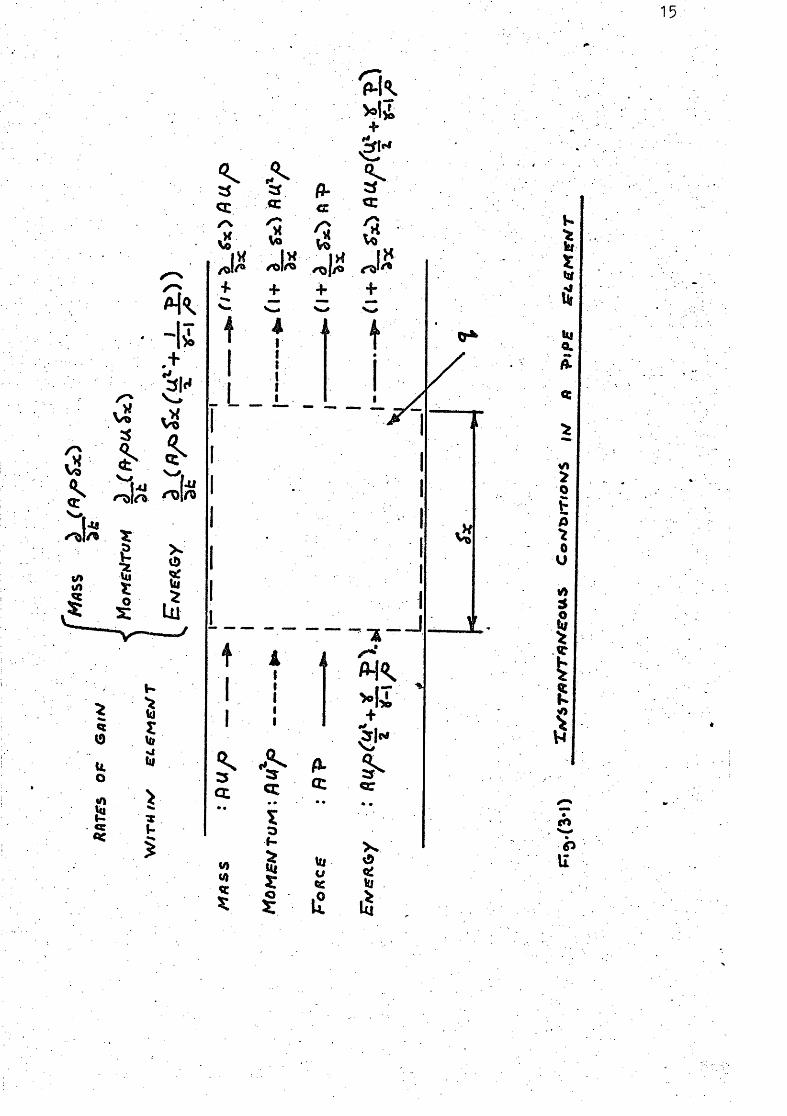
The flow of mass, momentum and energy i n t o and out of a pipe element dx
at t i r a e d t i s shown i n Figure (5«1)
Continuity of I t o s
expanding gives
Momentum equation
expanding gives
"bx at hx L at ax
3-1
= o
from (3.1) r 1 = 0
Hence
= o 5 •a
Conservation of Snergy
15
I
9
O
AC
Via
l2
Ul
I -
CC
1 I2f
I
5: 5:
_ J
Ul
VI
0 u
t

16
3*2 jjasic Principle of Ivlethod of Characteristics
An analytical solution of equations (3*1 - 3*3) being impossible,
a step by step integration i s adopted, the solution thus comprising P, U
and C, Given the values of P. U and C at a certain i n i t i a l time, the task i s
to f i n d t h e i r values at a l l locations at any l a t e r time. The integration
procedure depends on the existence at each point i n the Xj-t plane of three
(chara c t e r i s t i c ) directions ( i b / J x ) , I f i n any of these directions,
a small step i s taken with r e s u l t i n g increments ciP,^U and d c ,
then the p a r t i a l equations (3*1 - 3*3) reduce to a t o t a l d i f f e r e n t i a l
relationship (the compatibility relationship) between Jp/Ju^Jc ncl
Had the chosen dx , d t caused a step i n a direction other than one of
the three characteristics, such a relationship would have been unobtainable.
3*2,1 Characteristics Equations
The d i f f e r e n t i a l equations (3*1)» (5 .2) and(3.3), although they
express the physical laws correctly are not i n a form which brings out
the dominant effect of the three characteristics directions, the
equations therefore have to be transformed to produce t h i s effect. They
have to be expressed, i n the form.
Consider f i g i i r e (^•lA.),if a f u n c t i o n . ^ varies along a curveVv and i f
^ i s a function of X a n d t then :
dfc i - hfi d x
and along m

1.7
or
\<ikL at ax
where ma <JXy (. , the slope of the curve at any point along the
Under these conditions the carve i s a characteristic curve c uirve,
r.ov V U
I n general along a characteristic curve :
and + Im ax
The characteristic equations are obtained by combining the
equations of conservation i n the following manner.
Using equation (5•!) and (5*2) the energy equation can be expressed i n the form
Vifc ^X/ life bK/
Combining equations ( j . l ) , (3.2) and(3.4) i n the following
manner.
equation (3.4) +C (equation (3.1) ) + f C (equations (3 *2) ) :-
U t 3x/ V^t 3x1
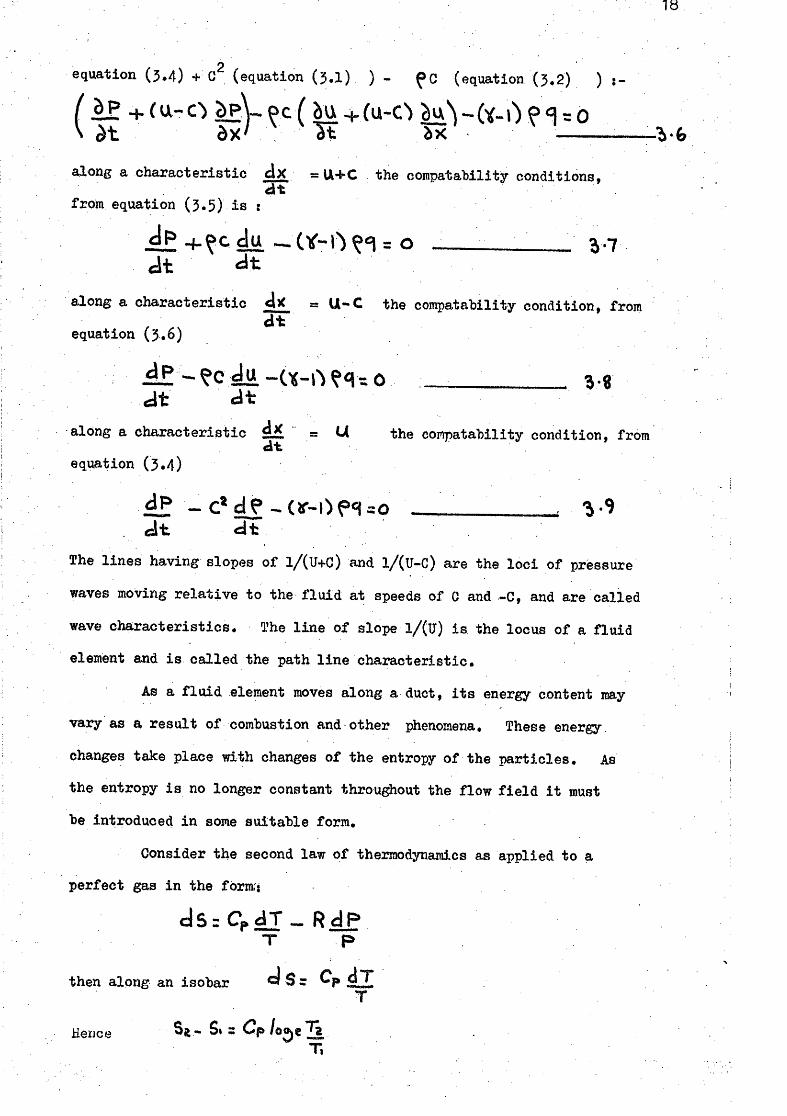
18
equation (5.4) + (equation (3.1) ) - (equation (5.2) ) ,-
\ H dx' I t — •lb
along a characteristic d x = U+C the compatability conditions, from equation (3*5) i s :
dip .^C du - (^r-l")^*:! = O V7 cit
along a characteristic = U-C the compatability condition, from • • at
equation (3.6)
i f - ? c du-u-i^?qso _ _ _ _ _ _ _ 3 «
along a characteristic ^ = U the compatability condition, from a t
equation (3*4)
i f -C»df - ( i r-Of«|=o ^-9
The l i n e s having slopes of l/(U+C) and l/(U-C) are the l o c i of pressure
waves moving r e l a t i v e to the f l u i d at speeds of G and -C, and are called
wave characteristics. The l i n e of slope l/(U) i s the locus of a f l u i d
element and i s called the path l i n e chairacteristic.
As a f l u i d element moves along a duct, i t s energy content may
vary as a re s u l t of combustion and other phenomena. These energy
changes take place with changes of the entropy of the p a r t i c l e s . As
the entropy i s no longer constant throughout the flow f i e l d i t must
be introduced i n some suitable form.
Consider the second law of thermodynamics as applied to a
perfect gas i n the form;:
d S r C p d J ^ R d P T P
then along an isobar d S r
Hence ^ i i - Si s Cp /ojell

19
deferring to figure (3*2), i f the isobar i s defined at some reference
pressure & and Ce i s the speed of sound on the isobar then :
Thus a change i n the speed of sound0». represents a change i n the
entropy l e v e l .
The following i d e n t i t i e s apply f o r a perfect gas undergoing
an isentropic process.
hence
Co. therefore
? c«. y - i c ^r-\ c«.
multiplying by)JFand substituting f o r ) ^ gives r
Co. from (3.9)
a^c^ dCfi. « (>r-oe^ at Co.
therefore
Ac^ = q c ^ - i ^ a t — ^.tA

20
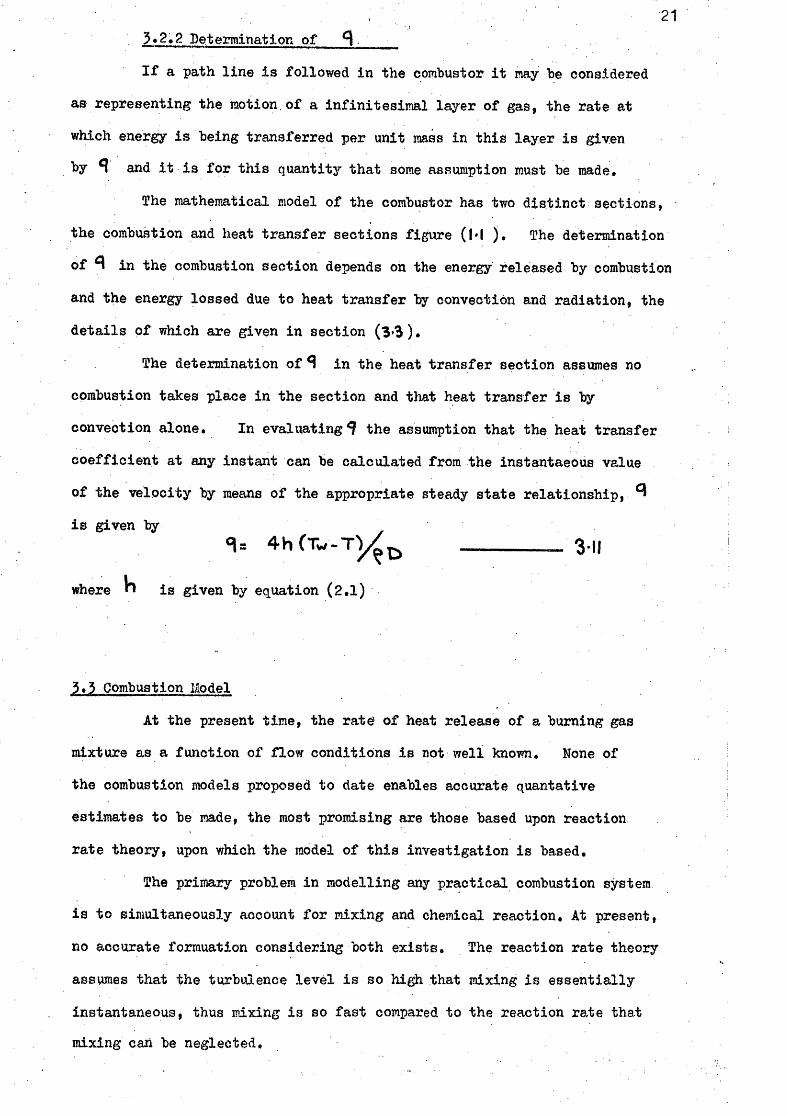
•21 3*2.2 Determination of ^
I f a path l i n e i s followed i n the combustor i t may be considered
as representing the motion, of a i n f i n i t e s i m a l layer of gas, the rate at
which energy i s being transferred per unit mass i n t h i s layer i s given
by 9 and i t i s f o r t i i i s quantity that some assumption must be made.
The mathematical model of the combustor has two d i s t i n c t sections,
the combustion and heat transfer sections figure (M ) . The deteinnination
of ^ i n the combustion section depends on the energy released by combustion
and the energy lossed due to heat transfer by convection and radiation, the
detail s of which are given i n section (3»3)* The determination of i n the heat transfer section assumes no
combustion takes place i n the section and that heat transfer i s by
convection alone. I n ev a l u a t i n g ^ the assumption that the heat transfer
c o e f f i c i e n t at any instant can be calculated from the instantaeous value
of the velocity by means of the appropriate steady state relationship, ^
i s given by <1= 4hCTw-T^^ 311
where ^ i s given by equation (2.1)
3*3 Combustion Llodel
At the present time, the rate of heat release of a burning gas
mixture as a function of flow conditions i s not well known. None of
the combustion models proposed to date enables accurate quantative
estimates t o be made, the most promising are those based upon reaction
rate theory, upon which the model of t h i s investigation i s based.
The primary problem i n modelling any practical combustion system
i s t o simultaneously account f o r mixing and chemical reaction. At present,
no accurate formuation considering both exists. The reaction rate theory
assumes that the turbuj.ence l e v e l i s so high that mixing i s essentially
instantaneous, thus mixing i s so fast compared to the reaction rate that
mixing can be neglected.

22,.'
The law of mass action may be expressed by ;
where the parameters A, B, C and E are defined empirically.
This expression may only be applied i n a meaningful way to
elementary reaction steps corresponding to actual reaction mechanism.
However, most combustion reactions are extremely complex, and most
l i k e l y include chain i n i t i a t i n g , chain carrying, chain branching and
chain breaking steps. The precise details of which are most complex.
For t h i s reason, the only feasible approach to the problem of determining
the reaction mechanism of a technical combustion system i s to measure the
dependence of the overall reaction rate on the concentrations of the
species involved.
Host chemical reactions are bi-molecular and proceed as the result
of reactions following binary c o l l i s i o n s . I n complex combustion
processes, second order k i n e t i c s have been used successfully by considering
that one of the bi-molecular processess involved i n the reaction constitutes
the rate determining step.
I t i s convenient i n determining the overall reaction rates i n a
combustion process to consider the rates of consumption of o r i g i n a l f u e l
and oxygen on the basis of a second order reaction.
Thus f o r the reaction
2nd order Puel + Oxygen ^ Products
Reaction
The f u e l consumption rate i n such a process may then be described
by the Arrhenius expression
as used by Chen (3I) which assumes a negligible reverse reaction

The combustion model i s based on a plug flow reactor which i s a
continuous series of i n f i n i t e s i m a l l y s t i r r e d reactors, that i s a reactor
with perfect r a d i a l mixing and negligible axial mixing, conduction and
d i f f u s i o n . I t assumes the reaction rate can be calculated from.the
instantaneous value of gas properties by means of equation (3 ,12)
Heat transfer from the combustion zone i s accounted f o r by radiation and
convection assuming the combustion wall temperature i s knovni and radiates
as a black body.
Then
and
<2 et^ •
4-m
with
X C H a Q <Nt X ' a O
By stoichiometry, assuming reaction to H O only
I n engineering combustion analysis based upon reaction rate
theory, i t i s usual to assume a constant value of activation energy.
Walburn (32) has shoAvn i t t o be a variable quantity f o r propane, and
suggest that the activation energy varies almost exponentially with
temperature through the reaction zone. Prom observed species
d i s t r i b u t i o n through the reaction zone i t has been deduced that the
combustion of the hydrocarbon proceeds as follows : I n i t i a l l y the
hydrocarbon breaks down v i a chain branching reactions i n t o radicals
v/hich are then oxidized to carbon monoxide and hydrogen.
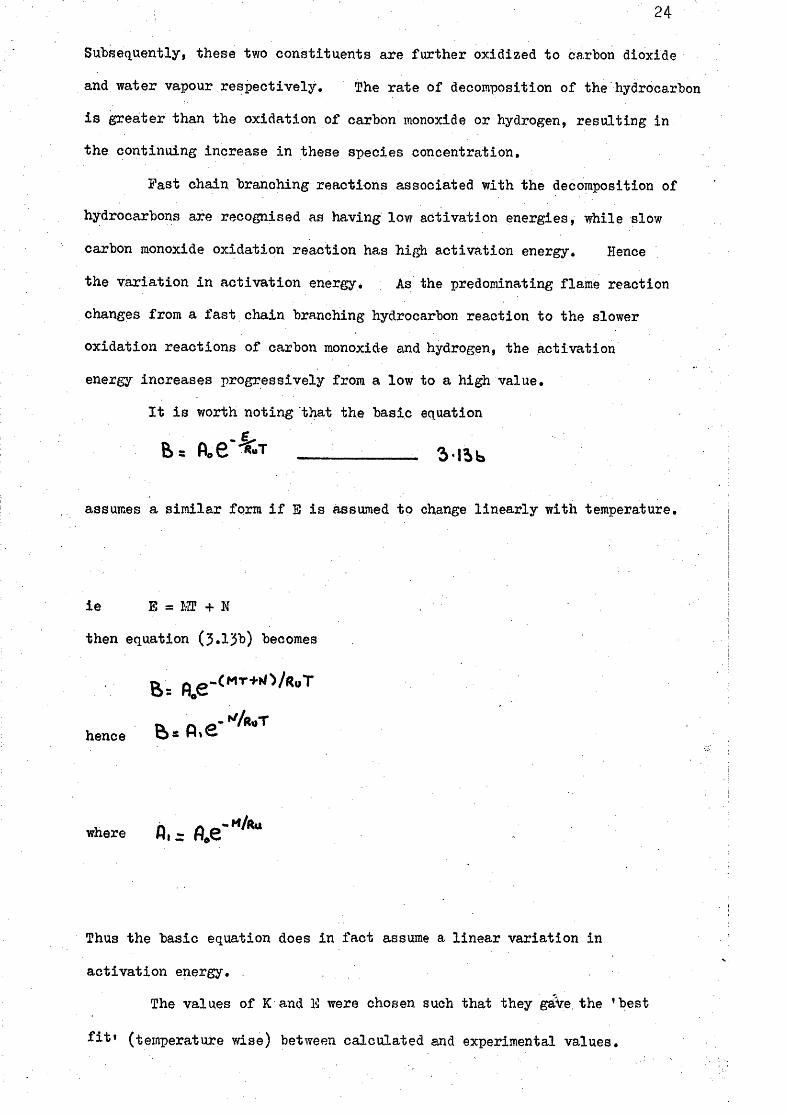
24
Subsequently, these two constituents are further oxidized to carbon dioxide and water vapour respectively. The rate of decomposition of the hydrocarbon i s greater than the oxidation of carbon monoxide or hydrogen, resulting i n the continuing increase i n these species concentration.
Fast chain branching reactions associated with the decomposition of
hydrocarbons are recognised as having low activation energies, while slow
carbon monox:ide oxidation reaction has high activation energy. Hence
the v a r i a t i o n i n ac t i v a t i o n energy^ As the predominating flame reaction
changes from a fast chain branching hydrocarbon reaction to the slower
oxidation reactions of carbon monoxide and hydrogen, the activation
energy increases progressively from a low to a high value.
I t i s worth noting that the basic equation
B= ftoB^'^T _ _ _ _ _ 3.15k,
assumes a sim i l a r form i f E i s assumed to change l i n e a r l y with temperature.
i e E = LZP + N
then equation (3«15b) becomes
hence P » S
where fi, ~ fl.e"''^''^
Thus the basic equation does i n fact assume a li n e a r variation i n
act i v a t i o n energy. .
The values of K and K were chosen such that they gave, the 'best
f i t * (temperature vdse) between calculated sjid experimental values.
25.
The quoted measured values of E f o r propane and a i r mixture ranges
from 21000KJ/Kg-mol -I68OOO KJ/Kg-mol, the value of E which gave the 'best
f i t curve' f o r t h i s investigation was ^3000 KJ/Kg-mol. The values of K
quoted i n the l i t e r a t u r e range from 3.0 x 1C^nr'/Kgs - 4.8 x io'm'/Kgs the
value of K used i n t h i s investigation was x IC^ir^/Kgs.
The combustion model assumed that the i g n i t i o n temperature occurred at
X = 0 and was varied between 600°K - 800°K so 'best f i t ' curves could be
obtained, while accommodating the use of. only one value for E and K f o r a l l
t est conditions. I n a l l calculations e u as taken to be 0.2.
3«4 Boundary Conditions
Given the values of the dependent vaiSables at a l l locations at a
certain i n i t i a l time, i t i s necessary to f i n d t h e i r values at a l l . locations
at any.later time. Knowledge of the i n i t i a l values i s not enough,
information must also be supplied about the conditions that are enforced
at the two ends of the duct at a l l l a t e r times.
The boundary conditions f o r t h i s investigation are a closed end at the
inl e t , and an open end at the outlet considering each i n terna-
I n l e t Boundary Condition
The i n l e t i s assumed acoustically closed the value of U i s equal to the
mean ve l o c i t y . The value of C i s assumed known and corresponds to the
i n l e t condition of a path l i n e characteristic. I t i s assumed the i n l e t of
the duct corresponds with the pressure plane of recovery a f t e r the sudden
enlargement i . e . the plane where the pressure i s uniform and the flow
one-dimensional.
Outlet Boundary Conditions
In the problem considered only subsonic flow i s assumed to occur,
and neglecting the i n e r t i a of the. f l u i d outside the duct e x i t , the state

£10
of the gas at the plane of the open end can be assumed to be that of the
surroundings. For the open end condition two conditions can occur
they are :
(Out flow)
I n t h i s case only one condition i s required. As long as the
flow v e l o c i t y at the exit remains subsonic, and the gas i n the external .
region i s at r e s t , the pressure at the end of the duct can be assumed
equal to the external pressure. The outlet velo c i t y can then be
calculated from equation ( 3 .7 ) and can be calculated from equation
(3 .10)
(Inflow)
I n t h i s investigation due to the i^resence of a standing wave
for which the open end i s a pressure node, i t can s t i l l be assumed the
pressure at the open end to be the same, as the external region, hov/ever,
the entropy of the gas entering the du c t from the external region has
to be calculated. ^ e n the flow enters the duct from an external
reservoir, i t must be accelerated from rest to the entrance velo c i t y ,
flaking the assumption that the flow i n the v i c i n i t y S-t the end of the
duct can be treated as quasi-steady. The state of the gas i n the external
region represents the stagnation condition (denoted by subscript o) f o r
the flow at. the i n l e t section t o the duct, and assuming the inflow to be
isentropic. Applying the energy equation i n the form,
from whichC can be calculated as U can be obtained from equation (3 .7 )
3*5 Operating Frequency
Hanby (28) has reported an accuracy of 5^ i n predicting frequency
by using the mean square root gas temperature as a basis f o r computing
the speed of sound i n the basic equation j

27
F r ( ? . n - r ^ C. 4 L
f o r n=»>5t>S
Hir s t (29) - see Appendix I has recently considered a closed/
open pipe of acoustic length 2,0 m assuming a linear r i s e i n velocity
of sound f o r a temperature, ris e of 1000° G, with a sinusoidal pressure
o s c i l l a t i o n of angular frequency W generated at X = 0.
Considering the same problem but using a less rigorous
approach :
The period of o s c i l l a t i o n i s related to the standing W3.velength
and vel o c i t y of sound by the equation,
c
For the fundamental mode of vib r a t i o n the period of o s c i l l a t i o n i s ^iven
by : -
. c
i e a pressure pulse must t r a v e l the length of the tube four times before
the cycle i s repeated, f o r r e f l e c t i o n at the closed end takes place
without change of phase , and so two reflections at the open-end are
necessary before the reflected pulse i s restored to the i n i t i a l phase.
with C= M X + M
then
28
f o r higher harmonics
( I S ^ ^ ^ IT
f o r rvx \,^,^
The frequency of o s c i l l a t i o n being given by :
•F=_L.
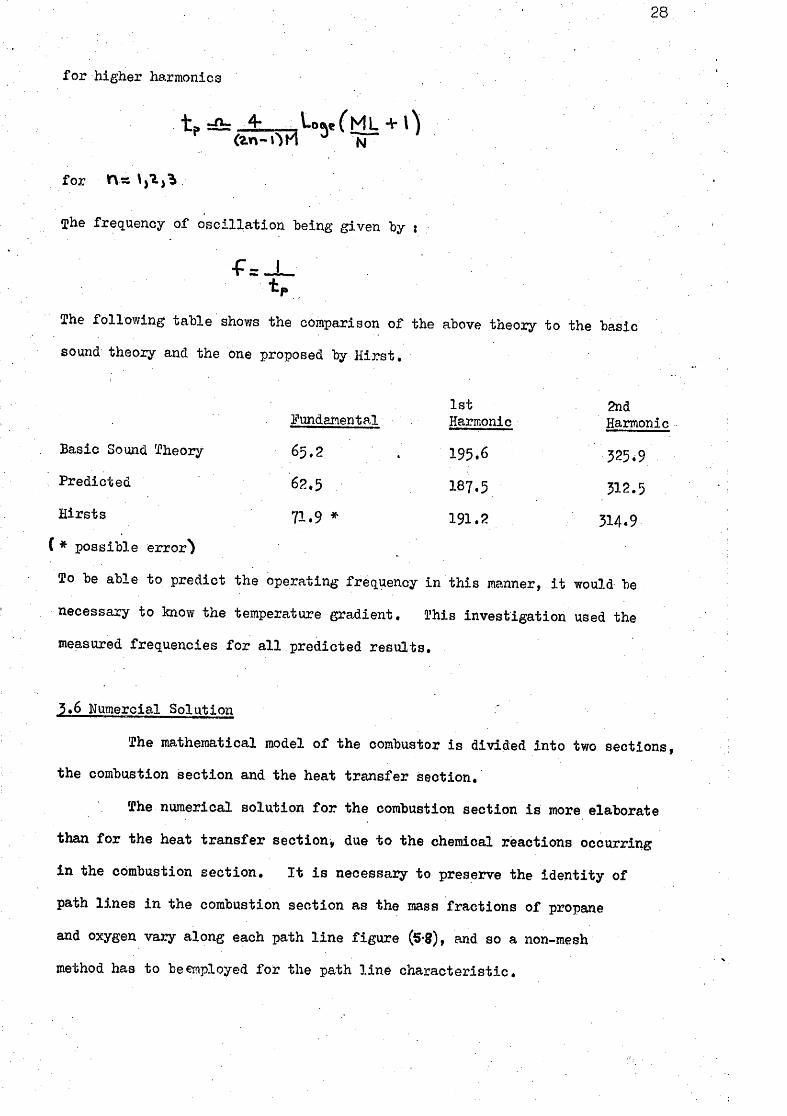
The following table shows the comparison of the above theoiy to the basic
sound theory and the one proposed by H i r s t ,
1st 2nd Fundamental Harmonic Harmonic
Basic Sound Theory 65.2 . 195,6 325.9
Predicted 62.5 187.5 512.5
Hirsts 71.9 * 191.2 314.9
( * possible err o r ^
To be able to predict the operating frequency i n t h i s manner, i t would be
necessary to know the temperature gradient. This investigation used the
measured frequencies f o r a l l predicted results.
3.6 Mumercial Solution
The mathematical model of the combustor i s divided i n t o two sections,
the combustion section and the heat transfer section.
The numerical solution f o r the combustion section i s more elaborate
than f o r the heat transfer section, due t o the chemical reactions occurring
i n the combustion section. I t i s necessary to preserve the i d e n t i t y of
path lines i n the combustion section as the mass fractions of propane
and oxygen vary along each path l i n e figure (5-8), and so a non-mesh
method has to be employed f o r the path l i n e characteristic.
29
The numerical method used i n the heat transfer section i s described
f i r s t followed by the description of the non-mesh method fo r the path lines '
i n the combustion zone,
3>6,1 Numerical solution i n the heat transfer section
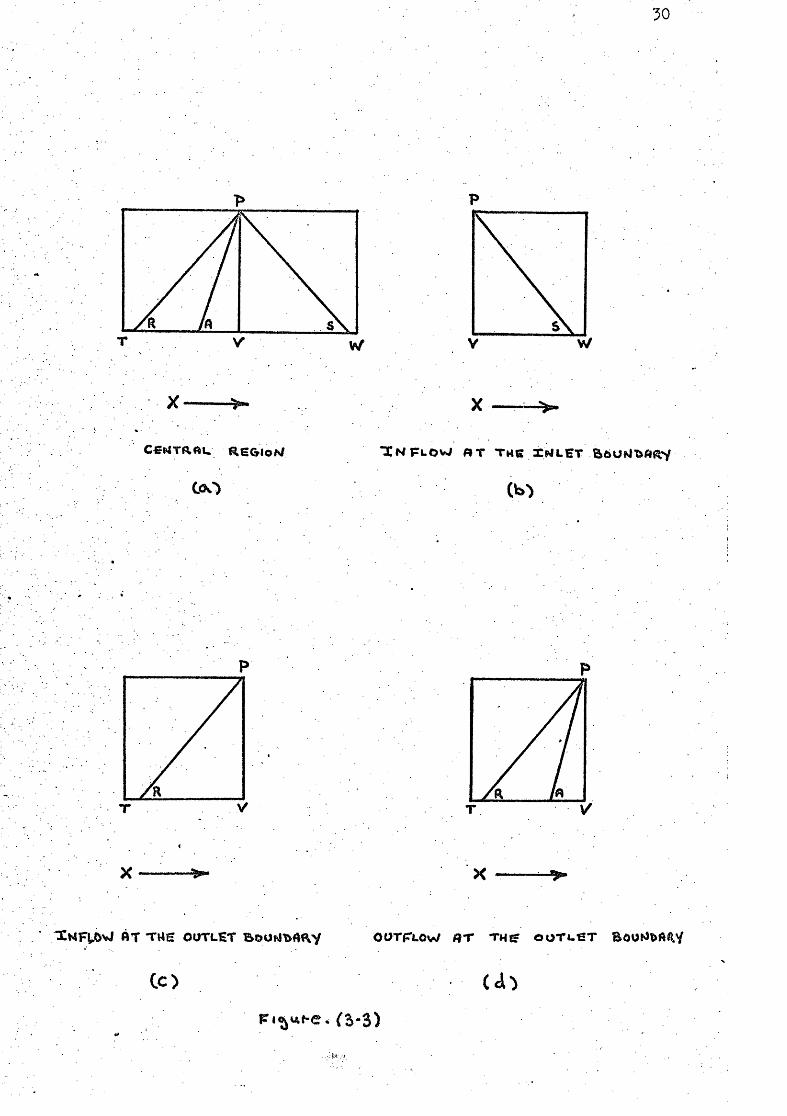
The geometMeal relationship between the points which have to be
considered during a foirward step i n time are shown i n figure (5 ,3 )
Figure ( 3»5a ) concerns a point i n the central part of the g r i d , while figure
( 3 . 3 b ) , f i g u r e ( 3 « 3 c ) and f i g u r e (3.3fi) represents points near a boundary.
For a central g r i d point figure ( 3 . 3 a ) , the task i s to calculate
values of P, U and Ca at point »P' , given the values of these variables
at points T,V and W, F i r s t , the characteristic lines RP, AP and SP are
located, having slopes l/(ir+C) l / ( u ) and l/(u-C) respectively, ' hen
the values of P,U and Ca f o r the points R, A and S are obtained from those
at T, V and W by i n t e r p o l a t i o n . F i n a l l y the variables P and U at point P
are found by combining equations ( 3 » 7 ) and (3.B) i n F i n i t e difference form
and the value of Ca at point P i s found by applying equation (5»10)
For the boundaries, the procedure i s modified by the fact some
of the information implied by the above relations i s replaced by information
derived from boundary conditions. Consider outflow to the r i g h t figure (5.3<3)
instead of knowledge transmitted by the SP cha.racteristic, the value of P i s
known and U can be calculated from equation ( 3 . 7 ) Simiia,! telationships
can be formed f o r the other boundary conditions,
a) Calculations of the variables at R, A and S
The slope of the characteristics through R, A and S are respectively
l/(U+C), l/(U) and 1 / (U-G), but the U and C values are d i f f e r e n t f o r each
point, and they vary along the length of the lines that lead to P,
Many methods can be derived of varying accuracy and complexity f o r the
evaluation of appropriate mean values of U andC, the one that i s adopted
i n the program i s to use the value of U- and C at position V,
50
X X
Loo
«T T«H OUTLET BOOi41>AaV OWTfTLOW «T THff OOTUST BOOh^fefi^y
31
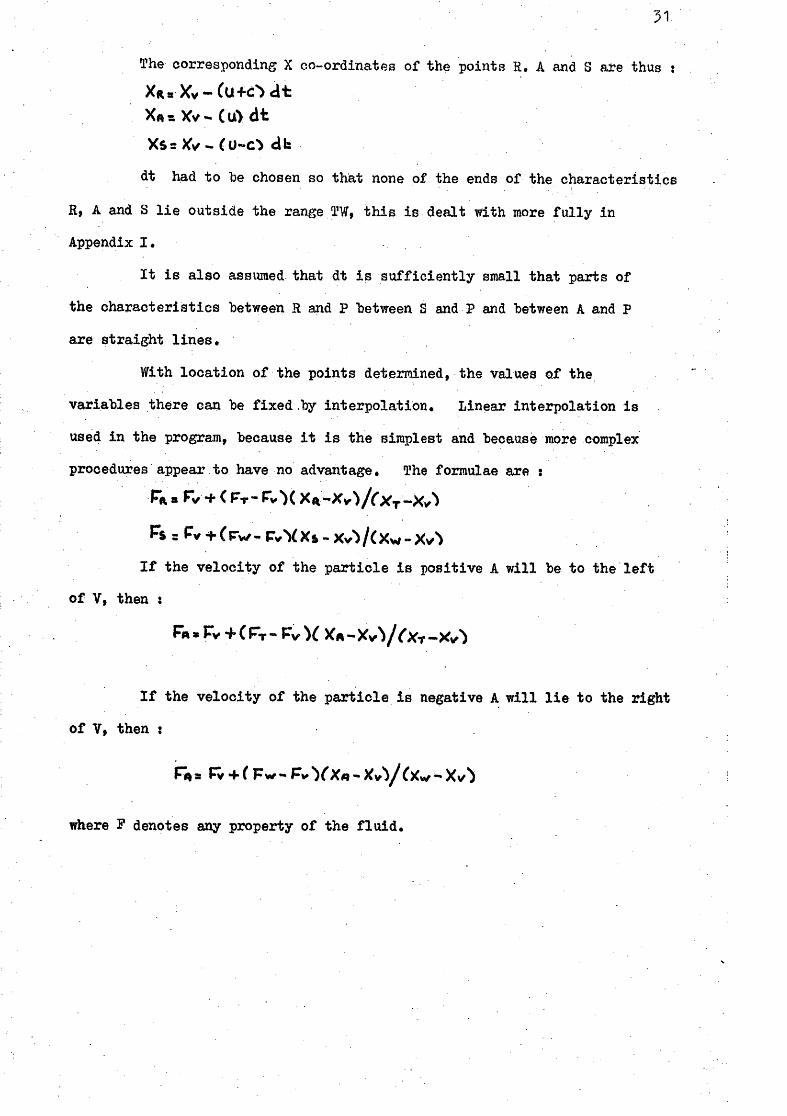
The corresponding X co-ordinates of the points R. A and S are thus : X r s X v-Cu - f-c^ a t X A * X v - ( u > d t
dt had t o be chosen so that none of the ends of the characteristics
R, A and S l i e outside the range TW, t h i s i s dealt with more f u l l y i n
Appendix I .
I t i s also assumed that dt i s s u f f i c i e n t l y small that parts of
the characteristics between R and P between S and P and between A and P
are straight l i n e s .
With location of the points determined, the values of the
variables there can be f i x e d .by in t e r p o l a t i o n . Linear interpolation i s
used i n the program, because i t i s the simplest and because more complex
procedures appear t o have no advantage. The formulae are :
Ps = Pv + Crv«r, V Xs - X v ^ / ( Xw - Xv')
I f the v e l o c i t y of the p a r t i c l e i s positive A w i l l be t o the l e f t
of V, then :
F«» Tv + ( - Pv )( X a - X ^ V ^ ^ T
I f the v e l o c i t y of the p a r t i c l e i s negative A w i l l l i e to the r i g h t
of V, then ;
r,% a T v + r Fv^ - F^ y Xfl * x ^ y Cx« /Xt^ ' i
where P denotes any property of the f l u i d .

. • 32
b) Calculating Ca, P and U at a Central Grid -point at the timet»<At To f i n d the value of the flow variables at the point P, which
has the same X value as V but at a l a t e r time considering the three characteristic equations : ( 3 . 7 ) » (3.8) and ( 3 ,10 ) ,
The value of 9 i n equation (3.10) i s the value the path l i n e
has at A given by equation (3 ,11) . A l l g r i d point values of 9 assume
the value t h e i r respective path l i n e characteristics had at point A,
Therefore, a l l path l i n e calculations f o r time step d l : must be carried
out f i r s t .
The value of i n equation (3.8) i s the aritlimetic mean value
of the values at V and V/, The value of i n equation (3 ,7 ) i s the
arithmetic mean value of the values at T and V,
The values of ^ and C are the values they have at V.
The compatability equations i n F i n i t e difference form f o r
equation ( 3 « 7 )^nd ( 3 .^ ) are :
.-. Up=±(((p,-p's>+u-i^eatc<iT-o/2Vec'''"«+'^*^
Thus the ve l o c i t y at p becomes the arithmetic mean of the
values at R and S, plus a contribution from the difference between the
pressures at those two points plus thei heat transfer e f f e c t .
53
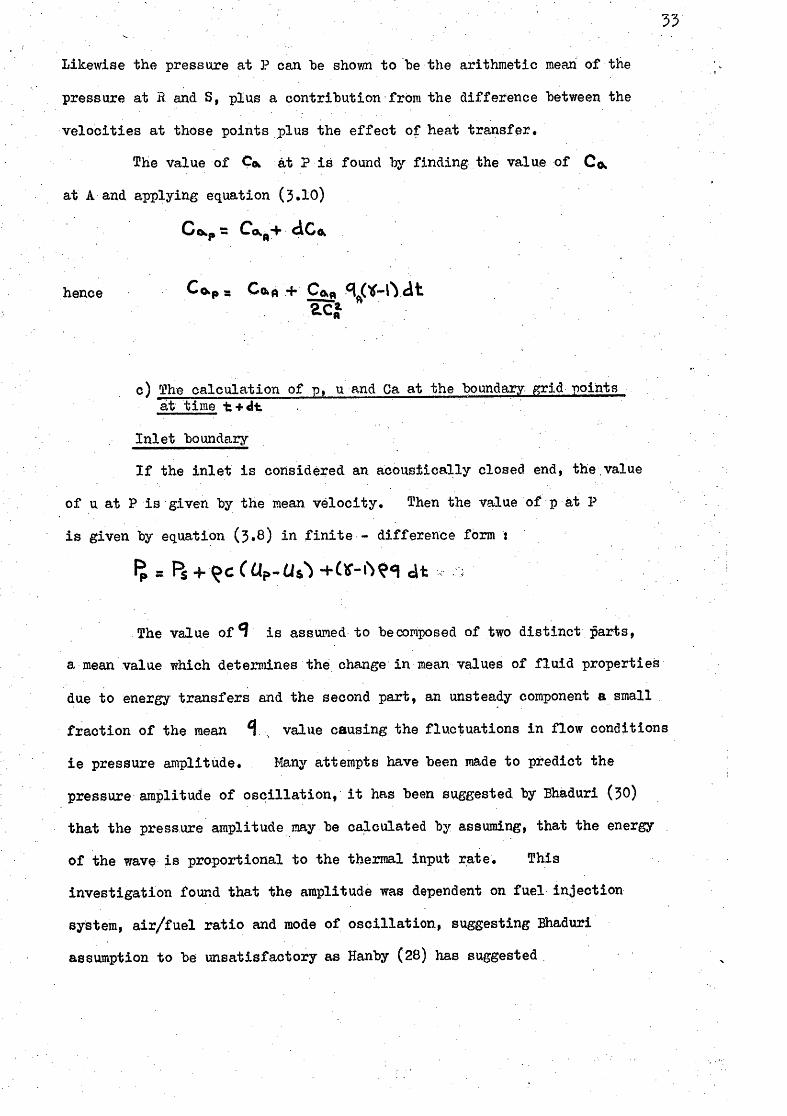
Likewise the pressure at P can be shorn to be the arithmetic mean of the
pressure at R and S, plus a contribution from the difference between the
vel o c i t i e s at those points plus the effect of heat transfer.
The value of Co, at P i s found by fi n d i n g the value of Ce^
at A and applying equation (3 .10)
hence Co.p - Ca^ + Co.« ^ ( i f - i ' i d t
c) The calculation of p, u and Ca at the boundary grid points at time t + <lt
I n l e t boundary
I f the i n l e t i s considered an acoustically closed end, the,value
of u at P i s given by the mean v e l o c i t y . Then the value of p at P
i s given by equation (3.8) i n f i n i t e - difference form :
The value of i s assumed to be composed Of two d i s t i n c t parts,
a mean value which determines the change i n mean values of f l u i d properties
due to energy transfers and the second part, an unsteady component a small
f r a c t i o n of the mean ^ value causing the fluctuations i n flow conditions
i e pressure amplitude. Many attempts have been made to predict the
pressure amplitude of o s c i l l a t i o n , i t has been suggested by Bhaduri (30)
that the pressure amplitude may be calculated by assuming, that the energy
of the wave i s proportional to the thermal input rate. This
investigation found that the amplitude was dependent on f u e l i n j e c t i o n
system, a i r / f u e l r a t i o and mode of o s c i l l a t i o n , suggesting Bhaduri
assumption to be unsatisfactory as Hanby (28) has suggested

••• • • ••34
'Shis investigation then has to r e l y on the measured pressure amplitude at the i n l e t and uses a steady flow value f o r the mean value o f ^
• •
. I t i s proposed to represent the pressure a.t the i n l e t boundary
by the equation :
where fa i s the atmospheric pressure, PSiMCWi*) represents the measured
pressure amplitude at the i n l e t , and the term { ^ ' j f - l ' ^ ^ ^ J ^
represents the increase i n mean pressure due to combustion,
Go«. assumes the value i t had i n steady state calculations when
obtaining the 'best f i t ' curves f o r the measured axial temperature
gradients i n the combustion zone f o r non-pulsating conditions.
Outflow through a f u l l y open end.
The end of the path l i n e characteristic A figure (3-3«S) l i e s
w ithin the duct. The value of Ca at P can be calculated from
equation (3.IO). The pressure at the duct outlet can be taken to
equal the external pressure. The value of u at., p may be calculated
from equation (3,7)
Up. U r - ((VP«^-^(''v)-<?TVe'^V: y^^
Inflow through a f u l l y open end figure (VSe)
liVhen f l u i d enters the duct from an external region, i t i s assumed
the stagnation condition at the end of the duct i s the same as that of
the external region, and assuming the inflow to be isentropic. The
energy equation can be expressed, from equation (3 .14) by :
55
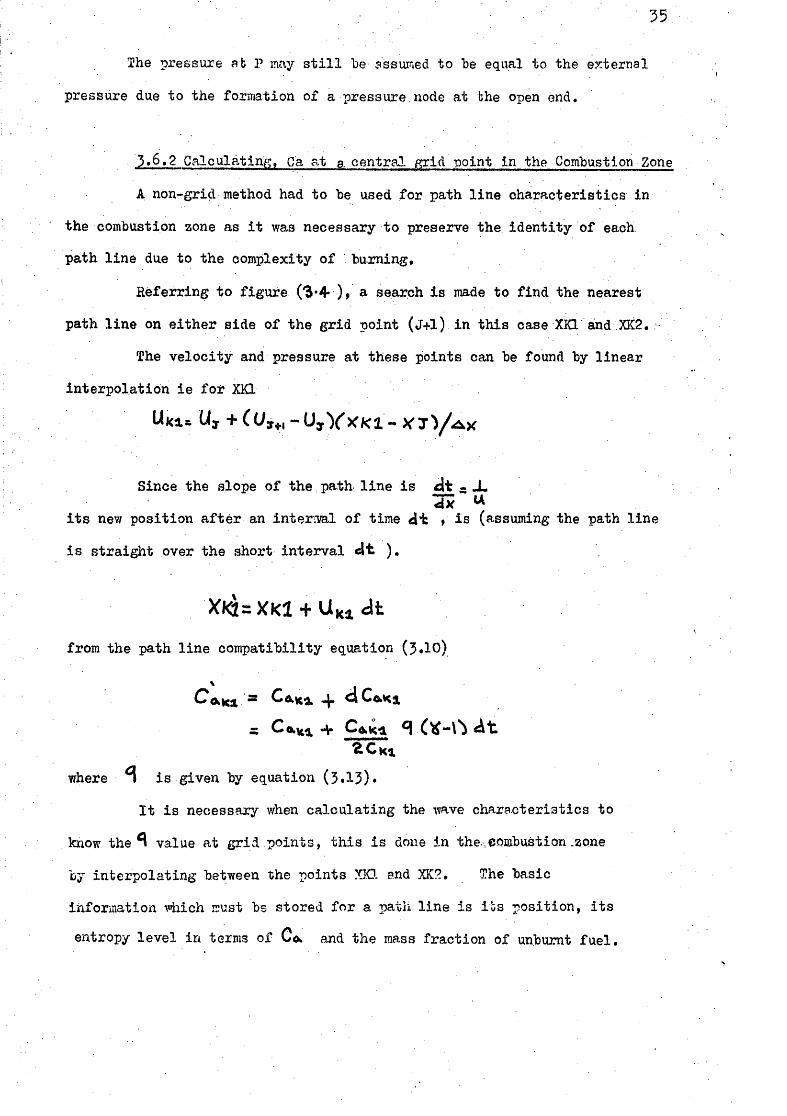
The pressure at P may s t i l l be assumed to be equal to the external
pressure due to the formation of a pressure.node at the open end.
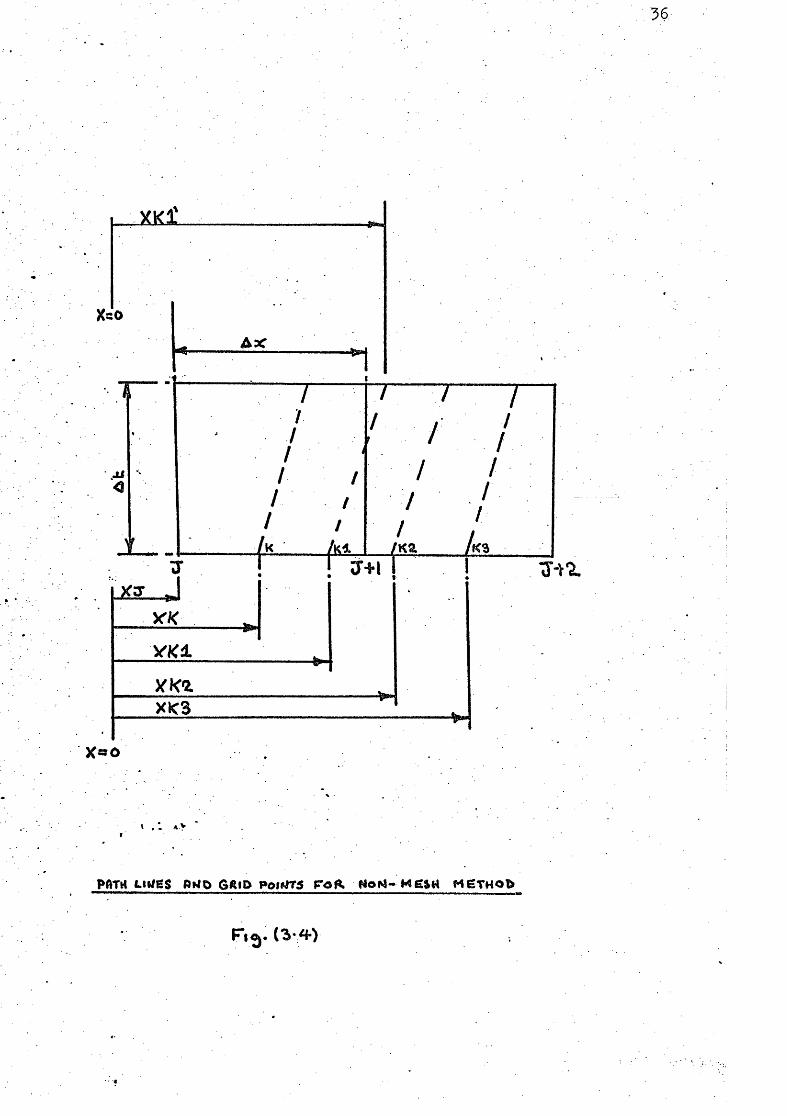
3.6,2 Galcula,ting, Ca at a central grid point i n the Combustion Zone
A non-grid method had to be used f o r path l i n e characteristics i n
the combustion zone as i t was necessary to preserve the i d e n t i t y of each
path l i n e due to the complexity of burning.
Referring to figure ('S'- ), a search i s made to f i n d the nearest
path l i n e on either side of the g r i d point ( j + l ) i n t h i s case XKl and XK2,;
The velocity and pressure at these points can be found by linear
i n t e r p o l a t i o n i e £oi XXI
Since the slope of the path l i n e i s s X
i t s new position a f t e r an interml of time d'fc » i s (assuming the path l i n e
i s straight over the short i n t e r v a l d t ).
from the path l i n e compatibility equation (3*10).
where ^ i s given by equation ( 3 . 1 3 ) .
I t i s necessary when calculating the wave characteristics to
know the value at g r i d points, t h i s i s done i n the.,combustion .zone
by int e r p o l a t i n g between the points XIQ and XK2. The basic
information which irust bs stored f o r a patii l i n e i s i t s position, i t s
entropy l e v e l i n terms of Co>. and the mass fraction of unbumt f u e l .
36
*
1
t . *. A >
PATH LIMBS RMO GAlD PofolT5 T o f t f l o i ^ - M 6 $ « M 6 T H O f t

57
Combustion was considered complete when XCH = 0.003 which coxresponded to
Xc£b 0,3 m f o r a l l test conditions considered by the investigation, t h i s
giving a combustion effic i e n c y of 95/^.
58
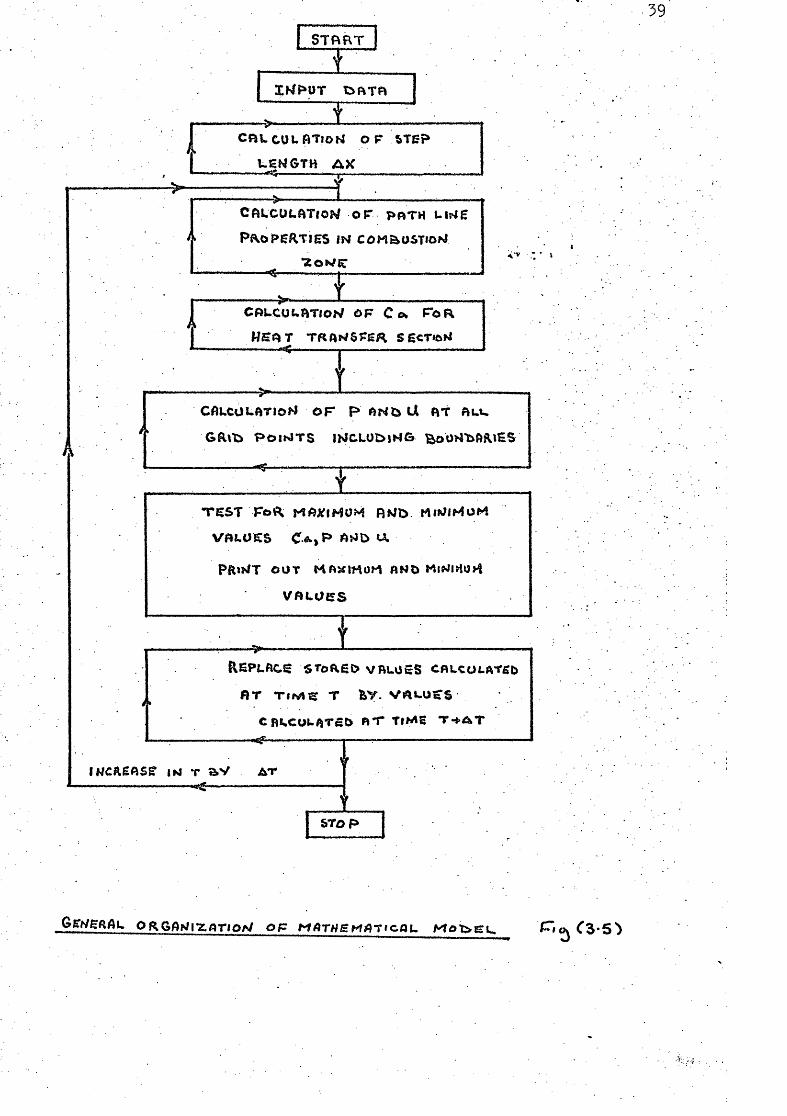
3.7 Computer Program
The computer program was w r i t t e n i n Portram IV and was executed
on an I H i 36b computer, The organisation of the program i s shown i n
figur e (3'5 )
I n working with the program great d i f f i c u l t y was found i n choosing
the correct number of path l i n e characteristics f o r the combustion section
of the program. However, i t was found that a good approximation could
be had, i f the mean vel o c i t y f o r the path l i n e characteristic direction
was used instead of the instantaneous velocity. This approximation
greatly reduced the d i f f i c u l t y and computer time was saved due to a
reduction i n the number of path l i n e characteristics required. A
t y p i c a l comparison of results from the two methods i s shown i n figure
(S'6 ) and figure (S*7), a fu r t h e r comparison being given i n the test
results f o r tests 3a and 3h. The comparison shows that a reduction
of temperature o s c i l l a t i o n s i n the combustion section i s obtained, when
using the mean ve l o c i t i e s f o r calculation of path l i n e c h a r a c t e r i s t i c s ,
t h i s producing a change i n the d i s t r i b t u i o n of standing waves as shown
i n the results f o r tests 3a and 3b.
A l l predicted results f o r tests 1-5 (section ST.Z) used the
instantaneous v e l o c i t y f o r pathline calculation? .
39
[
UENGTH A>C
A
CALCOt-ftTloM o r PftTH Ulfig
P a o P E R T I E S IN CDMaoiTiOlsI
^ 1
Y
PRihfT OUT MR^iHoM fiND MlMlHU>
fir T i f ^ s T ^y. vftuucs
• —«g ^
•Mig AT
STOP
CHAFi?BE 4
4*0 Experimental Method
4.1 Experimental Apparatus
4.2 A i r Supply
4.5 Fuel Supply
4.4 Fuel I n j e c t i o n System
4.5 Cooling Water Plowrate
4.6 Pressure Measurement
4.7 Wall Temperature Measurements
4.8 Time-independent gas temperature measurements
4i9 Silencing ChamlDer
4.10 Experimental Procedure
4.11 Error Analysis
' . 40
4 .0 Experimental i'iethod
The aim of the experimental work was to construct a pulsating
comhustor of simple design which would f a c i l i t a t e mathematical ayalysis,
and allow measurement of the variables thought to affect the combustion
o s c i l l a t i o n s .
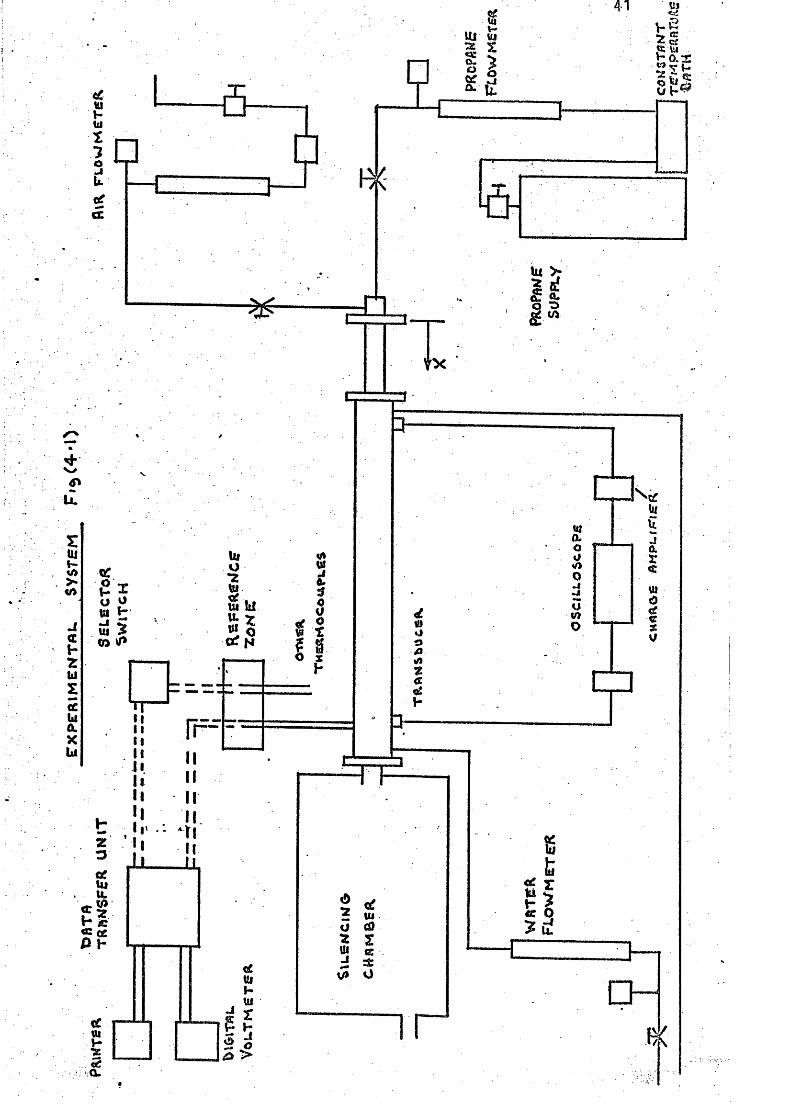
4.1 Experimental Apparatus
The combustor i s shown i n Jligure ( I ' l ) i t consisted of a
1.965 m long 50.8 mm i n t e r n a l diameter stainless steel'tube of 6.55 ran
wall thickness, with a ..counter-flow cooling jacket f o r most of i t s
length. The outlet of the combustor was connected to a large
silencing chamber - section ( 4 .9 )• " he combustor i n l e t - see figure
(4*^^ ) - was acoustically closed by a constriction to 19 mm dia,meter
with a 16 mm diameter central propane j e t with an end nozzle attached.
During combustion the combustor produced longitudinal acoustic oscillations
of the fundamental and f i r s t harmonic - figure (S'l ) - the mode of
o s c i l l a t i o n depending on a i r and f u e l flowrate. Twelve sampling
ports were provided along the combustors length f o r the insertion of
probes, two i n the combustion chamber and ten i n the heat transfer
section.
4*2 A i r Supply
; A two stage reciprocating compressor, with a receiver pressure
of 10.5 ^ars gauge, supplied a i r (model 15T type 50 manufactured by
Ingersoll Rand Limited). The supply flowrate was measured by a Gapmeter
(Type IGU/15F) manufactured by G.A. Platon Limited). The range covered
was from 0.1 x 10 - 0.9 x 10 ' ^ Kg/s at 7 bar gauge and 15° C.
41
V-u
o U of ml*
X O I
—C
\3
42
The Gapmeter was calibrat,ed "by the manufacturers to an accuracy of - \*2jfo
of f u l l scale deflection. The cali'bration pressure was maintained "by a
pressure regulator, and any temperature variation was corrected from a •
measurement of a i r temperature i n the supply l i n e . A large pressure
drop was produced i n the a i r supply l i n e at the i n l e t to the combustion
chamber to prevent flow o s c i l l a t i o n s i n the supply l i n e , t h i s was ve r i f i e d
by transducer measurement of pressure close to the flo^^^Deter, no
v a r i a t i o n i n pressure was observed - steady flow could be assumed.
4.3 yuel Supply
I n order to simplify as much as possible the mathemetical m.odel
a gaseous f u e l was used (Commercial Propane from the B r i t i s h Oxygen
Company Limited). This choice eliminated the problems associated with
p r e d i c t i n g vaporization rates and l i q u i d droplet burning rates. The
supply flowrate was measured by a high accura,cy rotameter (Type 100
manufactured by Rotameter Limited). The range covered was from
O.IB - 1.8 ym /<x at 30 psi and 20* C. ^he rotameter was calibrated
by the manufacturers to an accuracy of - 2.0-4 of indicated flow. A
large pressure drop was produced i n the fuel supply l i n e at the i n l e t
t o the combustion chamber by flow across a nozzle to prevent flow
o s c i l l a t i o n s i n the supply l i n e , transducer measurement of pressure
near the flovsmeter indicated no va r i a t i o n i n pressure - steady flow
could be assumed. '-he temperature of the propane was controlled
by passing the propane through a cooling c o i l immersed i n a constant
temperature bath. The c a l i b r a t i o n pressure was maintained by a
pressure regulator, and any temperature variation was corrected from
a measurement of propane temperature i n the supply l i n e .

45
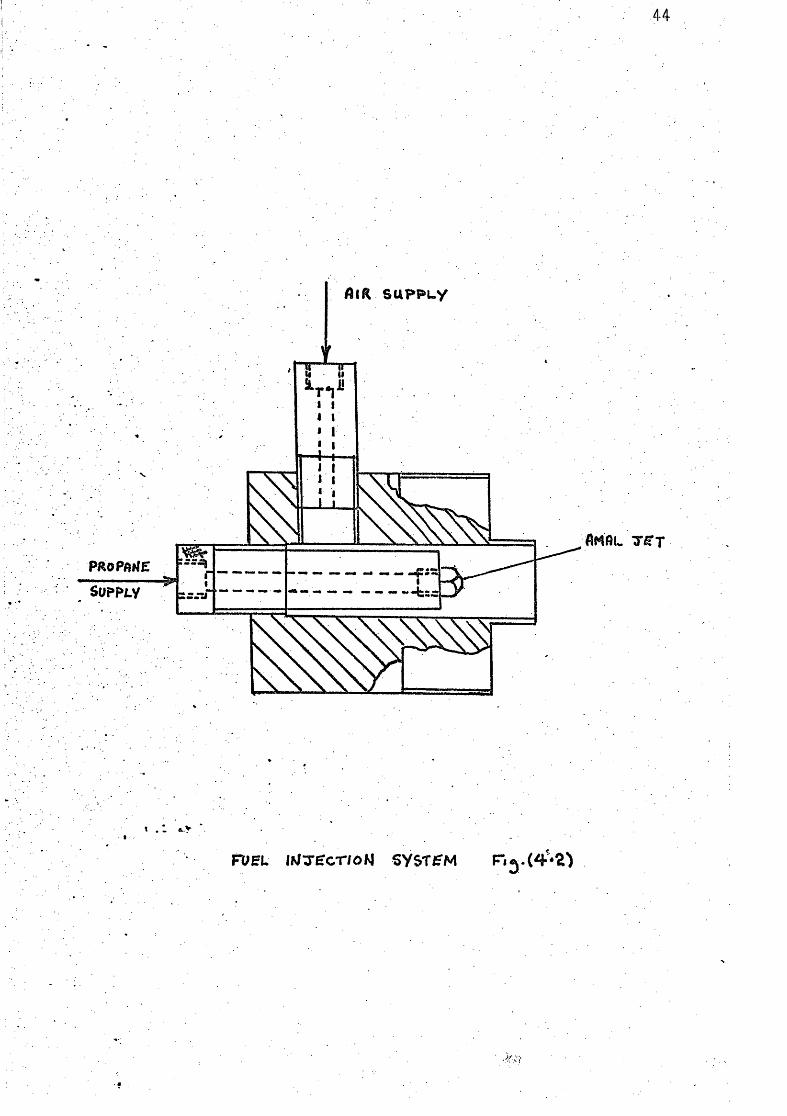
4*4 Fuel I n j e c t i o n System
The f u e l i n j e c t i o n system i s shown i n figure ( 4 ' ^ ) . Standard
Amal nozzles were used, the size of nozzle used was found to affect the
pressure smplitude and mode of o s c i l l a t i o n , . . many other variables were
found to affect these two quantities, that i t was decided to use only
one nozzle size. Nozzle No,400 was chosen, t h i s produced the fundamental
at low f u e l flowrates and f i r s t harmonic at high f u e l flowrates - Figure
( 5 - 1 ) .
4.5 Cooling ^ % t e r Flowrate
The cooling water flowrate was measured by a rotameter (Type
Metric 24E manufactured by Rotameter Limited). The rotameter was
calibrated by timing the discharge of . a quantity of water f o r set
conditions, the error involved was estimated at ~ 7$, ^he i n l e t and
outlet water temperatures of the cooling jacket were measured by
calibrated thermometers i 0,2° C over a range of temperature 15°C - 55° C,
f o r a flowrate of 0,15 Kg/s.
4.6 Pressure Measurement Pressure amplitudes were measured at each of the sampling ports
using quartz c r y s t a l piezoelectric transducers ( K i s t l e r type 601A
housed i n a cooling adaptor type 728). The measuring range was 0 to
250 bars with a scale l i n e a r i t y of 0,25'/, '-he output from the
transducer was displayed on an oscilloscope using a charge amplifier
the amplitude was measured from the screen to an accuracy of - 5 »
The frequency of o s c i l l a t i o n was also found from the trace and compared
with measurements from a wave analyser (A .P. Analyser type I46IA
manufactured by ])awe l i m i t e d ) . A switching adaptor ( K i s t l e r type
642) was' used f o r measuring the values of mean pressure i n the
combustion chamber.
44
fliR SUPPLY
SUPPLV

C o f P g R CoMMeCTlfJG W I R E S
45
TuNCtl0^4S
UNIT
< I
I
I
< SeLECTOR
SWITCH <

46
4*7 V/all Temperature Measurements
The mathematical model of the combustion system required as
input data inside wall temperature measurements of both the heat
transfer section and combustion section,
4*7.1 Wall Temperature Measurements of the Heat Transfer Section
The temperature difference across the tube wall had f i r s t t o be
measured t h i s was done by taking temperature measurements at two radial <
positions f o r each section corresponding to a sampling port i n the
heat transfer section.
Frora^ measurements of wall temperature i t was found that the radial
temperature gradient was much greater than the longitudinal temperature
gradient. Thus i t may be assumed that heat flow i s mainly i n the radial
d i r e c t i o n , then i t can be shown the temperature !Ii*at any radius f i s
given by :-
-T — 0 r
where T=T, a t
This equation enabling the inside wall temperature, Tw, to be
determined. -
The wall temperatures were measured by copper/constant an
thermocouples. The junctions were spot welded and e l e c t r i c a l l y
insulated by applying a t h i n covering of aral d i t e . The measuring
system f o r the thermocouples i s shown i n Figure (4*S ),. The thermocouples
were calibrated against N.P.L. calibrated thermometers (- 0.1* C) using a
constant temperature o i l bath. The bath was controlled with a maximum
temperature of 20o" C. The results agreed with the standard cal i b r a t i o n
curves ( 3 6 ) to within 0.5

• 47
The referenbe zone was an insulated box containing the junctions of the thermocouple wires and the copper conne c t i n g wires - the temperature of the zone was measured with a calibrated thermometer -0.2° C . 'Jhe generated voltages were measured by a d i g i t a l voltmeter (type Llvn.b04, rafl,nufactured by ^olatrori Limited), The output was printed on a paper tape (Addmaster type 55 manufactured by Addmaster Co. Ltd.) A selector swich had to be incorporated i n the design, due to li m i t e d input channels to the transfer u n i t . The arrangement enabled a l l wall temperatures to be measured r e l a t i v e to a reference temperature, and the equivalent voltage recorded on a paper tape p r i n t out.
4*7.2 Wall Temperature Measurements of the Combustion Chamber
I t was found that the temperature drop.across the wall thickness
was quite small, and so only one r a d i a l temperature position was needed.
Ten equally spaced holes were d r i l l e d along the length of the combustor
wal l , which allowed a thermocouple probe to be inserted to measure the
temperature 1.5 mm from the inside surface of the combustion chamber.
The thermocouple probe was a nickel/chromium Y nickel/aluminium
(manufactured by Protenax 'J ype BJ). The thermocouple was calibrated
by the manufacturers and agreed with the standard calibration curves
( S 7 ) to within 0.75:
4.8 Time-independent gas temperature measurements
The axial temperature gradient i n the combustion zone was measured
bj'' an a x i a l thermocouple probe, I'he thermocouple probe was made from
twin bore ceramic tubing do m which the theraocouple leads were fed.
The thermocouple was Platinum/lO'.^ Rhodium V Platinum a,nd of diameter
0.01 inches the junction formed by spot welding. The thermocouple was .
calibrated i n an e l e c t r i c a l l y heated furnace which was calibrated to within
0,75'/ of the standard c l vibration curves (38 ), the overall calibration
of the thermocouple agreed with the standard calibration curves to within
48
1.5%
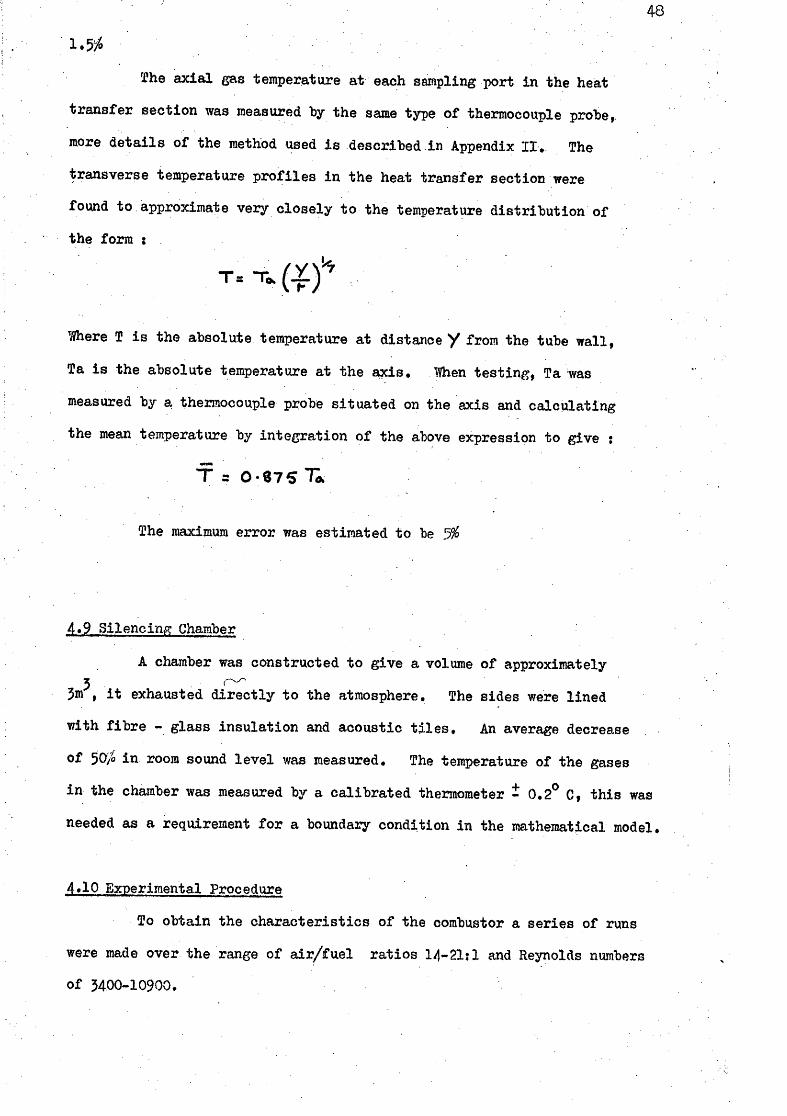
The ax i a l gas temperature at each sampling port i n the heat
transfer section was measured by the same type of thermocouple probe,
more d e t a i l s of the method used i s described i n Appendix I I . The
transverse temperature p r o f i l e s i n the heat transfer section were
found to approximate very closely to the temperature d i s t r i b u t i o n of
the form :
Tl?here T i s the absolute temperature at distance y from the tube wall,
Ta i s the absolute temperature at the axis. When test i n g , Ta was
measured by a thermocouple probe situated on the axis and calculating
the mean temperature by integration of the above expression to give :
The maximum error was estimated to be 3%
4*9 Silencing Chamber
A chamber was constructed to give a volume of approximately
3ni^, i t exhausted d i r e c t l y to the atmosphere. The sides were lined
with f i b r e - glass insulation and acoustic t i l e s . An average decrease
of 50/« i n room sound l e v e l was measured. The temperature of the gases
i n the chamber was measured by a calibrated thermometer - 0.2° C, t h i s was
needed as a requirement f o r a boundary condition i n the mathematical model,
4*10 Experimental Procedure
To obtain the characteristics of the combustor a series of runs
were made over the range of aii r / f u e l r a t i o s 14-21? 1 and Reynolds numbers
of 3400-10900.

49
A standing wave was produced i n the combustor with a pressure
antinode at the closed end and a pressure node at the o u t l e t . The
combustor could o s c i l l a t e at either the fundamental or f i r s t
harmonic depending on the f u e l and a i r flowrates. The o s c i l l a t i o n
regions were determined by keeping the f u e l flowrate constant and
varying the a i r flowrate f o r various f u e l flowrates, figure (5.1)*
The o s c i l l a t i o n s could be prevented by removal of a port plug at a
position corresponding t o the maximiun pressure antinode, which enabled
non-pulsating conditions to be achieved f o r the same conditions as for
pulsating conditions.
The effectiveness of the heat exchanger was determined f o r
fi x e d values of f u e l flowrate while varying the a i r flowrate, the
effectiveness ??£ being defined as :
71 Energy removied by coolant
Energy released by fuel f o r lOQfA combustion
The v a r i a t i o n of pressure amplitude of the pressure antinode
at the closed end f o r v a r i a t i o n i n air/Fuel r a t i o , was determined f o r
fix e d f u e l flows - figure (5 .5 ) .
Having obtained the overall characteristics of the combustor,
test were carried out f o r the following conditions :
Details of Test Conditions
Mode of Oscillation
Fundamental
Fundamental
Fundamental
F i r s t Harmonic
F i r s t Harmonic
Fi r s t Harmonic
Equilibrium conditions v/ere defined as constant v/all and coolant
temperatures. The time to reach equilibrium conditions was approximately
50 minutes.
Test A/F
1 0.50 15*75
2 0.50 18.89
5a 0.50 18.89
5h 0.50 18.89
4 0.6o 15.75
5 0.60 18.89
50 For each test the following measurements were taken.
Mean A i r Flowrate
- Gapmeter
- A i r supply l i n e temperature Ixlean Fuel Flowrate
- Rotameter
- Fuel supply l i n e temperature
Mean Water Flowrate
- Rotameter
- Coolants I n l e t and Outlet temperatures
Wall Temperatures
- Thermocouple readings
- Reference Zone temperatures
Readings at sample ports
- Pressure amplitude
- Frequency of Oscilla t i o n
- Gas temperatures
Silencing Chamber
- Temperature
4.11 Error Anal?/sis
The maximum possible experimental errors i n the investigation
are considered. The errors are derived from the possible errors i n
the measuring instruments.
The relevant instrument accuracies can be defined :
Air flowrate
Gapmeter accuracy - 1.25!:'' f u l l scale deflection
Propane flowrate
Rotameter accuracy accuracy ^ 2.0 ^ indicated flow
Water flowrate
Rotameter accuracy - 3*0 ^ indicated flow

51
Wall temperature
Calibration error of themocouple wire ^ 0,1°C.
Resolution of d i g i t a l voltmeter - 0.25"°C
Gas temperature
Calibration error of thermocouple wire- 10°C.
Resolution of d i g i t a l voltmeter - 0.5°C.
Pulsation Parameters
Pressure amplitude measurement oscilloscope resolution - i t i s assumed that possible errors of the transducers and
charge amplifiers are negligible compared vath the oscilloscope
resolution.
Frequency Measurement
Oscilloscope resolution - 5.0',
An estimate of the performance of the experimental system can be
found from a comparison of the system under non-pulsating turbulent flow
conditions f o r which a theory i s already well developed (4-0 ) ,
CHAFDER 5.
Results and Discussion
5*1 The Combustors Characteristics
5*2 Test Results
5*3 Non-pulsating conditions
5*4 Pulsating Conditions
5*5 Frequency Measurements
5.6 Time-independent Axial Gas Termpature measurements i n the combustion chamber
52-
5*0 Results and Discussion
5*1 The Cdmbustors Characteristics
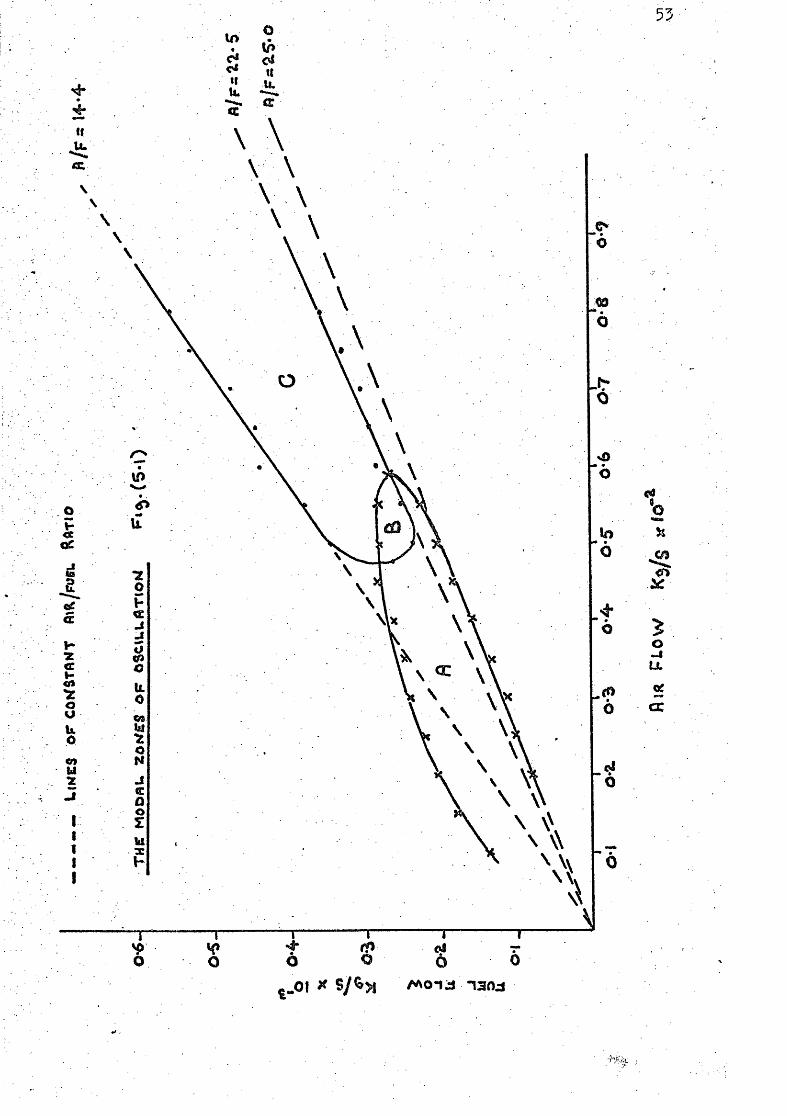
The modal zones of o s c i l l a t i o n are shown i n figure (5-I )*
For any fu e l mixture occurring i n region 'A' the fundamental mode of
o s c i l l a t i o n was obtained,, i n region *C* the f i r s t harmonic and i n region
*B* either the fundamental or f i r s t harmonic. The fundamental was
obtained i n region B' by operating the combustor i n region 'A' then
moving i n t o region *B'. I f the combustor was operated i n region »C*
then moved to region ' B* the f i r s t harmonic was obtained .
A possible explanation f o r a change i n the mode of o s c i l l a t i o n ,
could be the higher flowrate associated with the f i r s t harmonic producing
i n the broadband noises, caused by the flame, a narrow frequency band
more closely coupled to the f i r s t harmonic than fundamental,.
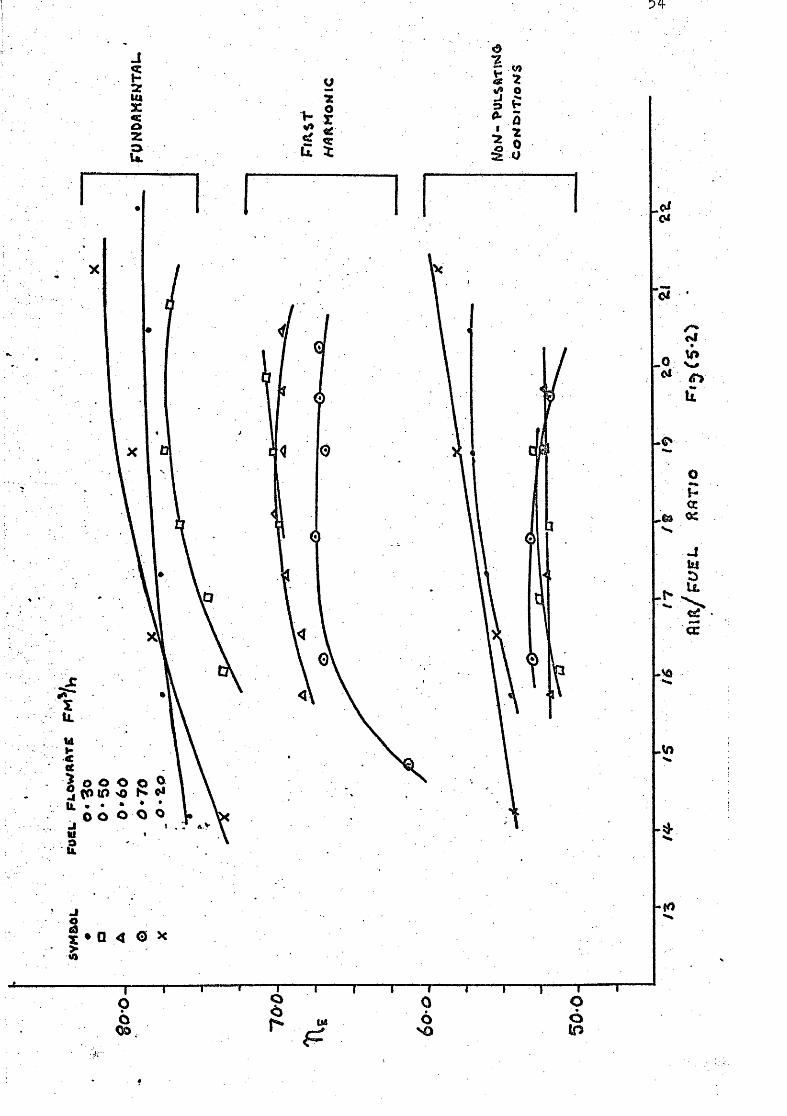
Figure (S-Z ) shows the comparison of the effectiveness of the
heat exchanger Tie f o r pulsating and non pulsating conditions.
The higher values of Tte obtained f o r the fundamental mode,
t h i s being mainly due to the larger pressure aplitudes associated with
t h i s mode of o s c i l l a t i o n . However, Hir s t (29) has suggested lower
frequencies produce higher heat transfer rates, but t h i s was not v e r i f i e d
i n the present investigation.
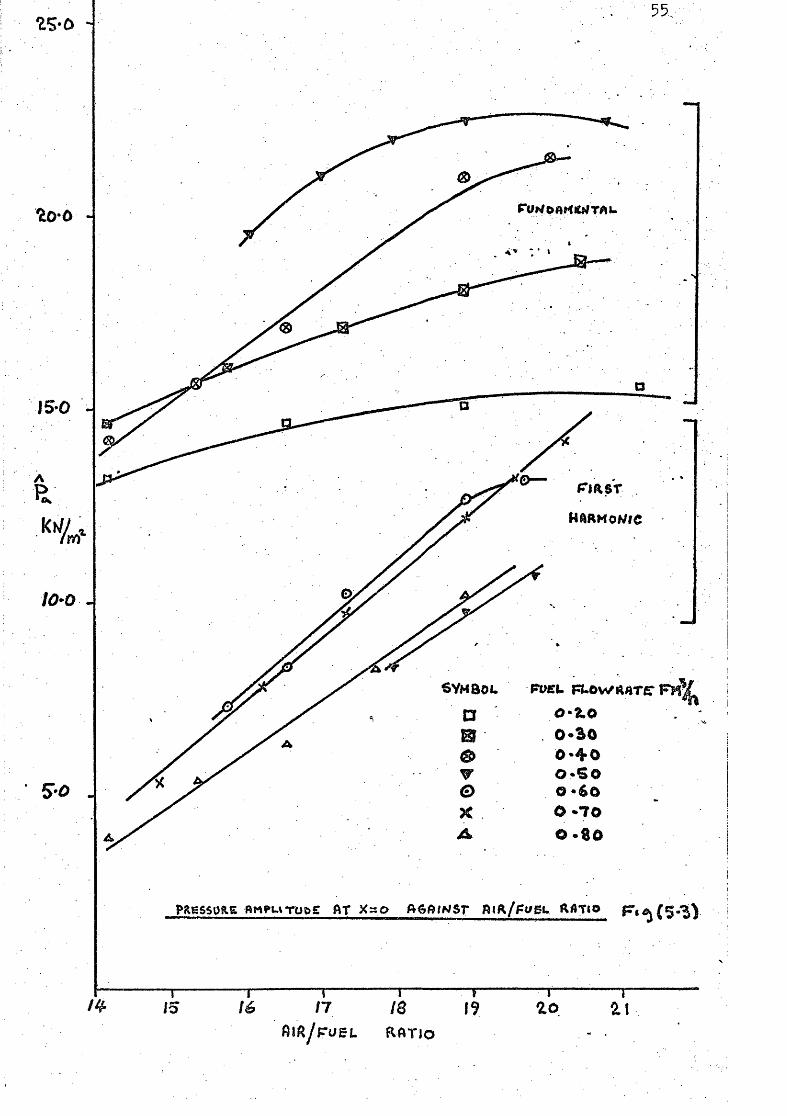
Pressure amplitudes measured at the closed end of the
combustor, against a i r / f u e l r a t i o f o r different f u e l flowrates are shown
i n figure (6-3), increases i n a i r / f u e l r a t i o caused corresponding rises
i n pressure amplitude. These results are similar to those reported
by Han by (28) v/ho suggested that i t may be caused by increased heat release
i n the combustion zone and by the increased Kinetic energy of the flow.
n5-•
If u. <: \
d
"Z <c I-«« '2 o u p M 2
£0 It
o
c
O OS
o N J Q o s: lit
"T O o
~ I -4-O ..Of
nr o
I
6
o
•4-
o
o
8
5 o -J u
cc
J
Hi X «: a: 2
5 o r
0 "Z
a-t o
o
2 I. 0
I • a <i G X
O b
"~r-o o 0 6
o • •
o
Uo
Uo-
9
2^-0 4 55..
15-0 A
A
SYMBOL
0-40
"1 j -J-/7 / a 19 FO^L R A T I O
56
3.2 Test Results
The r e s u l t s f o r the t e s t conditions shown below, are recorded
graphically i n teirms of the di s t r i b u t i o n of the standing pressure waves
for pulsating conditions and the time-independent mean gas temperature
gradients, for both pulsating and non-pulsating conditions
D e t a i l s of Test Conditions
Test Fuel Plow Rate A / F Mode of Os c i l l a t i o n
1 0.50 15.75 Fundamental 2 0.30 18.89 Fundamental
3a 0,50 18.89 Fundamental 3b 0.50 18.89 F i r s t Harmonic
4 0.60 15.75 F i r s t Harmonic
5 0.60 18.89 F i r s t Harmonic
5.3 Non Pulsating Conditions
An estimate of the performance of the experimental system
was found from a comparison of the system under non-pulsating turbulent
flow conditions to those predicted by the already well developed theory
(40 ) on convective heat t r a n s f e r f o r f u l l y developed turbulent flow.
The estimate was made by carrying out tests 1 - 5 o ? non
pulsating conditions and a comparison made of predicted and measured
gas temperatures i n the heat transfer section of the combustor.
Tests 1 and 4 were not-considered due to errors of 10; in
the predicted i n l e t gas temperatures to the heat transfer section of
the combustor. Test 2 figure (5-/5) showed agreement of 3^ upto the
position X=1.8 m where the difference r i s e s to lO/o, which may be
explained by a energy l o s s occurring at the exit of the heat exchanger
to the outlet section, which the theory does not take into account.

57
For t e s t s 3 and 5 an additional plug had to removed at X = 1.47 m
to prevent f i r s t harmonic o s c i l l a t i o n s . Agreement of 24 was o"btained
up to X =r 1,47 m at which position the port plug had been removed. Past
t h i s position a marked divergence occurred, the maximum difference of 25/
occurring at the ex i t of the heat exchanger for test 3 figure (S'E3).
This may be explained by an additional energy loss from the open sampling
port at X = 1.47
5*4 Pulsating Conditions
For pulsating conditions a si m i l a r analysis was used with an
additional comparison being made, that of distribution of pressure
standing waves. The measured and predicted gas temperature gradients
showed the marked effect pulsationshad on the energy transfer from
the exhaust gasesw The maximum divergence of 22^ between predicted
and measured values occurring i n t e s t 5ffe ' . (5-37).
I n trying to make an estimate of the percentage difference
between predicted and measured values of pressure distribution, the
absolute values were used, as a small error i n the predicted position
of a pressure node would produce a meaningless error i f the difference
was based on pressure amplitude alone. The maximum difference of IC^o
occurred i n te s t 3'b figure (5*-Jt5),
The measured pressure o x c i l l a t i o n s could be assumed sinusoidal
- maximum d i s t o r i t i o n of . The measured mean pressure i n the
combustion chamber was found to be atmospheric compared to a predicted 2
value of approximately 1500101 above atmospheric pressure for a l l
t e s t conditions i e an increase of 1.5 ^ above atmospheric pressure.
5.5 Frequency Measurements
The table below shov/s, the measured frequencies compared to the
predicted values using the method proposed by Hanby (Section 3-5 )

58
A Comparison of Measured and Predicted Frequencies
Test Measured Frequency Predicted Frequency % Difference ^8.0 63.0 31.0
2 ^8.0 63.0 31.0 3a 53.0 70.0 33-0 3b 200.0 220.0 10.0 k 218.0 23%0 6.0 5 202.0 227.0 •12.0
Reasonable agreement was found for o s c i l l a t i o n of the f i r s t harmonic
( t e s t s 3b - 5 ) . However, large differences are found i n the fundamental
mode of o s c i l l a t i o n ( t e s t s 1 - 3a).. The predicted. frequencies being based
on measured time-independent meaii gas temperature gradients. Figure (5-^)
shov/s t y p i c a l predicted gas temperature amplitudes i n the heat transfer
section of the combustor, for both the fundamental and f i r s t harmonic.
I t can be seen that the temperature amplitudes are far larger i n the
fundamental than i n the f i r s t harmonic. This could be a possible
explanation for the large differences found i n the frequencies for the
fundamental mode of o s c i l l a t i o n , since the basic frequency equation uses
only the time-independent mean gas temperatures.
5.6 Time-Independent Axial Gas Temperature Measurements i n the Combustion
Chamber
As' i t was not possible to take transverse temperature measurements at
various cross-sections i n the combustion chamber, the measured
time-independent a x i a l gas temperatures are shown plotted on the graphs
of gas temperature gradients. V e r t i c a l transverse temperature
measurements were possible at X = 0.229 ^ a ty p i c a l distribution i s shown
i n figure (5-5)- The percentage difference between a x i a l and mean gas
temperature measurements at t h i s section of the combustion chamber are
shown below for a l l t e s t conditions
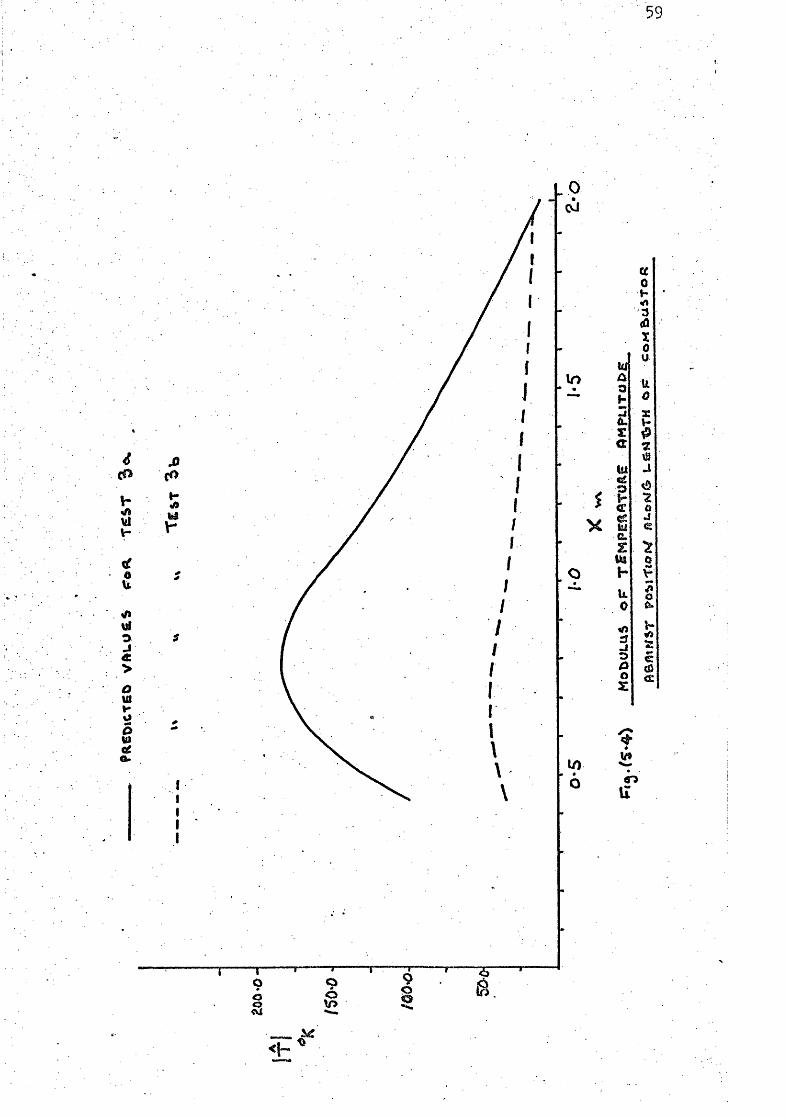
59
Ml
o U
0
> O ut I -u
O #
o
—7~
O
0 oJ
in h
X e
G. s to h u 0 =f
o
I/) < O
0
t 0 u
u X V-
J i <s
z 4%
o M V
I -
c: t0
ir
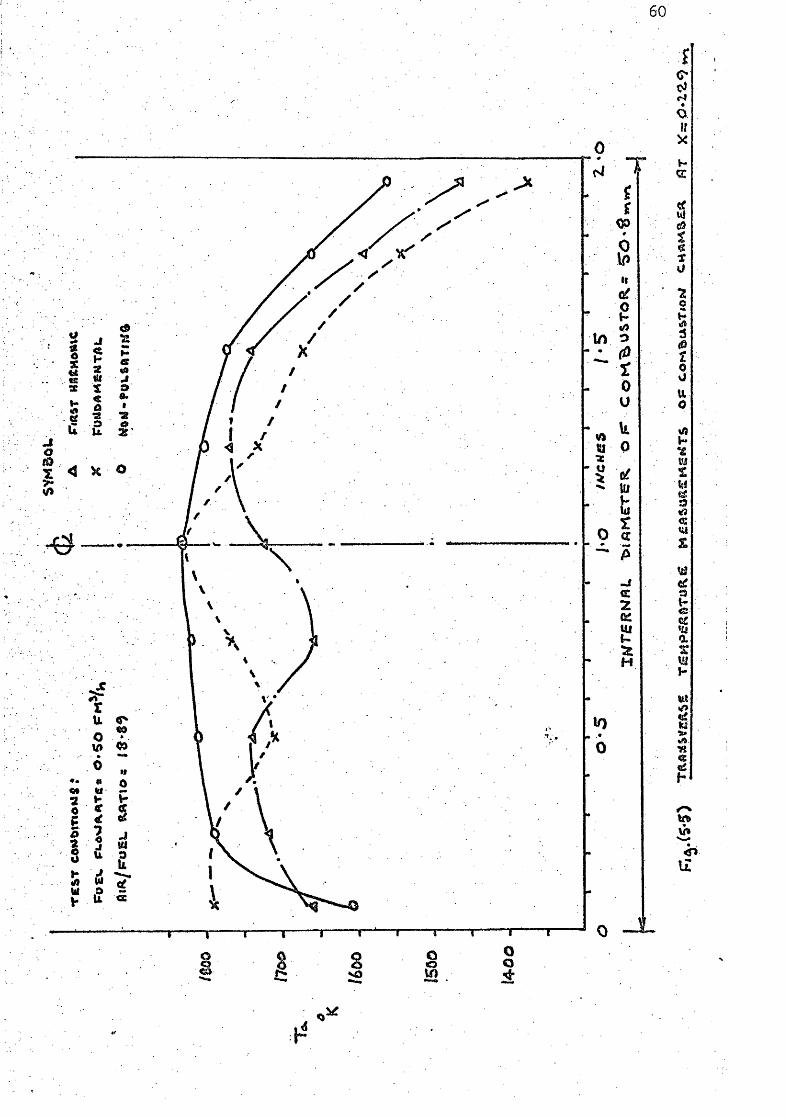
60
o
I
I £ i ? S 1 G 2
(9
0. I
< H O
0
T T —r o o so
—r
o
In
«0 0
f
It
(/}
0 u k 0
1;
- i A: 2
I!? H
- 1
o If
ui
u
o s -J t 0 O tt
W
Ui
V-
'a a
18
Q o

61
Test Percentage difference between mean and a x i a l gas temperature at X = 0.229 m
Non pulsating Pulsating
1 2.5 2.0
2 3.0 3.0
3a 3.0 7.0
3b 5.0 3.0
4 6.0 2.0
5 6.0 4.0
I n making a comparison of predicted and measured time -
independent gas temperatures i n the combustion chamber, the percentage
difference was based on the difference of the maximum temperatures
rather than on gas temperatures at corresponding positions, A maximum
difference of 22^ occurred i n t e s t 3a figure (5-'2L4).
The predicted instantaneous gas temperatures for pulsating
conditions showed large temperature o s c i l l a t i o n s . Figure (S*!) shows for
the conditions of test 5a temperature variations of various p a r t i c l e s
passing through the combustion chamber (path l i n e c h a r a c t e r i s t i c s ) for
different instances i n time. Figure (5-9) shov/s the pressure variation
each path l i n e experienced on i t s path through the combustion chamber,
and figure (5-8) shows the consumption of propane i n terms of propane
mass f r a c t i o n XCH for each path l i n e . ^hese were t y p i c a l of a l l tests
considered, the following table showing the predicted maximum
temperature amplitude for each t e s t condition.
Test 1 2 5a 31 4 5
Maximum gas temperature
amplitude °C 500 515 425 90 145 195
Also shown i n figure (5*^) i s the consumption of propane XCH for non
pulsating conditions the comparison suggesting no marked overall
increase i n combustion i n t e n s i t y being achieved.
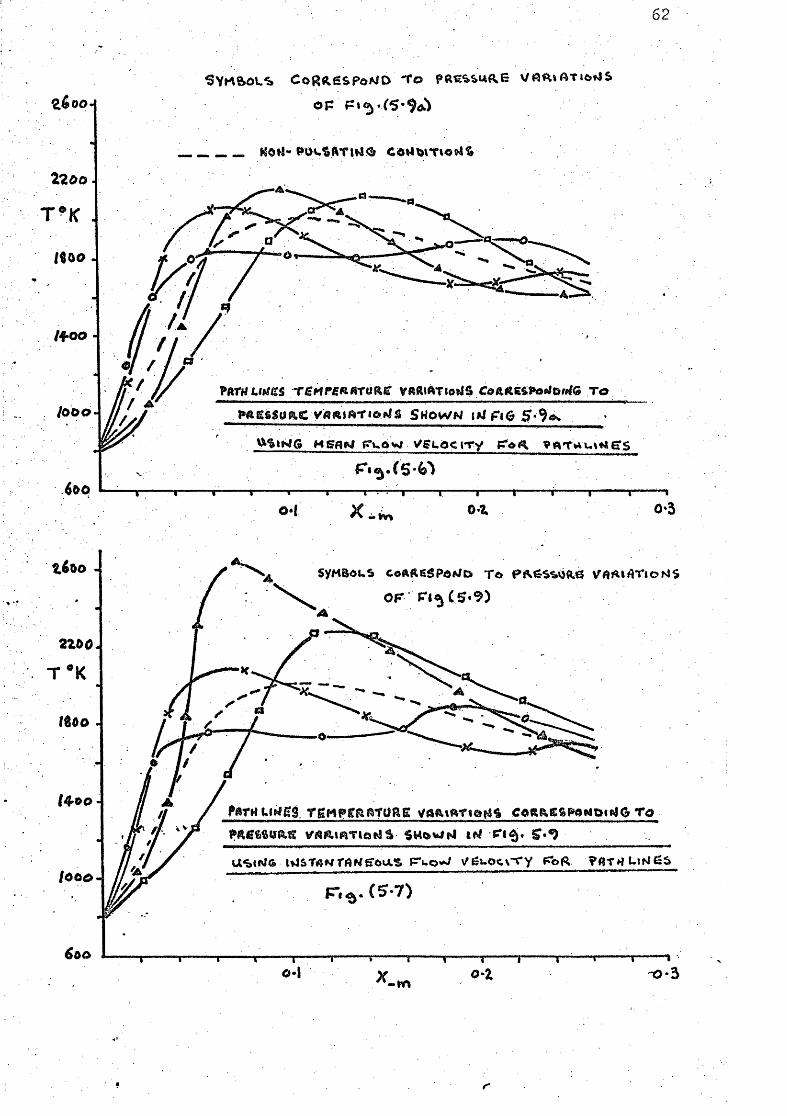
62
O P
mo A
li-OO A
1/
1 )l • \ 1—\— I x—r—. r —s— 0'
-I 1 ^ 0*5
» I 1 \ 1 r ? J J — — J 1 1 1 1 1 X
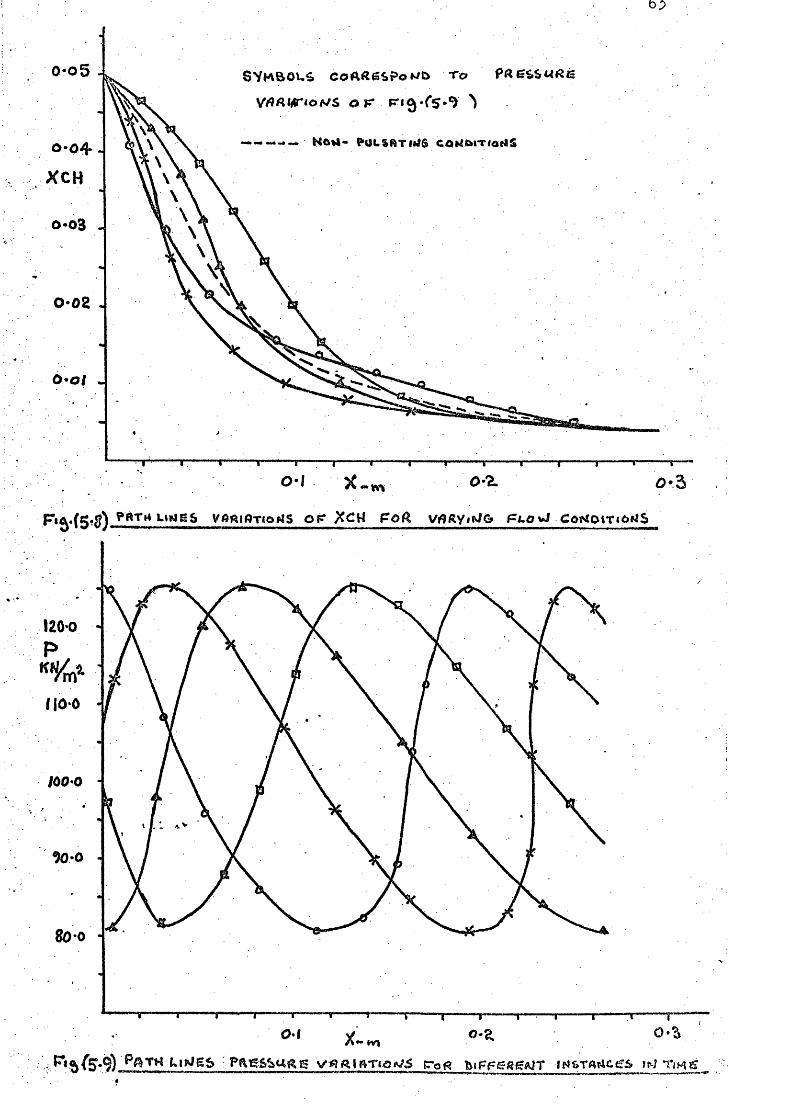
J
O-02 J
120*0 p
8o-o 4
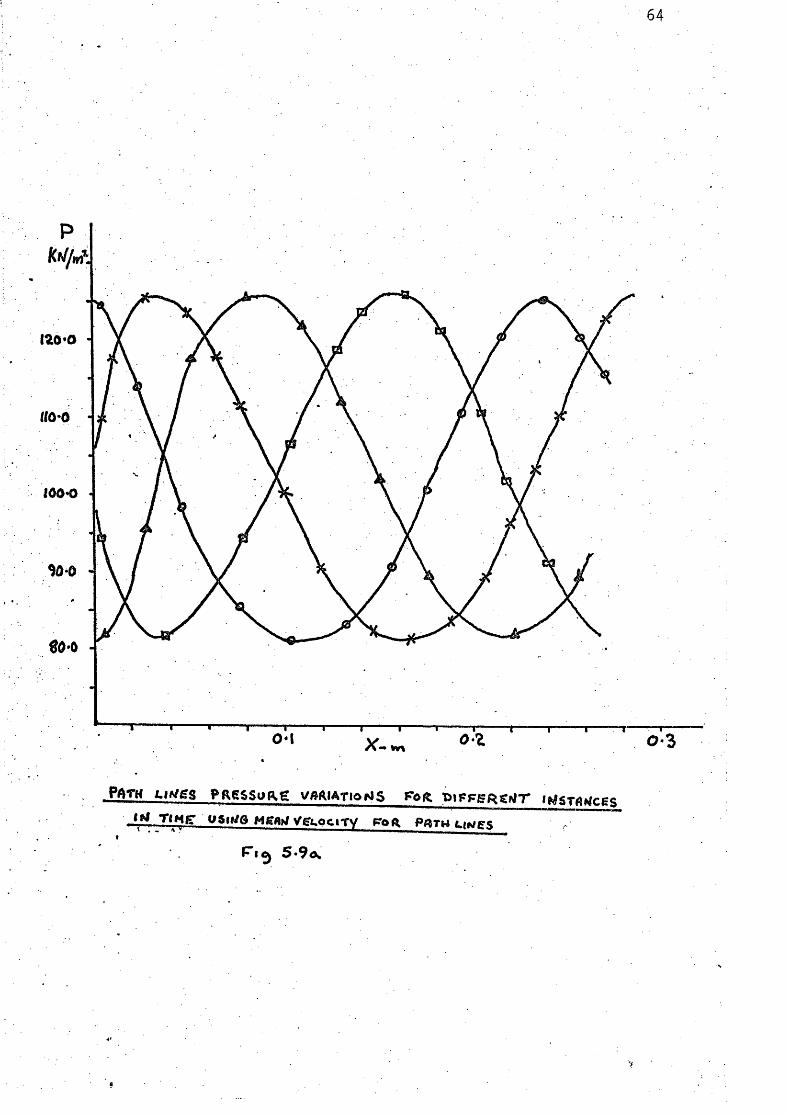
64
<M T t H g USlf/Q Mgftrf VSuocirY f^Oft PftTH L W g s . "

65
The measurement of temperature o s c i l l a t i o n s of the kind quoted above
require "very elaborate techniques, measurements of t h i s nature were
not attempted i n t h i s investigation. However, Brovm ( 39 ) has
reported temperature o s c i l l a t i o n s associated \7ith the pressure o s c i l l a t i o n s
i n a pulsating combustor which are of i n t e r e s t . At a time-mean gas
temperature of 975°C, the instaneous maximum and minimum temperature
measured were 1400°C and 470°C, the temperature peaks were 0-20° out
of phase with the pressure.

66
TEST 1
Fuel Flowrate O.50 FmV^
Air/Fuel Ratio 15.75:1
Fundamental llode of O s c i l l a t i o n

67
o
g O
O I -«e
I V-
t t
la A. tu a
a
c w
o o o
CL I
O 2
4^
o }r
u
o
X
6
10
• >«
"T-o •r r
o «>9
1 r o
-g r o o
0

68
o
o J
ui| o "2,
1 ^
u 0 3 h
UI o IS
tL O
J £> o X
u
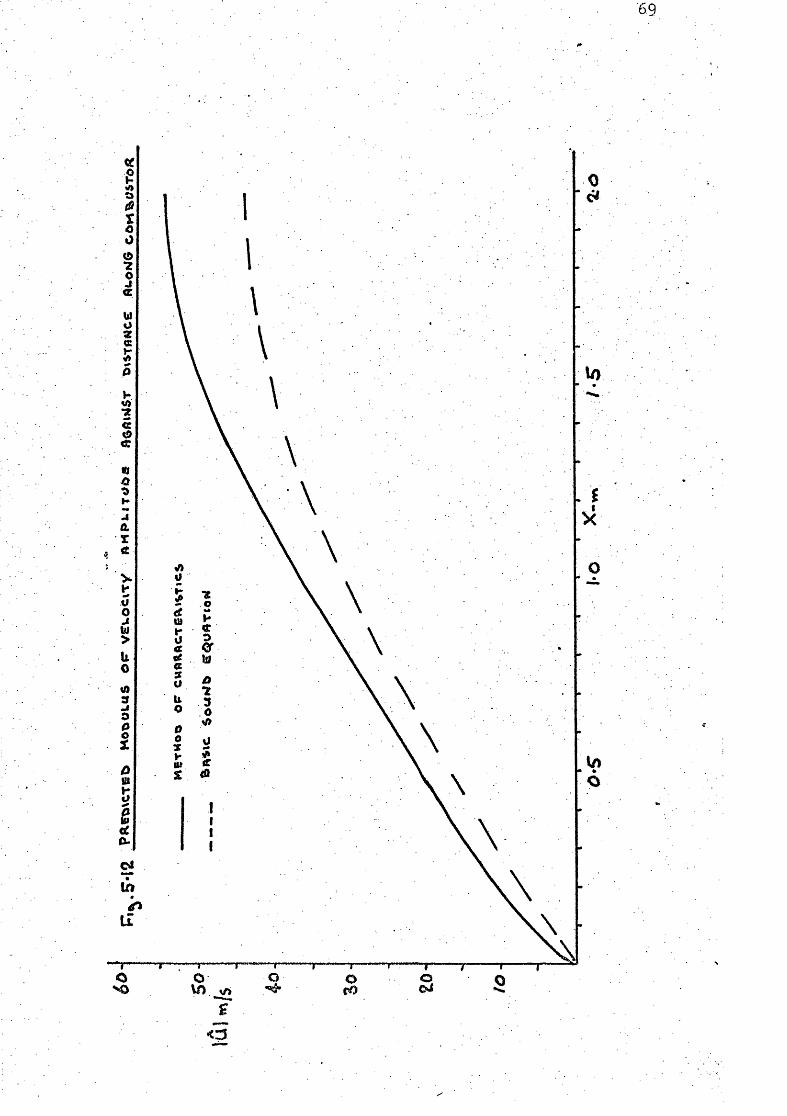
69
\ \
\ \

70
Vi
o lb o s Ui Q.
tu I -u o Mi
0. i3 <c p tu
$
u o It o
c
o o
CO
P o
<£
J
0-I -2 o •Z
o
I
IP o
II- ^
Q O
o NO
o c/
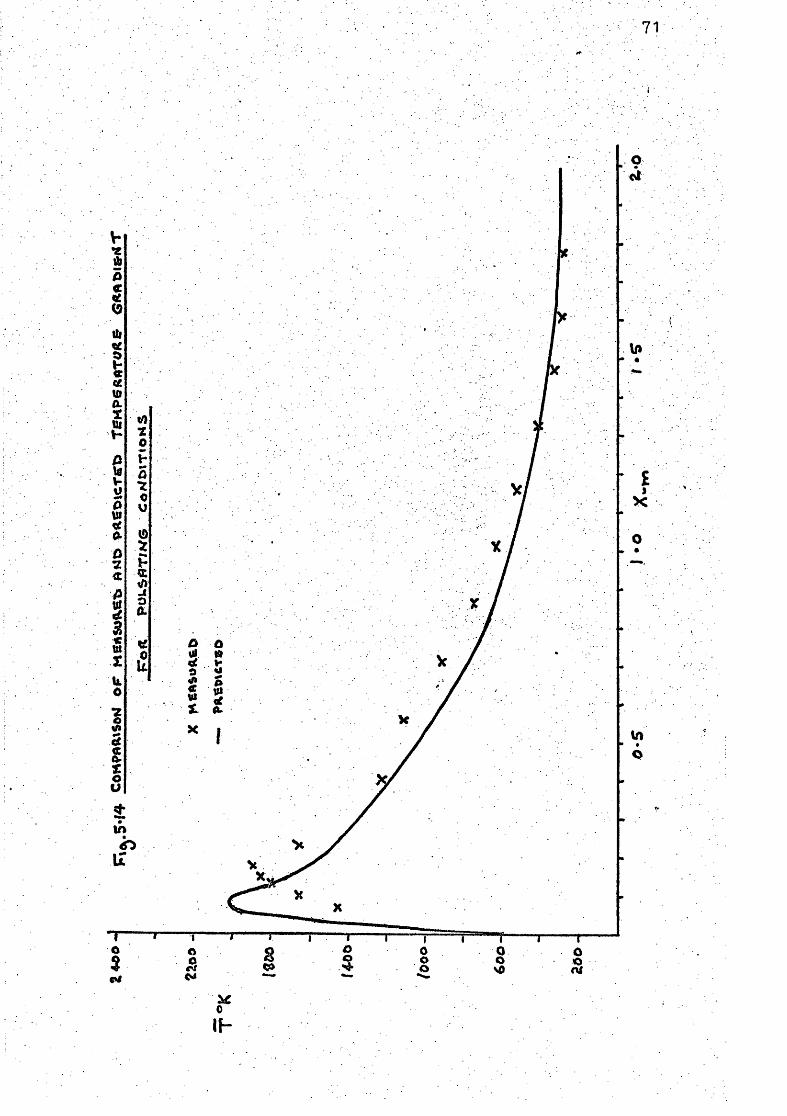
71
s
o •
£ I
0
72
TEST 2
?uel Plowrate O.30 Pm /h
Air/Puel Ratio 18,89:1
Pundamental Mode of Oscillation

73
O If
3 o
ut
Ui 0., r
\r
e
Ul
!' O £ I
VI
w tg cc Ui s:
t
12 O 0 O •2
O D-
I •2 O 2
•5S O •>•
V-« o o
•z
or
I »
o
IP
• *
'"ir— —p... —It .—^ . — 1 — —
c o o 0 o o o o o o o c< o
* "
O o 0
O o o
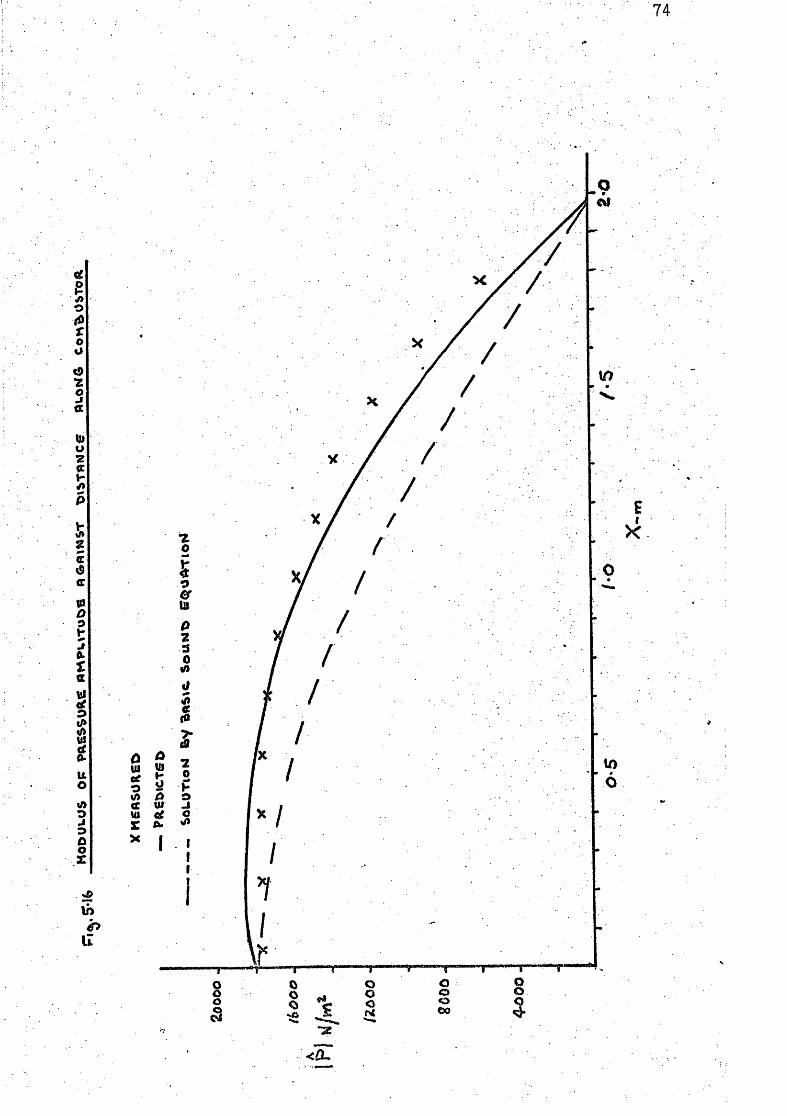
74
o
o o
o a
u
i -
e
/> o
J
s 0. u o
ii o o
UJ VI
1
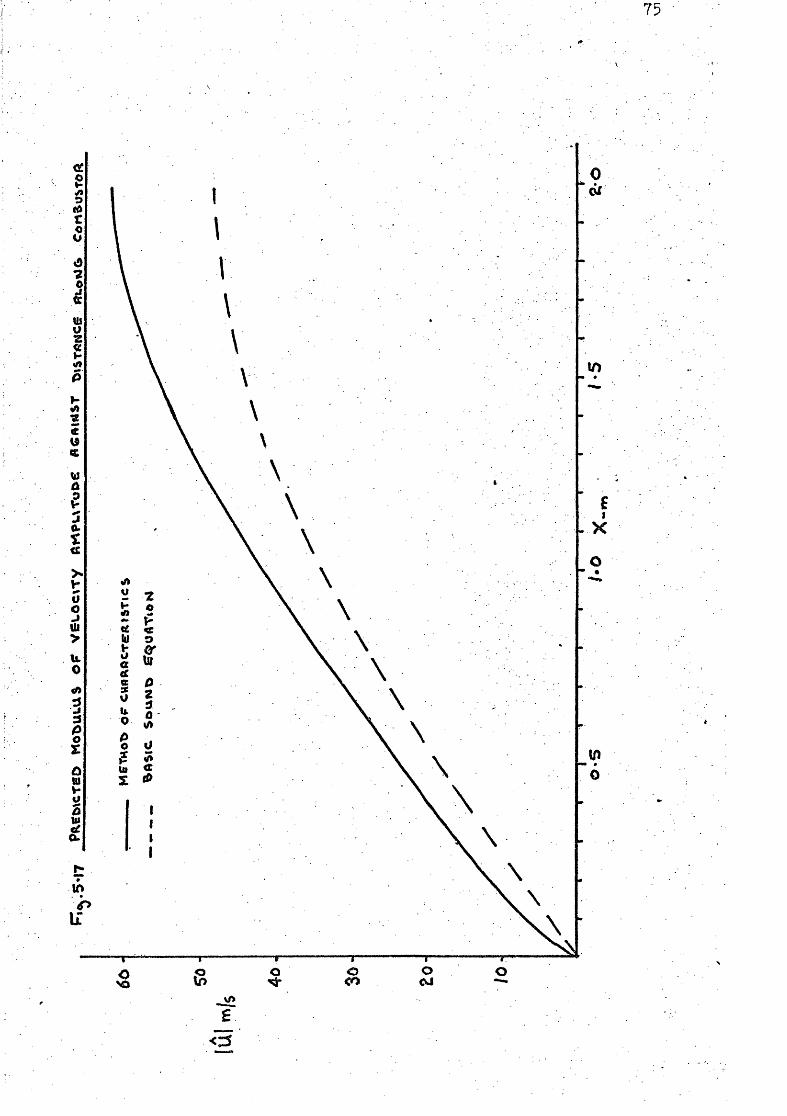
75
0 6s
X
tn o
<::5
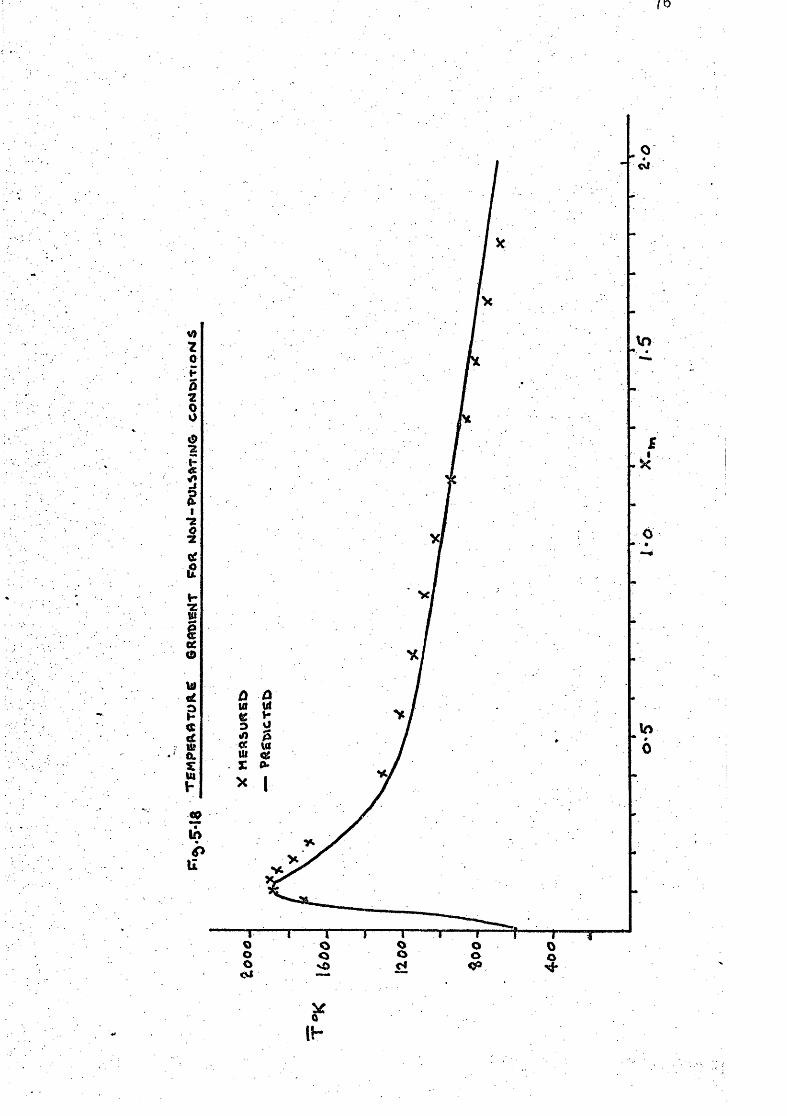
Z 0 p 2 O o
t O •z
Vi
1
?
s
u
10 UI
III ^
It-
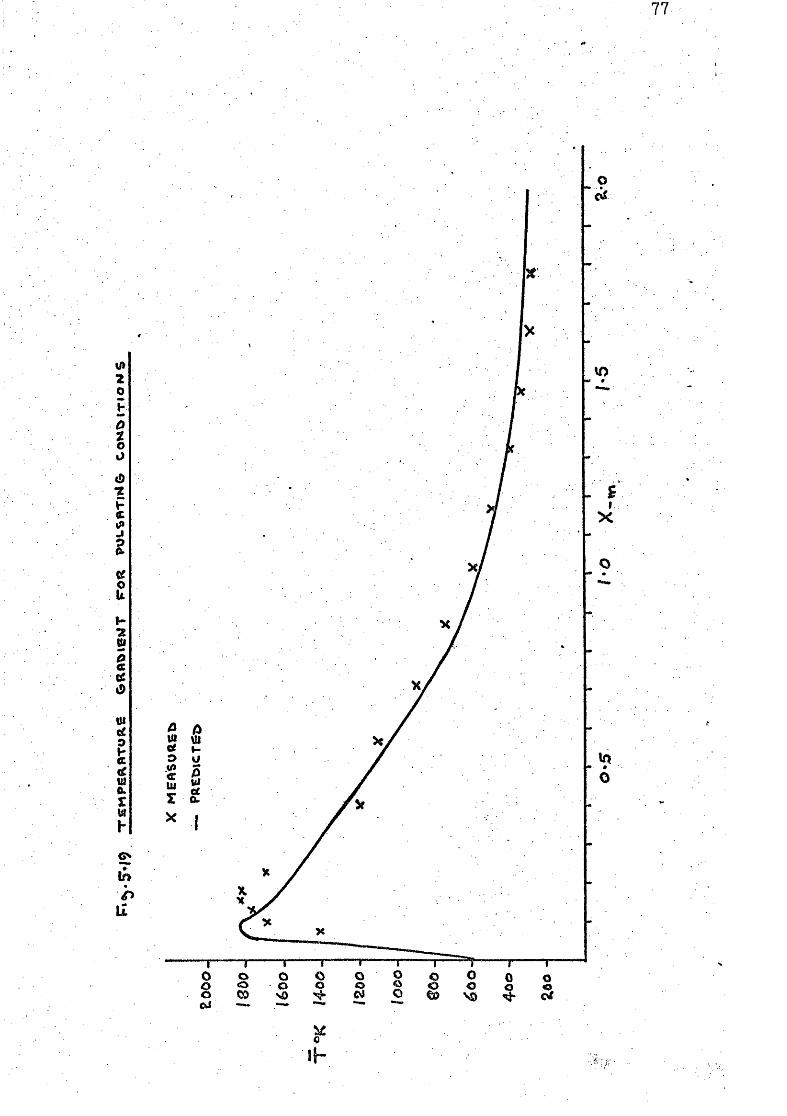
77
2 o
o t o o
-%
J i
I Of o u I -•2 cc
ui l
? w D.
/3 0
—^— 1 1"""" — I P 0 o o o o o o o o CO CI —»
-T— —P O 0 0 o O o o erf
c
78
TEST 5
7 Fuel Plowrate O.5O Fm / h
Air/Fuel Ratio 18.89sl
Test 33- Fundamental Mode of Oscillation
Test 3^ Firs t Harmonic
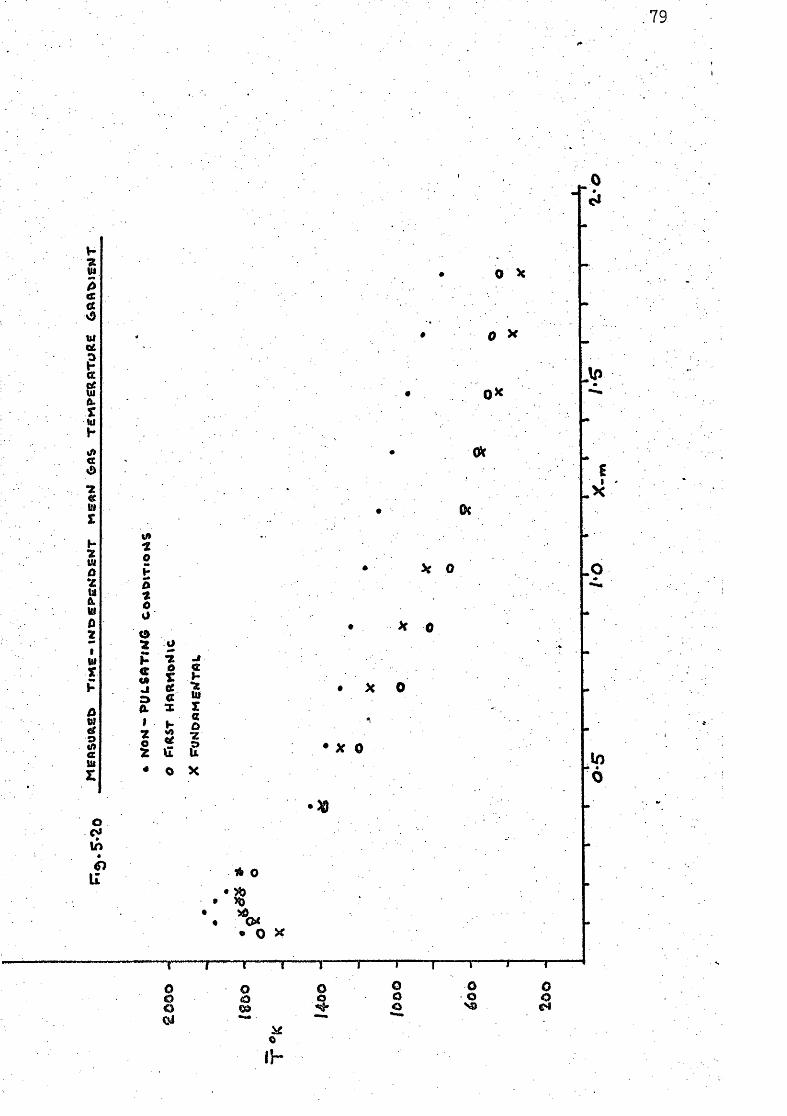
.79
.0 •
UI
a v3 tti
? CC s; 0. S h
bil £
Hi uil
u ml 0
I
o (/» e
0 ^
0 X
bo ox
0
0(
1 o
0 o
? 52
^ 0 L o
I -(A «l a t o
UI
I cc a
• X 0
X 0
• o x in o
o
tn
U
:0
It o
• o x
o o o O o
o 0
o o o
o o
o o
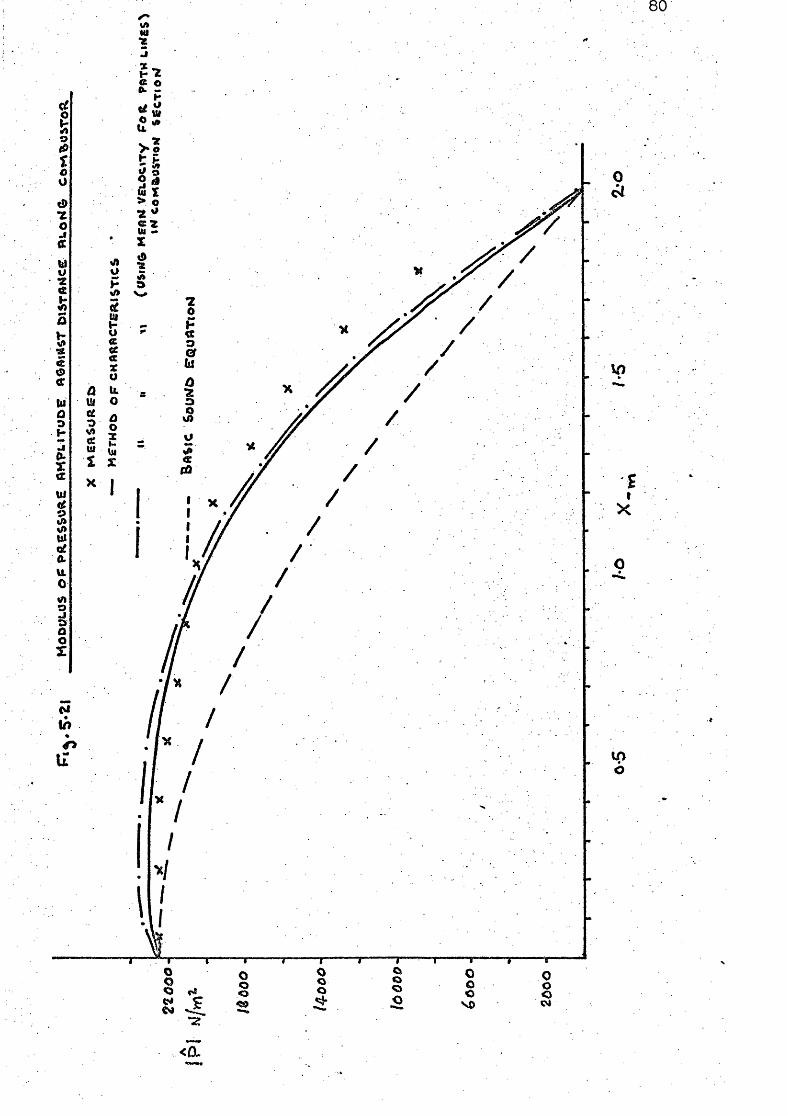
80 r-Ul •as
//
0
i n
X
i n 6

81
\
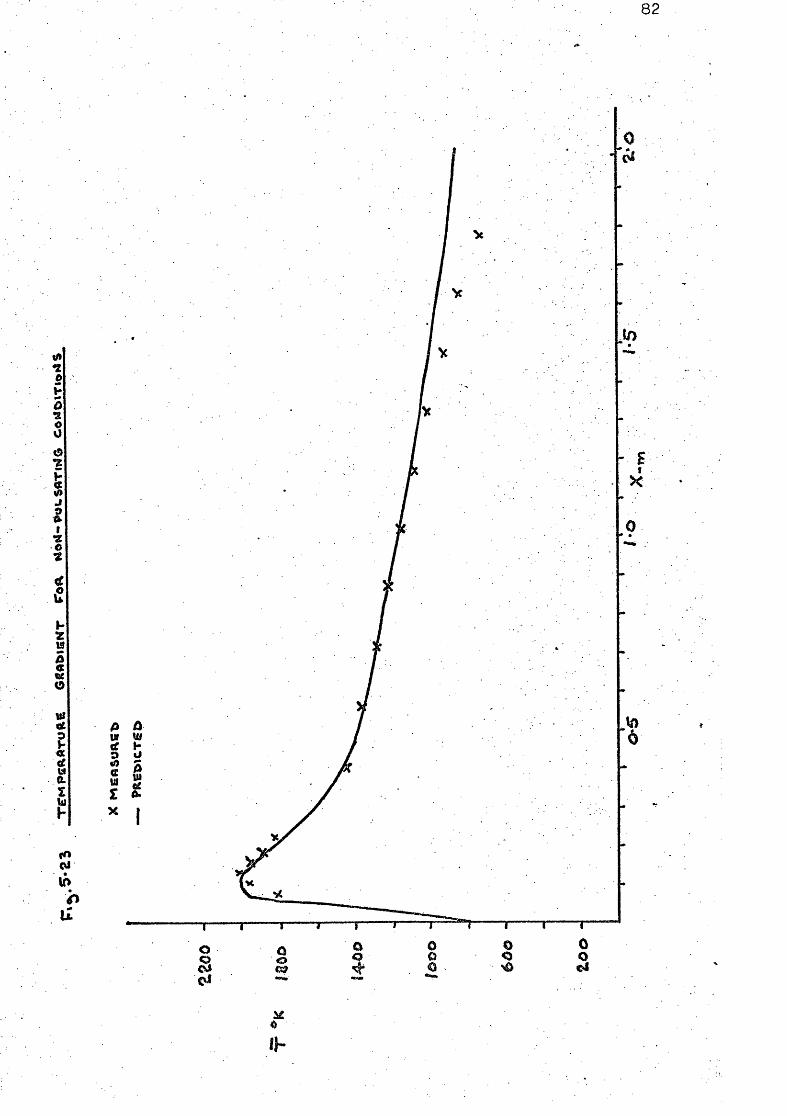
82
o
o O
o
2 I O
2
O
o I -
a. X Ul
m
o
0
Uf UI
II-
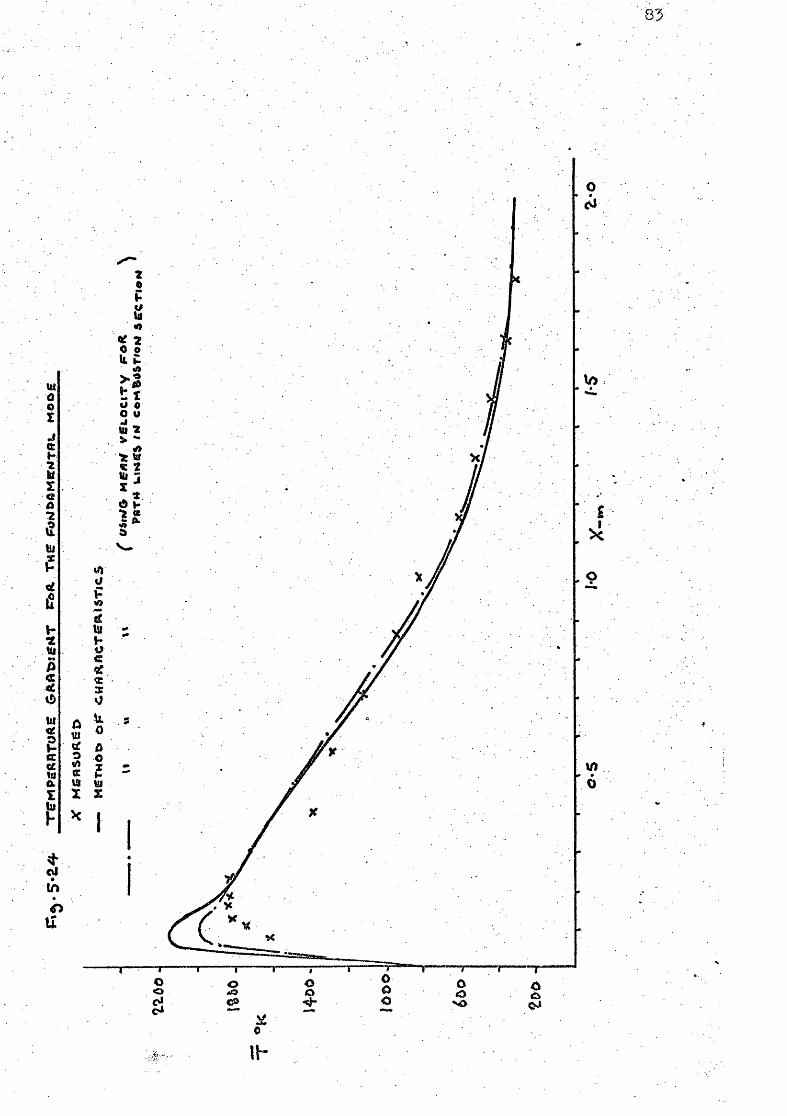
85
0 o X Jt tt h •St b(
<6
5
f
£ I -t
VI
lU
cc «£ 111 fr tu
cvl tn
i
Ul Ul
r 2
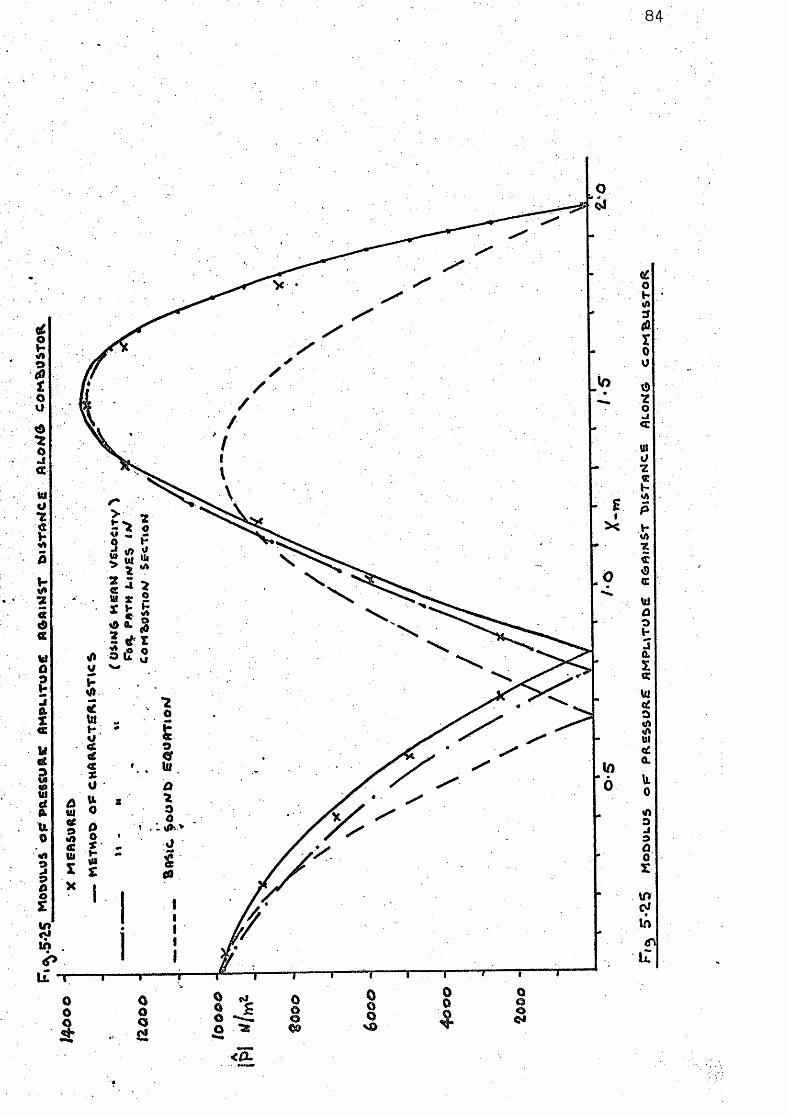
84
o h
X 0
u
o UI
«
o
VI
o l -U
s to a ttl
IL 0 <nj
9 Q 0
10
in
IT
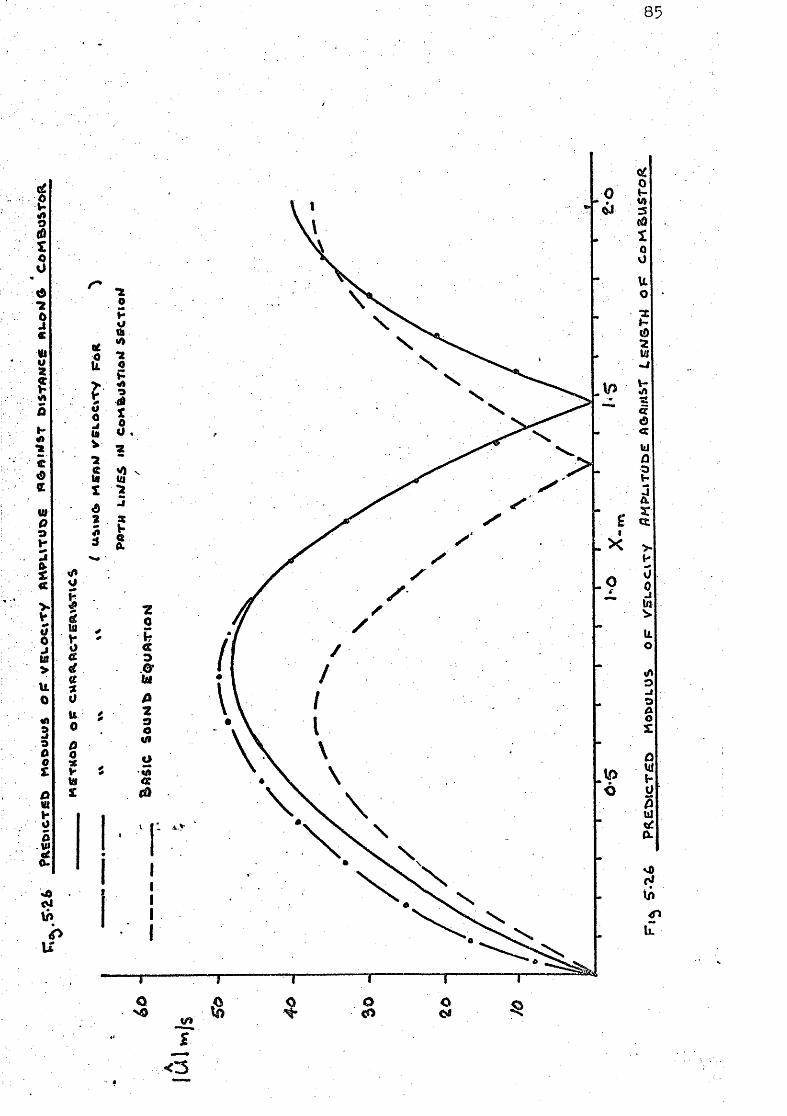
85
«n
O
ttf
I <£
V u 0 J ut > u o 4A 3 . a O X
I -o
s a
u u 0 o o •x
\a
U

86
1 c t tt 1
Id
> tit
MS
a
0-
13
VI
u
o
87
1'esq: 4
3 Fuel Flowrate 0.60 Pm /h
Air/Fuel Ratio 15.75:1
F i r s t Harmonic
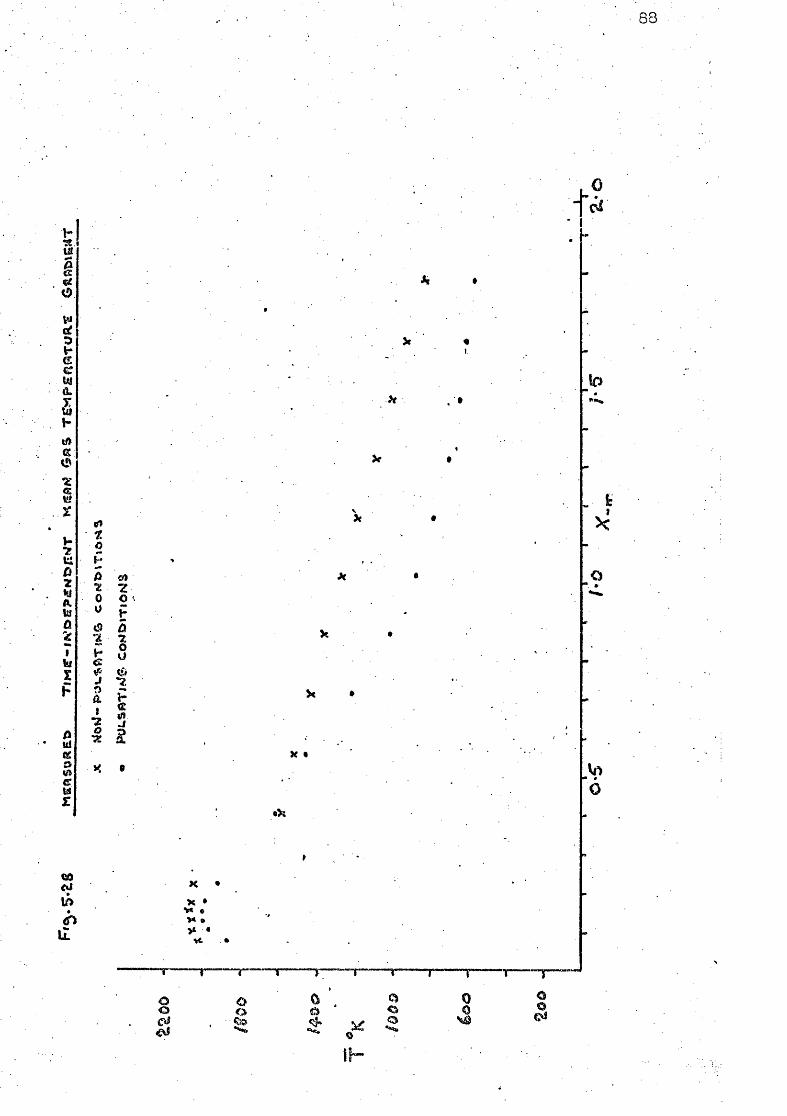
83
•St.
g 0
0
v-i
W
X
•ar
7 fall t f
111 (£.
G Mi
0 O
O O
I
.to
6
«i9
* >« e
O o o o
OS
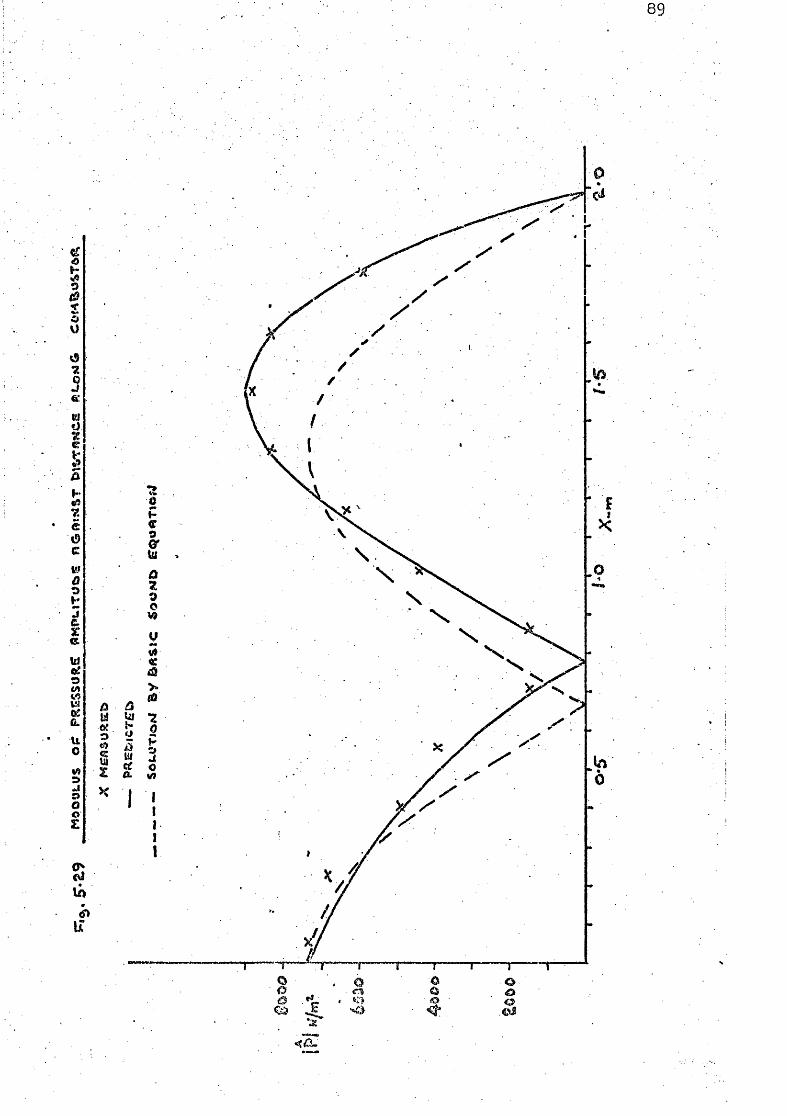
89
t V)
o J CI O
7.
e
« UJ o! t5 < V5 U} u o O O z
ir
/3
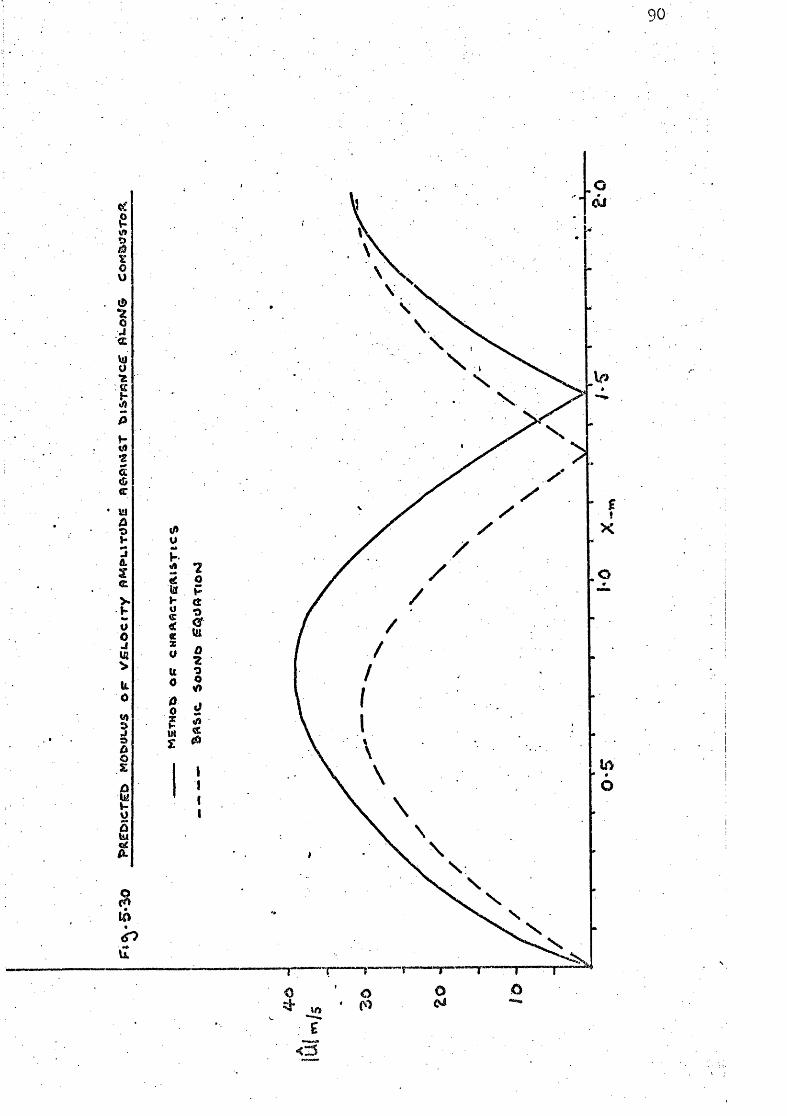
90
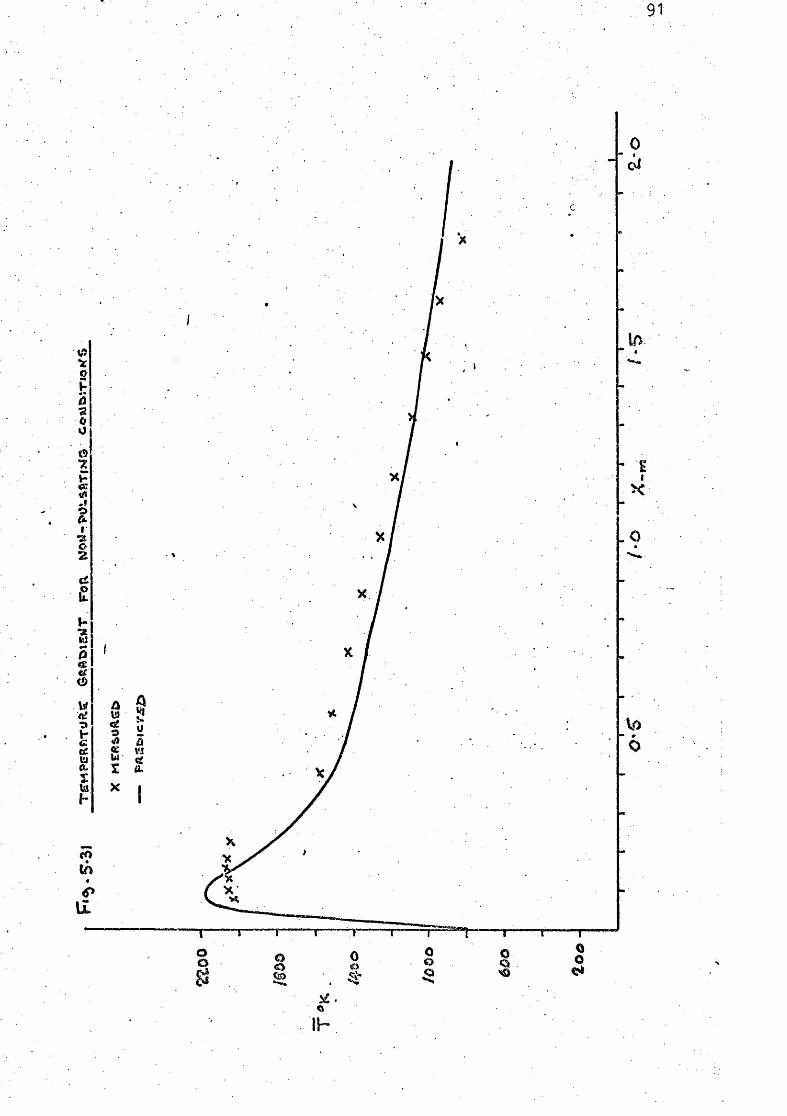
91
0
1- H I
o
6
o o
0 5-
Q -T-0 o <5*
2 .
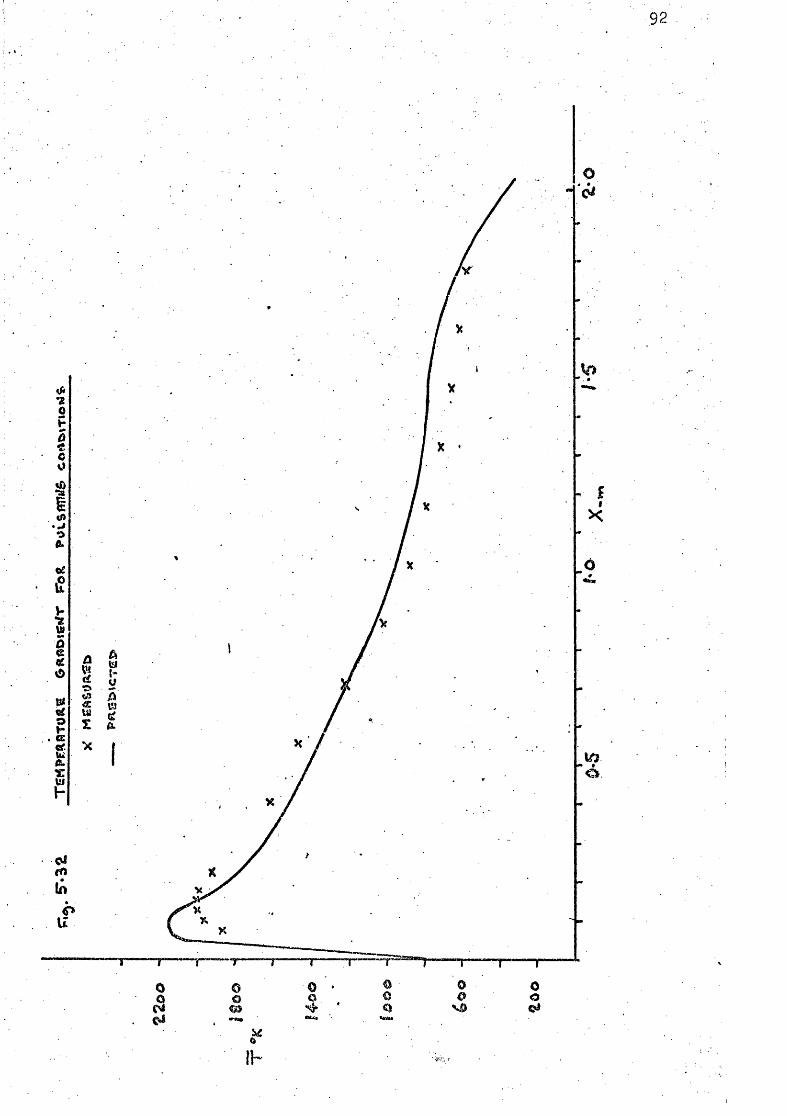
92
o
IK
O o
95
TEST 5
Fuel Flowrate O.6O
Air/Fuel Ratio 18.89:1
F i r s t Harmonic

94
O 6d
€
«: cd O
«l cC V-i «: g
<A <£ O •z
X ;
VI
p •
VI OL VI
a I
ui z t u ' «e o «n
UI XI
O
0 O
I ft. f
0 f S 2 O o o •a p s 0.
I.
VP o
-V*
O O O o CO
1 r
s ^ o o o
o o o
Ml C£:\ o I -<z: 6i VI
Ui
«!)
z ut S V-r. hi /) UI
a
I
td t
c: ut
in

95
0 I*
I 1) •a
4
fell I)
Jl 0.
4-
It
•a: Ml I '
5 Ui
X 0 mm
V-cr ui
1 «
2 0 5 J o
C5 o o
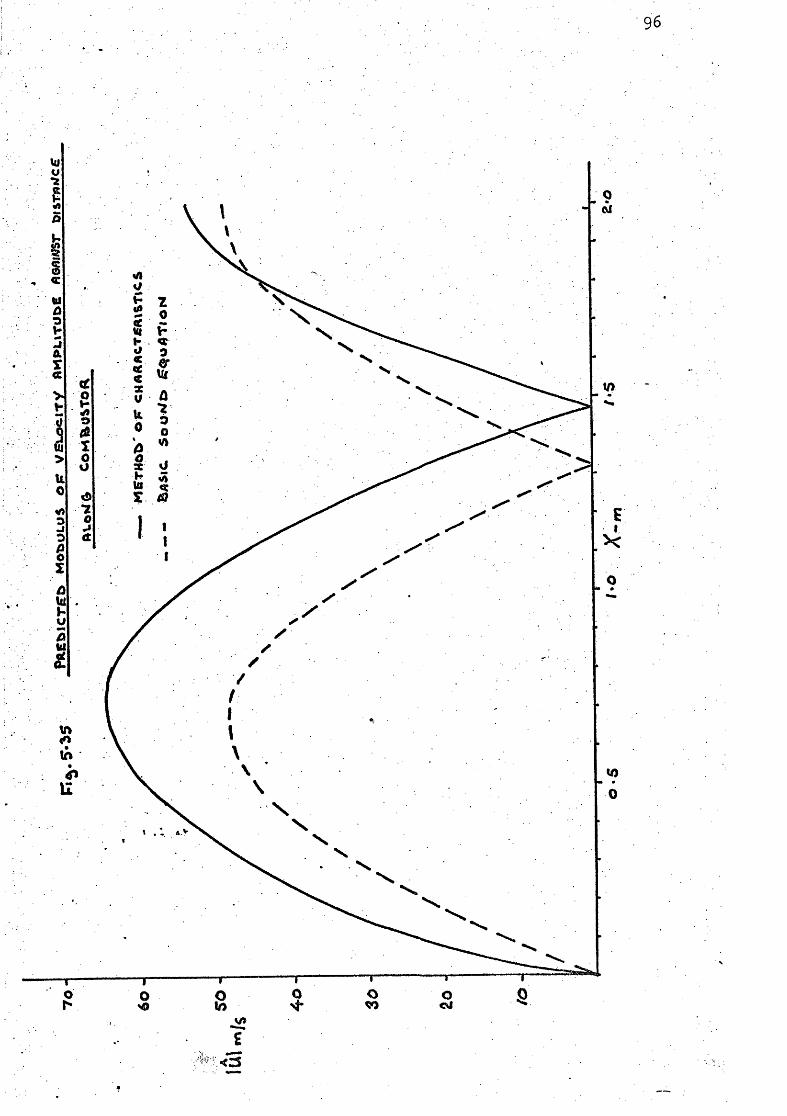
96
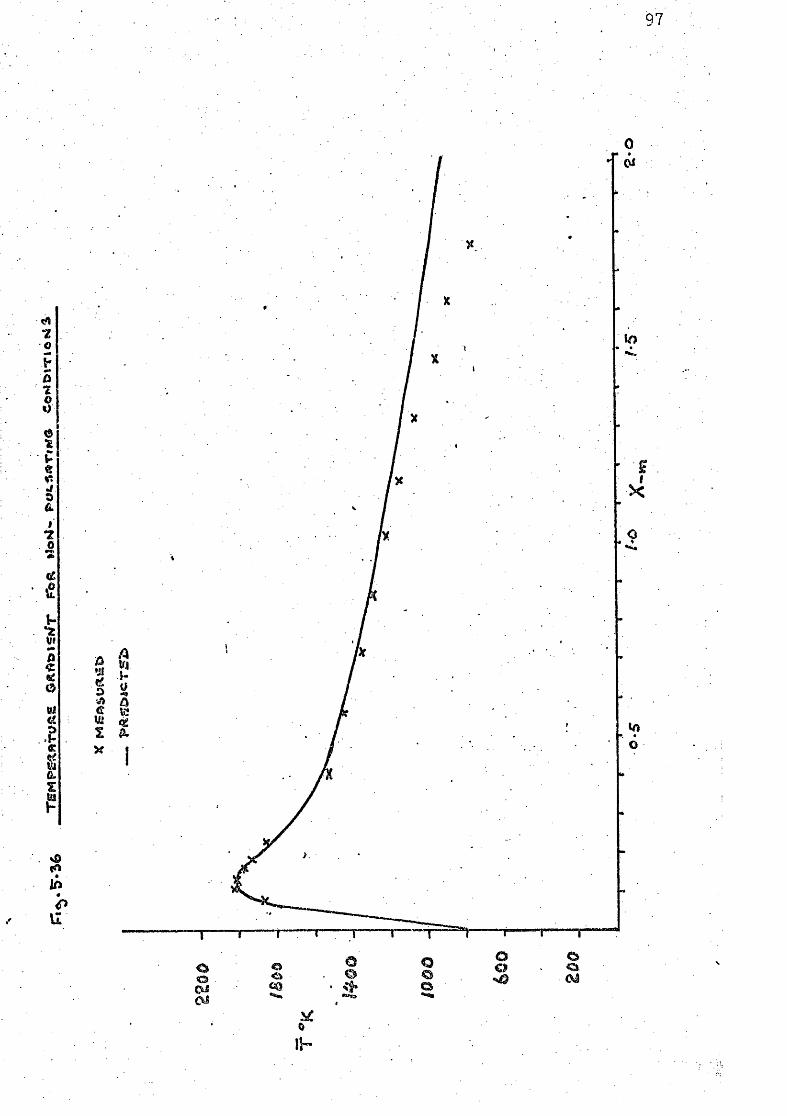
97
•z o ? a % o o
e
I 0
I -
I O Vl
z
fi. {2
«

98
1 G Ml
V
t o o
&
u
i c£i I'i ft? o I -
Uf a. U!
I I D </>
f£f V-O a UI
T \ r r ^ J ^ J.
o o o Q

CHAFJIER 6
Conclusion
99
Conclusion
A pulsating combustor producing longitudinal acoustic oscillations
was constructed and a mathematical model of the system developed. The
mathematical model predicted with reasonable accuracy the gas temperature
gradients and d i s t r i b u t i o n of the pressure and velocity standing waves.
I t was unable to predict the acoustic energy required to determine the
amplitude and frequency of o s c i l l a t i o n due to the use of a much simplified
combustion model. The combustion model although greatly simplified
served well as a prediction of i n l e t gas temperatures to the heat transfer
section of the combustor.
The quasi-steady state theory gave a satisfactory description
of the effects of longitudinal convective heat transfer rates i n the
heat transfer section of the mathematical model.
The measured and predicted results showed the effect large
temperature gradients have on the d i s t r i b u t i o n of standing waves, the
effects are summarised below :
a) Wavelength of the standing wave, decreases with
decrease i n temperature.
b) Hodes and antinod.es are displaced i n the same
dir e c t i o n as temperature f a l l .
c) • Pressure amplitude at pressure antinodes increase
i n the direction of temperature f a l l ,
d) Velocity amplitude at velocity antinodes decrease
i n the direction of temperature f a l l .
e) Resonant frequencies are increased r e l a t i v e to ambient
conditions
100
Using the simple method proposed by Kanby (28) f o r predicting
the frequency of operation^ >',J5 as enable agreement was found f o r
frequencies of the f i r s t harmonic, where predicted gas temperature
o s c i l l a t i o n s were of small amplitude. However, large differences i n
frequency were encountered with the fundamental mode of o s c i l l a t i o n , where
large temperature o s c i l l a t i o n s were predicted.
When using the basic equation of sound, t o predict the
standing wave d i s t r i b u t i o n s , large errors were obtained. This method
having been used by Hanby (26) who reported satisfactory agreement with
experimental re s u l t s ,
. The following suggestions are made f o r future work. I n attempting
to predict the amplitude of o s c i l l a t i o n i t w i l l be necessary to isolate
such variables as ; f u e l i n j e c t i o n system, Air/Puel r a t i o , mode of
o s c i l l a t i o n and heat release ra t e , so as to understand what part each
plays i n the d r i v i n g mechanism of combustion driven o s c i l l a t i o n s .
I'o develop a more advanced combustion model i t w i l l be necessary to
have more knowledge on how properties such as activation energy and
flame eraissivity vary with temperature and flow conditions.
101
R E F K R E N 0 E S
1. General survey of pulse comTDustion.
A.A, Putman . 1st I n t . Symposium on iPulsating Combustion, University of Sheffield. September, 1971
2, The pulsations and energy transfers i n a double-o r i f i c e pulsating combuster.
O.K. Beale Ph.d Thesis, University of Durham 1974 (To be published).
3. Pulsating combustion - The collected works of
F.H. Reynst ed. M. Thring Pergamon Press I96I
Non-steady Flame propagation
ed. G.H. liiarkstein Pergamon Press I964
5. Combustion - driven oscillations i n industry
A.A. Putman American Elsevier 1971
6. Vibrational Combustion
t r a n s l n'3)-TT-62-942/l+2, A p r i l , I963. B»V. Raushenbakh.
SE;;TICS ,
102
7. Supersonic Flow and Shock Waves
R. COurant and K.O. Friedrichs Interscience Publishers, New York, 1948,
cs 8. An Introduction to the Method of Characteristi
M.B. Abbott American Elsevier, New York I966
9« Gasdyifinamic investigation of the pulse Jet tube
P. Schultz - Grunow NAGA TI.ai31, Parts I & I I February, 1947
10. Nonsteady Duct Flow s Wave Diagram Analysis
G. Rudinger Dover Publications , Inc. I969
11* A Numerical Solution of Unsteady Flow Problems
R.S. Benson R.D.GAHG and D. Woollatt I n t . j . Mech. Sci. 1964 Vol.6, pp II7-I44
12. The Dynamics and'Thermodynamics of Compressibl< Fluid Flow. .
A.H, Shapiro Vol. I and I I Ronald Press Co., 1954
13. Effects of Variable Specific Heats and Gas Composition on Unsteady Flow Calculations
R.S. Benson, A. V/ild and D. Woollatt Proc. I n s t u . Hech. Engrs. 1969-70 Vol. 184.Pt 3G(1)

14« Influence of pipe f r i c t i o n and heat transfer on pressure waves i n gases ; Effects i n a Shock tube,
P.K. Bannister Journal Mechanical Engineering Science Vol.6. K0.5. 1964.
15« Numerical soluation on Gne-Bimensional Non-steady Flow with supersonic and subsonic flows and heat transfer.
R.S. Benson I n t . J. Mech. Sci. 1922 Vol. 14, PP 635-642
16, Unsteady One Dimensional Compressible Pr i c t i o n a l Flow w i t h ^eat Transfer.
R.I. Issa arid D.B. Spalding Jour. Mech. Eng. Sc. Vol. I4 N0.6. 1972
17. A preliminary investigation of gas turbine combustor modelling.
D.C. Hammond and A.M. Mellor Combustion Science and Technology 1970, Vol.2., pp 67 - 80
18. Combustion S t a b i l i t y i n a Spherical Combustor
A.E. Clarke, A.J. Harrison and J. Odgers 7th Symposium (International) on Combustion, Butterworth, London, 1959.
19 • Convective heat transfer i n a gas f i r e d pulsating combustor.
V. Hanby Trans. A.S.M.E. I968, Paper No. 68-WA / t n j - l Page 1 - 5

104
20. Heat transfer i n the cylinder of reciprocating i n t e r n a l combustion engines.
W.J.D. Anna^d . Proo. I n s t n . Mech. Engrs. Vol. 172 No.36 1963
21. Heat transfer i n compression I g n i t i o n engines,
N.D. l;Vhitehouse, W.J.D. Annand and T.H. Mb. Proc. I n s t n . Mech. Engrs. I97O-7I
22. Numerical analysis
D.R. Hartree. Oxford University Press 1958
23, Theory of Sound Vol. I and I I
Lord Rayleigh llacFdHan and Co. I896
24* Comparison of combustion i n s t a b i l i t i e s found i n various types of combustion chambers.
M. Barrere and P.A. 'iSFilliams 12th Symposium ( i n t ) on Oombustion.
25• Combustion Noise
F.E.J* B r i f f a and G.T, Williams Journal of the I n s t i t u t e of Fuel May, 1973.
26, A Study of Heat Driven Pressure Oscillations i n a Gas
K,T. Feldman and R.L. Carter August, 1970 - Journal of Heat Transfer A.S.M.B.
27. Combustion Oscillations i n Gas-Fired Appliances
P.K, Baade Conference on Natural Gas Research and Technology, Atlanta, Georgia - June, 1972.
105
28. Basic Considerations on the operation of a simple pulse combustor.
V. Hanby Journal of the I n s t i t u e of Fuel - Nov. 1971
29. Heat Transfer t o a resonant pulsating a i r stresun i n a pipe
S.L. Hirst Ph.d Thesis, University of Durham, 1974•
50. Theoretical study of pulsating combustion.
D. Bhaduri Indian Journal of Technology I968, 6 ,245
51. A theoretical model f o r stable combustion inside a refractory tube.
J.L. Chen and S.V/, Churchill Combustion and Flame 18, 27-36 (1972)
52. Activation Energies i n a Baffle Stabilized Flame
P.G. Walbum Combustion and Flame 12, December, I968, Pg 550 - 556
53. Meas urement of High Gas T emperat ures with Fine Wire Thermocouples .
D. Bradley and K.J. I^lathews Jour iiech Eng. Sc. Vol,10 N0.4.I968
34. The r e l a t i o n between the t o t a l thermal emissive power of a metal and i t s e l e c t r i c a l r e s i s t i v i t y
C. Davisson and J.H. Yfeeks J.Opt. Soc. Amer,1924 8, 58I
35. The Platinum metals and t h e i r alloys E.M. ?/ise and R.F. Vines 1941 (International Nickel Co,,KewYork)
106
36. Calibration graphs - Copper/Constantan Thermocouples B.S. 1«28 : 1961
37. Calibration graphs - Nickel/Chfomium V Nickel/ Aluminium
B,S.1827 : 1952
38, Calibration graphs - Platinwn/L&o<3ium V platinum B.S. 1826 : 1952
39. Combustion O s c i l l a t i o n i n i n d u s t r i a l combustion chambers
M.W. Thring comment by T.D. Brown pg I68 12th Symposiiun ( i n t ) on combustion
40. Heat Transmission W.H. McAdams KoGraw-Hill Book Company Limited
Appendices I The determination of step length AX
11 Measurement of High Gas Temperature
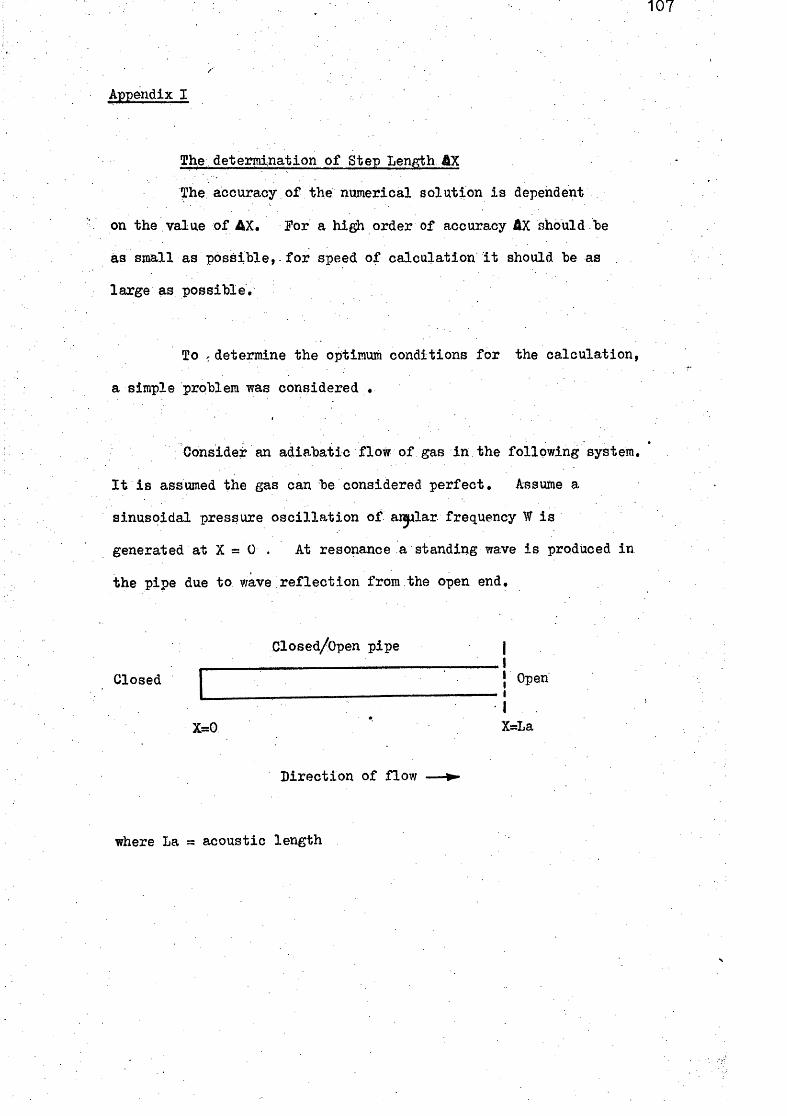
107
Appendix I
The determination of Step Length AX
The accuracy of the numerical solution i s dependent
on the value of AX, For a high order of accuracy AX should be
as small as possible,- f o r speed of calculation i t should be as
large as possible.
To .determine the optimum conditions f o r the calculation,
a simple problem was considered .
Consider an adiabatic flow of gas i n the following system.
I t i s assumed the gas can be considered perfect. Assume a
sinusoidal pressure o s c i l l a t i o n of a i y l a r frequency W i s
generated at X = 0 . At resonance a standing wave i s produced i n
the pipe due to wave r e f l e c t i o n from the open end.
Closed
Closed/Open pipe
! Open
X=La
Direction of flow
where La = acoustic length
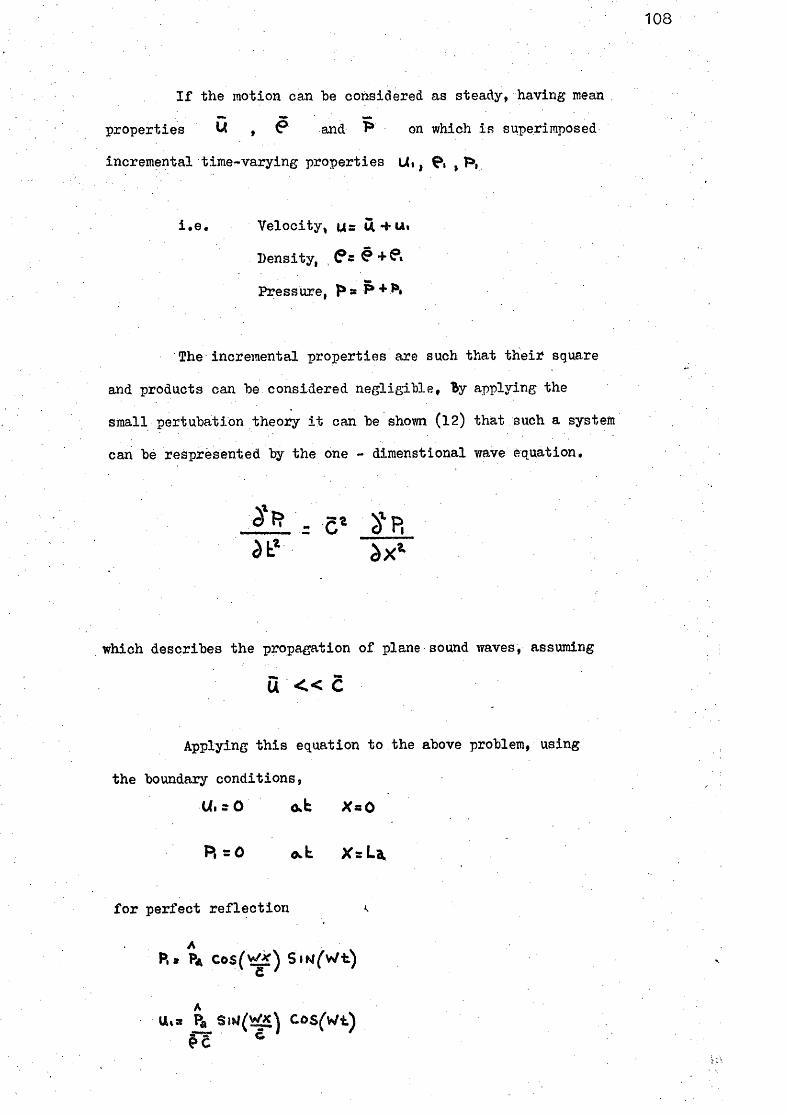
108
I f the motion can be considered as steady, having mea,n
properties U , ^ and "F* on which i s superimposed
incremental time-varying properties U i , ^, ,T>,
i . e . Velocity^ u= U^t-iAi
Density, (?2 e+€*t
Pressure, F»a P +
The incremental properties are such that t h e i r square
and products can be considered negligible, By applying the
small pertubation theo2?y i t can be shovm (12) that such a system
can be respresented by the one - diraenstional wave equation.
which describes the propagation of plane sound waves, assuming
u « c
Applying t h i s equation to the above problem, using
the boundary conditions, U.rO o.b XaO
f o r perfect r e f l e c t i o n <
A
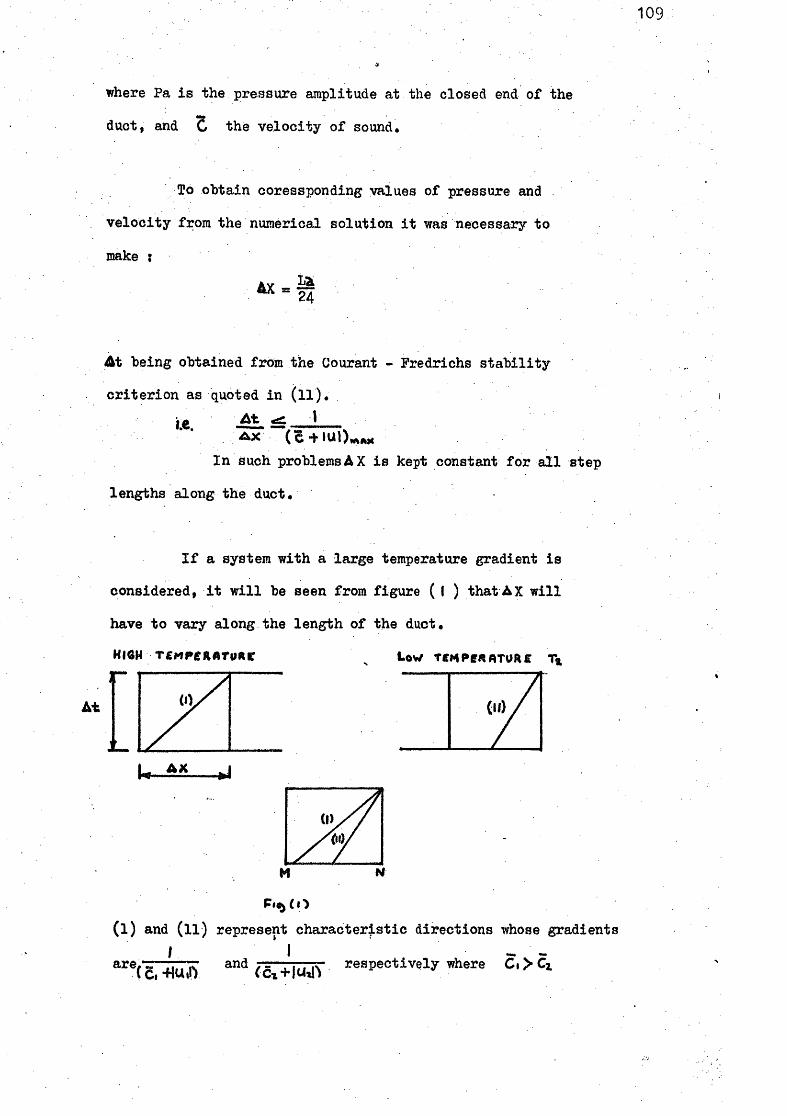
where Pa i s the pressure amplitude at the closed end of the
duct, and C the velo c i t y of sound.
109
To obtain coressponding values of pressure and
ve l o c i t y from the numerical solution i t was necessary to
make i
4X r: 24
^ t being obtained from the Courant - Fredrichs s t a b i l i t y
c r i t e r i o n as quoted i n ( l l ) . A t «si V
I n such problems AX i s kept constant f o r a l l step
lengths along the duct.
I f a system with a large temperature gradient i s
considered, i t w i l l be seen from figure ( I ) that AX w i l l
have to vary along the length of the duct.
HIGH T£MPeil«ruRr ^ U W TCMPeWflTURE T i
A t
( l ) and ( l l ) represent characteristic directions whose gradients
are and r= respectively where Ci > Ci
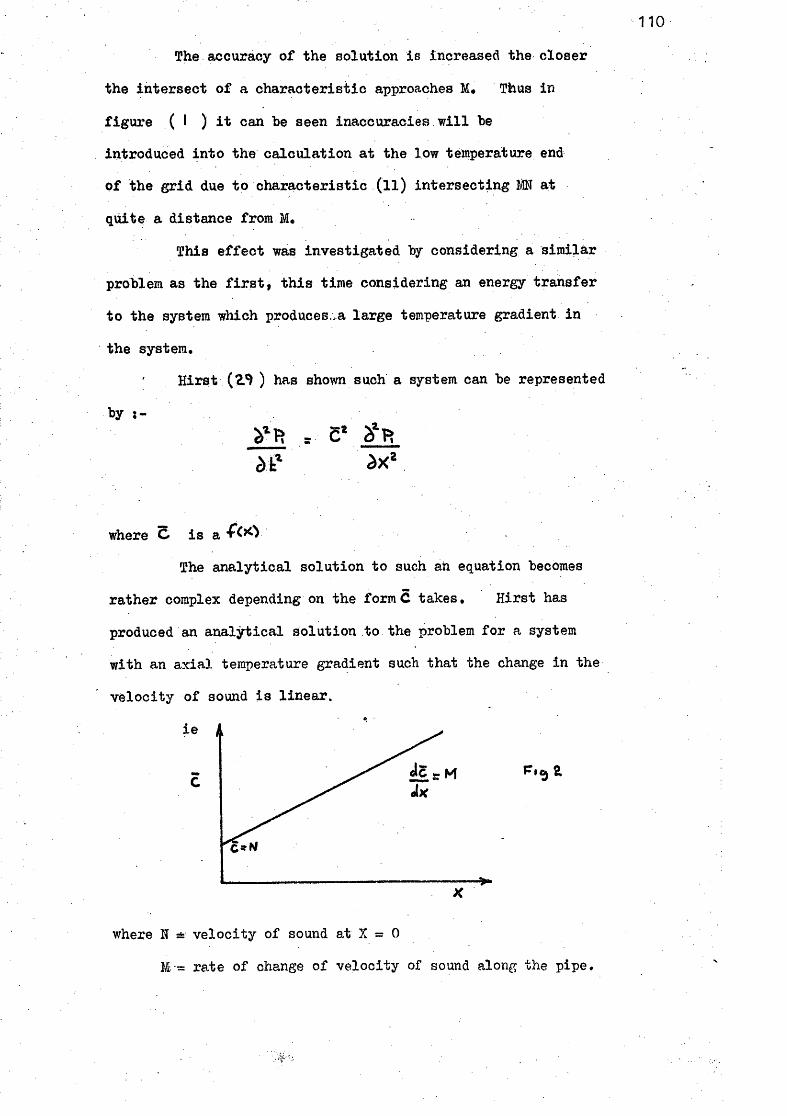
110
The accuracy of the solution i s increased the closer
the intersect of a characteristic approaches M. Thus i n
fig u r e ( I ) i t can be seen inaccuracies w i l l be
introduced i n t o the calculation at the low temperature end
of the g r i d due t o characteristic (11) intersecting M at
quite a distance from M.
This effect was investigated by considering a similar
problem as the f i r s t , t h i s time considering an energy transfer
to the system which produces..a large temperature gradient i n
the system.
Hi r s t (Z*) ) has sho^vn such a system can be represented
by ;-
where i s a
The analyti c a l solution to such ah equation becomes
rather complex depending on the form C takes. Hirst has
produced an analytical solution to the problem f o r a system
with an axial temperature gradient such that the change i n the
veloc i t y of sound i s linear.
i e A
where N velo c i t y of sound at X = 0
M. =: rate of change of velocity of sound along the pipe.

111
The system can be represented by the equation
applying the same boundary conditions as f o r the adiabatic case
Pi «0 a t X = L a
f o r perfect r e f l e c t i o n
then
where •
A . • Pa i s the pressure amplitude at X = 0
The resonant frequencies are given by solving the following
equation by the Newton - Haphson i t e r a t i o n technique
M Sif/fbZOH- bCoSfbZt^s O Z
Figures (la-^ta) shows the comparison of results produced by
the numerical solution to those produced by Hirst f o r the conditions
shown.
The AX used i n the adiabatic case was used i n determining
At from A t ^ _ J AX (C4-1UIW;«
AX was found from
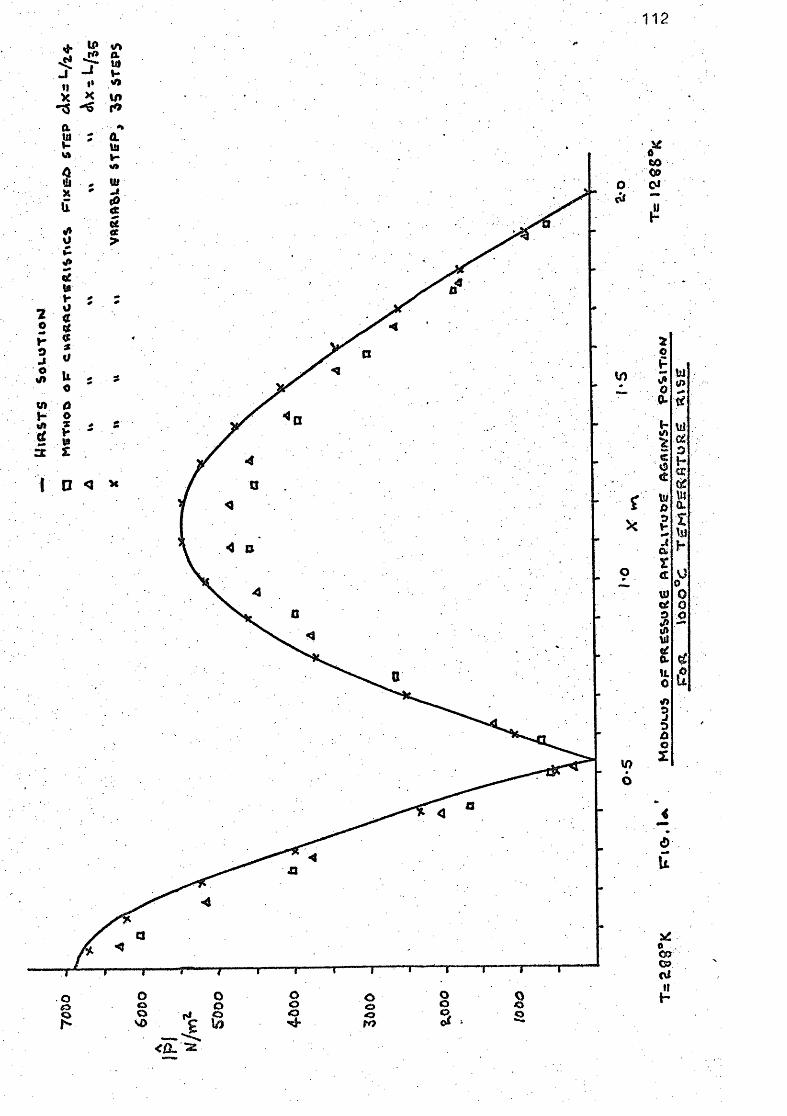
112
> -J li »»
e -VI
u
> o c
u o
S I
2 o
.4 O
O
in
I/) 6
o o
o o O \0
o o
O o o o o o
o o 2
i f to
o > Q 0-
& o
t> *-«i* -«
r
I e; 0. II. c
3
o 2
a: H a:
I
0^^ c 0 o
5^ CO
II
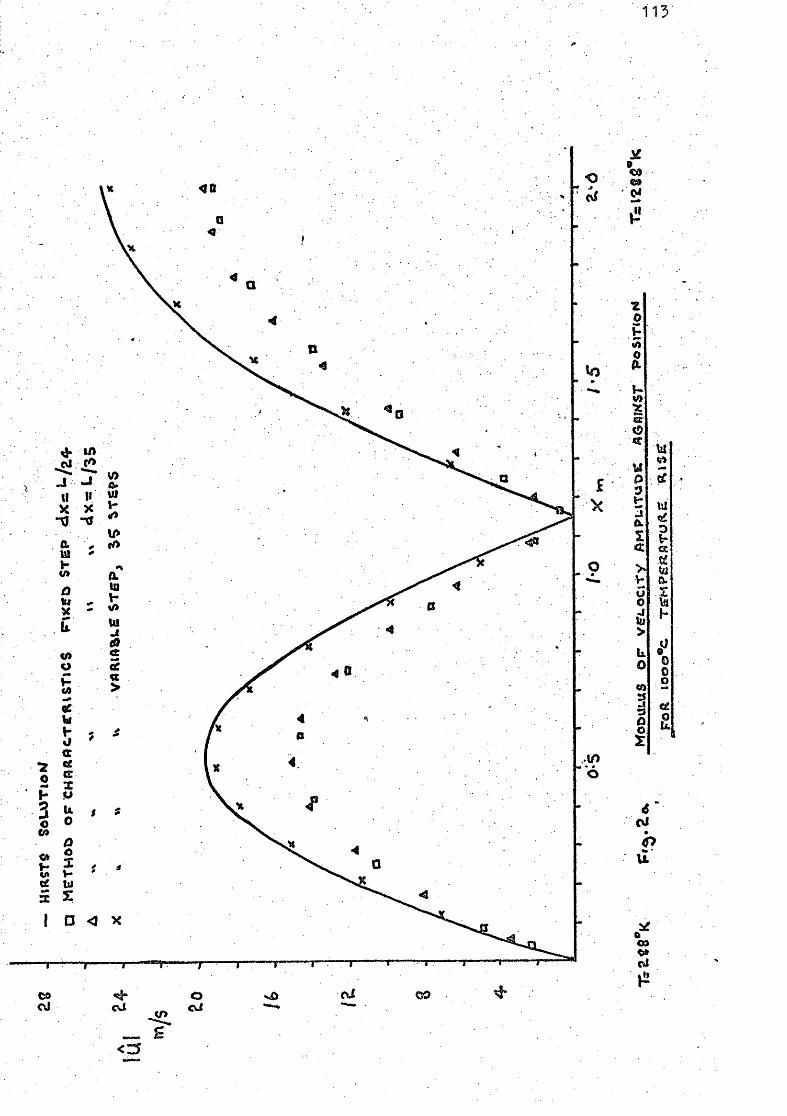
113
9 CO
o
0
J-
U
t: a X
> U O CO 3 r» £» o
6 cvl
O
0 0 o
£
47 u
ft
ca

114
where UN i s an estimate of the maximum velocity amplitude.
UN may be varied s l i g h t l y to allow a whole number of step-
lengths to be accommodated i n the characteristic length of
the tube.
For the combustion system i t was decided to use the
measured temperature gradient i n determining A X. However,
the predicted steady state temperature gradient could equally
well have been used.
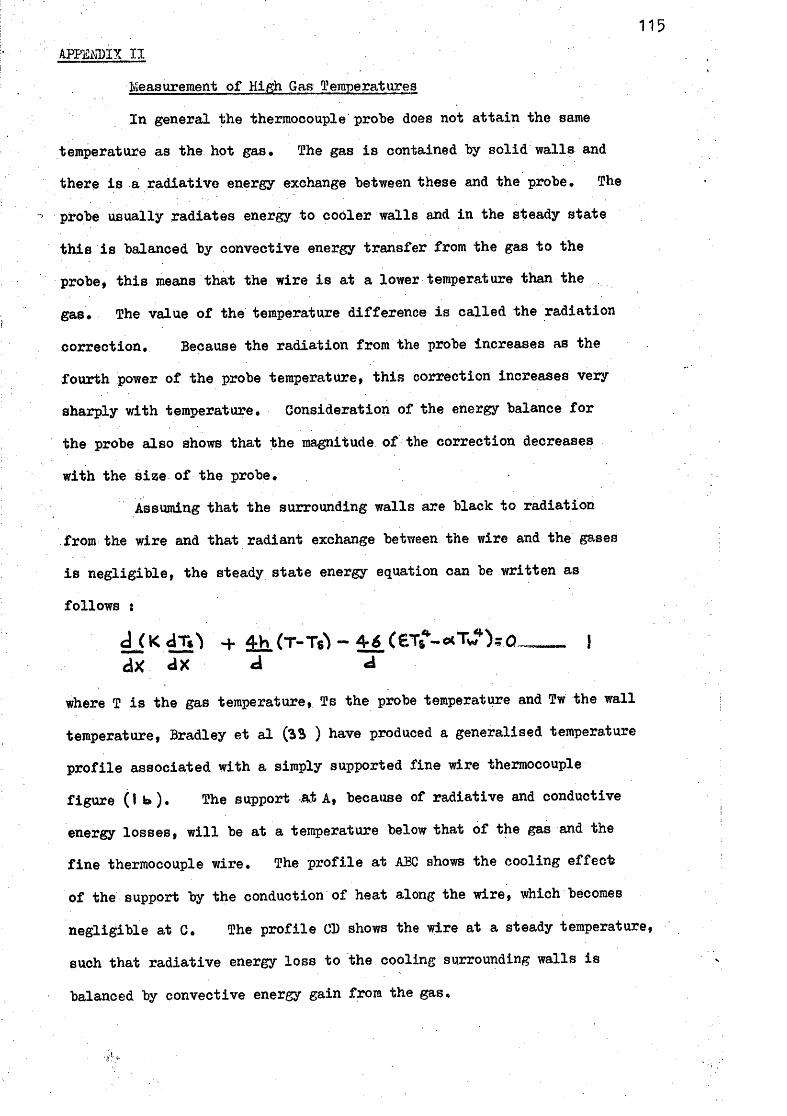
115 APPExNJDIX I I
Measurement of High Gas Temperatures
I n general the thermocouple probe does not a t t a i n the same
temperature as the hot gas, The gas i s contained "by s o l i d walls and
there i s a ra d i a t i v e energy exchange between these and the probe. The
probe usually radiates energy t o cooler walls and i n the steady state
t h i s i s balanced by convective energy transfer from the gas to the
probe, t h i s means that the wire i s at a lower temperature than the
gas. The value of the temperature difference i s called the radiation
correction. Because the radiation from the probe Increases as the
fourth power of the probe temperature, t h i s correction increases very
sha2T)ly with temperature. Consideration of the energy balance f o r
the probe also shows that the magnitude of the correction decreases
with the size of the probe.
Assuming that the surrounding walls are black to radiation
from the wire and that radiant exchange between the wire and the gases
i s n e g l i g i b l e , the steady state energy equation can be written as
follows :
where T i s the gas temperature, Ts the probe temperature and Tw the wall
temperature, Bradley et a l (3S ) have produced a generalised temperature
p r o f i l e associated with a simply supported f i n e wire thermocouple
f i g u r e ( l b ) . The support .aA A, because of radiative and conductive
energy losses, w i l l be at a temperature below that of the gas and the
f i n e thermocouple wire. The p r o f i l e at ABC shows the cooling effect
of the support by the conduction of heat along the wire, which becomes
negligible at C, The p r o f i l e CD shows the wire at a steady temperature,
such that radiative energy loss to the cooling surrounding walls i s
balanced by convective energy gain from the gas.

116
X
T E M P E R R T O R E
m
« SU P P O R T T6MPEftAr<jR£
Ter«^peR«T<iRE
» , 1 4>
SUPPORT
p^ jfe WIRE TEHfieaRTURE biSTRiBunoM •J •
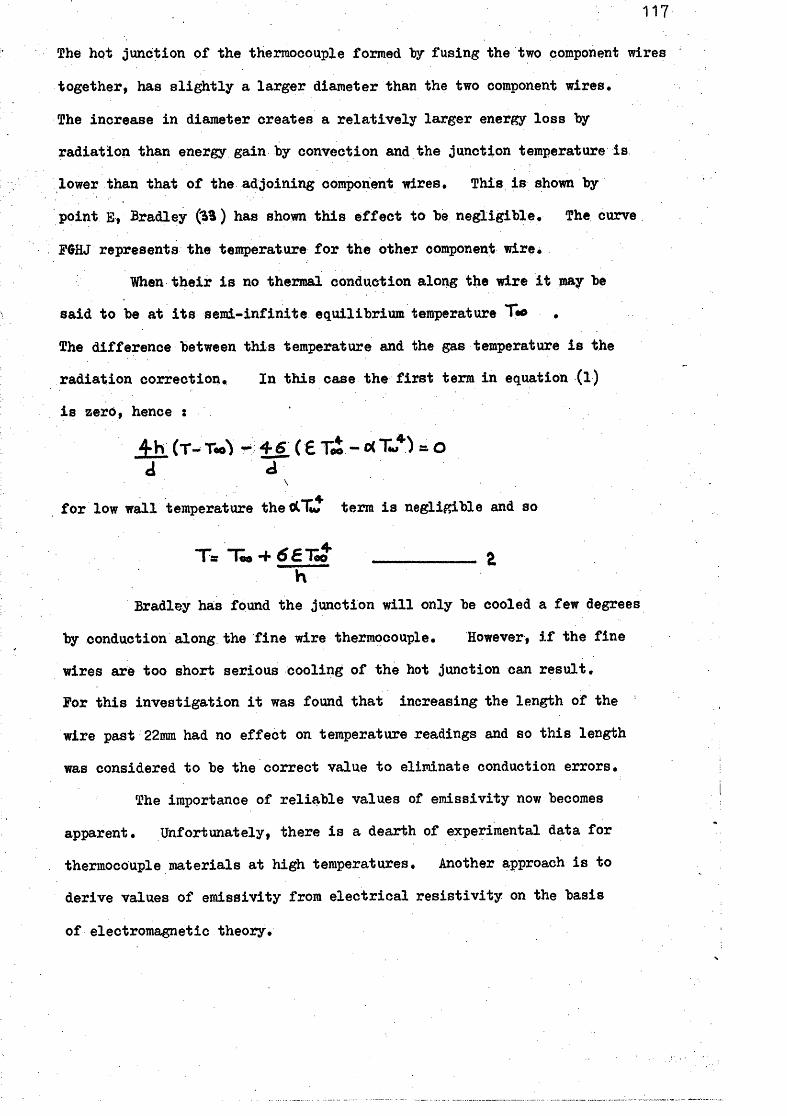
117
The hot junction of the thermocouple formed Tay fusing the two component wires together, has s l i g h t l y a larger diameter than the two component wires. The increase i n diameter creates a r e l a t i v e l y larger energy loss "by radiation than energy gain by convection and the junction temperature i s lower than that of the adjoining component wires. This i s shown by point B, Bradley (13) has shown t h i s e f f e c t to be negligible. The curve PO HJ represents the temperature f o r the other component wire.
When t h e i r i s no thermal conduction along the wire i t may be
said t o be at i t s semi-infinite equilibrium temperature Ttc ,
The difference between t h i s temperature and the gas temperature i s the
radi a t i o n correction. I n t h i s case the f i r s t term i n equation ( l )
i s zero, hence :
4h ( T - ' ^ 46 (erJ^-ciTJ")^o
f o r low wall temperature theOtTlJ* term i s negligible and so
h Bradley has found the junction w i l l only be cooled a few degrees
by conduction along the f i n e wire thermocouple. However, i f the fi n e
wires are too short serious cooling of the hot junction oan r e s u l t .
Por t h i s investigation i t was found that increasing the length of the
wire past 22mm had no effect on temperature readings and so t h i s length
was considered t o be the correct value t o eliminate conduction errors.
The importance of r e l i a b l e values of emissivity now becomes
apparent. Unfojrbunately, there i s a dearth of experimental data f o r
thermocouple materials at high temperatures. Another approach i s to
derive values of emissivity from e l e c t r i c a l r e s i s t i v i t y on the basis
of electromagnetic theory.

118
Davisson and V/eeks (54) Give a theroetical expression for the emissivity
e.- 0 -751 (T Rel^ ~ 0 -fea&CT Re>+0 67^TRef^- 0 -607 CrRef R e s i s t i v i t i e s for the platinum - rhodium alloys can be estimated from the
data presented by Wise and Vines (35),
The heat transfer coefficient i n equation (2) i s determined from
the expression from Kromer quoted by Bradley (35).
I t i s frequently used i n anemometry for cross flow to a wire.
Figure (2b) shows t y p i c a l radiation correction data for the
thermocouple probe used i n t h i s investigation.
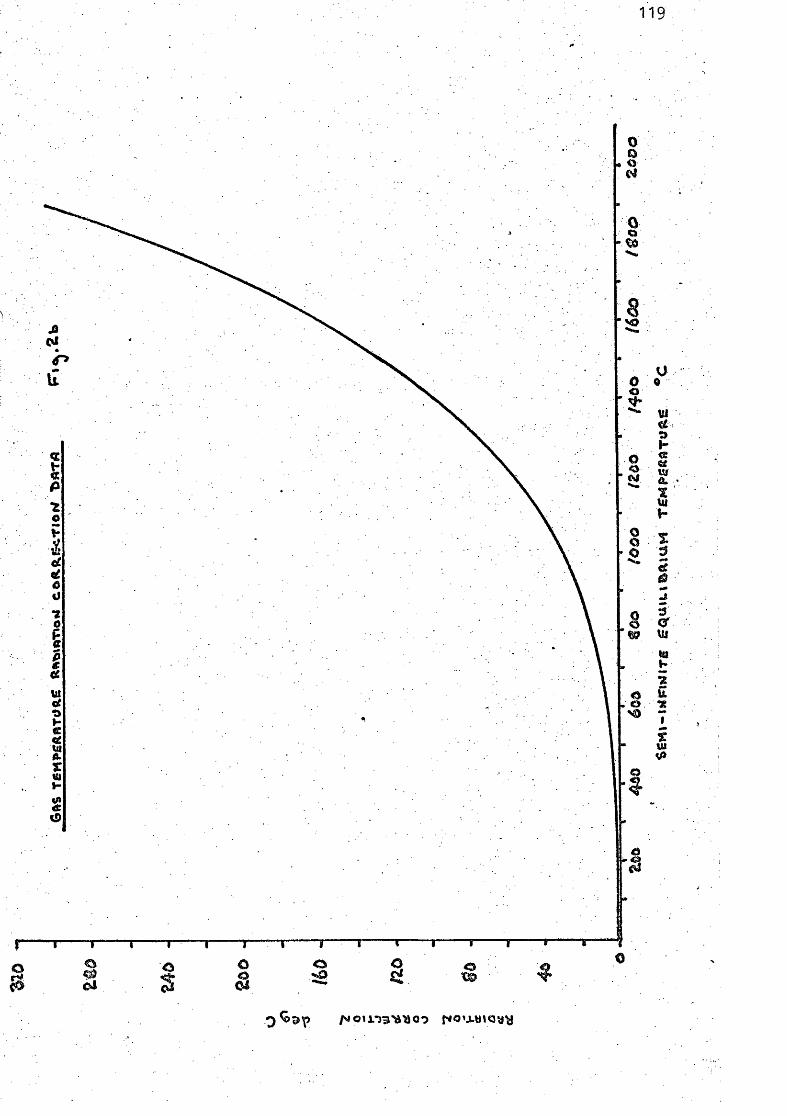
119
A •2: o
?
o O § I VI of •l-e g X w
o C4
0
O o
O
o o o
^ 1
U
Of
i
7 ?
r O o 0