dutch customs laboratory amsterdam - european...
TRANSCRIPT
DUTCH CUSTOMS LABORATORY AMSTERDAM
Validation of the Draft Community Reference Method for the determination of Solvent Yellow 124 in gas oil
(Euromarker)
Method validation Solvent Yellow 124 (Euromarker) page 1 of 17
Validation of the Draft Community Reference Method for the determination of Solvent Yellow 124 in gas oil
(Euromarker)
Thomas Linsinger1, Ger Koomen2, Håkan Emteborg1, Gert Roebben1, Gerard Kramer1, A. Lamberty1
1) DG-JRC, Institute for Reference Materials and Measurements, Retieseweg 111, 2440 Geel (BE)
2) Dutch Customs Laboratory, Kingsfordweg 1, 1043GN Amsterdam (NL)
1 EXECUTIVE SUMMARY........................................................................................... 2
2 INTRODUCTION .......................................................................................................2 2.1 Background .................................................................................................... 2 2.2 Method of analysis .........................................................................................3 2.3 Matrix materials ..............................................................................................3
3 ORGANISATION....................................................................................................... 4
4 SAMPLES .................................................................................................................4 4.1 Preparation.....................................................................................................4 4.2 Homogeneity ..................................................................................................5 4.3 Stability...........................................................................................................6 4.4 Conclusion......................................................................................................6
5 RESULTS AND EVALUATION................................................................................. 6 5.1 Outliers ...........................................................................................................6 5.2 Repeatability and reproducibility..................................................................... 7 5.3 Bias ................................................................................................................9 5.4 Limit of detection and quantification ............................................................... 10 5.5 Ruggedness ................................................................................................... 12 5.6 Quality criteria ................................................................................................13
6 EVALUATION MEETING .......................................................................................... 14
7 SUMMARY AND CONCLUSION .............................................................................. 15
8 PARTICIPANTS ........................................................................................................15
9 GLOSSARY...............................................................................................................16
10 ACKNOWLEDGEMENTS .........................................................................................16
11 ANNEXES .................................................................................................................16
Method validation Solvent Yellow 124 (Euromarker) page 2 of 17
1 EXECUTIVE SUMMARY 12 batches of samples containing various levels of solvent yellow 124 were prepared. The samples were sent to 26 different laboratories in order to validate the new Community Reference Method for the determination of Solvent Yellow 124 (Euromarker) in gas oil.
The interlaboratory trial was evaluated according to ISO 5725 and ISO 4259 for determination at 410 and 450 nm. After removal of outliers, repeatability and reproducibility standard deviations were calculated. At the level of 0.12 mg/L the repeatability standard deviation and the between laboratory standard deviation are of the same order. Reproducibility standard deviation at 0.12 mg/L is in the order predicted by the Horwitz equation (0.021 mg/L). The reproducibility standard deviation at 6 mg/L (batch 2) was with 0.23 mg/L better than the 0.4 mg/L that was thought to be achievable. Based on these standard deviations, limits for exceeding the specifications of 6 and 9 mg/L were calculated to be < 5.6 and > 9.5 mg/L respectively.
2 INTRODUCTION
2.1 Background In its meeting of April 3 and 4 2003, the Excise Committee agreed to set-up an ad-hoc working group. In the mandate of the ad-hoc working group the following task was described:
The group's task is to look at ways of improving and if necessary harmonising the methods of analysis to be used for the detection of the Euromarker, and the determination of its marking levels with particular reference to:
a) Explore whether method 455 MAD, Rev.1 (HPLC) for laboratory analysis provides a solid basis for developing a harmonised Community reference method of analysis for the Euromarker, Solvent Yellow 124 (SY 124), as requested by the Excise Committee;
b) Explore the conditions under which this method can also be used for identifying SY 124, if other national markers are used in parallel with the Euromarker;
c) Identify improvements to be made to this method of analysis, the procedure to follow and the time needed, in order to provide reliable and comparable data, which correspond to international standards, for the interpretation of the results;
d) Consider whether the precision performance of method 455 MAD, Rev.1 (HPLC) is in line with the principles of ISO 4259. In this context the reproducibility value to use in the reference method should be established at Community level based on the results of round robin tests. The experience gained during the Euromarker selection process within the JRC Ispra, or by Member States which have developed their national methods of analysis, should allow the Working Group Members to establish synergies and horizontal co-operation among themselves and to push this exercise through within reasonable time limits;
e) Explore whether it is really necessary to establish a mandatory operational mode or to merely establish a reference method that leaves Member States free to apply the latter in accordance with the principle of subsidiarity;
f) Consider the possibility to improve the comparability of the results of tests by determining reference materials, certified and provided by IRMM, and providing statistical data;
g) Explore whether method 455 MAD, Rev.1 causes problems in practice from environmental and health points of view, and provide solutions to be applied by all Member States.
h) Allow for efficient and reliable updates;
i) Establish all necessary conditions in carrying out the tasks agreed by the Excise Committee
Method validation Solvent Yellow 124 (Euromarker) page 3 of 17
2.2 Method of analysis The working group concluded in its first meeting at 22.10.2003 that improvements were needed for the method of analysis used by the Member States to detect the common fiscal marker solvent yellow 124 as provided for by Directive 95/60/EC of 27 November 1995 (OJ L291, of 06.12.1995,p. 46) and the Commission Decision 2001/574/EC of 13 July 2001 (OJ L203, of 28.07.2001,p. 28).
In the period from October 2003 to February 2004 all member states got the possibility to give their opinion about the optimal HPLC method. This resulted in the method that is used in this method evaluation (ANNEX D). The method is based on the method called 455MAD, Rev.1 (HPLC). The major provisions are:
• The calibration solutions are made in Xylene. • A 3 point calibration curve is prescribed which is forced through zero and measured in
duplicate. • The retention time of SY124 has to be between 2 and 4 times the retention time of the void
volume (t0) and the relative standard deviation of the retention time should be less then 2 %. • The UV-detection is performed both on 410 nm and 450 nm. The following targets were defined for the study:
• Repeatability standard deviations should be evaluated.
• Reproducibilities at concentrations of 0.12 and 6 mg/L should be not higher than 0.06 mg/L and 1.2 mg/L, respectively. These values correspond to reproducibility standard deviations of 0.021 mg/L and 0.42 mg/L respectively1. The value for the 0.12 mg/L level was chosen using the Horwitz equation, whereas for 6 mg/L a better reproducibility than predicted by Horwitz was deemed possible.
• If possible, no false positive results.
The method used by the participants is given in Annex D. Small changes (limit of detection, uncertainty) were made based on the evaluation of the validation study. The final method (ANNEX F) will be published in the "C Series" of the Official Journal of the European Union.
2.3 Matrix materials To explore whether national dyes and markers possibly interfere with the SY124 determinations several national dyes and markers are added in known and realistic concentrations to the fuels under investigation. Also known concentrations of SY124 were added. In total 12 different compositions were defined and included in the round-robin.
2.4 Environmental aspects of the method. The method investigated in this study can only be performed in a professional laboratory. Only the standard organic solvents toluene, xylene and ethyl acetate are used. These chemicals are less toxic than the gas oils that are analysed. All used solvents and analysed gas oils should be discarded as chemical waste.
1 Reproducibility = 2 . √2 . reproducibility standard deviation
Method validation Solvent Yellow 124 (Euromarker) page 4 of 17
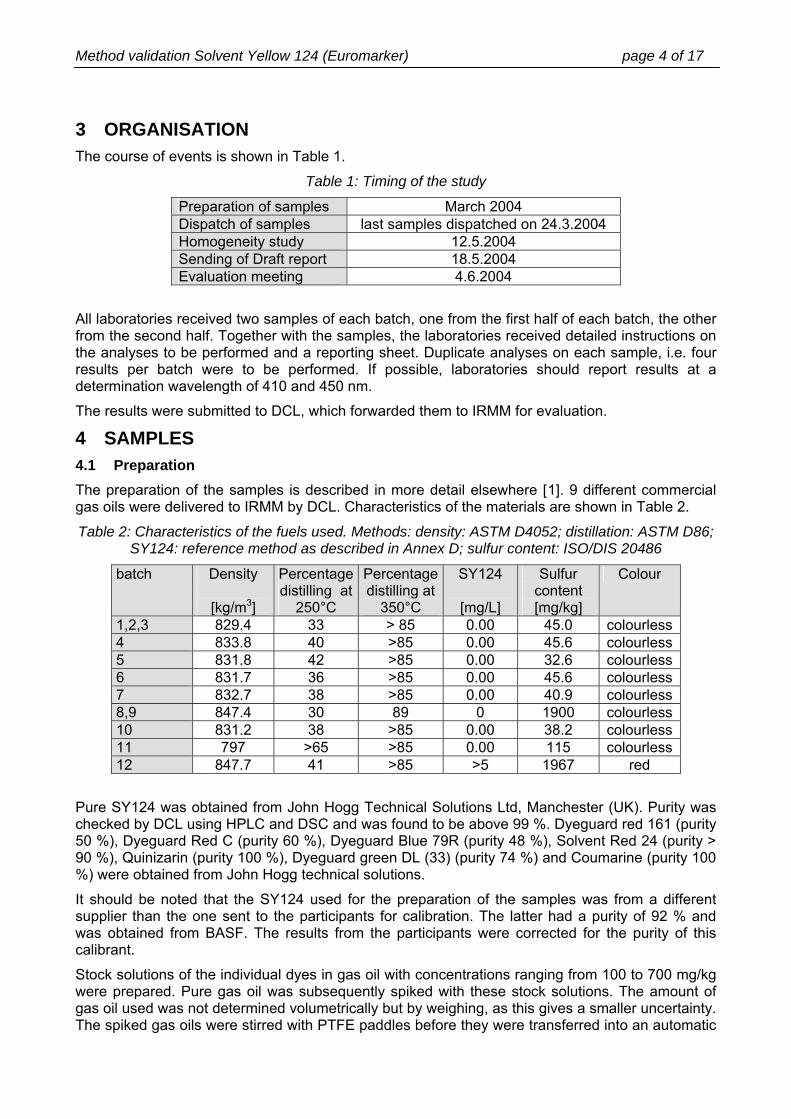
3 ORGANISATION The course of events is shown in Table 1.
Table 1: Timing of the study
Preparation of samples March 2004 Dispatch of samples last samples dispatched on 24.3.2004 Homogeneity study 12.5.2004 Sending of Draft report 18.5.2004 Evaluation meeting 4.6.2004
All laboratories received two samples of each batch, one from the first half of each batch, the other from the second half. Together with the samples, the laboratories received detailed instructions on the analyses to be performed and a reporting sheet. Duplicate analyses on each sample, i.e. four results per batch were to be performed. If possible, laboratories should report results at a determination wavelength of 410 and 450 nm.
The results were submitted to DCL, which forwarded them to IRMM for evaluation.
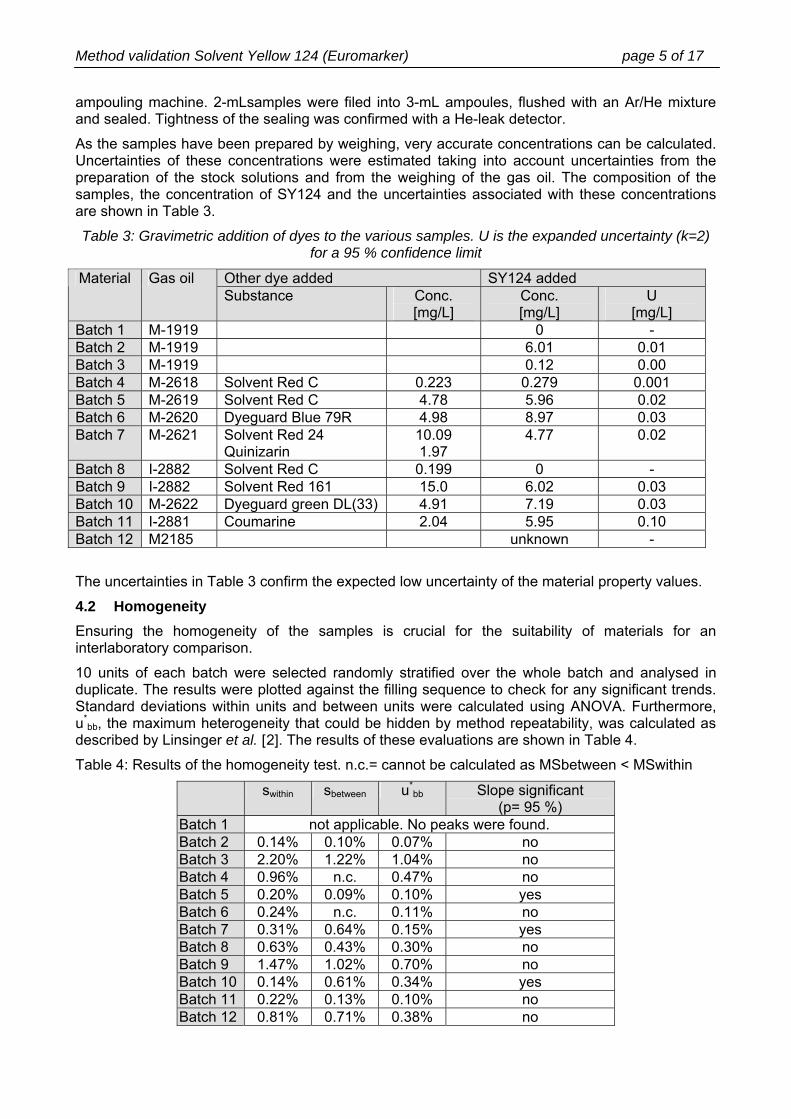
4 SAMPLES 4.1 Preparation The preparation of the samples is described in more detail elsewhere [1]. 9 different commercial gas oils were delivered to IRMM by DCL. Characteristics of the materials are shown in Table 2.
Table 2: Characteristics of the fuels used. Methods: density: ASTM D4052; distillation: ASTM D86; SY124: reference method as described in Annex D; sulfur content: ISO/DIS 20486
batch Density
[kg/m3]
Percentage distilling at
250°C
Percentage distilling at
350°C
SY124
[mg/L]
Sulfur content [mg/kg]
Colour
1,2,3 829.4 33 > 85 0.00 45.0 colourless4 833.8 40 >85 0.00 45.6 colourless5 831.8 42 >85 0.00 32.6 colourless6 831.7 36 >85 0.00 45.6 colourless7 832.7 38 >85 0.00 40.9 colourless8,9 847.4 30 89 0 1900 colourless10 831.2 38 >85 0.00 38.2 colourless11 797 >65 >85 0.00 115 colourless12 847.7 41 >85 >5 1967 red
Pure SY124 was obtained from John Hogg Technical Solutions Ltd, Manchester (UK). Purity was checked by DCL using HPLC and DSC and was found to be above 99 %. Dyeguard red 161 (purity 50 %), Dyeguard Red C (purity 60 %), Dyeguard Blue 79R (purity 48 %), Solvent Red 24 (purity > 90 %), Quinizarin (purity 100 %), Dyeguard green DL (33) (purity 74 %) and Coumarine (purity 100 %) were obtained from John Hogg technical solutions.
It should be noted that the SY124 used for the preparation of the samples was from a different supplier than the one sent to the participants for calibration. The latter had a purity of 92 % and was obtained from BASF. The results from the participants were corrected for the purity of this calibrant.
Stock solutions of the individual dyes in gas oil with concentrations ranging from 100 to 700 mg/kg were prepared. Pure gas oil was subsequently spiked with these stock solutions. The amount of gas oil used was not determined volumetrically but by weighing, as this gives a smaller uncertainty. The spiked gas oils were stirred with PTFE paddles before they were transferred into an automatic
Method validation Solvent Yellow 124 (Euromarker) page 5 of 17
ampouling machine. 2-mLsamples were filed into 3-mL ampoules, flushed with an Ar/He mixture and sealed. Tightness of the sealing was confirmed with a He-leak detector.
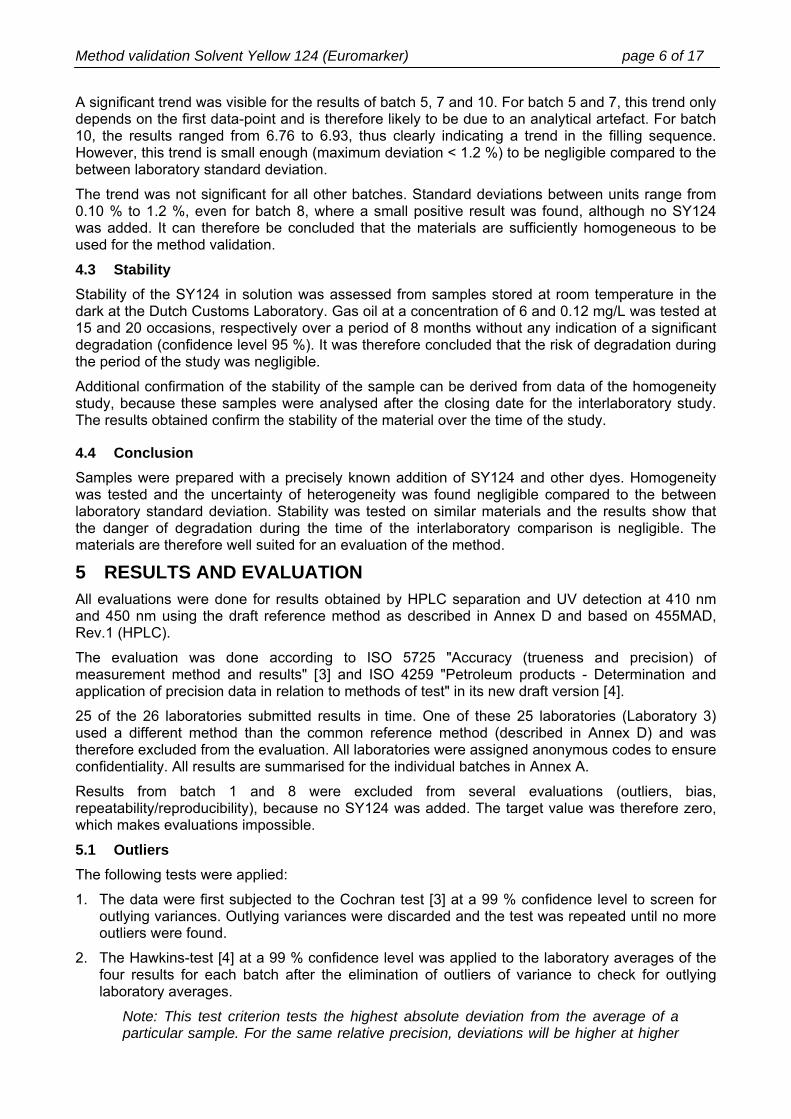
As the samples have been prepared by weighing, very accurate concentrations can be calculated. Uncertainties of these concentrations were estimated taking into account uncertainties from the preparation of the stock solutions and from the weighing of the gas oil. The composition of the samples, the concentration of SY124 and the uncertainties associated with these concentrations are shown in Table 3.
Table 3: Gravimetric addition of dyes to the various samples. U is the expanded uncertainty (k=2) for a 95 % confidence limit
Other dye added SY124 added Material Gas oil Substance Conc.
[mg/L] Conc. [mg/L]
U [mg/L]
Batch 1 M-1919 0 - Batch 2 M-1919 6.01 0.01 Batch 3 M-1919 0.12 0.00 Batch 4 M-2618 Solvent Red C 0.223 0.279 0.001 Batch 5 M-2619 Solvent Red C 4.78 5.96 0.02 Batch 6 M-2620 Dyeguard Blue 79R 4.98 8.97 0.03 Batch 7 M-2621 Solvent Red 24
Quinizarin 10.09 1.97
4.77 0.02
Batch 8 I-2882 Solvent Red C 0.199 0 - Batch 9 I-2882 Solvent Red 161 15.0 6.02 0.03 Batch 10 M-2622 Dyeguard green DL(33) 4.91 7.19 0.03 Batch 11 I-2881 Coumarine 2.04 5.95 0.10 Batch 12 M2185 unknown -
The uncertainties in Table 3 confirm the expected low uncertainty of the material property values.
4.2 Homogeneity Ensuring the homogeneity of the samples is crucial for the suitability of materials for an interlaboratory comparison.
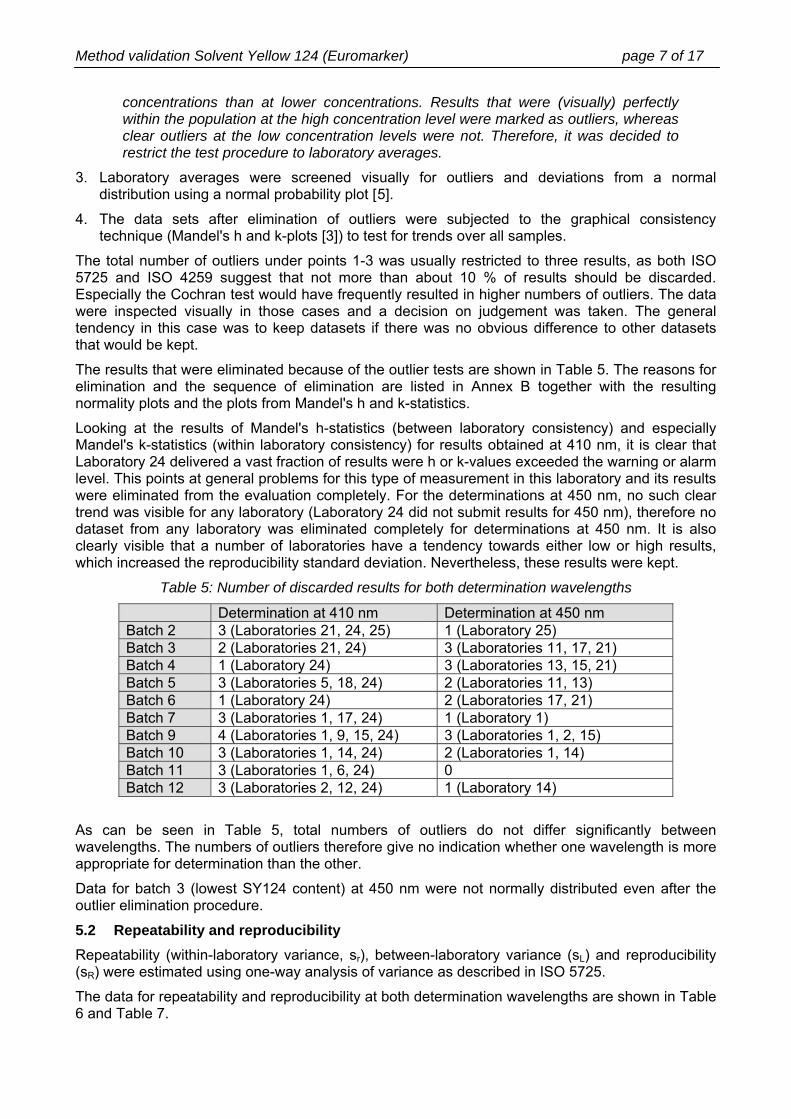
10 units of each batch were selected randomly stratified over the whole batch and analysed in duplicate. The results were plotted against the filling sequence to check for any significant trends. Standard deviations within units and between units were calculated using ANOVA. Furthermore, u*
bb, the maximum heterogeneity that could be hidden by method repeatability, was calculated as described by Linsinger et al. [2]. The results of these evaluations are shown in Table 4.
Table 4: Results of the homogeneity test. n.c.= cannot be calculated as MSbetween < MSwithin
swithin sbetween u*bb Slope significant
(p= 95 %) Batch 1 not applicable. No peaks were found. Batch 2 0.14% 0.10% 0.07% no Batch 3 2.20% 1.22% 1.04% no Batch 4 0.96% n.c. 0.47% no Batch 5 0.20% 0.09% 0.10% yes Batch 6 0.24% n.c. 0.11% no Batch 7 0.31% 0.64% 0.15% yes Batch 8 0.63% 0.43% 0.30% no Batch 9 1.47% 1.02% 0.70% no Batch 10 0.14% 0.61% 0.34% yes Batch 11 0.22% 0.13% 0.10% no Batch 12 0.81% 0.71% 0.38% no
Method validation Solvent Yellow 124 (Euromarker) page 6 of 17
A significant trend was visible for the results of batch 5, 7 and 10. For batch 5 and 7, this trend only depends on the first data-point and is therefore likely to be due to an analytical artefact. For batch 10, the results ranged from 6.76 to 6.93, thus clearly indicating a trend in the filling sequence. However, this trend is small enough (maximum deviation < 1.2 %) to be negligible compared to the between laboratory standard deviation.
The trend was not significant for all other batches. Standard deviations between units range from 0.10 % to 1.2 %, even for batch 8, where a small positive result was found, although no SY124 was added. It can therefore be concluded that the materials are sufficiently homogeneous to be used for the method validation.
4.3 Stability Stability of the SY124 in solution was assessed from samples stored at room temperature in the dark at the Dutch Customs Laboratory. Gas oil at a concentration of 6 and 0.12 mg/L was tested at 15 and 20 occasions, respectively over a period of 8 months without any indication of a significant degradation (confidence level 95 %). It was therefore concluded that the risk of degradation during the period of the study was negligible.
Additional confirmation of the stability of the sample can be derived from data of the homogeneity study, because these samples were analysed after the closing date for the interlaboratory study. The results obtained confirm the stability of the material over the time of the study.
4.4 Conclusion Samples were prepared with a precisely known addition of SY124 and other dyes. Homogeneity was tested and the uncertainty of heterogeneity was found negligible compared to the between laboratory standard deviation. Stability was tested on similar materials and the results show that the danger of degradation during the time of the interlaboratory comparison is negligible. The materials are therefore well suited for an evaluation of the method.
5 RESULTS AND EVALUATION All evaluations were done for results obtained by HPLC separation and UV detection at 410 nm and 450 nm using the draft reference method as described in Annex D and based on 455MAD, Rev.1 (HPLC).
The evaluation was done according to ISO 5725 "Accuracy (trueness and precision) of measurement method and results" [3] and ISO 4259 "Petroleum products - Determination and application of precision data in relation to methods of test" in its new draft version [4].
25 of the 26 laboratories submitted results in time. One of these 25 laboratories (Laboratory 3) used a different method than the common reference method (described in Annex D) and was therefore excluded from the evaluation. All laboratories were assigned anonymous codes to ensure confidentiality. All results are summarised for the individual batches in Annex A.
Results from batch 1 and 8 were excluded from several evaluations (outliers, bias, repeatability/reproducibility), because no SY124 was added. The target value was therefore zero, which makes evaluations impossible.
5.1 Outliers The following tests were applied:
1. The data were first subjected to the Cochran test [3] at a 99 % confidence level to screen for outlying variances. Outlying variances were discarded and the test was repeated until no more outliers were found.
2. The Hawkins-test [4] at a 99 % confidence level was applied to the laboratory averages of the four results for each batch after the elimination of outliers of variance to check for outlying laboratory averages.
Note: This test criterion tests the highest absolute deviation from the average of a particular sample. For the same relative precision, deviations will be higher at higher
Method validation Solvent Yellow 124 (Euromarker) page 7 of 17
concentrations than at lower concentrations. Results that were (visually) perfectly within the population at the high concentration level were marked as outliers, whereas clear outliers at the low concentration levels were not. Therefore, it was decided to restrict the test procedure to laboratory averages.
3. Laboratory averages were screened visually for outliers and deviations from a normal distribution using a normal probability plot [5].
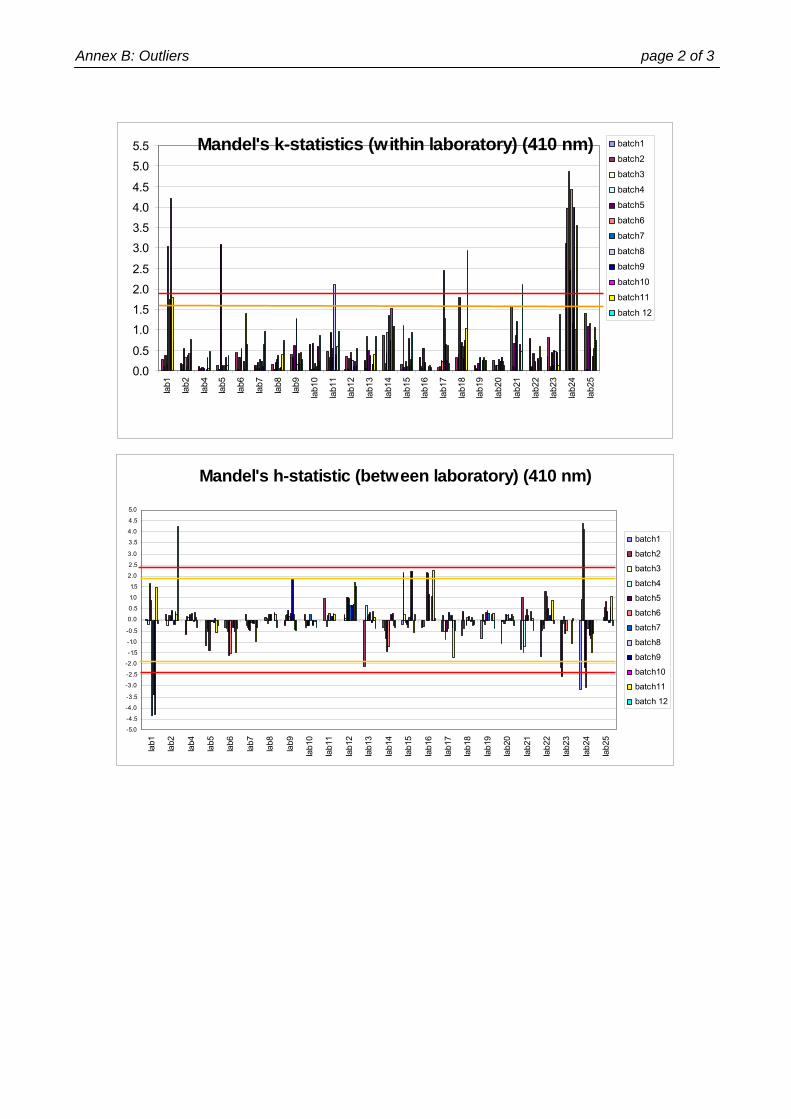
4. The data sets after elimination of outliers were subjected to the graphical consistency technique (Mandel's h and k-plots [3]) to test for trends over all samples.
The total number of outliers under points 1-3 was usually restricted to three results, as both ISO 5725 and ISO 4259 suggest that not more than about 10 % of results should be discarded. Especially the Cochran test would have frequently resulted in higher numbers of outliers. The data were inspected visually in those cases and a decision on judgement was taken. The general tendency in this case was to keep datasets if there was no obvious difference to other datasets that would be kept.
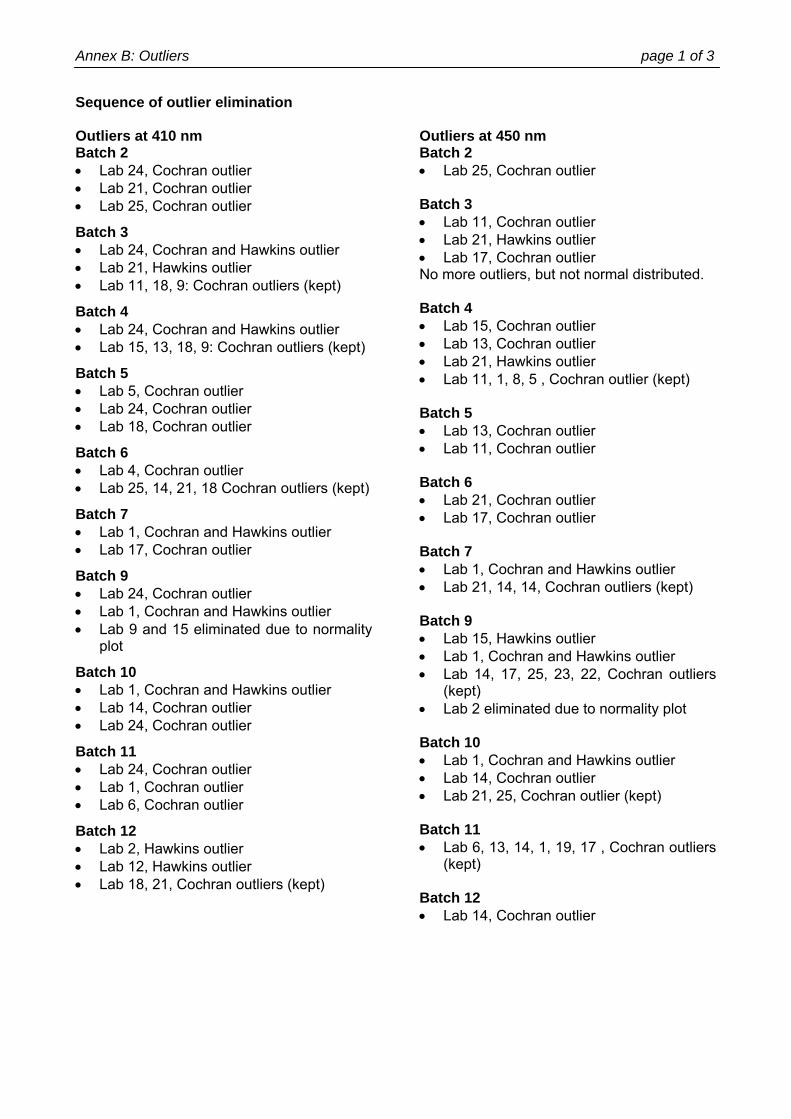
The results that were eliminated because of the outlier tests are shown in Table 5. The reasons for elimination and the sequence of elimination are listed in Annex B together with the resulting normality plots and the plots from Mandel's h and k-statistics.
Looking at the results of Mandel's h-statistics (between laboratory consistency) and especially Mandel's k-statistics (within laboratory consistency) for results obtained at 410 nm, it is clear that Laboratory 24 delivered a vast fraction of results were h or k-values exceeded the warning or alarm level. This points at general problems for this type of measurement in this laboratory and its results were eliminated from the evaluation completely. For the determinations at 450 nm, no such clear trend was visible for any laboratory (Laboratory 24 did not submit results for 450 nm), therefore no dataset from any laboratory was eliminated completely for determinations at 450 nm. It is also clearly visible that a number of laboratories have a tendency towards either low or high results, which increased the reproducibility standard deviation. Nevertheless, these results were kept.
Table 5: Number of discarded results for both determination wavelengths
Determination at 410 nm Determination at 450 nm Batch 2 3 (Laboratories 21, 24, 25) 1 (Laboratory 25) Batch 3 2 (Laboratories 21, 24) 3 (Laboratories 11, 17, 21) Batch 4 1 (Laboratory 24) 3 (Laboratories 13, 15, 21) Batch 5 3 (Laboratories 5, 18, 24) 2 (Laboratories 11, 13) Batch 6 1 (Laboratory 24) 2 (Laboratories 17, 21) Batch 7 3 (Laboratories 1, 17, 24) 1 (Laboratory 1) Batch 9 4 (Laboratories 1, 9, 15, 24) 3 (Laboratories 1, 2, 15) Batch 10 3 (Laboratories 1, 14, 24) 2 (Laboratories 1, 14) Batch 11 3 (Laboratories 1, 6, 24) 0 Batch 12 3 (Laboratories 2, 12, 24) 1 (Laboratory 14)
As can be seen in Table 5, total numbers of outliers do not differ significantly between wavelengths. The numbers of outliers therefore give no indication whether one wavelength is more appropriate for determination than the other.
Data for batch 3 (lowest SY124 content) at 450 nm were not normally distributed even after the outlier elimination procedure.
5.2 Repeatability and reproducibility Repeatability (within-laboratory variance, sr), between-laboratory variance (sL) and reproducibility (sR) were estimated using one-way analysis of variance as described in ISO 5725.
The data for repeatability and reproducibility at both determination wavelengths are shown in Table 6 and Table 7.

Method validation Solvent Yellow 124 (Euromarker) page 8 of 17
Table 6: Mean of means, repeatability standard deviation (sr), between laboratory standard deviation (sL) and reproducibility standard deviation (sR) for the various batches for determination
at 410 nm.
Mean of means [mg/L]
sr [mg/L] ([%])
sL [mg/L] ([%])
sR [mg/L] ([%])
Batch2 6.07 0.035 (0.58%) 0.214 (3.5 %) 0.217 (3.6 %) Batch3 0.12 0.009 (7.00%) 0.011 (8.9 %) 0.014 (11.3 %) Batch4 0.279 0.025 (8.82%) 0.023 (8.2 %) 0.034 (12.0 %) Batch5 6.02 0.040 (0.67%) 0.187 (3.1 %) 0.191 (3.2 %) Batch6 9.05 0.061 (0.68%) 0.246 (2.7 %) 0.254 (2.8 %) Batch7 4.78 0.045 (0.93%) 0.138 (2.9%) 0.145 (3.0 %) Batch9 6.12 0.051 (0.83%) 0.248 (4.1 %) 0.253 (4.1 %) Batch10 7.16 0.070 (0.98%) 0.194 (2.7 %) 0.206 (2.9 %) Batch11 5.87 0.044 (0.76%) 0.170 (2.9 %) 0.176 (3.0 %) Batch12 6.10 0.092 (1.5 %) 0.361 (5.9 %) 0.373 (6.1 %)
Table 7: Mean of means, repeatability standard deviation (sr), between laboratory standard deviation (sL) and reproducibility standard deviation (sR) for the various batches for determination
at 450 nm.
Mean of means [mg/L]
sr [mg/L] ([%])
sL [mg/L] ([%])
sR [mg/L] ([%])
Batch2 6.04 0.041 (0.68 %) 0.228 (3.8 %) 0.231 (3.8 %) Batch3 0.12 0.007 (5.44 %) 0.015 (12.4 %) 0.016 (13.5 %) Batch4 0.27 0.014 (5.00 %) 0.014 (5.2 %) 0.02 (7.2 %) Batch5 5.99 0.033 (0.55 %) 0.222 (3.7 %) 0.225 (3.7 %) Batch6 9.05 0.064 (0.71 %) 0.271 (3.0 %) 0.279 (3.1 %) Batch7 4.78 0.049 (1.03 %) 0.145 (3.0 %) 0.153 (3.2 %) Batch9 6.10 0.079 (1.29 %) 0.267 (4.4 %) 0.278 (4.6 %) Batch10 7.13 0.070 (0.98 %) 0.198 (2.8 %) 0.21 (2.9 %) Batch11 5.87 0.061 (1.05 %) 0.178 (3.0 %) 0.189 (3.2 %) Batch12 6.01 0.032 (0.54 %) 0.193 (3.2 %) 0.196 (3.3 %)
At the level of 6 mg/L repeatability standard deviation is significantly smaller (on average a factor 4) than the reproducibility standard deviation, which is not unusual for chemical analysis. Probably the difference between reproducibility and repeatability is mainly caused by the difficulty of precisely diluting the standards for the calibration curve.
At the level of 0.12 mg/L the repeatability standard deviation and the between laboratory standard deviation are of the same order. This means that at this level variation is mainly gouverned by intrinsic method variation and cannot be improved by further standardisation. Reproducibility standard deviation at 0.12 mg/L is of the order predicted by the Horwitz equation (0.021 mg/L). The reproducibility standard deviation at 6 mg/L (batch 2) was with 0.23 mg/L better than the 0.4 mg/L that was thought to be achievable.
Reproducibility standard deviations of batches containing more than 4 mg/L were found to vary randomly between 0.15 and 0.28 mg/L. An average reproducibility standard deviation was calculated using the relative sR of batches 2, 5, 6, 7, 9, 10, 11 and 12 according to the equation
% .s
s i,RR 523
8
2
== ∑
The average relative reproducibility standard deviation between 4.8 and 9 mg/L is 3.5 %.
Method validation Solvent Yellow 124 (Euromarker) page 9 of 17
The results for the reproducibility of the evaluated method make it possible to calculate the testing margins according to ISO 4259 for determination at 450 nm. Upper and lower limits of the specification were then calculated as
2840 R.citlim ⋅
±= with RscR ⋅⋅= 22 . The resulting limits were 9.5 and 5.6 mg/L, which
means that
• a measured value higher then 9.5 mg/L means the concentration of SY124 in the gas oil is significantly higher than 9 mg/L.
• a measured value lower than 5.6 mg/L means the concentration of SY124 in the gas oil is significantly lower than 6 mg/L.
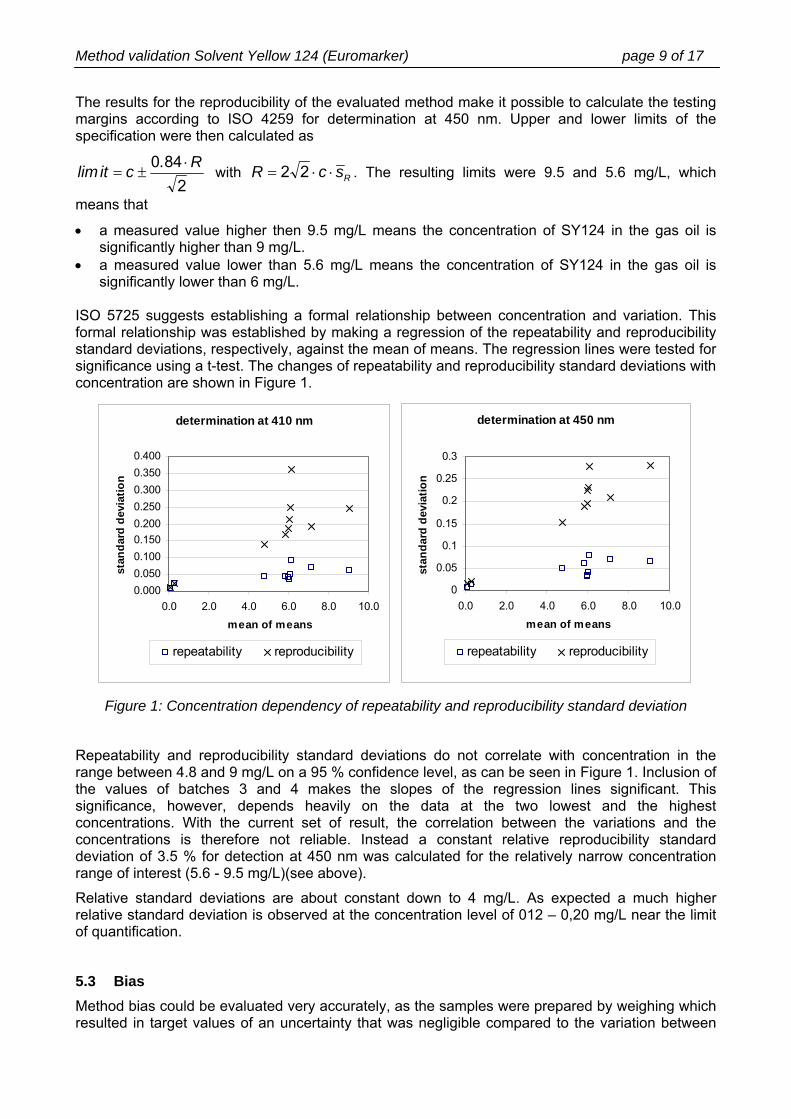
ISO 5725 suggests establishing a formal relationship between concentration and variation. This formal relationship was established by making a regression of the repeatability and reproducibility standard deviations, respectively, against the mean of means. The regression lines were tested for significance using a t-test. The changes of repeatability and reproducibility standard deviations with concentration are shown in Figure 1.
determination at 410 nm
0.0000.0500.1000.1500.2000.2500.3000.3500.400
0.0 2.0 4.0 6.0 8.0 10.0
mean of means
stan
dard
dev
iatio
n
repeatability reproducibility
determination at 450 nm
0
0.05
0.1
0.15
0.2
0.25
0.3
0.0 2.0 4.0 6.0 8.0 10.0
mean of means
stan
dard
dev
iatio
n
repeatability reproducibility
Figure 1: Concentration dependency of repeatability and reproducibility standard deviation
Repeatability and reproducibility standard deviations do not correlate with concentration in the range between 4.8 and 9 mg/L on a 95 % confidence level, as can be seen in Figure 1. Inclusion of the values of batches 3 and 4 makes the slopes of the regression lines significant. This significance, however, depends heavily on the data at the two lowest and the highest concentrations. With the current set of result, the correlation between the variations and the concentrations is therefore not reliable. Instead a constant relative reproducibility standard deviation of 3.5 % for detection at 450 nm was calculated for the relatively narrow concentration range of interest (5.6 - 9.5 mg/L)(see above).
Relative standard deviations are about constant down to 4 mg/L. As expected a much higher relative standard deviation is observed at the concentration level of 012 – 0,20 mg/L near the limit of quantification.
5.3 Bias Method bias could be evaluated very accurately, as the samples were prepared by weighing which resulted in target values of an uncertainty that was negligible compared to the variation between

Method validation Solvent Yellow 124 (Euromarker) page 10 of 17
laboratories. The means of laboratory means were tested against this theoretical target value using a t-test. The results for both wavelengths are shown in Table 8.
Table 8: Comparison target value/mean of means for all batches and both determination wavelengths.
Determination at 410 nm Determination at 450 nm Accepted
sets of results
Target value [mg/L]
Mean of means [mg/L]
Accepted sets of results
Target value [mg/L]
Mean of means [mg/L]
Batch1 20 0.00 0.02 20 0.00 0.00 Batch2 21 6.01 6.07 19 6.01 6.04 Batch3 22 0.12 0.12 17 0.12 0.12 Batch4 23 0.279 0.279 17 0.279 0.272 Batch5 21 5.96 6.02 18 5.96 5.99 Batch6 23 8.97 9.05 18 8.97 9.05 Batch7 21 4.77 4.79 19 4.77 4.78 Batch8 20 0.00 0.131 20 0.00 0.00 Batch9 18 6.02 6.12 15 6.02 6.10 Batch10 21 7.19 7.16 18 7.19 7.13 Batch11 21 5.95 5.87 20 5.95 5.87 Batch12 21 not
applicable 6.13 19 not
applicable 6.01
For Batch 12, no target concentration can be given as it is a commercially available gas oil with an unknown SY124 content, contrary to the other batches where exactly known amounts of SY124 were added. None of the mean of means differs significantly from the target value (t-test; 95 % confidence level). For most batches, the means of laboratory means are above the target values. However, the deviation is small enough to contribute negligibly to measurement uncertainty. It therefore can be concluded that there is no significant method bias at both wavelengths used for determination.
5.4 Limit of detection and quantification The limits of detection and quantification were determined via the standard deviation of the measurements under repeatability conditions of a sample with a concentration of SY124 near the limit of quantification. A small measurable analyte content is needed to be able to quantify a standard deviation. The standard deviation of batch 3 fulfils this criterion. As limit of detection and quantification are relevant to the individual laboratories rather than to a pooled group of laboratories, the repeatability standard deviations were used for the estimation of limit of detection and quantification.
The LOD was defined as three times the repeatability standard deviation of batch 3 following [6]. LOQ was arbitrarily defined as 10 times the repeatability standard deviation(see [6]). LODs and LOQs derived are shown in Table 9.
Table 9: LOD and LOQ for determination at 410 and 450 nm
determination at 410 nm
determination at 450 nm
Limit of detection [mg/L] 0.026 0.020 Limit of quantification [mg/L] 0.085 0.065
Method validation Solvent Yellow 124 (Euromarker) page 11 of 17
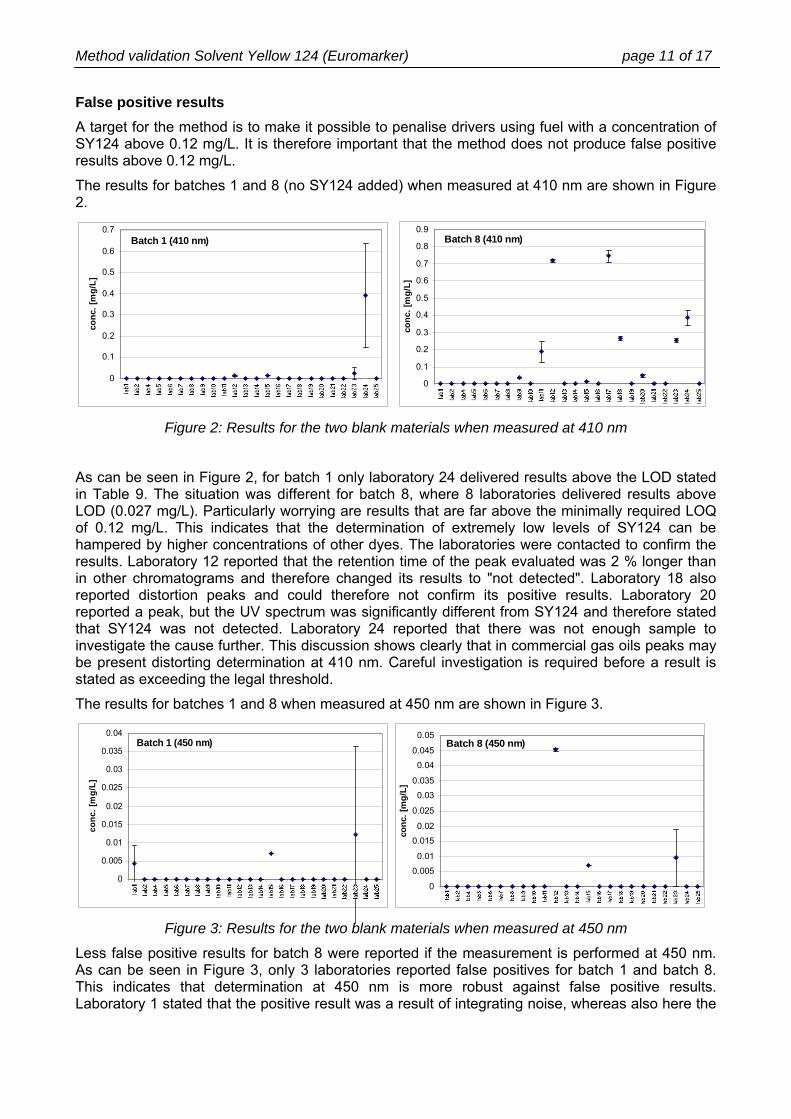
False positive results A target for the method is to make it possible to penalise drivers using fuel with a concentration of SY124 above 0.12 mg/L. It is therefore important that the method does not produce false positive results above 0.12 mg/L.
The results for batches 1 and 8 (no SY124 added) when measured at 410 nm are shown in Figure 2.
Batch 1 (410 nm)
0
0.1
0.2
0.3
0.4
0.5
0.6
0.7
conc
. [m
g/L]
Batch 8 (410 nm)
0
0.1
0.2
0.3
0.4
0.5
0.6
0.7
0.8
0.9
conc
. [m
g/L]
Figure 2: Results for the two blank materials when measured at 410 nm
As can be seen in Figure 2, for batch 1 only laboratory 24 delivered results above the LOD stated in Table 9. The situation was different for batch 8, where 8 laboratories delivered results above LOD (0.027 mg/L). Particularly worrying are results that are far above the minimally required LOQ of 0.12 mg/L. This indicates that the determination of extremely low levels of SY124 can be hampered by higher concentrations of other dyes. The laboratories were contacted to confirm the results. Laboratory 12 reported that the retention time of the peak evaluated was 2 % longer than in other chromatograms and therefore changed its results to "not detected". Laboratory 18 also reported distortion peaks and could therefore not confirm its positive results. Laboratory 20 reported a peak, but the UV spectrum was significantly different from SY124 and therefore stated that SY124 was not detected. Laboratory 24 reported that there was not enough sample to investigate the cause further. This discussion shows clearly that in commercial gas oils peaks may be present distorting determination at 410 nm. Careful investigation is required before a result is stated as exceeding the legal threshold.
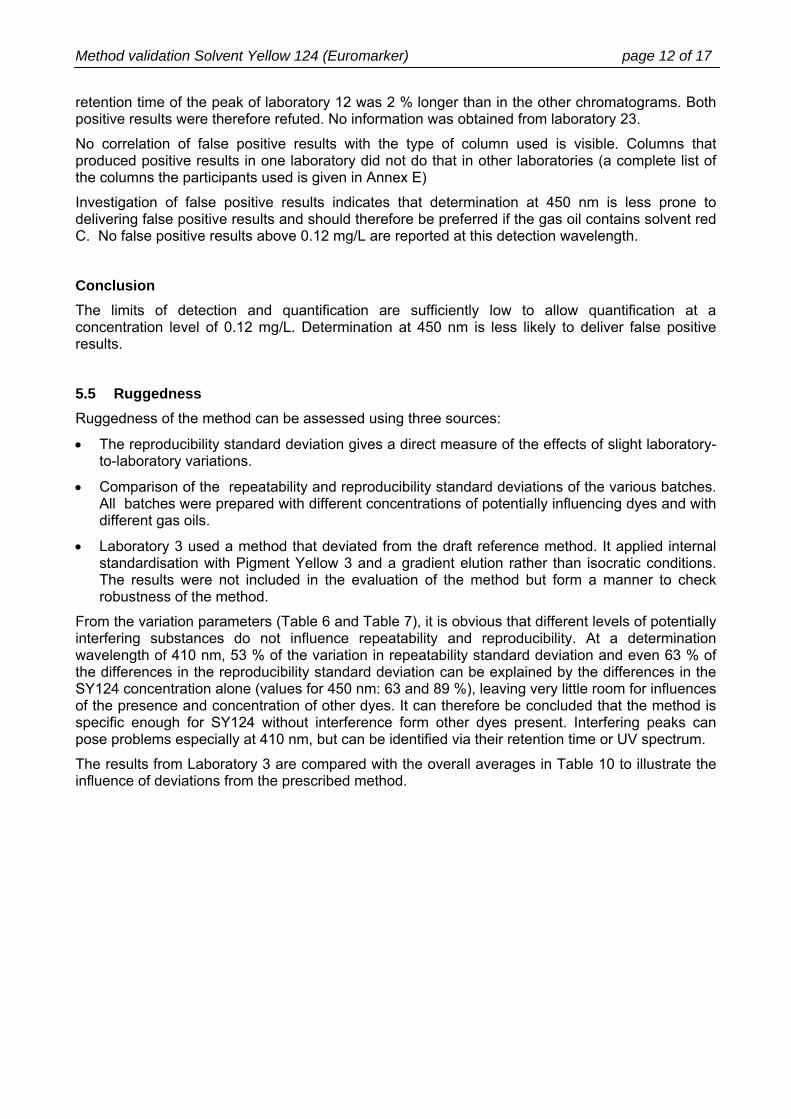
The results for batches 1 and 8 when measured at 450 nm are shown in Figure 3.
Batch 1 (450 nm)
0
0.005
0.01
0.015
0.02
0.025
0.03
0.035
0.04
conc
. [m
g/L]
Batch 8 (450 nm)
0
0.005
0.01
0.015
0.02
0.025
0.03
0.035
0.04
0.045
0.05
conc
. [m
g/L]
Figure 3: Results for the two blank materials when measured at 450 nm
Less false positive results for batch 8 were reported if the measurement is performed at 450 nm. As can be seen in Figure 3, only 3 laboratories reported false positives for batch 1 and batch 8. This indicates that determination at 450 nm is more robust against false positive results. Laboratory 1 stated that the positive result was a result of integrating noise, whereas also here the
Method validation Solvent Yellow 124 (Euromarker) page 12 of 17
retention time of the peak of laboratory 12 was 2 % longer than in the other chromatograms. Both positive results were therefore refuted. No information was obtained from laboratory 23.
No correlation of false positive results with the type of column used is visible. Columns that produced positive results in one laboratory did not do that in other laboratories (a complete list of the columns the participants used is given in Annex E)
Investigation of false positive results indicates that determination at 450 nm is less prone to delivering false positive results and should therefore be preferred if the gas oil contains solvent red C. No false positive results above 0.12 mg/L are reported at this detection wavelength.
Conclusion The limits of detection and quantification are sufficiently low to allow quantification at a concentration level of 0.12 mg/L. Determination at 450 nm is less likely to deliver false positive results.
5.5 Ruggedness Ruggedness of the method can be assessed using three sources:
• The reproducibility standard deviation gives a direct measure of the effects of slight laboratory-to-laboratory variations.
• Comparison of the repeatability and reproducibility standard deviations of the various batches. All batches were prepared with different concentrations of potentially influencing dyes and with different gas oils.
• Laboratory 3 used a method that deviated from the draft reference method. It applied internal standardisation with Pigment Yellow 3 and a gradient elution rather than isocratic conditions. The results were not included in the evaluation of the method but form a manner to check robustness of the method.
From the variation parameters (Table 6 and Table 7), it is obvious that different levels of potentially interfering substances do not influence repeatability and reproducibility. At a determination wavelength of 410 nm, 53 % of the variation in repeatability standard deviation and even 63 % of the differences in the reproducibility standard deviation can be explained by the differences in the SY124 concentration alone (values for 450 nm: 63 and 89 %), leaving very little room for influences of the presence and concentration of other dyes. It can therefore be concluded that the method is specific enough for SY124 without interference form other dyes present. Interfering peaks can pose problems especially at 410 nm, but can be identified via their retention time or UV spectrum.
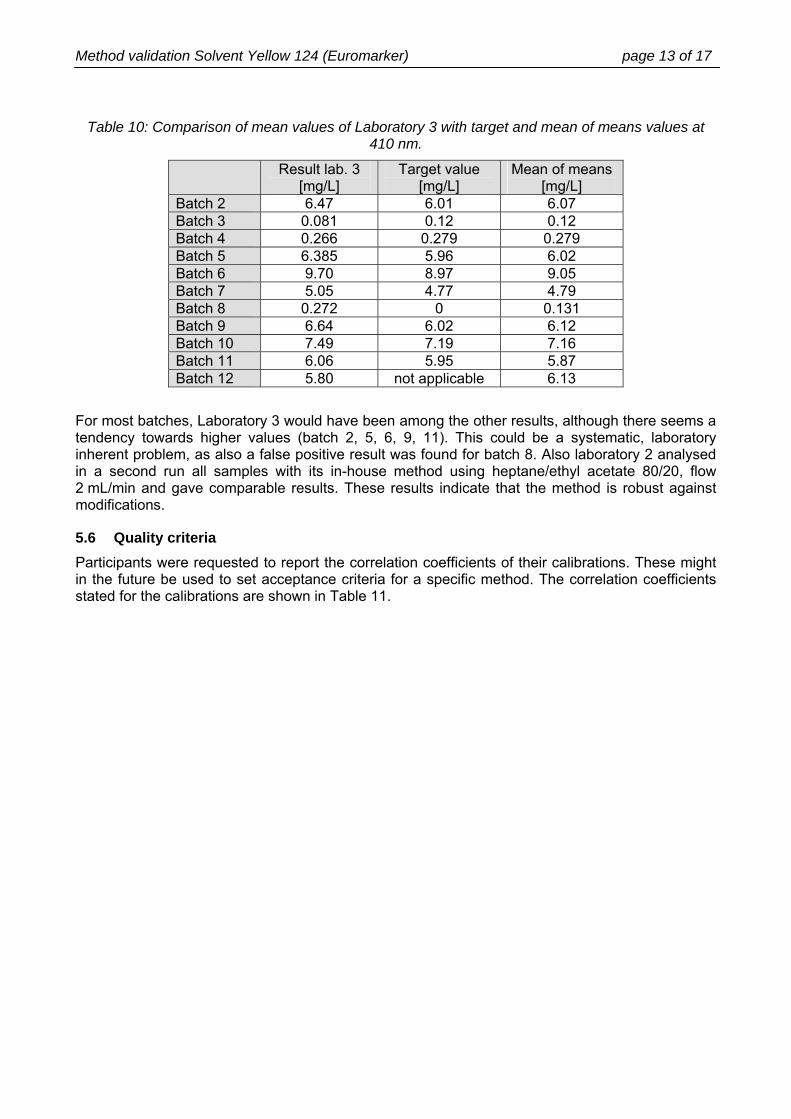
The results from Laboratory 3 are compared with the overall averages in Table 10 to illustrate the influence of deviations from the prescribed method.
Method validation Solvent Yellow 124 (Euromarker) page 13 of 17
Table 10: Comparison of mean values of Laboratory 3 with target and mean of means values at 410 nm.
Result lab. 3 [mg/L]
Target value [mg/L]
Mean of means [mg/L]
Batch 2 6.47 6.01 6.07 Batch 3 0.081 0.12 0.12 Batch 4 0.266 0.279 0.279 Batch 5 6.385 5.96 6.02 Batch 6 9.70 8.97 9.05 Batch 7 5.05 4.77 4.79 Batch 8 0.272 0 0.131 Batch 9 6.64 6.02 6.12 Batch 10 7.49 7.19 7.16 Batch 11 6.06 5.95 5.87 Batch 12 5.80 not applicable 6.13
For most batches, Laboratory 3 would have been among the other results, although there seems a tendency towards higher values (batch 2, 5, 6, 9, 11). This could be a systematic, laboratory inherent problem, as also a false positive result was found for batch 8. Also laboratory 2 analysed in a second run all samples with its in-house method using heptane/ethyl acetate 80/20, flow 2 mL/min and gave comparable results. These results indicate that the method is robust against modifications.
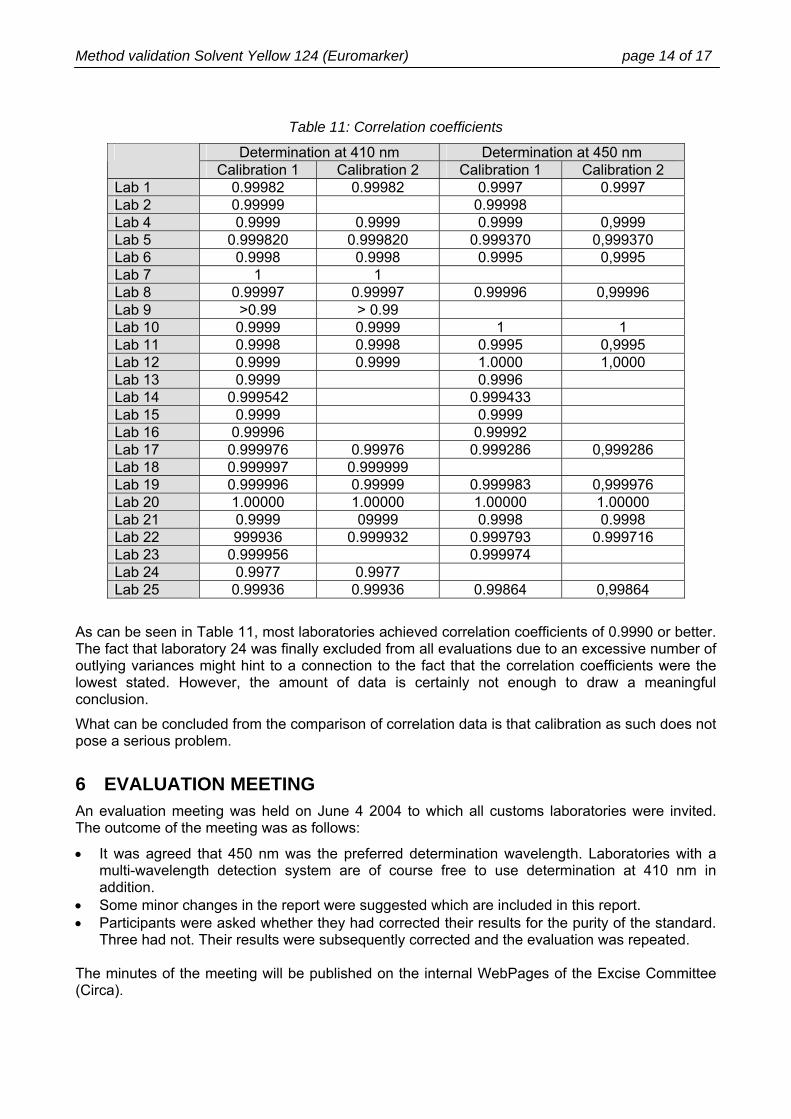
5.6 Quality criteria Participants were requested to report the correlation coefficients of their calibrations. These might in the future be used to set acceptance criteria for a specific method. The correlation coefficients stated for the calibrations are shown in Table 11.
Method validation Solvent Yellow 124 (Euromarker) page 14 of 17
Table 11: Correlation coefficients
Determination at 410 nm Determination at 450 nm Calibration 1 Calibration 2 Calibration 1 Calibration 2
Lab 1 0.99982 0.99982 0.9997 0.9997 Lab 2 0.99999 0.99998 Lab 4 0.9999 0.9999 0.9999 0,9999 Lab 5 0.999820 0.999820 0.999370 0,999370 Lab 6 0.9998 0.9998 0.9995 0,9995 Lab 7 1 1 Lab 8 0.99997 0.99997 0.99996 0,99996 Lab 9 >0.99 > 0.99 Lab 10 0.9999 0.9999 1 1 Lab 11 0.9998 0.9998 0.9995 0,9995 Lab 12 0.9999 0.9999 1.0000 1,0000 Lab 13 0.9999 0.9996 Lab 14 0.999542 0.999433 Lab 15 0.9999 0.9999 Lab 16 0.99996 0.99992 Lab 17 0.999976 0.99976 0.999286 0,999286 Lab 18 0.999997 0.999999 Lab 19 0.999996 0.99999 0.999983 0,999976 Lab 20 1.00000 1.00000 1.00000 1.00000 Lab 21 0.9999 09999 0.9998 0.9998 Lab 22 999936 0.999932 0.999793 0.999716 Lab 23 0.999956 0.999974 Lab 24 0.9977 0.9977 Lab 25 0.99936 0.99936 0.99864 0,99864
As can be seen in Table 11, most laboratories achieved correlation coefficients of 0.9990 or better. The fact that laboratory 24 was finally excluded from all evaluations due to an excessive number of outlying variances might hint to a connection to the fact that the correlation coefficients were the lowest stated. However, the amount of data is certainly not enough to draw a meaningful conclusion.
What can be concluded from the comparison of correlation data is that calibration as such does not pose a serious problem.
6 EVALUATION MEETING An evaluation meeting was held on June 4 2004 to which all customs laboratories were invited. The outcome of the meeting was as follows:
• It was agreed that 450 nm was the preferred determination wavelength. Laboratories with a multi-wavelength detection system are of course free to use determination at 410 nm in addition.
• Some minor changes in the report were suggested which are included in this report. • Participants were asked whether they had corrected their results for the purity of the standard.
Three had not. Their results were subsequently corrected and the evaluation was repeated. The minutes of the meeting will be published on the internal WebPages of the Excise Committee (Circa).
Method validation Solvent Yellow 124 (Euromarker) page 15 of 17
7 SUMMARY AND CONCLUSION • 12 batches of laboratory inter-comparison samples for the validation of the Draft Community
Reference Method for the determination of SY124 in gas oil were gravimetrically prepared and their homogeneity was determined.
• In the concentration range from 4 to 9 mg/L repeatability standard deviation at 410 nm and 450 nm, respectively are 0.056 and 0.056 mg/L. In this range the relative reproducibility standard deviations at 410 nm and 450 nm are 3.7 and 3.5 %. These reproducibility standard deviations are better than predicted by the Horwitz equation.
• At a concentration level of 0.12 mg/L repeatability standard deviation at 410 nm and 450 nm, are 0.009 mg/L (7.4 %) and 0.007 mg/L (5.4 %), respectively. Reproducibility standard deviations for determination at 410 nm and 450 nm are 0.015 mg/L (11.9 %) and 0.018 mg/L (14.9 %). These reproducibility standard deviations are better than predicted by the Horwitz equation.
• The method does not have any detectable bias at any of the two determination wavelengths. Very low concentrations of SY124 could be easier determined at 450 nm, because of the lower number of interfering peaks in the gas oils tested. Therefore, determination at 450 nm is preferable.
• The developed reference method does not cause problems in practice from environmental and health point of view as long as it is performed in a professional laboratory.
• The method will be published in the Official Journal of the European Union.
8 PARTICIPANTS Project Coordination Dutch Customs Laboratory, Amsterdam (NL), Mr. Koomen
Purity, homogeneity and stability measurements. Dutch Customs Laboratory, Amsterdam (NL), Mrs Hovener, Mr Polmans, Mrs Sarneel, Mrs
Zwaagstra, Mr Bongaerts
Sample preparation, statistical evaluation Institute for Reference Materials and Measurements, Geel (BE), Mr. Emteborg, Mr, Linsinger, Mr.
Roebben, Mr. Kramer, Ms. Lamberty Interlaboratory comparison Agenzia delle Dogane, Roma (IT), Mr. Massimo BASF Aktiengesellschaft, Ludwigshafen (DE), Mr. Vamvakaris Belastingsdienst/Douane Laboratorium, Amsterdam (NL), Mr. de Groot Customs laboratory of National Customs Board, Riga (LV), Ms. Berna Customs Technical Laboratory, Praha (CZ), Mr. Havelec Finnish Customs Laboratory, Espoo (FI), Mr. Aholainen Force Technology, Brondby (DK), Mr. Bjarnov General Chemical State Laboratory, Athens (GR), Mr. Nomikos John Hogg Technical Solutions, Manchester (UK), Mr. McCallien Laboratoire des Douanes de Paris, Paris (FR), Mr. Audeon Laboratoire National de Santé, Luxembourg (LU), Mr. Flies Laboratorio Central de Aduanas, Madrid (ES), Mr. Iglesias Laboratório da Direcão-Geral das Alfândegas, Lisboa (PT), Ms. Costa Laboratorio de la Aduana, Barcelona (ES), Mr. Fernández Laboratorium van Douane en Accijnzen, Leuven (BE), Mr. Van Bossuijt Laboratory of the Government Chemist, Teddington (UK), Mr. Rattanjit
Method validation Solvent Yellow 124 (Euromarker) page 16 of 17
Lithuanian Customs Laboratory, Vilnius (LT), Ms. Morkuniene National Laboratory of Forensic Science, Linköping (SE), Ms. Nilsson Orgachim, Oissel (FR), Ms. Tesson State Laboratory, Dublin (IRL), Mr. Mc.Gowan Technische Untersuchungsanstalt, Wien (AT), Mr. Matiasovits Zolltechnische Prüfungs- und Lehranstalt Berlin, Berlin (DE), Mr. Dering Zolltechnische Prüfungs- und Lehranstalt Frankfurt, Frankfurt (DE), Mr. Dossmann Zolltechnische Prüfungs- und Lehranstalt Hamburg, Hamburg (DE), Mr. Soldat Zolltechnische Prüfungs- und Lehranstalt Köln, Köln (DE), Mr. Matthes Zolltechnische Prufungs- und Lehranstalt München, München (DE), Mr. Peltzer
9 GLOSSARY ANOVA ......... Analysis of variance ASTM............ American Society for Testing and Materials DCL............... Dutch Customs Laboratory DSC .............. differential scanning calorimetry IRMM ............ Institute for Reference Materials and Measurements HPLC ............ high performance liquid chromatography ISO................ International Standardisation Organisation ISO DIS......... ISO Draft International Standard IUPAC ........... International Union of Pure and Applied Chemistry JRC............... Directorate General Joint Research Centre LOD............... limit of detection LOQ .............. limit of quantification PTFE............. polytetrafluoroethylene SY124 .......... Solvent Yellow 124 sr ................... repeatability standard deviation sR................... reproducibility standard deviation sL ................... between laboratory standard deviation
10 ACKNOWLEDGEMENTS The authors wish to acknowledge DG TAXUD for its financial support and all participants for their co-operation in this validation study.
11 ANNEXES Annex A: Individual results for each batch for 410 nm and 450 nm; Graphical depiction of all results
and normal probability plot of accepted results
Annex B: Sequence of outlier elimination; Plots of Mandel's h and k statistics
Annex C: z-scores for all laboratories, batches and wavelengths. z-scores are based on means and standard deviation of laboratory means. No z-scores were calculated for batches 1 and 8, as the target concentration for them is zero.
Annex D: Draft reference method for the determination of SY124 as distributed to the participants.
Annex E: Chromatographic columns used by the participants
Annex F: Reference method for the determination of SY124 as to be published in the Official Journal of the European Union.
Method validation Solvent Yellow 124 (Euromarker) page 17 of 17
REFERENCES 1 H. Emteborg, A. Oostra, J. Charoud-Got, G. Kramer, private communication (IRMM Internal
Report " Processing of the candidate European reference materials EF317 and EF318 and ten other solutions within the EUROMARKER project", in preparation)
2 T.P.J. Linsinger, J. Pauwels, A.M.H. van der Veen, H. Schimmel, A. Lamberty (2001), Homogeneity and stability of reference materials, Accred Qual Assur 6:20-25
3 ISO 5725 "Accuracy (trueness and precision" of measurement method and results, ISO, 3rd revision, Geneva 1996
4 ISO 4259 "Petroleum products-Determination and application of precision data in relation to methods of test, Committee draft TC 28 N2168 (2002)
5 D.M. Levine, D. Stephan, T.C. Krehbiel, M. L. Berenson, Statistics for Managers using Microsoft Excel, Prendice Hall, New Jersey, 2002 p. 243-248
6 IUPAC Technical Report, Harmonized guidelines for single laboratory validation of methods of analysis; Pure. Appl. Chem., Vol. 74, No. 5, pp. 835–855, 2002
Annex A: Individual results page 1 of 12
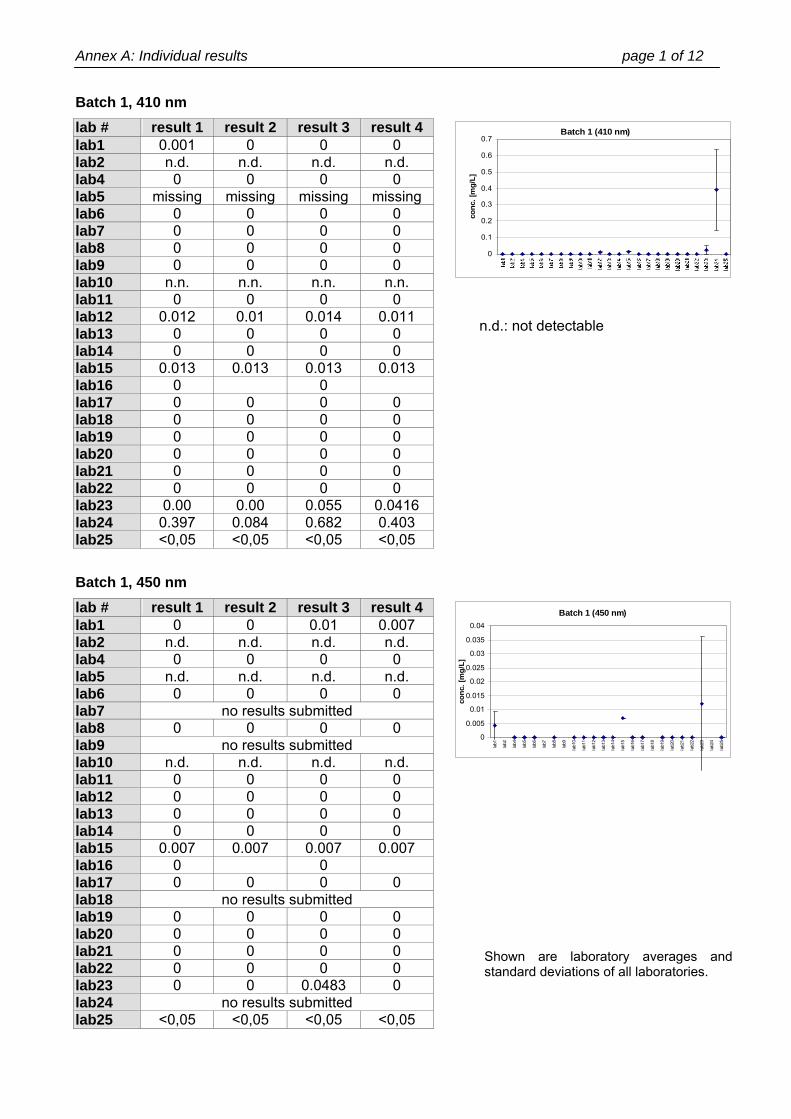
Batch 1, 410 nm lab # result 1 result 2 result 3 result 4 lab1 0.001 0 0 0 lab2 n.d. n.d. n.d. n.d. lab4 0 0 0 0 lab5 missing missing missing missing lab6 0 0 0 0 lab7 0 0 0 0 lab8 0 0 0 0 lab9 0 0 0 0 lab10 n.n. n.n. n.n. n.n. lab11 0 0 0 0 lab12 0.012 0.01 0.014 0.011 lab13 0 0 0 0 lab14 0 0 0 0 lab15 0.013 0.013 0.013 0.013 lab16 0 0 lab17 0 0 0 0 lab18 0 0 0 0 lab19 0 0 0 0 lab20 0 0 0 0 lab21 0 0 0 0 lab22 0 0 0 0 lab23 0.00 0.00 0.055 0.0416 lab24 0.397 0.084 0.682 0.403 lab25 <0,05 <0,05 <0,05 <0,05
Batch 1, 450 nm lab # result 1 result 2 result 3 result 4 lab1 0 0 0.01 0.007 lab2 n.d. n.d. n.d. n.d. lab4 0 0 0 0 lab5 n.d. n.d. n.d. n.d. lab6 0 0 0 0 lab7 no results submitted lab8 0 0 0 0 lab9 no results submitted lab10 n.d. n.d. n.d. n.d. lab11 0 0 0 0 lab12 0 0 0 0 lab13 0 0 0 0 lab14 0 0 0 0 lab15 0.007 0.007 0.007 0.007 lab16 0 0 lab17 0 0 0 0 lab18 no results submitted lab19 0 0 0 0 lab20 0 0 0 0 lab21 0 0 0 0 lab22 0 0 0 0 lab23 0 0 0.0483 0 lab24 no results submitted lab25 <0,05 <0,05 <0,05 <0,05
Shown are laboratory averages and standard deviations of all laboratories.
n.d.: not detectable
Batch 1 (410 nm)
0
0.1
0.2
0.3
0.4
0.5
0.6
0.7
conc
. [m
g/L]
Batch 1 (450 nm)
0
0.005
0.01
0.015
0.02
0.025
0.03
0.035
0.04
lab1
lab2
lab4
lab5
lab6
lab7
lab8
lab9
lab1
0
lab1
1
lab1
2
lab1
3
lab1
4
lab1
5
lab1
6
lab1
7
lab1
8
lab1
9
lab2
0
lab2
1
lab2
2
lab2
3
lab2
4
lab2
5
conc
. [m
g/L]
Annex A: Individual results page 2 of 12
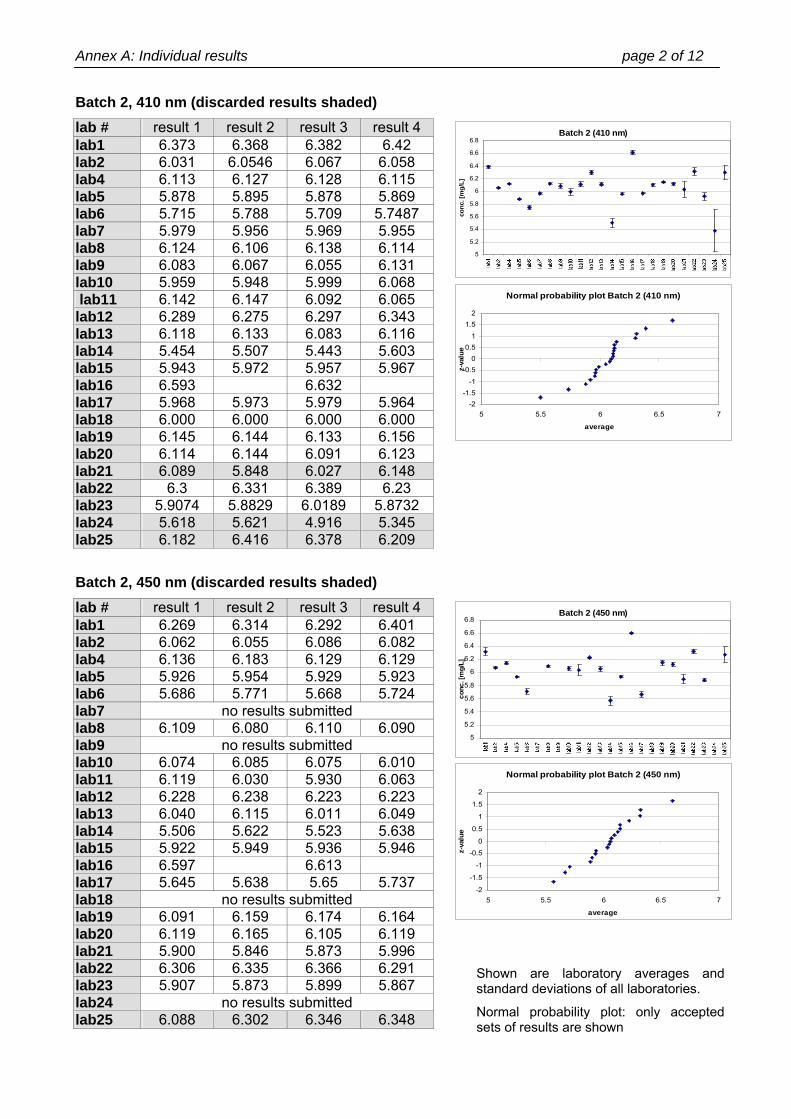
Batch 2, 410 nm (discarded results shaded) lab # result 1 result 2 result 3 result 4 lab1 6.373 6.368 6.382 6.42 lab2 6.031 6.0546 6.067 6.058 lab4 6.113 6.127 6.128 6.115 lab5 5.878 5.895 5.878 5.869 lab6 5.715 5.788 5.709 5.7487 lab7 5.979 5.956 5.969 5.955 lab8 6.124 6.106 6.138 6.114 lab9 6.083 6.067 6.055 6.131 lab10 5.959 5.948 5.999 6.068 lab11 6.142 6.147 6.092 6.065 lab12 6.289 6.275 6.297 6.343 lab13 6.118 6.133 6.083 6.116 lab14 5.454 5.507 5.443 5.603 lab15 5.943 5.972 5.957 5.967 lab16 6.593 6.632 lab17 5.968 5.973 5.979 5.964 lab18 6.000 6.000 6.000 6.000 lab19 6.145 6.144 6.133 6.156 lab20 6.114 6.144 6.091 6.123 lab21 6.089 5.848 6.027 6.148 lab22 6.3 6.331 6.389 6.23 lab23 5.9074 5.8829 6.0189 5.8732 lab24 5.618 5.621 4.916 5.345 lab25 6.182 6.416 6.378 6.209
Batch 2, 450 nm (discarded results shaded) lab # result 1 result 2 result 3 result 4 lab1 6.269 6.314 6.292 6.401 lab2 6.062 6.055 6.086 6.082 lab4 6.136 6.183 6.129 6.129 lab5 5.926 5.954 5.929 5.923 lab6 5.686 5.771 5.668 5.724 lab7 no results submitted lab8 6.109 6.080 6.110 6.090 lab9 no results submitted lab10 6.074 6.085 6.075 6.010 lab11 6.119 6.030 5.930 6.063 lab12 6.228 6.238 6.223 6.223 lab13 6.040 6.115 6.011 6.049 lab14 5.506 5.622 5.523 5.638 lab15 5.922 5.949 5.936 5.946 lab16 6.597 6.613 lab17 5.645 5.638 5.65 5.737 lab18 no results submitted lab19 6.091 6.159 6.174 6.164 lab20 6.119 6.165 6.105 6.119 lab21 5.900 5.846 5.873 5.996 lab22 6.306 6.335 6.366 6.291 lab23 5.907 5.873 5.899 5.867 lab24 no results submitted lab25 6.088 6.302 6.346 6.348
Shown are laboratory averages and standard deviations of all laboratories.
Normal probability plot: only accepted sets of results are shown
Batch 2 (410 nm)
5
5.2
5.4
5.6
5.8
6
6.2
6.4
6.6
6.8
conc
. [m
g/L]
Normal probability plot Batch 2 (410 nm)
-2-1.5
-1
-0.50
0.51
1.52
5 5.5 6 6.5 7
average
z-va
lue
Batch 2 (450 nm)
5
5.2
5.4
5.6
5.8
6
6.2
6.4
6.6
6.8
conc
. [m
g/L]
Normal probability plot Batch 2 (450 nm)
-2
-1.5
-1
-0.5
0
0.5
1
1.5
2
5 5.5 6 6.5 7
average
z-va
lue
Annex A: Individual results page 3 of 12
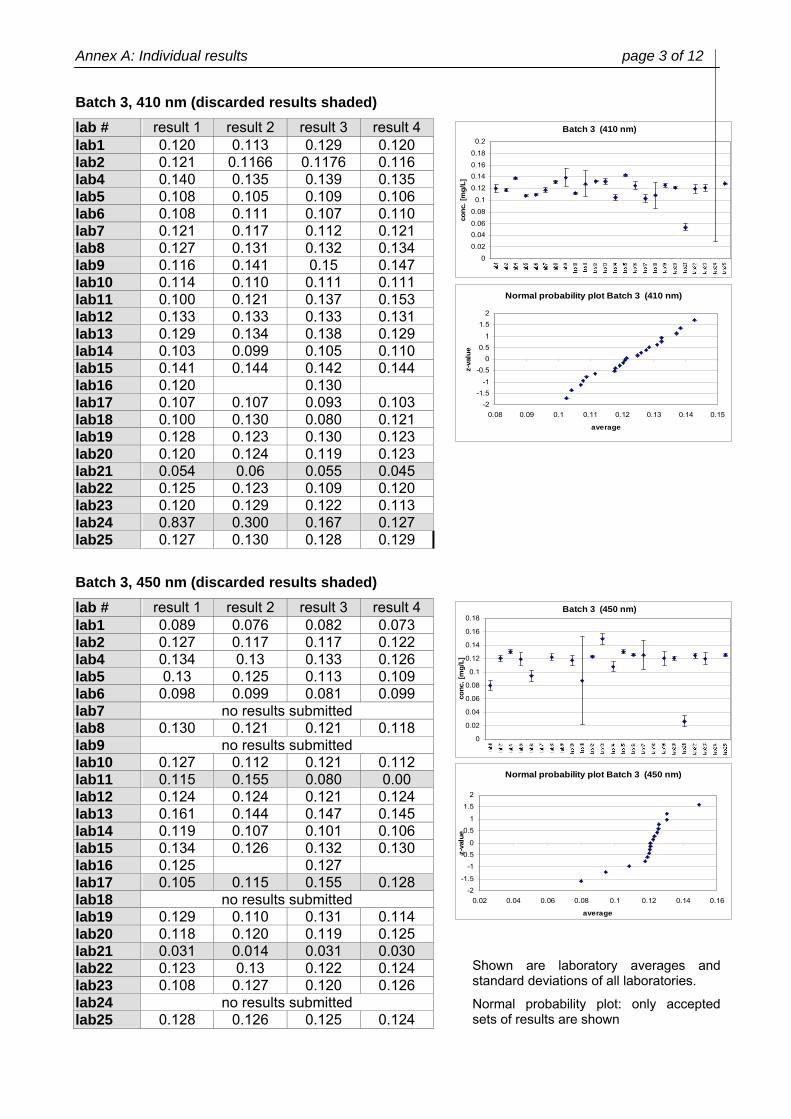
Batch 3, 410 nm (discarded results shaded) lab # result 1 result 2 result 3 result 4 lab1 0.120 0.113 0.129 0.120 lab2 0.121 0.1166 0.1176 0.116 lab4 0.140 0.135 0.139 0.135 lab5 0.108 0.105 0.109 0.106 lab6 0.108 0.111 0.107 0.110 lab7 0.121 0.117 0.112 0.121 lab8 0.127 0.131 0.132 0.134 lab9 0.116 0.141 0.15 0.147 lab10 0.114 0.110 0.111 0.111 lab11 0.100 0.121 0.137 0.153 lab12 0.133 0.133 0.133 0.131 lab13 0.129 0.134 0.138 0.129 lab14 0.103 0.099 0.105 0.110 lab15 0.141 0.144 0.142 0.144 lab16 0.120 0.130 lab17 0.107 0.107 0.093 0.103 lab18 0.100 0.130 0.080 0.121 lab19 0.128 0.123 0.130 0.123 lab20 0.120 0.124 0.119 0.123 lab21 0.054 0.06 0.055 0.045 lab22 0.125 0.123 0.109 0.120 lab23 0.120 0.129 0.122 0.113 lab24 0.837 0.300 0.167 0.127 lab25 0.127 0.130 0.128 0.129
Batch 3, 450 nm (discarded results shaded) lab # result 1 result 2 result 3 result 4 lab1 0.089 0.076 0.082 0.073 lab2 0.127 0.117 0.117 0.122 lab4 0.134 0.13 0.133 0.126 lab5 0.13 0.125 0.113 0.109 lab6 0.098 0.099 0.081 0.099 lab7 no results submitted lab8 0.130 0.121 0.121 0.118 lab9 no results submitted lab10 0.127 0.112 0.121 0.112 lab11 0.115 0.155 0.080 0.00 lab12 0.124 0.124 0.121 0.124 lab13 0.161 0.144 0.147 0.145 lab14 0.119 0.107 0.101 0.106 lab15 0.134 0.126 0.132 0.130 lab16 0.125 0.127 lab17 0.105 0.115 0.155 0.128 lab18 no results submitted lab19 0.129 0.110 0.131 0.114 lab20 0.118 0.120 0.119 0.125 lab21 0.031 0.014 0.031 0.030 lab22 0.123 0.13 0.122 0.124 lab23 0.108 0.127 0.120 0.126 lab24 no results submitted lab25 0.128 0.126 0.125 0.124
Shown are laboratory averages and standard deviations of all laboratories.
Normal probability plot: only accepted sets of results are shown
Batch 3 (410 nm)
0
0.02
0.040.06
0.08
0.1
0.12
0.140.16
0.18
0.2
conc
. [m
g/L]
Normal probability plot Batch 3 (410 nm)
-2-1.5
-1
-0.50
0.51
1.52
0.08 0.09 0.1 0.11 0.12 0.13 0.14 0.15
average
z-va
lue
Batch 3 (450 nm)
0
0.02
0.04
0.06
0.08
0.1
0.12
0.14
0.16
0.18
conc
. [m
g/L]
Normal probability plot Batch 3 (450 nm)
-2
-1.5
-1
-0.5
0
0.5
1
1.5
2
0.02 0.04 0.06 0.08 0.1 0.12 0.14 0.16
average
z-va
lue
Annex A: Individual results page 4 of 12
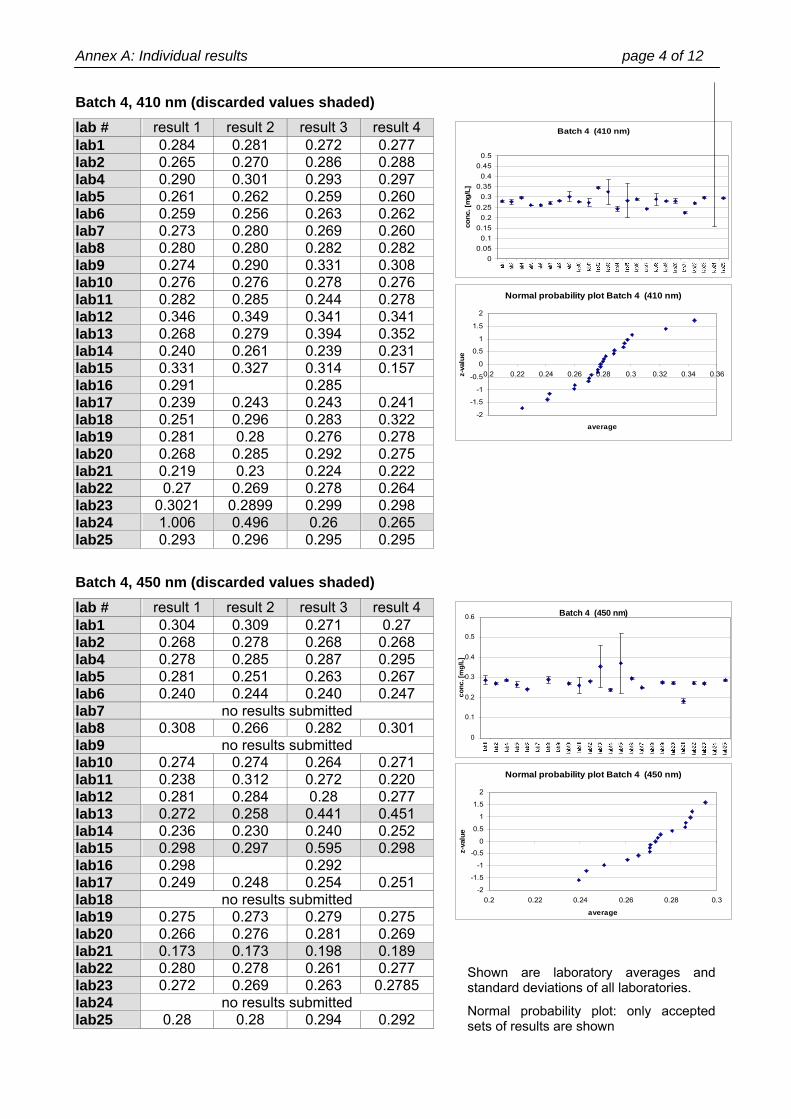
Batch 4, 410 nm (discarded values shaded) lab # result 1 result 2 result 3 result 4 lab1 0.284 0.281 0.272 0.277 lab2 0.265 0.270 0.286 0.288 lab4 0.290 0.301 0.293 0.297 lab5 0.261 0.262 0.259 0.260 lab6 0.259 0.256 0.263 0.262 lab7 0.273 0.280 0.269 0.260 lab8 0.280 0.280 0.282 0.282 lab9 0.274 0.290 0.331 0.308 lab10 0.276 0.276 0.278 0.276 lab11 0.282 0.285 0.244 0.278 lab12 0.346 0.349 0.341 0.341 lab13 0.268 0.279 0.394 0.352 lab14 0.240 0.261 0.239 0.231 lab15 0.331 0.327 0.314 0.157 lab16 0.291 0.285 lab17 0.239 0.243 0.243 0.241 lab18 0.251 0.296 0.283 0.322 lab19 0.281 0.28 0.276 0.278 lab20 0.268 0.285 0.292 0.275 lab21 0.219 0.23 0.224 0.222 lab22 0.27 0.269 0.278 0.264 lab23 0.3021 0.2899 0.299 0.298 lab24 1.006 0.496 0.26 0.265 lab25 0.293 0.296 0.295 0.295
Batch 4, 450 nm (discarded values shaded) lab # result 1 result 2 result 3 result 4 lab1 0.304 0.309 0.271 0.27 lab2 0.268 0.278 0.268 0.268 lab4 0.278 0.285 0.287 0.295 lab5 0.281 0.251 0.263 0.267 lab6 0.240 0.244 0.240 0.247 lab7 no results submitted lab8 0.308 0.266 0.282 0.301 lab9 no results submitted lab10 0.274 0.274 0.264 0.271 lab11 0.238 0.312 0.272 0.220 lab12 0.281 0.284 0.28 0.277 lab13 0.272 0.258 0.441 0.451 lab14 0.236 0.230 0.240 0.252 lab15 0.298 0.297 0.595 0.298 lab16 0.298 0.292 lab17 0.249 0.248 0.254 0.251 lab18 no results submitted lab19 0.275 0.273 0.279 0.275 lab20 0.266 0.276 0.281 0.269 lab21 0.173 0.173 0.198 0.189 lab22 0.280 0.278 0.261 0.277 lab23 0.272 0.269 0.263 0.2785 lab24 no results submitted lab25 0.28 0.28 0.294 0.292
Shown are laboratory averages and standard deviations of all laboratories.
Normal probability plot: only accepted sets of results are shown
Batch 4 (410 nm)
00.05
0.10.15
0.20.25
0.30.35
0.40.45
0.5
conc
. [m
g/L]
Normal probability plot Batch 4 (410 nm)
-2
-1.5
-1
-0.5
0
0.5
1
1.5
2
0.2 0.22 0.24 0.26 0.28 0.3 0.32 0.34 0.36
average
z-va
lue
Batch 4 (450 nm)
0
0.1
0.2
0.3
0.4
0.5
0.6
conc
. [m
g/L]
Normal probability plot Batch 4 (450 nm)
-2
-1.5
-1
-0.5
0
0.5
1
1.5
2
0.2 0.22 0.24 0.26 0.28 0.3
average
z-va
lue
Annex A: Individual results page 5 of 12
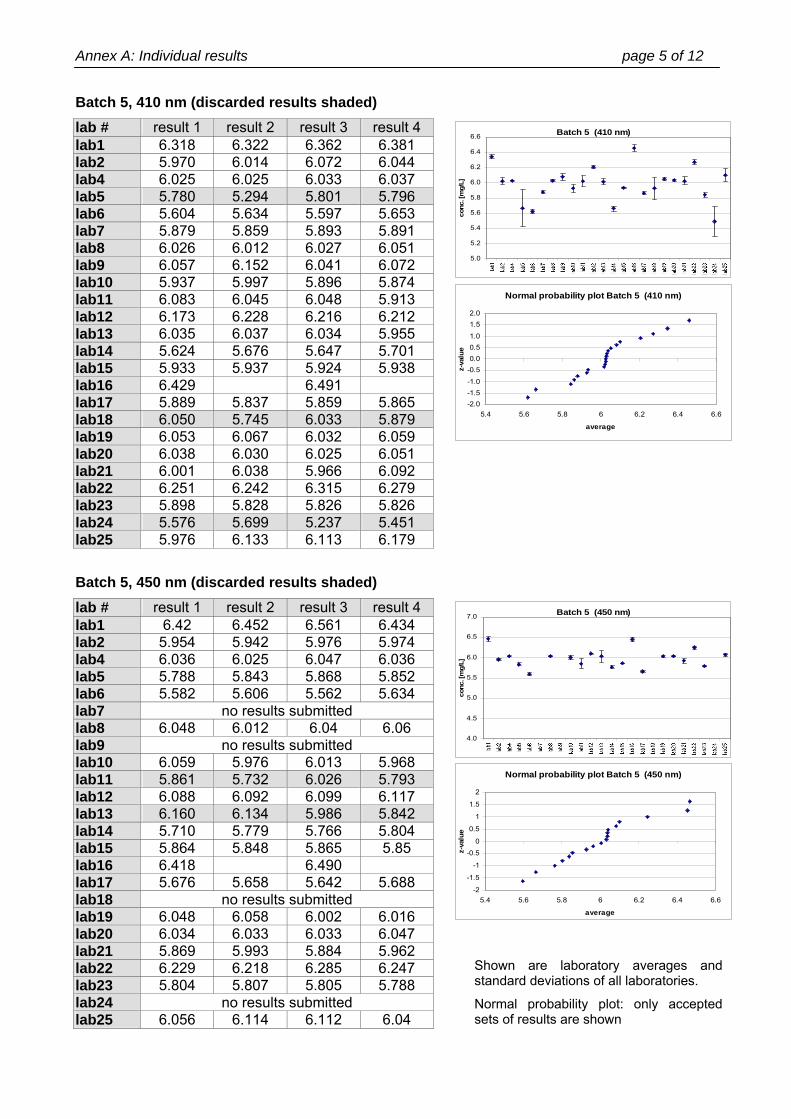
Batch 5, 410 nm (discarded results shaded) lab # result 1 result 2 result 3 result 4 lab1 6.318 6.322 6.362 6.381 lab2 5.970 6.014 6.072 6.044 lab4 6.025 6.025 6.033 6.037 lab5 5.780 5.294 5.801 5.796 lab6 5.604 5.634 5.597 5.653 lab7 5.879 5.859 5.893 5.891 lab8 6.026 6.012 6.027 6.051 lab9 6.057 6.152 6.041 6.072 lab10 5.937 5.997 5.896 5.874 lab11 6.083 6.045 6.048 5.913 lab12 6.173 6.228 6.216 6.212 lab13 6.035 6.037 6.034 5.955 lab14 5.624 5.676 5.647 5.701 lab15 5.933 5.937 5.924 5.938 lab16 6.429 6.491 lab17 5.889 5.837 5.859 5.865 lab18 6.050 5.745 6.033 5.879 lab19 6.053 6.067 6.032 6.059 lab20 6.038 6.030 6.025 6.051 lab21 6.001 6.038 5.966 6.092 lab22 6.251 6.242 6.315 6.279 lab23 5.898 5.828 5.826 5.826 lab24 5.576 5.699 5.237 5.451 lab25 5.976 6.133 6.113 6.179
Batch 5, 450 nm (discarded results shaded) lab # result 1 result 2 result 3 result 4 lab1 6.42 6.452 6.561 6.434 lab2 5.954 5.942 5.976 5.974 lab4 6.036 6.025 6.047 6.036 lab5 5.788 5.843 5.868 5.852 lab6 5.582 5.606 5.562 5.634 lab7 no results submitted lab8 6.048 6.012 6.04 6.06 lab9 no results submitted lab10 6.059 5.976 6.013 5.968 lab11 5.861 5.732 6.026 5.793 lab12 6.088 6.092 6.099 6.117 lab13 6.160 6.134 5.986 5.842 lab14 5.710 5.779 5.766 5.804 lab15 5.864 5.848 5.865 5.85 lab16 6.418 6.490 lab17 5.676 5.658 5.642 5.688 lab18 no results submitted lab19 6.048 6.058 6.002 6.016 lab20 6.034 6.033 6.033 6.047 lab21 5.869 5.993 5.884 5.962 lab22 6.229 6.218 6.285 6.247 lab23 5.804 5.807 5.805 5.788 lab24 no results submitted lab25 6.056 6.114 6.112 6.04
Shown are laboratory averages and standard deviations of all laboratories.
Normal probability plot: only accepted sets of results are shown
Batch 5 (410 nm)
5.0
5.2
5.4
5.6
5.8
6.0
6.2
6.4
6.6
conc
. [m
g/L]
Normal probability plot Batch 5 (410 nm)
-2.0-1.5-1.0
-0.50.00.51.0
1.52.0
5.4 5.6 5.8 6 6.2 6.4 6.6
average
z-va
lue
Batch 5 (450 nm)
4.0
4.5
5.0
5.5
6.0
6.5
7.0
conc
. [m
g/L]
Normal probability plot Batch 5 (450 nm)
-2
-1.5
-1
-0.5
0
0.5
1
1.5
2
5.4 5.6 5.8 6 6.2 6.4 6.6
average
z-va
lue
Annex A: Individual results page 6 of 12
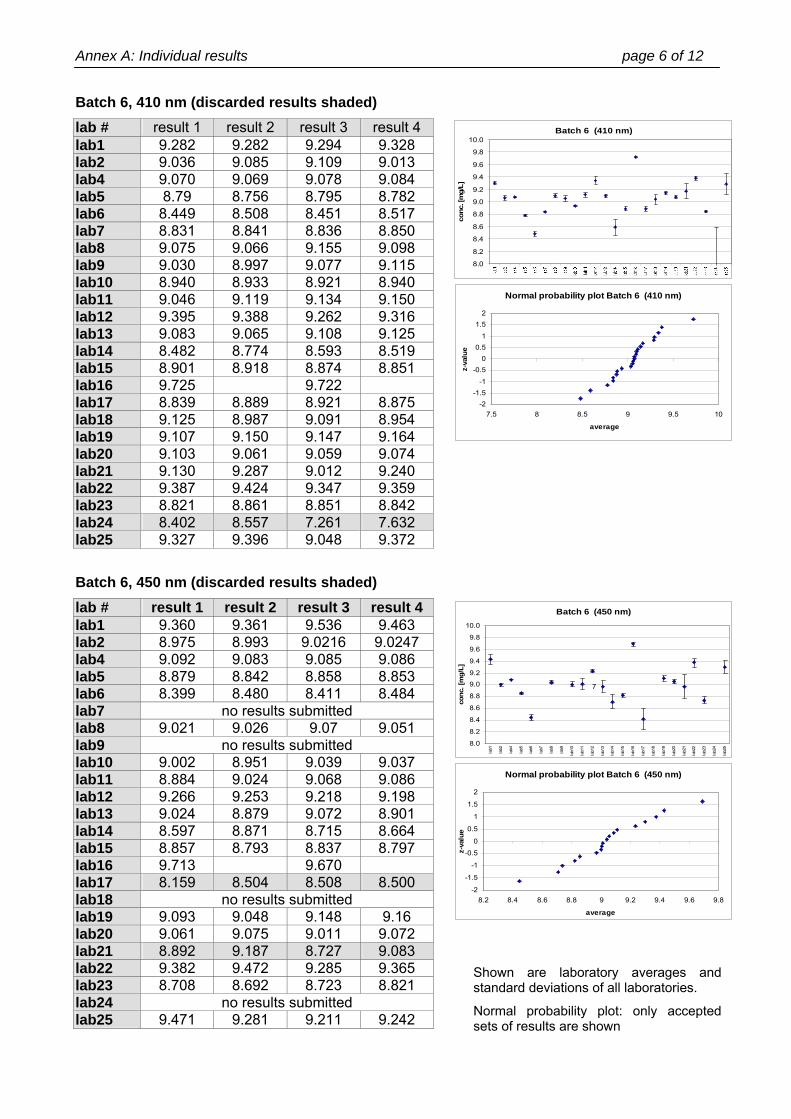
Batch 6, 410 nm (discarded results shaded) lab # result 1 result 2 result 3 result 4 lab1 9.282 9.282 9.294 9.328 lab2 9.036 9.085 9.109 9.013 lab4 9.070 9.069 9.078 9.084 lab5 8.79 8.756 8.795 8.782 lab6 8.449 8.508 8.451 8.517 lab7 8.831 8.841 8.836 8.850 lab8 9.075 9.066 9.155 9.098 lab9 9.030 8.997 9.077 9.115 lab10 8.940 8.933 8.921 8.940 lab11 9.046 9.119 9.134 9.150 lab12 9.395 9.388 9.262 9.316 lab13 9.083 9.065 9.108 9.125 lab14 8.482 8.774 8.593 8.519 lab15 8.901 8.918 8.874 8.851 lab16 9.725 9.722 lab17 8.839 8.889 8.921 8.875 lab18 9.125 8.987 9.091 8.954 lab19 9.107 9.150 9.147 9.164 lab20 9.103 9.061 9.059 9.074 lab21 9.130 9.287 9.012 9.240 lab22 9.387 9.424 9.347 9.359 lab23 8.821 8.861 8.851 8.842 lab24 8.402 8.557 7.261 7.632 lab25 9.327 9.396 9.048 9.372
Batch 6, 450 nm (discarded results shaded) lab # result 1 result 2 result 3 result 4 lab1 9.360 9.361 9.536 9.463 lab2 8.975 8.993 9.0216 9.0247 lab4 9.092 9.083 9.085 9.086 lab5 8.879 8.842 8.858 8.853 lab6 8.399 8.480 8.411 8.484 lab7 no results submitted lab8 9.021 9.026 9.07 9.051 lab9 no results submitted lab10 9.002 8.951 9.039 9.037 lab11 8.884 9.024 9.068 9.086 lab12 9.266 9.253 9.218 9.198 lab13 9.024 8.879 9.072 8.901 lab14 8.597 8.871 8.715 8.664 lab15 8.857 8.793 8.837 8.797 lab16 9.713 9.670 lab17 8.159 8.504 8.508 8.500 lab18 no results submitted lab19 9.093 9.048 9.148 9.16 lab20 9.061 9.075 9.011 9.072 lab21 8.892 9.187 8.727 9.083 lab22 9.382 9.472 9.285 9.365 lab23 8.708 8.692 8.723 8.821 lab24 no results submitted lab25 9.471 9.281 9.211 9.242
Shown are laboratory averages and standard deviations of all laboratories.
Normal probability plot: only accepted sets of results are shown
Batch 6 (410 nm)
8.0
8.2
8.4
8.6
8.8
9.0
9.2
9.4
9.6
9.8
10.0
conc
. [m
g/L]
Normal probability plot Batch 6 (410 nm)
-2-1.5
-1
-0.50
0.51
1.52
7.5 8 8.5 9 9.5 10
average
z-va
lue
Batch 6 (450 nm)
8.0
8.2
8.4
8.6
8.8
9.0
9.2
9.4
9.6
9.8
10.0
lab1
lab2
lab4
lab5
lab6
lab7
lab8
lab9
lab1
0
lab1
1
lab1
2
lab1
3
lab1
4
lab1
5
lab1
6
lab1
7
lab1
8
lab1
9
lab2
0
lab2
1
lab2
2
lab2
3
lab2
4
lab2
5
conc
. [m
g/L]
7
Normal probability plot Batch 6 (450 nm)
-2
-1.5
-1
-0.5
0
0.5
1
1.5
2
8.2 8.4 8.6 8.8 9 9.2 9.4 9.6 9.8
average
z-va
lue
Annex A: Individual results page 7 of 12
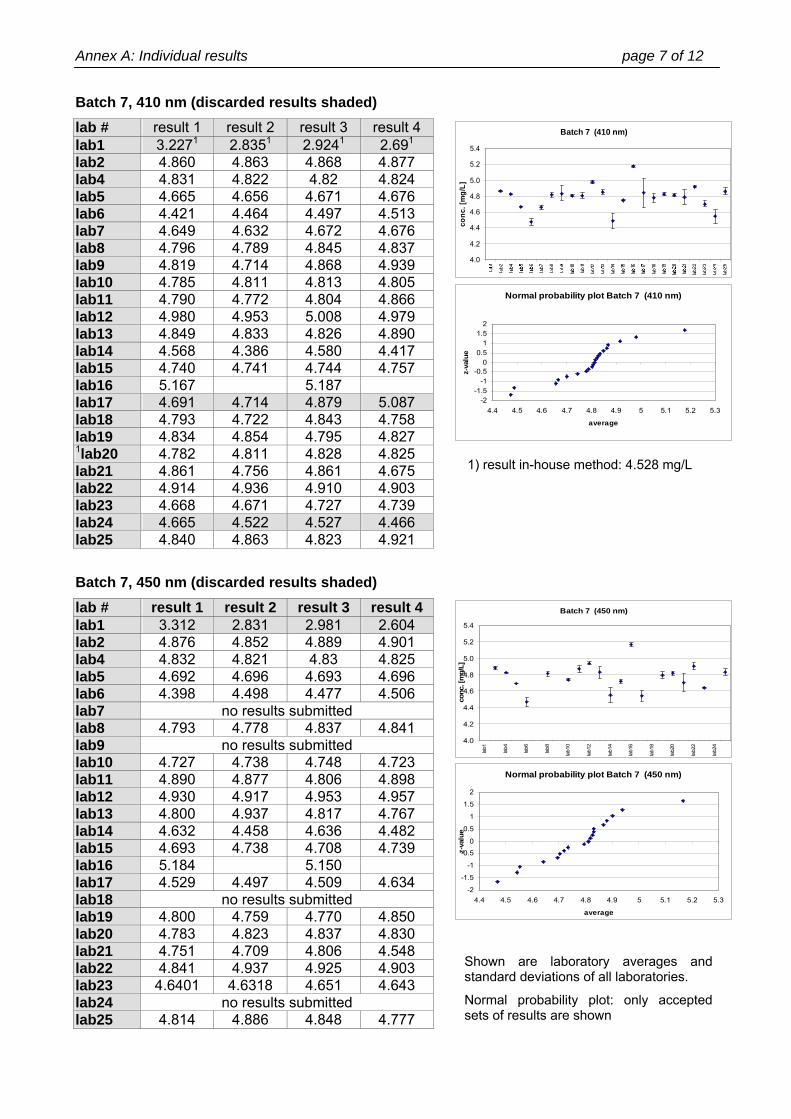
Batch 7, 410 nm (discarded results shaded) lab # result 1 result 2 result 3 result 4 lab1 3.2271 2.8351 2.9241 2.691 lab2 4.860 4.863 4.868 4.877 lab4 4.831 4.822 4.82 4.824 lab5 4.665 4.656 4.671 4.676 lab6 4.421 4.464 4.497 4.513 lab7 4.649 4.632 4.672 4.676 lab8 4.796 4.789 4.845 4.837 lab9 4.819 4.714 4.868 4.939 lab10 4.785 4.811 4.813 4.805 lab11 4.790 4.772 4.804 4.866 lab12 4.980 4.953 5.008 4.979 lab13 4.849 4.833 4.826 4.890 lab14 4.568 4.386 4.580 4.417 lab15 4.740 4.741 4.744 4.757 lab16 5.167 5.187 lab17 4.691 4.714 4.879 5.087 lab18 4.793 4.722 4.843 4.758 lab19 4.834 4.854 4.795 4.827 1lab20 4.782 4.811 4.828 4.825 lab21 4.861 4.756 4.861 4.675 lab22 4.914 4.936 4.910 4.903 lab23 4.668 4.671 4.727 4.739 lab24 4.665 4.522 4.527 4.466 lab25 4.840 4.863 4.823 4.921
Batch 7, 450 nm (discarded results shaded) lab # result 1 result 2 result 3 result 4 lab1 3.312 2.831 2.981 2.604 lab2 4.876 4.852 4.889 4.901 lab4 4.832 4.821 4.83 4.825 lab5 4.692 4.696 4.693 4.696 lab6 4.398 4.498 4.477 4.506 lab7 no results submitted lab8 4.793 4.778 4.837 4.841 lab9 no results submitted lab10 4.727 4.738 4.748 4.723 lab11 4.890 4.877 4.806 4.898 lab12 4.930 4.917 4.953 4.957 lab13 4.800 4.937 4.817 4.767 lab14 4.632 4.458 4.636 4.482 lab15 4.693 4.738 4.708 4.739 lab16 5.184 5.150 lab17 4.529 4.497 4.509 4.634 lab18 no results submitted lab19 4.800 4.759 4.770 4.850 lab20 4.783 4.823 4.837 4.830 lab21 4.751 4.709 4.806 4.548 lab22 4.841 4.937 4.925 4.903 lab23 4.6401 4.6318 4.651 4.643 lab24 no results submitted lab25 4.814 4.886 4.848 4.777
Shown are laboratory averages and standard deviations of all laboratories.
Normal probability plot: only accepted sets of results are shown
1) result in-house method: 4.528 mg/L
Batch 7 (410 nm)
4.0
4.2
4.4
4.6
4.8
5.0
5.2
5.4
conc
. [m
g/L]
Normal probability plot Batch 7 (410 nm)
-2-1.5
-1-0.5
00.5
11.5
2
4.4 4.5 4.6 4.7 4.8 4.9 5 5.1 5.2 5.3
average
z-va
lue
Batch 7 (450 nm)
4.0
4.2
4.4
4.6
4.8
5.0
5.2
5.4
lab1
lab4
lab6
lab8
lab1
0
lab1
2
lab1
4
lab1
6
lab1
8
lab2
0
lab2
2
lab2
4
conc
. [m
g/L]
Normal probability plot Batch 7 (450 nm)
-2
-1.5
-1
-0.5
0
0.5
1
1.5
2
4.4 4.5 4.6 4.7 4.8 4.9 5 5.1 5.2 5.3
average
z-va
lue
Annex A: Individual results page 8 of 12
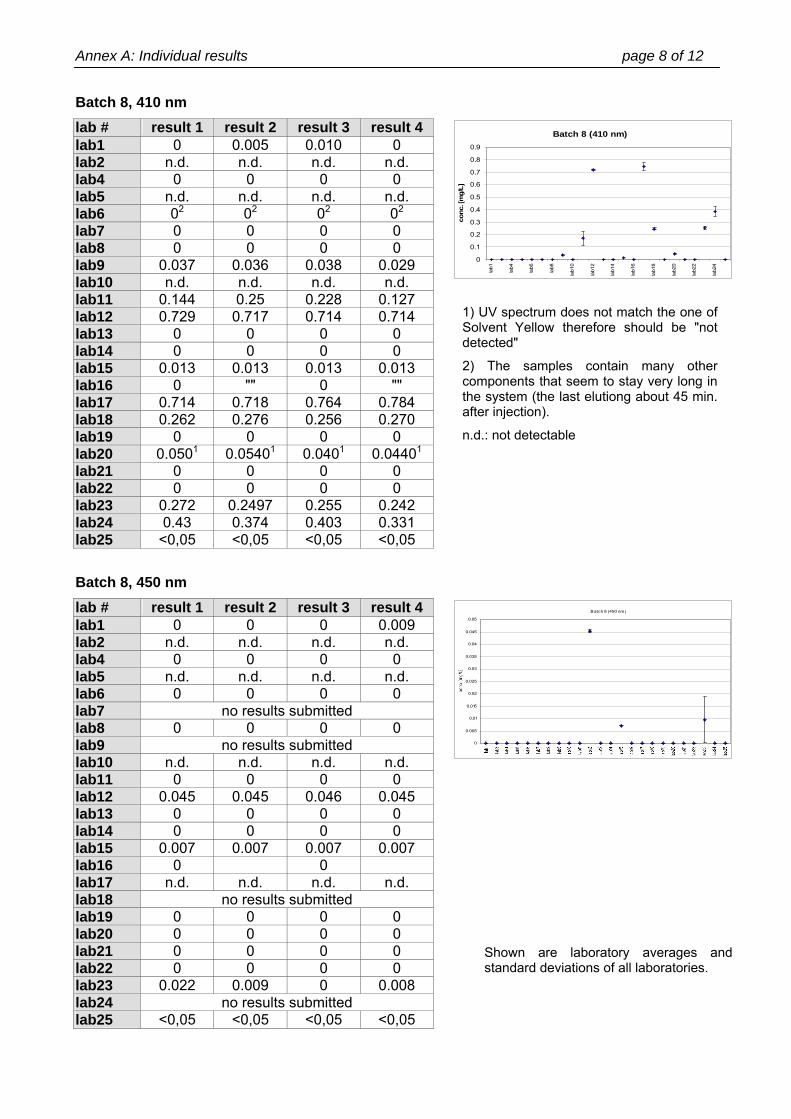
Batch 8, 410 nm lab # result 1 result 2 result 3 result 4 lab1 0 0.005 0.010 0 lab2 n.d. n.d. n.d. n.d. lab4 0 0 0 0 lab5 n.d. n.d. n.d. n.d. lab6 02 02 02 02 lab7 0 0 0 0 lab8 0 0 0 0 lab9 0.037 0.036 0.038 0.029 lab10 n.d. n.d. n.d. n.d. lab11 0.144 0.25 0.228 0.127 lab12 0.729 0.717 0.714 0.714 lab13 0 0 0 0 lab14 0 0 0 0 lab15 0.013 0.013 0.013 0.013 lab16 0 "" 0 "" lab17 0.714 0.718 0.764 0.784 lab18 0.262 0.276 0.256 0.270 lab19 0 0 0 0 lab20 0.0501 0.05401 0.0401 0.04401 lab21 0 0 0 0 lab22 0 0 0 0 lab23 0.272 0.2497 0.255 0.242 lab24 0.43 0.374 0.403 0.331 lab25 <0,05 <0,05 <0,05 <0,05
Batch 8, 450 nm lab # result 1 result 2 result 3 result 4 lab1 0 0 0 0.009 lab2 n.d. n.d. n.d. n.d. lab4 0 0 0 0 lab5 n.d. n.d. n.d. n.d. lab6 0 0 0 0 lab7 no results submitted lab8 0 0 0 0 lab9 no results submitted lab10 n.d. n.d. n.d. n.d. lab11 0 0 0 0 lab12 0.045 0.045 0.046 0.045 lab13 0 0 0 0 lab14 0 0 0 0 lab15 0.007 0.007 0.007 0.007 lab16 0 0 lab17 n.d. n.d. n.d. n.d. lab18 no results submitted lab19 0 0 0 0 lab20 0 0 0 0 lab21 0 0 0 0 lab22 0 0 0 0 lab23 0.022 0.009 0 0.008 lab24 no results submitted lab25 <0,05 <0,05 <0,05 <0,05
Shown are laboratory averages and standard deviations of all laboratories.
1) UV spectrum does not match the one of Solvent Yellow therefore should be "not detected"
2) The samples contain many other components that seem to stay very long in the system (the last elutiong about 45 min. after injection).
n.d.: not detectable
Batch 8 (410 nm)
0
0.1
0.2
0.3
0.4
0.5
0.6
0.7
0.8
0.9
lab1
lab4
lab6
lab8
lab1
0
lab1
2
lab1
4
lab1
6
lab1
8
lab2
0
lab2
2
lab2
4
conc
. [m
g/L]
Batch 8 (450 nm)
0
0.005
0.01
0.015
0.02
0.025
0.03
0.035
0.04
0.045
0.05
Annex A: Individual results page 9 of 12
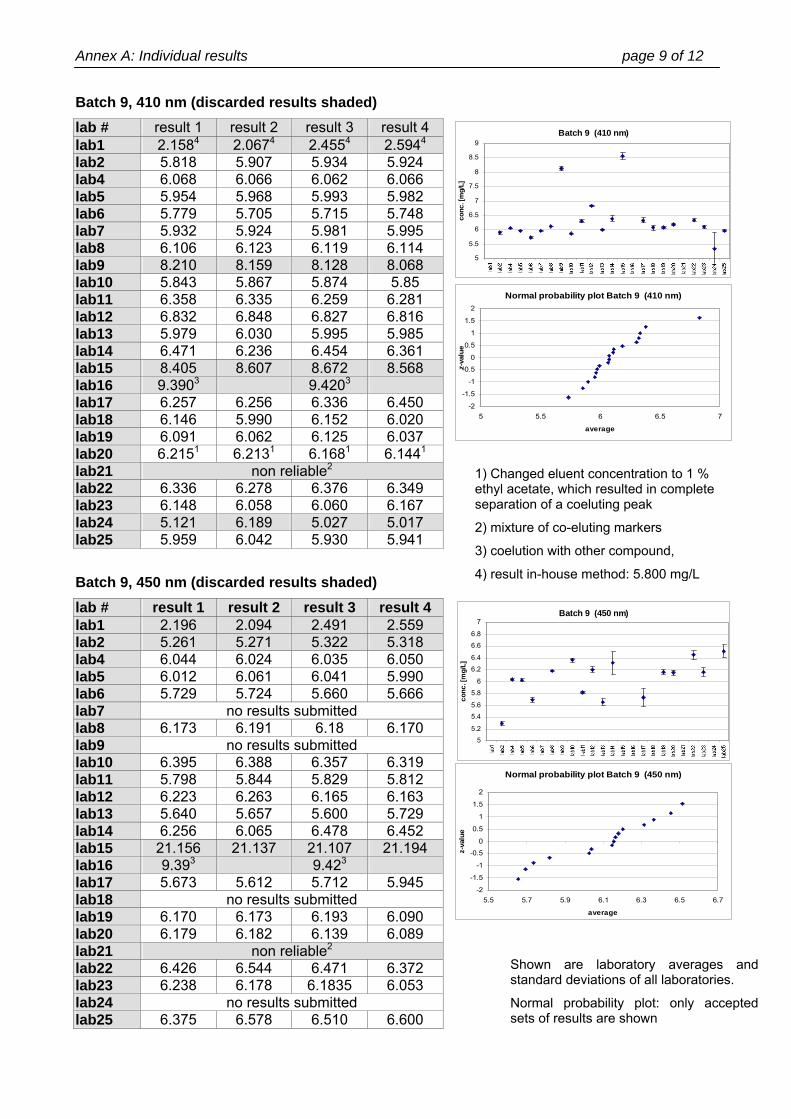
Batch 9, 410 nm (discarded results shaded) lab # result 1 result 2 result 3 result 4 lab1 2.1584 2.0674 2.4554 2.5944 lab2 5.818 5.907 5.934 5.924 lab4 6.068 6.066 6.062 6.066 lab5 5.954 5.968 5.993 5.982 lab6 5.779 5.705 5.715 5.748 lab7 5.932 5.924 5.981 5.995 lab8 6.106 6.123 6.119 6.114 lab9 8.210 8.159 8.128 8.068 lab10 5.843 5.867 5.874 5.85 lab11 6.358 6.335 6.259 6.281 lab12 6.832 6.848 6.827 6.816 lab13 5.979 6.030 5.995 5.985 lab14 6.471 6.236 6.454 6.361 lab15 8.405 8.607 8.672 8.568 lab16 9.3903 9.4203 lab17 6.257 6.256 6.336 6.450 lab18 6.146 5.990 6.152 6.020 lab19 6.091 6.062 6.125 6.037 lab20 6.2151 6.2131 6.1681 6.1441 lab21 non reliable2 lab22 6.336 6.278 6.376 6.349 lab23 6.148 6.058 6.060 6.167 lab24 5.121 6.189 5.027 5.017 lab25 5.959 6.042 5.930 5.941
Batch 9, 450 nm (discarded results shaded) lab # result 1 result 2 result 3 result 4 lab1 2.196 2.094 2.491 2.559 lab2 5.261 5.271 5.322 5.318 lab4 6.044 6.024 6.035 6.050 lab5 6.012 6.061 6.041 5.990 lab6 5.729 5.724 5.660 5.666 lab7 no results submitted lab8 6.173 6.191 6.18 6.170 lab9 no results submitted lab10 6.395 6.388 6.357 6.319 lab11 5.798 5.844 5.829 5.812 lab12 6.223 6.263 6.165 6.163 lab13 5.640 5.657 5.600 5.729 lab14 6.256 6.065 6.478 6.452 lab15 21.156 21.137 21.107 21.194 lab16 9.393 9.423 lab17 5.673 5.612 5.712 5.945 lab18 no results submitted lab19 6.170 6.173 6.193 6.090 lab20 6.179 6.182 6.139 6.089 lab21 non reliable2 lab22 6.426 6.544 6.471 6.372 lab23 6.238 6.178 6.1835 6.053 lab24 no results submitted lab25 6.375 6.578 6.510 6.600
Shown are laboratory averages and standard deviations of all laboratories.
Normal probability plot: only accepted sets of results are shown
1) Changed eluent concentration to 1 % ethyl acetate, which resulted in complete separation of a coeluting peak
2) mixture of co-eluting markers
3) coelution with other compound,
4) result in-house method: 5.800 mg/L
Batch 9 (410 nm)
5
5.5
6
6.5
7
7.5
8
8.5
9
conc
. [m
g/L]
Normal probability plot Batch 9 (410 nm)
-2
-1.5
-1
-0.5
0
0.5
1
1.5
2
5 5.5 6 6.5 7
average
z-va
lue
Batch 9 (450 nm)
55.2
5.45.6
5.8
6
6.2
6.4
6.6
6.8
7
conc
. [m
g/L]
Normal probability plot Batch 9 (450 nm)
-2
-1.5
-1
-0.5
0
0.5
1
1.5
2
5.5 5.7 5.9 6.1 6.3 6.5 6.7
average
z-va
lue
Annex A: Individual results page 10 of 12
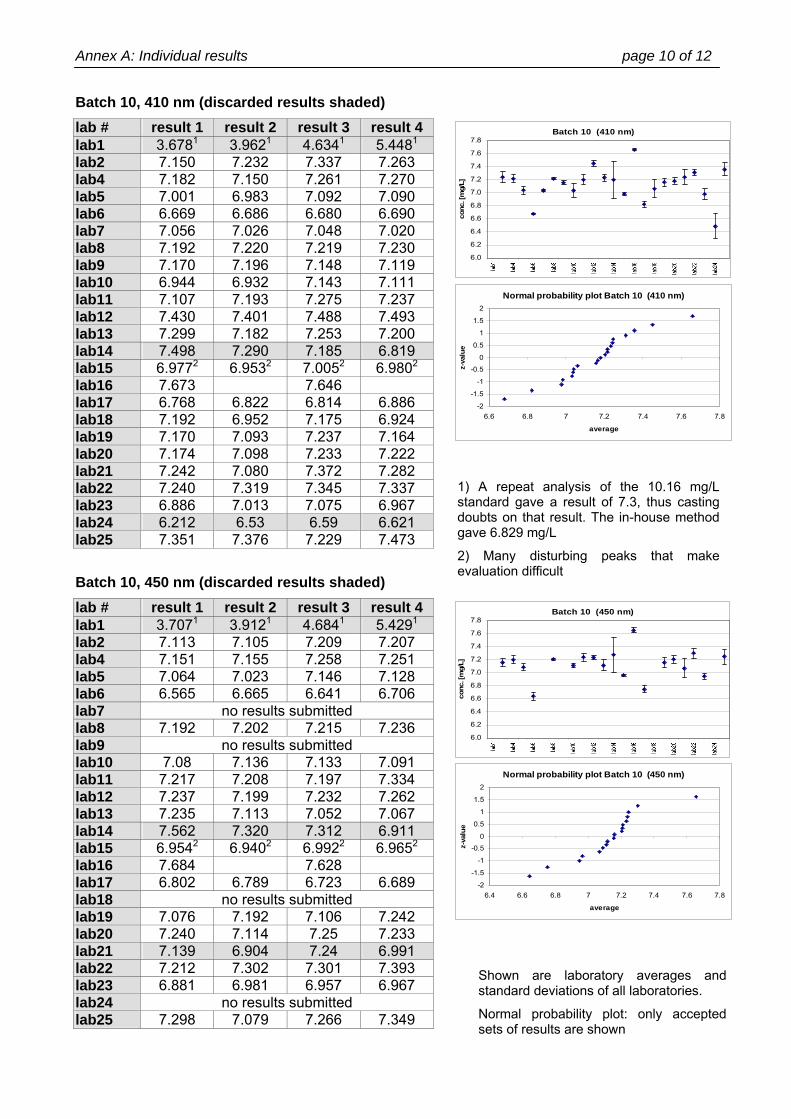
Batch 10, 410 nm (discarded results shaded) lab # result 1 result 2 result 3 result 4 lab1 3.6781 3.9621 4.6341 5.4481 lab2 7.150 7.232 7.337 7.263 lab4 7.182 7.150 7.261 7.270 lab5 7.001 6.983 7.092 7.090 lab6 6.669 6.686 6.680 6.690 lab7 7.056 7.026 7.048 7.020 lab8 7.192 7.220 7.219 7.230 lab9 7.170 7.196 7.148 7.119 lab10 6.944 6.932 7.143 7.111 lab11 7.107 7.193 7.275 7.237 lab12 7.430 7.401 7.488 7.493 lab13 7.299 7.182 7.253 7.200 lab14 7.498 7.290 7.185 6.819 lab15 6.9772 6.9532 7.0052 6.9802 lab16 7.673 7.646 lab17 6.768 6.822 6.814 6.886 lab18 7.192 6.952 7.175 6.924 lab19 7.170 7.093 7.237 7.164 lab20 7.174 7.098 7.233 7.222 lab21 7.242 7.080 7.372 7.282 lab22 7.240 7.319 7.345 7.337 lab23 6.886 7.013 7.075 6.967 lab24 6.212 6.53 6.59 6.621 lab25 7.351 7.376 7.229 7.473
Batch 10, 450 nm (discarded results shaded) lab # result 1 result 2 result 3 result 4 lab1 3.7071 3.9121 4.6841 5.4291 lab2 7.113 7.105 7.209 7.207 lab4 7.151 7.155 7.258 7.251 lab5 7.064 7.023 7.146 7.128 lab6 6.565 6.665 6.641 6.706 lab7 no results submitted lab8 7.192 7.202 7.215 7.236 lab9 no results submitted lab10 7.08 7.136 7.133 7.091 lab11 7.217 7.208 7.197 7.334 lab12 7.237 7.199 7.232 7.262 lab13 7.235 7.113 7.052 7.067 lab14 7.562 7.320 7.312 6.911 lab15 6.9542 6.9402 6.9922 6.9652 lab16 7.684 7.628 lab17 6.802 6.789 6.723 6.689 lab18 no results submitted lab19 7.076 7.192 7.106 7.242 lab20 7.240 7.114 7.25 7.233 lab21 7.139 6.904 7.24 6.991 lab22 7.212 7.302 7.301 7.393 lab23 6.881 6.981 6.957 6.967 lab24 no results submitted lab25 7.298 7.079 7.266 7.349
Shown are laboratory averages and standard deviations of all laboratories.
Normal probability plot: only accepted sets of results are shown
1) A repeat analysis of the 10.16 mg/L standard gave a result of 7.3, thus casting doubts on that result. The in-house method gave 6.829 mg/L
2) Many disturbing peaks that make evaluation difficult
Batch 10 (410 nm)
6.0
6.2
6.4
6.6
6.8
7.0
7.2
7.4
7.6
7.8
conc
. [m
g/L]
Normal probability plot Batch 10 (410 nm)
-2
-1.5
-1
-0.5
0
0.5
1
1.5
2
6.6 6.8 7 7.2 7.4 7.6 7.8
average
z-va
lue
Batch 10 (450 nm)
6.0
6.2
6.4
6.6
6.8
7.0
7.2
7.4
7.6
7.8
conc
. [m
g/L]
Normal probability plot Batch 10 (450 nm)
-2
-1.5
-1
-0.5
0
0.5
1
1.5
2
6.4 6.6 6.8 7 7.2 7.4 7.6 7.8
average
z-va
lue
Annex A: Individual results page 11 of 12
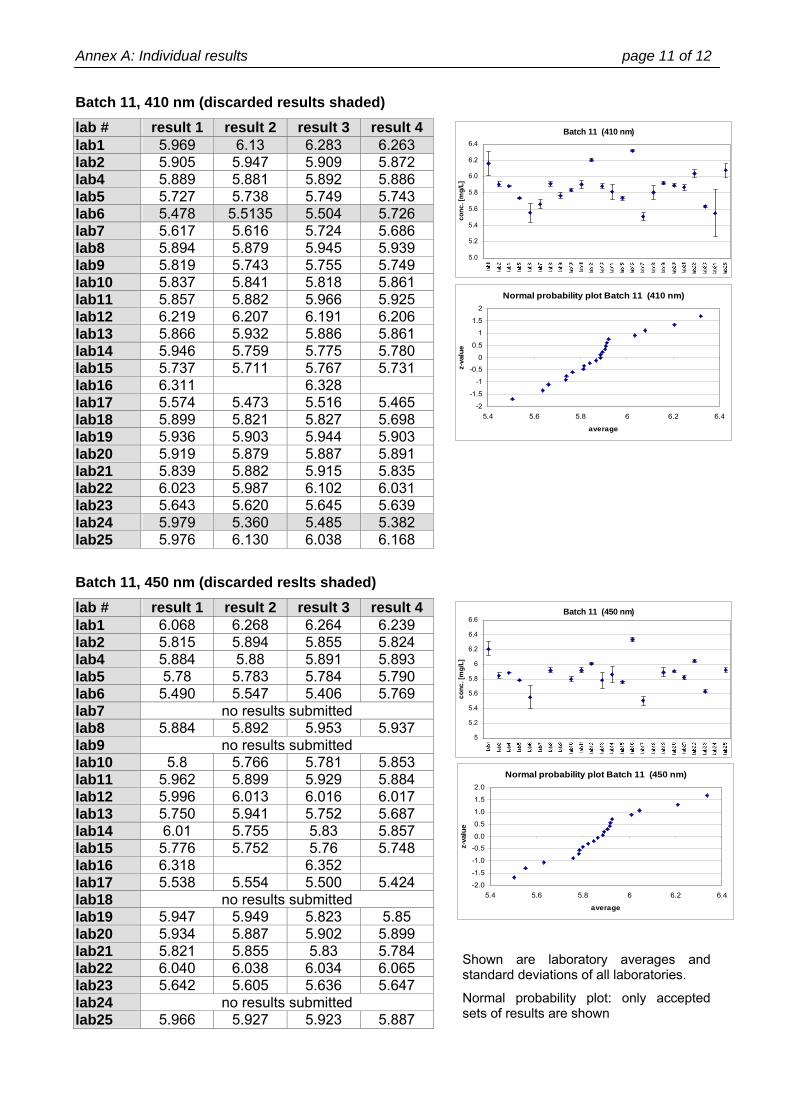
Batch 11, 410 nm (discarded results shaded) lab # result 1 result 2 result 3 result 4 lab1 5.969 6.13 6.283 6.263 lab2 5.905 5.947 5.909 5.872 lab4 5.889 5.881 5.892 5.886 lab5 5.727 5.738 5.749 5.743 lab6 5.478 5.5135 5.504 5.726 lab7 5.617 5.616 5.724 5.686 lab8 5.894 5.879 5.945 5.939 lab9 5.819 5.743 5.755 5.749 lab10 5.837 5.841 5.818 5.861 lab11 5.857 5.882 5.966 5.925 lab12 6.219 6.207 6.191 6.206 lab13 5.866 5.932 5.886 5.861 lab14 5.946 5.759 5.775 5.780 lab15 5.737 5.711 5.767 5.731 lab16 6.311 6.328 lab17 5.574 5.473 5.516 5.465 lab18 5.899 5.821 5.827 5.698 lab19 5.936 5.903 5.944 5.903 lab20 5.919 5.879 5.887 5.891 lab21 5.839 5.882 5.915 5.835 lab22 6.023 5.987 6.102 6.031 lab23 5.643 5.620 5.645 5.639 lab24 5.979 5.360 5.485 5.382 lab25 5.976 6.130 6.038 6.168
Batch 11, 450 nm (discarded reslts shaded) lab # result 1 result 2 result 3 result 4 lab1 6.068 6.268 6.264 6.239 lab2 5.815 5.894 5.855 5.824 lab4 5.884 5.88 5.891 5.893 lab5 5.78 5.783 5.784 5.790 lab6 5.490 5.547 5.406 5.769 lab7 no results submitted lab8 5.884 5.892 5.953 5.937 lab9 no results submitted lab10 5.8 5.766 5.781 5.853 lab11 5.962 5.899 5.929 5.884 lab12 5.996 6.013 6.016 6.017 lab13 5.750 5.941 5.752 5.687 lab14 6.01 5.755 5.83 5.857 lab15 5.776 5.752 5.76 5.748 lab16 6.318 6.352 lab17 5.538 5.554 5.500 5.424 lab18 no results submitted lab19 5.947 5.949 5.823 5.85 lab20 5.934 5.887 5.902 5.899 lab21 5.821 5.855 5.83 5.784 lab22 6.040 6.038 6.034 6.065 lab23 5.642 5.605 5.636 5.647 lab24 no results submitted lab25 5.966 5.927 5.923 5.887
Shown are laboratory averages and standard deviations of all laboratories.
Normal probability plot: only accepted sets of results are shown
Batch 11 (410 nm)
5.0
5.2
5.4
5.6
5.8
6.0
6.2
6.4
conc
. [m
g/L]
Normal probability plot Batch 11 (410 nm)
-2
-1.5
-1
-0.5
0
0.5
1
1.5
2
5.4 5.6 5.8 6 6.2 6.4
average
z-va
lue
Batch 11 (450 nm)
5
5.2
5.4
5.6
5.8
6
6.2
6.4
6.6
conc
. [m
g/L]
Normal probability plot Batch 11 (450 nm)
-2.0
-1.5
-1.0
-0.5
0.0
0.5
1.0
1.5
2.0
5.4 5.6 5.8 6 6.2 6.4
average
z-va
lue
Annex A: Individual results page 12 of 12
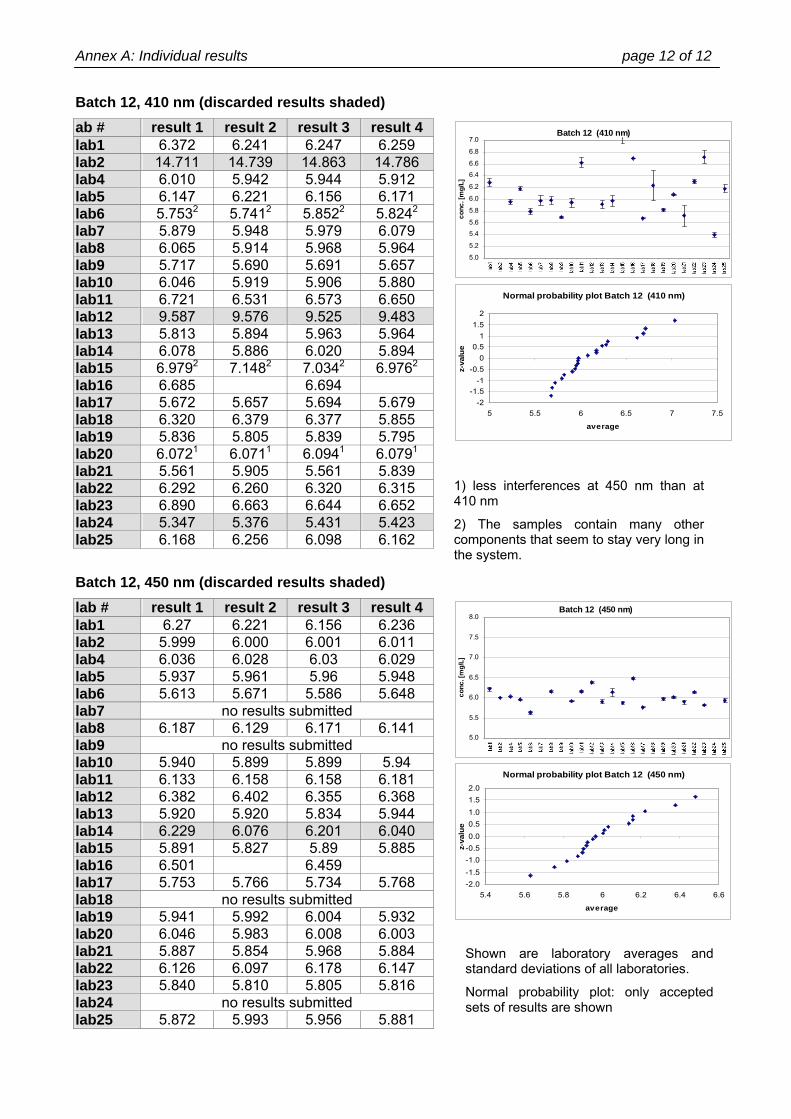
Batch 12, 410 nm (discarded results shaded) ab # result 1 result 2 result 3 result 4 lab1 6.372 6.241 6.247 6.259 lab2 14.711 14.739 14.863 14.786 lab4 6.010 5.942 5.944 5.912 lab5 6.147 6.221 6.156 6.171 lab6 5.7532 5.7412 5.8522 5.8242 lab7 5.879 5.948 5.979 6.079 lab8 6.065 5.914 5.968 5.964 lab9 5.717 5.690 5.691 5.657 lab10 6.046 5.919 5.906 5.880 lab11 6.721 6.531 6.573 6.650 lab12 9.587 9.576 9.525 9.483 lab13 5.813 5.894 5.963 5.964 lab14 6.078 5.886 6.020 5.894 lab15 6.9792 7.1482 7.0342 6.9762 lab16 6.685 6.694 lab17 5.672 5.657 5.694 5.679 lab18 6.320 6.379 6.377 5.855 lab19 5.836 5.805 5.839 5.795 lab20 6.0721 6.0711 6.0941 6.0791 lab21 5.561 5.905 5.561 5.839 lab22 6.292 6.260 6.320 6.315 lab23 6.890 6.663 6.644 6.652 lab24 5.347 5.376 5.431 5.423 lab25 6.168 6.256 6.098 6.162
Batch 12, 450 nm (discarded results shaded) lab # result 1 result 2 result 3 result 4 lab1 6.27 6.221 6.156 6.236 lab2 5.999 6.000 6.001 6.011 lab4 6.036 6.028 6.03 6.029 lab5 5.937 5.961 5.96 5.948 lab6 5.613 5.671 5.586 5.648 lab7 no results submitted lab8 6.187 6.129 6.171 6.141 lab9 no results submitted lab10 5.940 5.899 5.899 5.94 lab11 6.133 6.158 6.158 6.181 lab12 6.382 6.402 6.355 6.368 lab13 5.920 5.920 5.834 5.944 lab14 6.229 6.076 6.201 6.040 lab15 5.891 5.827 5.89 5.885 lab16 6.501 6.459 lab17 5.753 5.766 5.734 5.768 lab18 no results submitted lab19 5.941 5.992 6.004 5.932 lab20 6.046 5.983 6.008 6.003 lab21 5.887 5.854 5.968 5.884 lab22 6.126 6.097 6.178 6.147 lab23 5.840 5.810 5.805 5.816 lab24 no results submitted lab25 5.872 5.993 5.956 5.881
Shown are laboratory averages and standard deviations of all laboratories.
Normal probability plot: only accepted sets of results are shown
1) less interferences at 450 nm than at 410 nm
2) The samples contain many other components that seem to stay very long in the system.
Batch 12 (410 nm)
5.0
5.2
5.4
5.6
5.8
6.0
6.2
6.4
6.6
6.8
7.0
conc
. [m
g/L]
Normal probability plot Batch 12 (410 nm)
-2-1.5
-1-0.5
00.5
11.5
2
5 5.5 6 6.5 7 7.5
average
z-va
lue
Batch 12 (450 nm)
5.0
5.5
6.0
6.5
7.0
7.5
8.0
conc
. [m
g/L]
Normal probability plot Batch 12 (450 nm)
-2.0-1.5-1.0-0.50.00.51.01.52.0
5.4 5.6 5.8 6 6.2 6.4 6.6
average
z-va
lue
Annex B: Outliers page 1 of 3
Sequence of outlier elimination Outliers at 410 nm Batch 2 • Lab 24, Cochran outlier • Lab 21, Cochran outlier • Lab 25, Cochran outlier
Batch 3 • Lab 24, Cochran and Hawkins outlier • Lab 21, Hawkins outlier • Lab 11, 18, 9: Cochran outliers (kept)
Batch 4 • Lab 24, Cochran and Hawkins outlier • Lab 15, 13, 18, 9: Cochran outliers (kept)
Batch 5 • Lab 5, Cochran outlier • Lab 24, Cochran outlier • Lab 18, Cochran outlier
Batch 6 • Lab 4, Cochran outlier • Lab 25, 14, 21, 18 Cochran outliers (kept)
Batch 7 • Lab 1, Cochran and Hawkins outlier • Lab 17, Cochran outlier
Batch 9 • Lab 24, Cochran outlier • Lab 1, Cochran and Hawkins outlier • Lab 9 and 15 eliminated due to normality
plot
Batch 10 • Lab 1, Cochran and Hawkins outlier • Lab 14, Cochran outlier • Lab 24, Cochran outlier
Batch 11 • Lab 24, Cochran outlier • Lab 1, Cochran outlier • Lab 6, Cochran outlier
Batch 12 • Lab 2, Hawkins outlier • Lab 12, Hawkins outlier • Lab 18, 21, Cochran outliers (kept)
Outliers at 450 nm Batch 2 • Lab 25, Cochran outlier Batch 3 • Lab 11, Cochran outlier • Lab 21, Hawkins outlier • Lab 17, Cochran outlier No more outliers, but not normal distributed. Batch 4 • Lab 15, Cochran outlier • Lab 13, Cochran outlier • Lab 21, Hawkins outlier • Lab 11, 1, 8, 5 , Cochran outlier (kept) Batch 5 • Lab 13, Cochran outlier • Lab 11, Cochran outlier Batch 6 • Lab 21, Cochran outlier • Lab 17, Cochran outlier Batch 7 • Lab 1, Cochran and Hawkins outlier • Lab 21, 14, 14, Cochran outliers (kept) Batch 9 • Lab 15, Hawkins outlier • Lab 1, Cochran and Hawkins outlier • Lab 14, 17, 25, 23, 22, Cochran outliers
(kept) • Lab 2 eliminated due to normality plot Batch 10 • Lab 1, Cochran and Hawkins outlier • Lab 14, Cochran outlier • Lab 21, 25, Cochran outlier (kept) Batch 11 • Lab 6, 13, 14, 1, 19, 17 , Cochran outliers
(kept) Batch 12 • Lab 14, Cochran outlier
Annex B: Outliers page 2 of 3
Mandel's k-statistics (within laboratory) (410 nm)
0.0
0.5
1.01.5
2.0
2.5
3.03.5
4.0
4.5
5.0
5.5la
b1
lab2
lab4
lab5
lab6
lab7
lab8
lab9
lab1
0
lab1
1
lab1
2
lab1
3
lab1
4
lab1
5
lab1
6
lab1
7
lab1
8
lab1
9
lab2
0
lab2
1
lab2
2
lab2
3
lab2
4
lab2
5
batch1
batch2
batch3
batch4
batch5
batch6
batch7
batch8
batch9
batch10
batch11
batch 12
Mandel's h-statistic (between laboratory) (410 nm)
-5.0
-4.5
-4.0
-3.5
-3.0
-2.5
-2.0
-1.5
-1.0
-0.5
0.0
0.5
1.0
1.5
2.0
2.5
3.0
3.5
4.0
4.5
5.0
lab1
lab2
lab4
lab5
lab6
lab7
lab8
lab9
lab1
0
lab1
1
lab1
2
lab1
3
lab1
4
lab1
5
lab1
6
lab1
7
lab1
8
lab1
9
lab2
0
lab2
1
lab2
2
lab2
3
lab2
4
lab2
5
batch1
batch2
batch3
batch4
batch5
batch6
batch7
batch8
batch9
batch10
batch11
batch 12
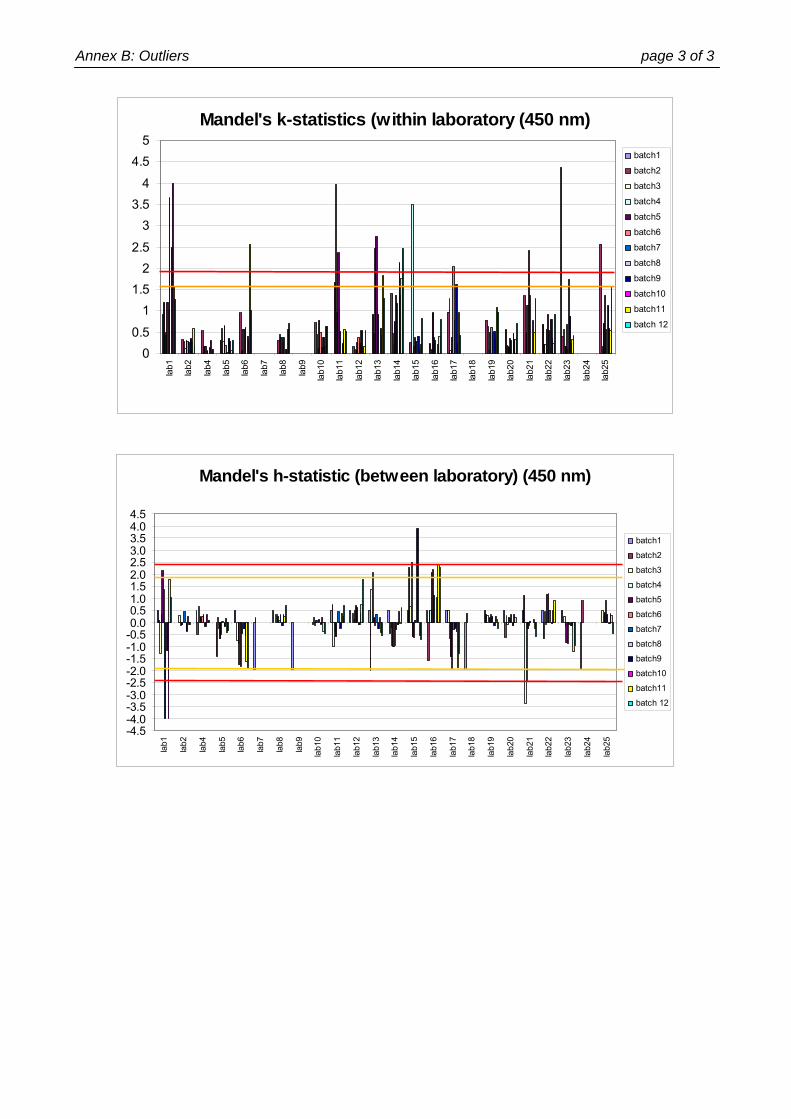
Annex B: Outliers page 3 of 3
Mandel's k-statistics (within laboratory (450 nm)
00.5
11.5
22.5
33.5
4
4.55
lab1
lab2
lab4
lab5
lab6
lab7
lab8
lab9
lab1
0
lab1
1
lab1
2
lab1
3
lab1
4
lab1
5
lab1
6
lab1
7
lab1
8
lab1
9
lab2
0
lab2
1
lab2
2
lab2
3
lab2
4
lab2
5
batch1
batch2
batch3
batch4
batch5
batch6
batch7
batch8
batch9
batch10
batch11
batch 12
Mandel's h-statistic (between laboratory) (450 nm)
-4.5-4.0-3.5-3.0-2.5-2.0-1.5-1.0-0.50.00.51.01.52.02.53.03.54.04.5
lab1
lab2
lab4
lab5
lab6
lab7
lab8
lab9
lab1
0
lab1
1
lab1
2
lab1
3
lab1
4
lab1
5
lab1
6
lab1
7
lab1
8
lab1
9
lab2
0
lab2
1
lab2
2
lab2
3
lab2
4
lab2
5
batch1
batch2
batch3
batch4
batch5
batch6
batch7
batch8
batch9
batch10
batch11
batch 12
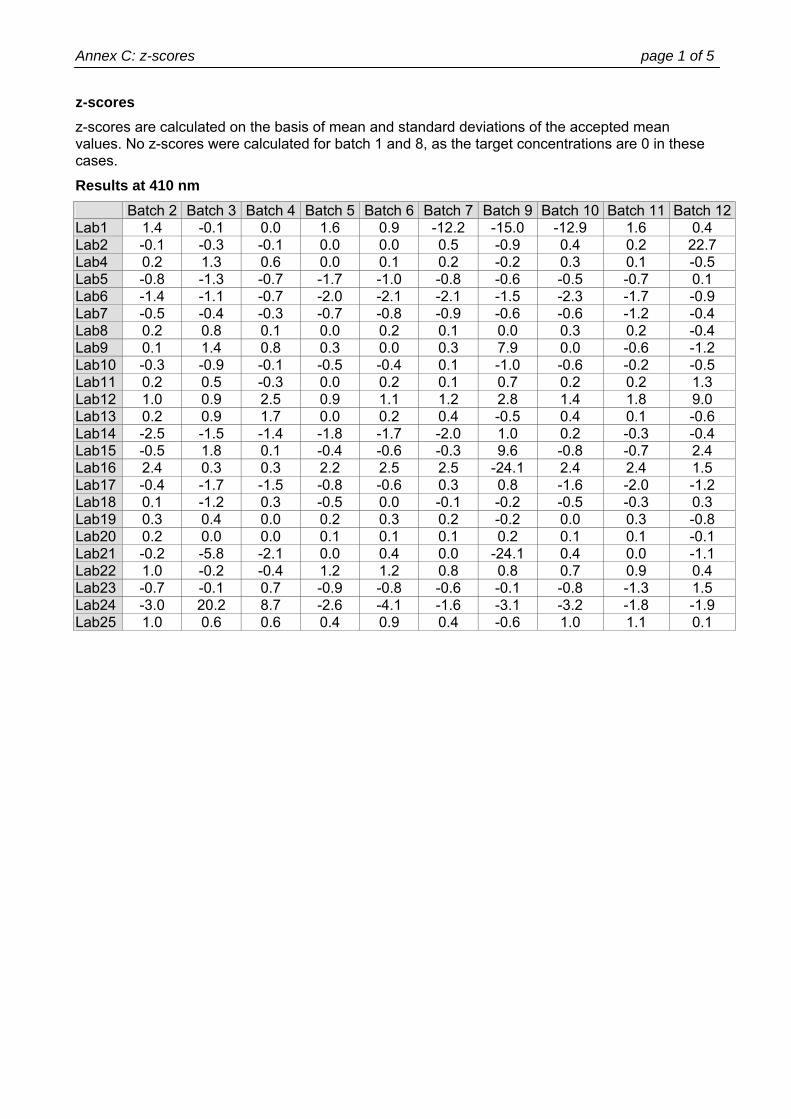
Annex C: z-scores page 1 of 5
z-scores z-scores are calculated on the basis of mean and standard deviations of the accepted mean values. No z-scores were calculated for batch 1 and 8, as the target concentrations are 0 in these cases.
Results at 410 nm Batch 2 Batch 3 Batch 4 Batch 5 Batch 6 Batch 7 Batch 9 Batch 10 Batch 11 Batch 12Lab1 1.4 -0.1 0.0 1.6 0.9 -12.2 -15.0 -12.9 1.6 0.4 Lab2 -0.1 -0.3 -0.1 0.0 0.0 0.5 -0.9 0.4 0.2 22.7 Lab4 0.2 1.3 0.6 0.0 0.1 0.2 -0.2 0.3 0.1 -0.5 Lab5 -0.8 -1.3 -0.7 -1.7 -1.0 -0.8 -0.6 -0.5 -0.7 0.1 Lab6 -1.4 -1.1 -0.7 -2.0 -2.1 -2.1 -1.5 -2.3 -1.7 -0.9 Lab7 -0.5 -0.4 -0.3 -0.7 -0.8 -0.9 -0.6 -0.6 -1.2 -0.4 Lab8 0.2 0.8 0.1 0.0 0.2 0.1 0.0 0.3 0.2 -0.4 Lab9 0.1 1.4 0.8 0.3 0.0 0.3 7.9 0.0 -0.6 -1.2 Lab10 -0.3 -0.9 -0.1 -0.5 -0.4 0.1 -1.0 -0.6 -0.2 -0.5 Lab11 0.2 0.5 -0.3 0.0 0.2 0.1 0.7 0.2 0.2 1.3 Lab12 1.0 0.9 2.5 0.9 1.1 1.2 2.8 1.4 1.8 9.0 Lab13 0.2 0.9 1.7 0.0 0.2 0.4 -0.5 0.4 0.1 -0.6 Lab14 -2.5 -1.5 -1.4 -1.8 -1.7 -2.0 1.0 0.2 -0.3 -0.4 Lab15 -0.5 1.8 0.1 -0.4 -0.6 -0.3 9.6 -0.8 -0.7 2.4 Lab16 2.4 0.3 0.3 2.2 2.5 2.5 -24.1 2.4 2.4 1.5 Lab17 -0.4 -1.7 -1.5 -0.8 -0.6 0.3 0.8 -1.6 -2.0 -1.2 Lab18 0.1 -1.2 0.3 -0.5 0.0 -0.1 -0.2 -0.5 -0.3 0.3 Lab19 0.3 0.4 0.0 0.2 0.3 0.2 -0.2 0.0 0.3 -0.8 Lab20 0.2 0.0 0.0 0.1 0.1 0.1 0.2 0.1 0.1 -0.1 Lab21 -0.2 -5.8 -2.1 0.0 0.4 0.0 -24.1 0.4 0.0 -1.1 Lab22 1.0 -0.2 -0.4 1.2 1.2 0.8 0.8 0.7 0.9 0.4 Lab23 -0.7 -0.1 0.7 -0.9 -0.8 -0.6 -0.1 -0.8 -1.3 1.5 Lab24 -3.0 20.2 8.7 -2.6 -4.1 -1.6 -3.1 -3.2 -1.8 -1.9 Lab25 1.0 0.6 0.6 0.4 0.9 0.4 -0.6 1.0 1.1 0.1
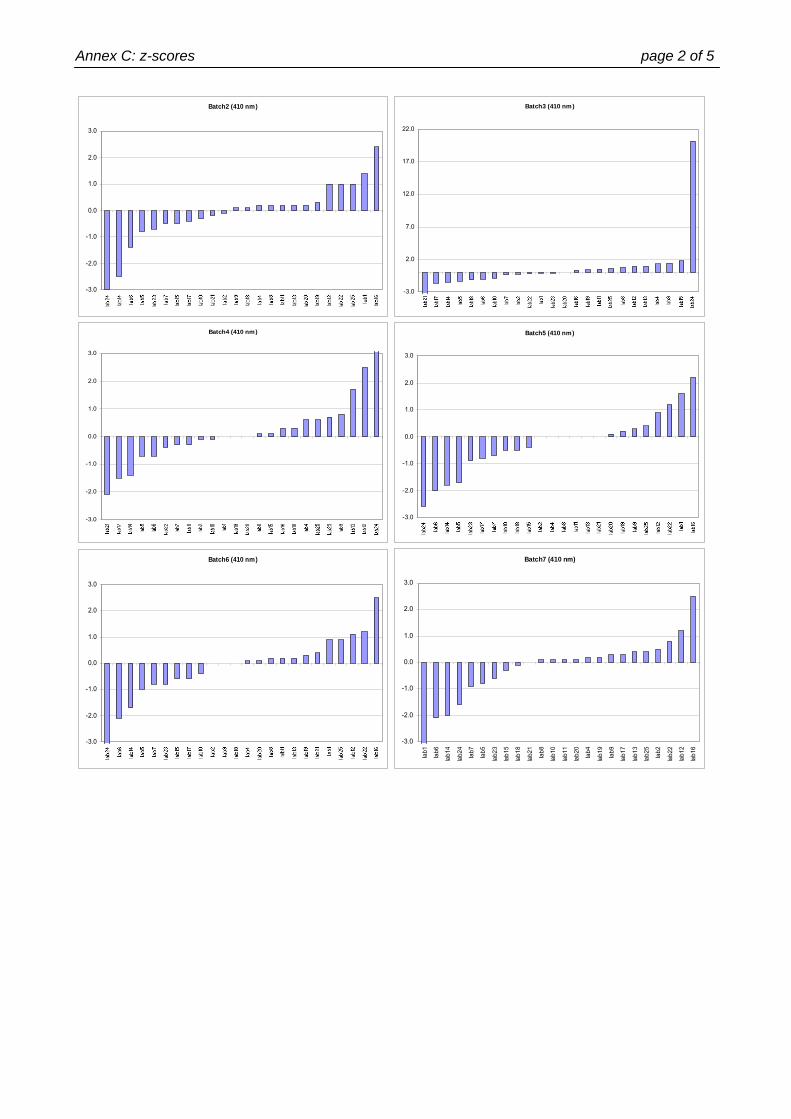
Annex C: z-scores page 2 of 5
Batch2 (410 nm)
-3.0
-2.0
-1.0
0.0
1.0
2.0
3.0
Batch3 (410 nm)
-3.0
2.0
7.0
12.0
17.0
22.0
Batch4 (410 nm)
-3.0
-2.0
-1.0
0.0
1.0
2.0
3.0
Batch5 (410 nm)
-3.0
-2.0
-1.0
0.0
1.0
2.0
3.0
Batch6 (410 nm)
-3.0
-2.0
-1.0
0.0
1.0
2.0
3.0
Batch7 (410 nm)
-3.0
-2.0
-1.0
0.0
1.0
2.0
3.0
lab1
lab6
lab1
4
lab2
4
lab7
lab5
lab2
3
lab1
5
lab1
8
lab2
1
lab8
lab1
0
lab1
1
lab2
0
lab4
lab1
9
lab9
lab1
7
lab1
3
lab2
5
lab2
lab2
2
lab1
2
lab1
6
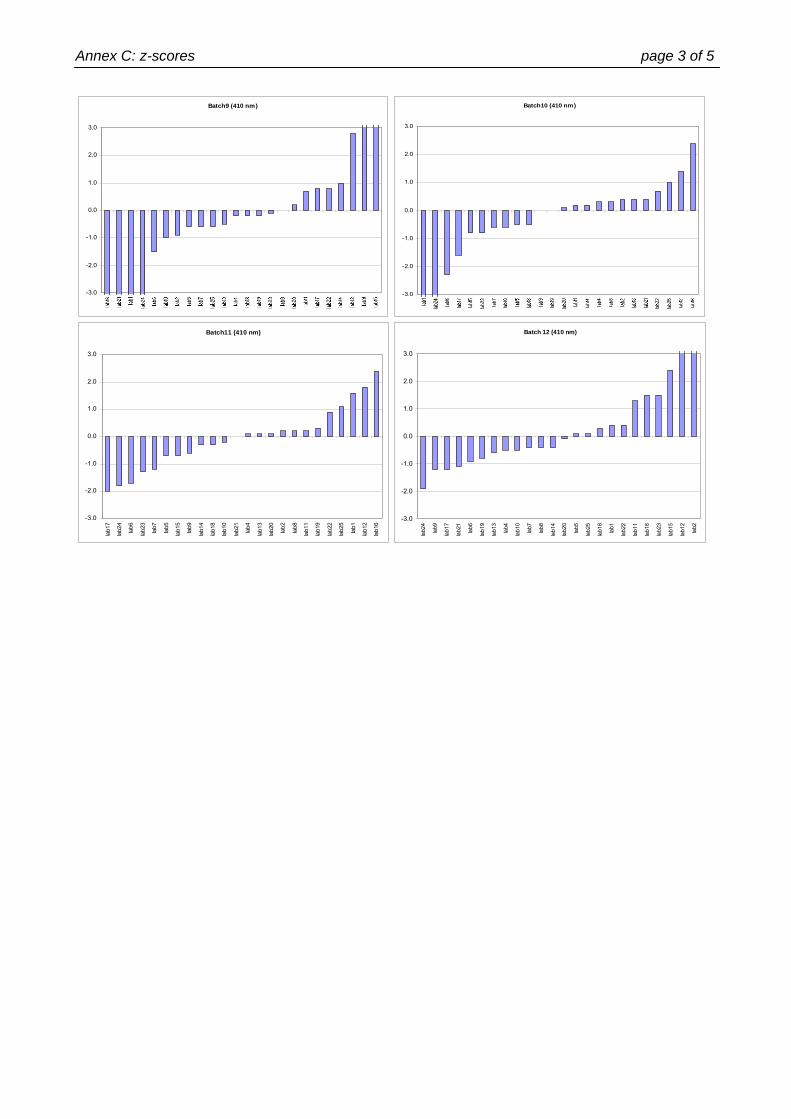
Annex C: z-scores page 3 of 5
Batch9 (410 nm)
-3.0
-2.0
-1.0
0.0
1.0
2.0
3.0
Batch10 (410 nm)
-3.0
-2.0
-1.0
0.0
1.0
2.0
3.0
Batch11 (410 nm)
-3.0
-2.0
-1.0
0.0
1.0
2.0
3.0
lab1
7
lab2
4
lab6
lab2
3
lab7
lab5
lab1
5
lab9
lab1
4
lab1
8
lab1
0
lab2
1
lab4
lab1
3
lab2
0
lab2
lab8
lab1
1
lab1
9
lab2
2
lab2
5
lab1
lab1
2
lab1
6
Batch 12 (410 nm)
-3.0
-2.0
-1.0
0.0
1.0
2.0
3.0
lab2
4
lab9
lab1
7
lab2
1
lab6
lab1
9
lab1
3
lab4
lab1
0
lab7
lab8
lab1
4
lab2
0
lab5
lab2
5
lab1
8
lab1
lab2
2
lab1
1
lab1
6
lab2
3
lab1
5
lab1
2
lab2
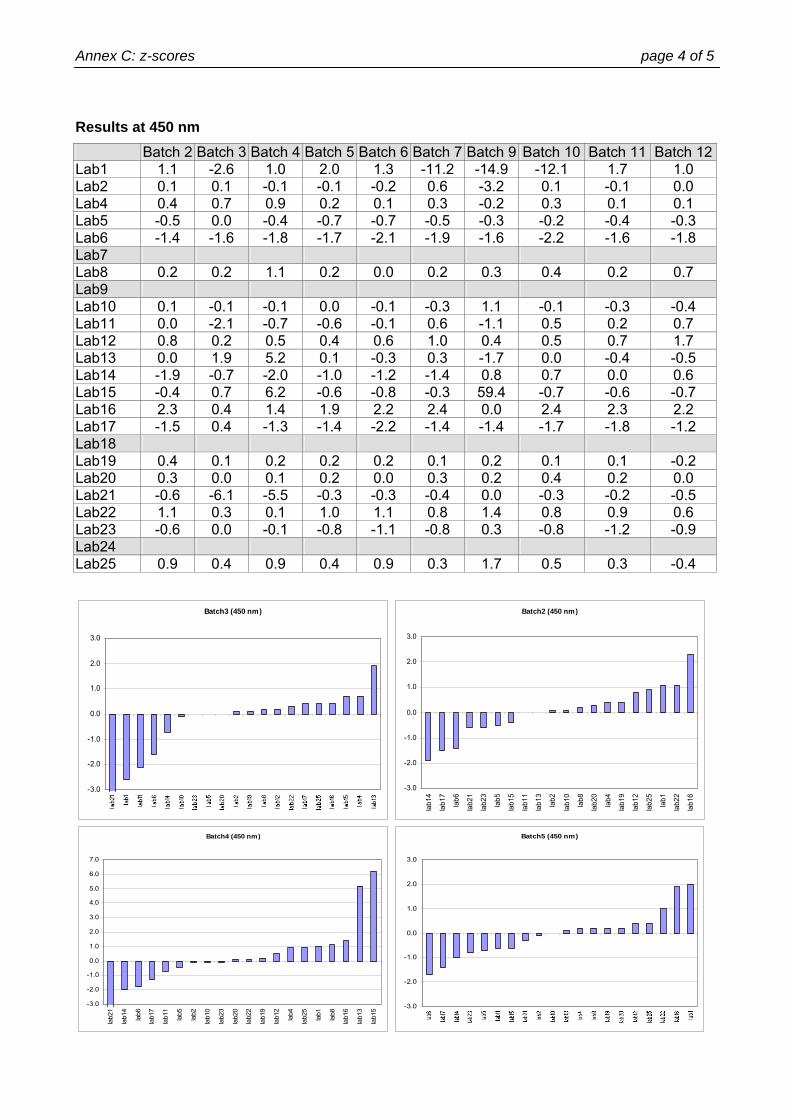
Annex C: z-scores page 4 of 5
Results at 450 nm
Batch 2 Batch 3 Batch 4 Batch 5 Batch 6 Batch 7 Batch 9 Batch 10 Batch 11 Batch 12Lab1 1.1 -2.6 1.0 2.0 1.3 -11.2 -14.9 -12.1 1.7 1.0 Lab2 0.1 0.1 -0.1 -0.1 -0.2 0.6 -3.2 0.1 -0.1 0.0 Lab4 0.4 0.7 0.9 0.2 0.1 0.3 -0.2 0.3 0.1 0.1 Lab5 -0.5 0.0 -0.4 -0.7 -0.7 -0.5 -0.3 -0.2 -0.4 -0.3 Lab6 -1.4 -1.6 -1.8 -1.7 -2.1 -1.9 -1.6 -2.2 -1.6 -1.8 Lab7 Lab8 0.2 0.2 1.1 0.2 0.0 0.2 0.3 0.4 0.2 0.7 Lab9 Lab10 0.1 -0.1 -0.1 0.0 -0.1 -0.3 1.1 -0.1 -0.3 -0.4 Lab11 0.0 -2.1 -0.7 -0.6 -0.1 0.6 -1.1 0.5 0.2 0.7 Lab12 0.8 0.2 0.5 0.4 0.6 1.0 0.4 0.5 0.7 1.7 Lab13 0.0 1.9 5.2 0.1 -0.3 0.3 -1.7 0.0 -0.4 -0.5 Lab14 -1.9 -0.7 -2.0 -1.0 -1.2 -1.4 0.8 0.7 0.0 0.6 Lab15 -0.4 0.7 6.2 -0.6 -0.8 -0.3 59.4 -0.7 -0.6 -0.7 Lab16 2.3 0.4 1.4 1.9 2.2 2.4 0.0 2.4 2.3 2.2 Lab17 -1.5 0.4 -1.3 -1.4 -2.2 -1.4 -1.4 -1.7 -1.8 -1.2 Lab18 Lab19 0.4 0.1 0.2 0.2 0.2 0.1 0.2 0.1 0.1 -0.2 Lab20 0.3 0.0 0.1 0.2 0.0 0.3 0.2 0.4 0.2 0.0 Lab21 -0.6 -6.1 -5.5 -0.3 -0.3 -0.4 0.0 -0.3 -0.2 -0.5 Lab22 1.1 0.3 0.1 1.0 1.1 0.8 1.4 0.8 0.9 0.6 Lab23 -0.6 0.0 -0.1 -0.8 -1.1 -0.8 0.3 -0.8 -1.2 -0.9 Lab24 Lab25 0.9 0.4 0.9 0.4 0.9 0.3 1.7 0.5 0.3 -0.4
Batch3 (450 nm)
-3.0
-2.0
-1.0
0.0
1.0
2.0
3.0
Batch2 (450 nm)
-3.0
-2.0
-1.0
0.0
1.0
2.0
3.0
lab1
4
lab1
7
lab6
lab2
1
lab2
3
lab5
lab1
5
lab1
1
lab1
3
lab2
lab1
0
lab8
lab2
0
lab4
lab1
9
lab1
2
lab2
5
lab1
lab2
2
lab1
6
Batch4 (450 nm)
-3.0
-2.0
-1.0
0.0
1.0
2.0
3.0
4.0
5.0
6.0
7.0
lab2
1
lab1
4
lab6
lab1
7
lab1
1
lab5
lab2
lab1
0
lab2
3
lab2
0
lab2
2
lab1
9
lab1
2
lab4
lab2
5
lab1
lab8
lab1
6
lab1
3
lab1
5
Batch5 (450 nm)
-3.0
-2.0
-1.0
0.0
1.0
2.0
3.0
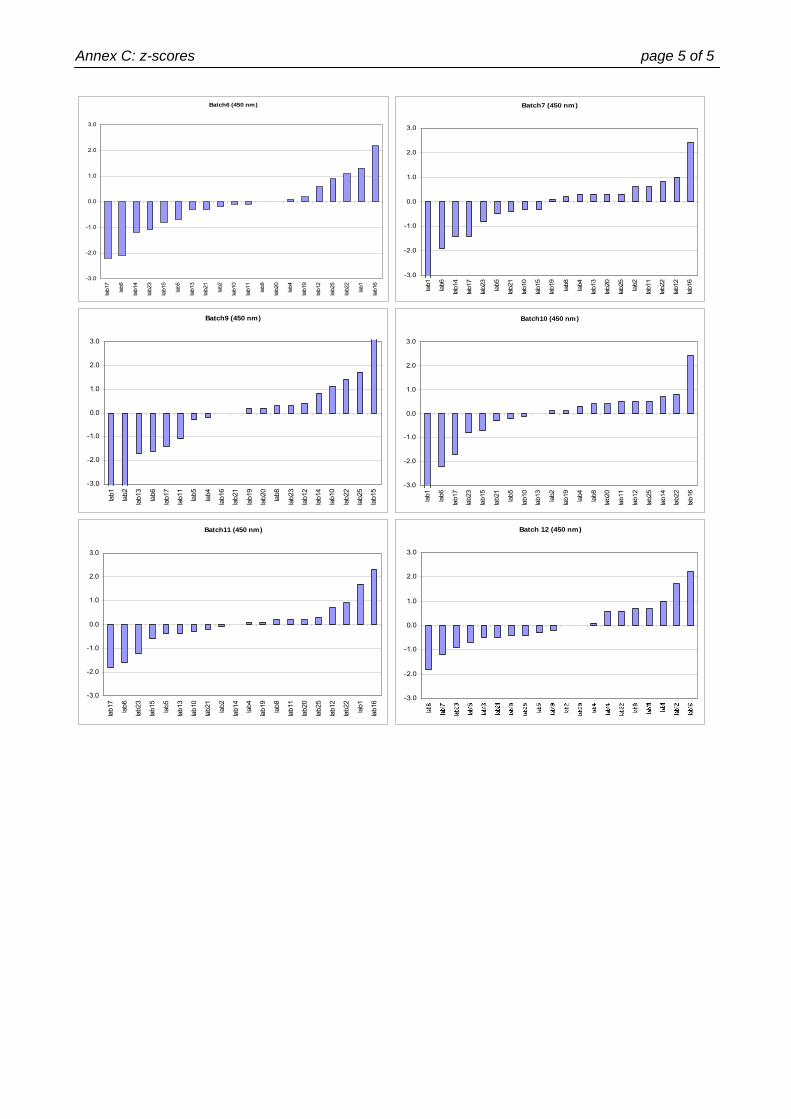
Annex C: z-scores page 5 of 5
Batch6 (450 nm)
-3.0
-2.0
-1.0
0.0
1.0
2.0
3.0
lab1
7
lab6
lab1
4
lab2
3
lab1
5
lab5
lab1
3
lab2
1
lab2
lab1
0
lab1
1
lab8
lab2
0
lab4
lab1
9
lab1
2
lab2
5
lab2
2
lab1
lab1
6
Batch7 (450 nm)
-3.0
-2.0
-1.0
0.0
1.0
2.0
3.0
lab1
lab6
lab1
4
lab1
7
lab2
3
lab5
lab2
1
lab1
0
lab1
5
lab1
9
lab8
lab4
lab1
3
lab2
0
lab2
5
lab2
lab1
1
lab2
2
lab1
2
lab1
6
Batch9 (450 nm)
-3.0
-2.0
-1.0
0.0
1.0
2.0
3.0
lab1
lab2
lab1
3
lab6
lab1
7
lab1
1
lab5
lab4
lab1
6
lab2
1
lab1
9
lab2
0
lab8
lab2
3
lab1
2
lab1
4
lab1
0
lab2
2
lab2
5
lab1
5
Batch10 (450 nm)
-3.0
-2.0
-1.0
0.0
1.0
2.0
3.0
lab1
lab6
lab1
7
lab2
3
lab1
5
lab2
1
lab5
lab1
0
lab1
3
lab2
lab1
9
lab4
lab8
lab2
0
lab1
1
lab1
2
lab2
5
lab1
4
lab2
2
lab1
6
Batch11 (450 nm)
-3.0
-2.0
-1.0
0.0
1.0
2.0
3.0
lab1
7
lab6
lab2
3
lab1
5
lab5
lab1
3
lab1
0
lab2
1
lab2
lab1
4
lab4
lab1
9
lab8
lab1
1
lab2
0
lab2
5
lab1
2
lab2
2
lab1
lab1
6
Batch 12 (450 nm)
-3.0
-2.0
-1.0
0.0
1.0
2.0
3.0
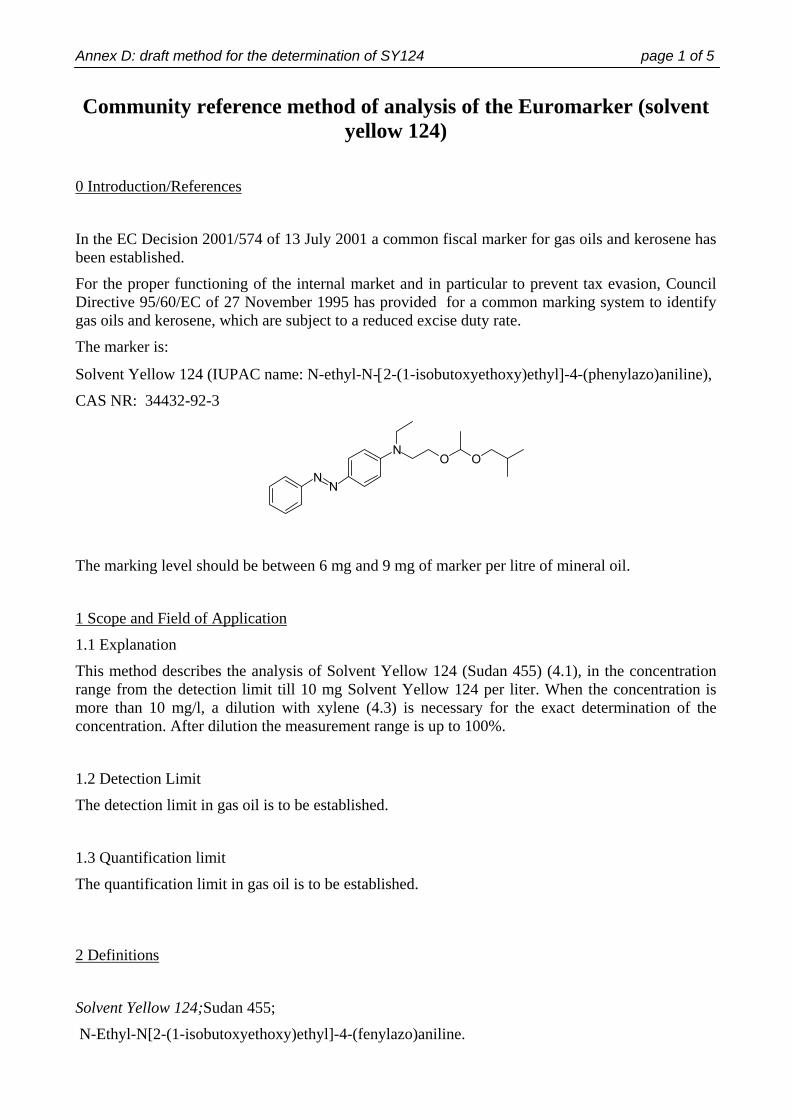
Annex D: draft method for the determination of SY124 page 1 of 5
Community reference method of analysis of the Euromarker (solvent yellow 124)
0 Introduction/References
In the EC Decision 2001/574 of 13 July 2001 a common fiscal marker for gas oils and kerosene has been established.
For the proper functioning of the internal market and in particular to prevent tax evasion, Council Directive 95/60/EC of 27 November 1995 has provided for a common marking system to identify gas oils and kerosene, which are subject to a reduced excise duty rate.
The marker is:
Solvent Yellow 124 (IUPAC name: N-ethyl-N-[2-(1-isobutoxyethoxy)ethyl]-4-(phenylazo)aniline),
CAS NR: 34432-92-3
NN
NO O
The marking level should be between 6 mg and 9 mg of marker per litre of mineral oil.
1 Scope and Field of Application
1.1 Explanation
This method describes the analysis of Solvent Yellow 124 (Sudan 455) (4.1), in the concentration range from the detection limit till 10 mg Solvent Yellow 124 per liter. When the concentration is more than 10 mg/l, a dilution with xylene (4.3) is necessary for the exact determination of the concentration. After dilution the measurement range is up to 100%.
1.2 Detection Limit
The detection limit in gas oil is to be established.
1.3 Quantification limit
The quantification limit in gas oil is to be established.
2 Definitions
Solvent Yellow 124;Sudan 455;
N-Ethyl-N[2-(1-isobutoxyethoxy)ethyl]-4-(fenylazo)aniline.
Annex D: draft method for the determination of SY124 page 2 of 5
3 Principle and reactions
The sample is put into a sample vial. The product is analysed with normal phase chromatography and UV detection at 410 nm or 450 nm. External calibration is used.
4 Reagents and other materials
Use only reagents of acknowledged quality and MilliQ-water.
4.1 Solvent Yellow 124, purity 92 %.
The Solvent Yellow you should use for the calibration is sent to you together with the samples!!!! DO NOT use your own calibration samples!!!!
4.2 Toluene, for L.C. Attention
Xn
schadelijk harmful,
F
licht ontvlambaar
Lightly inflammable.
4.3 o-Xylene p.a.. Attention
Xn
schadelijk Harmful.
4.4 Ethyl acetate, p.a. Attention
Xn
schadelijk Irritating,
F
licht ontvlambaar
Lightly inflammable
4.5 Reference Stock solution(ca. 100 mg/l): Weigh in 55 mg Solvent Yellow (4.1) in a 500 ml volumetric flask and make up with xylene (4.3) to volume. Record the weight to four decimal places. Mix thoroughly, allow to stand for one night. Then thoroughly mix again and prepare the calibration solutions
4.6 Calbration solutions:
Concentration Volume reference stock solution
Final volume volumetric flask
Ca. 10 mg/L 10 ml 100 ml Ca. 5 mg/L 5 ml 100 ml Ca. 1 mg/L 1 ml 100 ml The volumetric flasks grade B or better. The pipettes of 1 ml, 2 ml and 10 ml capacity, grade B or better. Calculate the exact concentrations!!!! 4.7 Mobile phase
- Eluent Mix in a 2000 ml volumetric flask, 40 ml ethyl acetate (4.5) and 1960 ml toluene (4.2) and homogenise.
Annex D: draft method for the determination of SY124 page 3 of 5
5 Apparatus
5.1 Standard laboratory glassware. Volumetric flasks and pipettes should be B-grade or better.
5.2 HPLC apparatus, equipped with the following:
5.2.1 HPLC-pump, fit for zero pulsation that delivers a constant flow at the rate required.
5.2.2 Sample injector, comprising a loop injector (manual or part of an autosampler) with a capacity of 20 µl.
5.3.3 Column, 5 µm silica length 200- 250 mm, diameter 3.0 to 5 mm ID. e.g. Waters Sperisorb 5 µm or Luna 5 Sµm Silica Phenomenex..
5.3.4 Precolumn, silica e.g. Sherisorb S5W Waters. Use is advised, but not obligatory.
5.3.5 Column oven: should be used when the retention time of the SY124 peak is not stable from run to run. Temperature 40 0C.
5.3.5 Detector: UV 410 nm, or diode array both 410 nm and 450 nm. 5.3.6 Integration system, comprising an electronic integrator with calculating and reporting
capabilities, compatible with the output of the detector.
6 Procedure
6.1 General
take a representative sample of the product to be analysed.
6.2 Pre-treatment of the sample
Transfer sample to sample vial. Filter the sample when it is dirty through a syringe filter e.g. 0.45 µm PTFE.
6.3 Determination
Before analyzing the samples first the stability of the HPLC system and the retention time of the SY124 have to be checked. Inject the calibration solution of 10 mg/L three times. The relative standard deviation of the peak area of the 3 injections should be less then 1 %. The retention time of SY124 has to be between 2 and 4 times the retention time of the void volume (t0) and the relative standard deviation of the retention time should be less then 2 %. If the retention time is too fast or too slow the eluent has to be adapted. The addition of ethyl acetate to the eluent results in a shorter retention time.
When the system check is passed:
Both the samples and the calibration vials have to be analyzed in duplicate.
Start with the 3 samples of the calibration. Next 12 samples are analyzed. Then the calibration is repeated. Next the other 12 samples are analyzed and the sequence is ended wih the 3 calibration
Annex D: draft method for the determination of SY124 page 4 of 5
samples. So the sequence is ended with a calibration. The calibration curve is forced through zero. When the correlation coefficient of the linear regression of all the calibration points (the total of calibration points will be 18) is more then 0.99 the calibration is adequate. If the correlation coefficient is less then 0.99 the system performance has to be checked and if possible improved. However when improvement is not achieved results still can be reported together with the correlation coefficient.
In annex 1 the sequence for the autosampler is given.
7 Precision
7.1 Repeatibility
The difference between the results of two single determinations, carried out in rapid succession by the same operator under the same conditions on identical test material, shall not exceed the values in 95 % of the analyses, for samples with a content of: - 0,12 g/1000 l: Under investigaion
- 6,0 g/1000 l: Under investigation
7.2 Reproducibility
The difference between the results of two single and independent determinations, obtained by two operators working indifferent laboratories under different conditions on identical material, shall not exceed in 95 % of the analyses, for samples with a content of:
- 0,12 g/1000 l: Under investigation
- 6,0 g/1000 l: Under investigation
7.3 Measurement uncertainty
The measurement uncertainty for:
- 0,12 g/1000 l is: Under investigation
- 6,0 g/1000 l is: Under investigation
8. Literature
8.1 EC Directive 95/60 of. 27 November 1995, establishing a common fiscal marker for gas oils and kerosene.
8.2 Quantitative testing of Sudan Marker 455 liquid (Solvent Yellow) in Mineral Oils by means of liquid chromatography (HPLC), Joint Research Centre Ispra 1999.
Annex 1 1/1
SY124
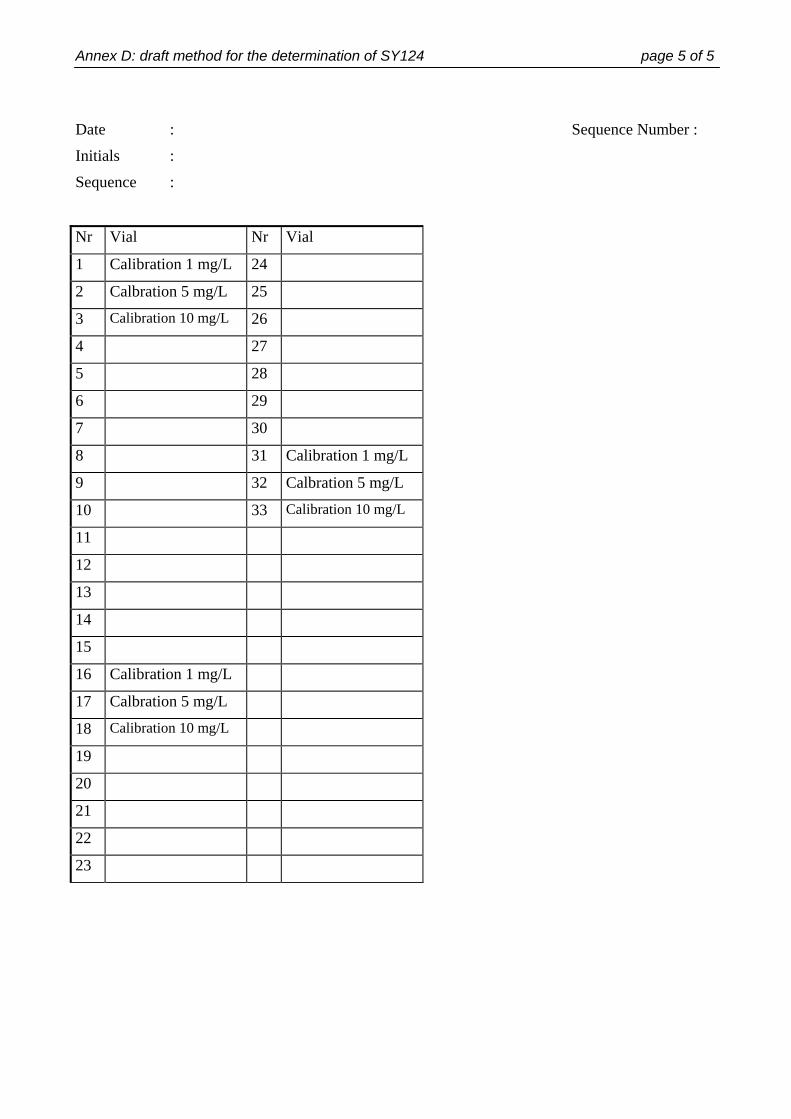
Annex D: draft method for the determination of SY124 page 5 of 5
Date : Sequence Number :
Initials :
Sequence :
Nr Vial Nr Vial
1 Calibration 1 mg/L 24
2 Calbration 5 mg/L 25
3 Calibration 10 mg/L 26
4 27
5 28
6 29
7 30
8 31 Calibration 1 mg/L
9 32 Calbration 5 mg/L
10 33 Calibration 10 mg/L
11
12
13
14
15
16 Calibration 1 mg/L
17 Calbration 5 mg/L
18 Calibration 10 mg/L
19
20
21
22
23
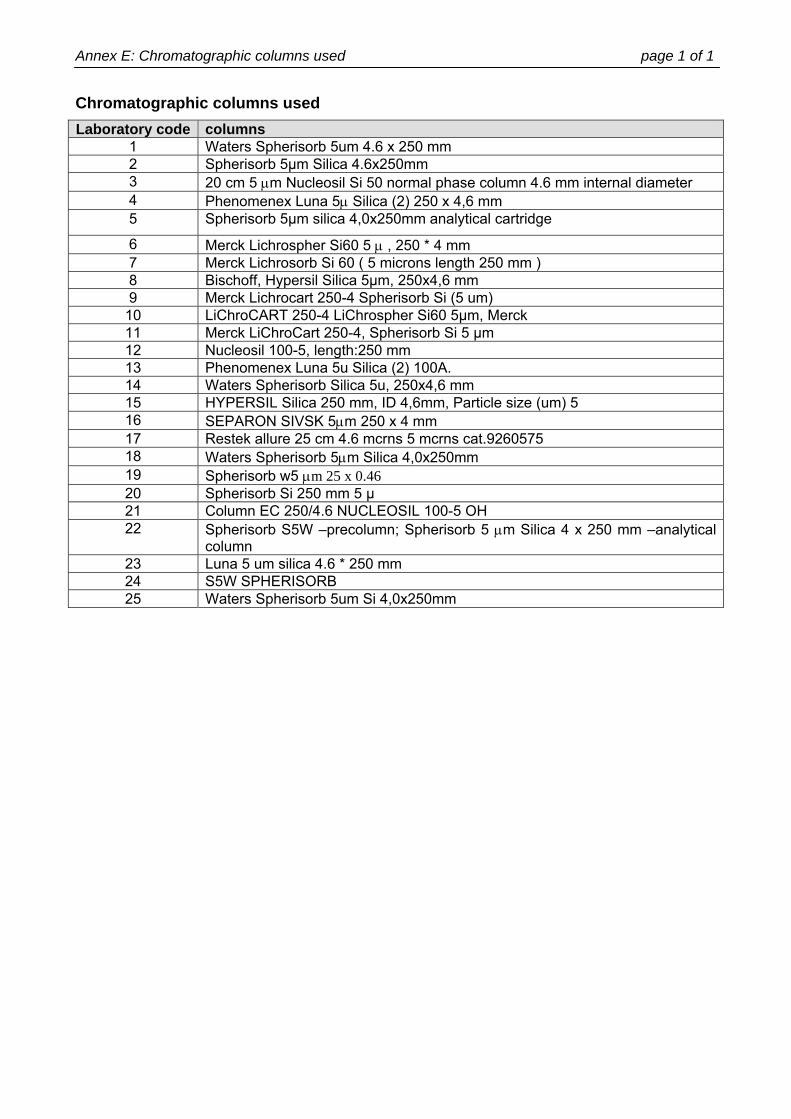
Annex E: Chromatographic columns used page 1 of 1
Chromatographic columns used Laboratory code columns
1 Waters Spherisorb 5um 4.6 x 250 mm 2 Spherisorb 5µm Silica 4.6x250mm 3 20 cm 5 μm Nucleosil Si 50 normal phase column 4.6 mm internal diameter 4 Phenomenex Luna 5μ Silica (2) 250 x 4,6 mm 5 Spherisorb 5µm silica 4,0x250mm analytical cartridge
6 Merck Lichrospher Si60 5 μ , 250 * 4 mm 7 Merck Lichrosorb Si 60 ( 5 microns length 250 mm ) 8 Bischoff, Hypersil Silica 5µm, 250x4,6 mm 9 Merck Lichrocart 250-4 Spherisorb Si (5 um) 10 LiChroCART 250-4 LiChrospher Si60 5µm, Merck 11 Merck LiChroCart 250-4, Spherisorb Si 5 µm 12 Nucleosil 100-5, length:250 mm 13 Phenomenex Luna 5u Silica (2) 100A. 14 Waters Spherisorb Silica 5u, 250x4,6 mm 15 HYPERSIL Silica 250 mm, ID 4,6mm, Particle size (um) 5 16 SEPARON SIVSK 5μm 250 x 4 mm 17 Restek allure 25 cm 4.6 mcrns 5 mcrns cat.9260575 18 Waters Spherisorb 5μm Silica 4,0x250mm 19 Spherisorb w5 μm 25 x 0.46 20 Spherisorb Si 250 mm 5 μ 21 Column EC 250/4.6 NUCLEOSIL 100-5 OH 22 Spherisorb S5W –precolumn; Spherisorb 5 μm Silica 4 x 250 mm –analytical
column 23 Luna 5 um silica 4.6 * 250 mm 24 S5W SPHERISORB 25 Waters Spherisorb 5um Si 4,0x250mm
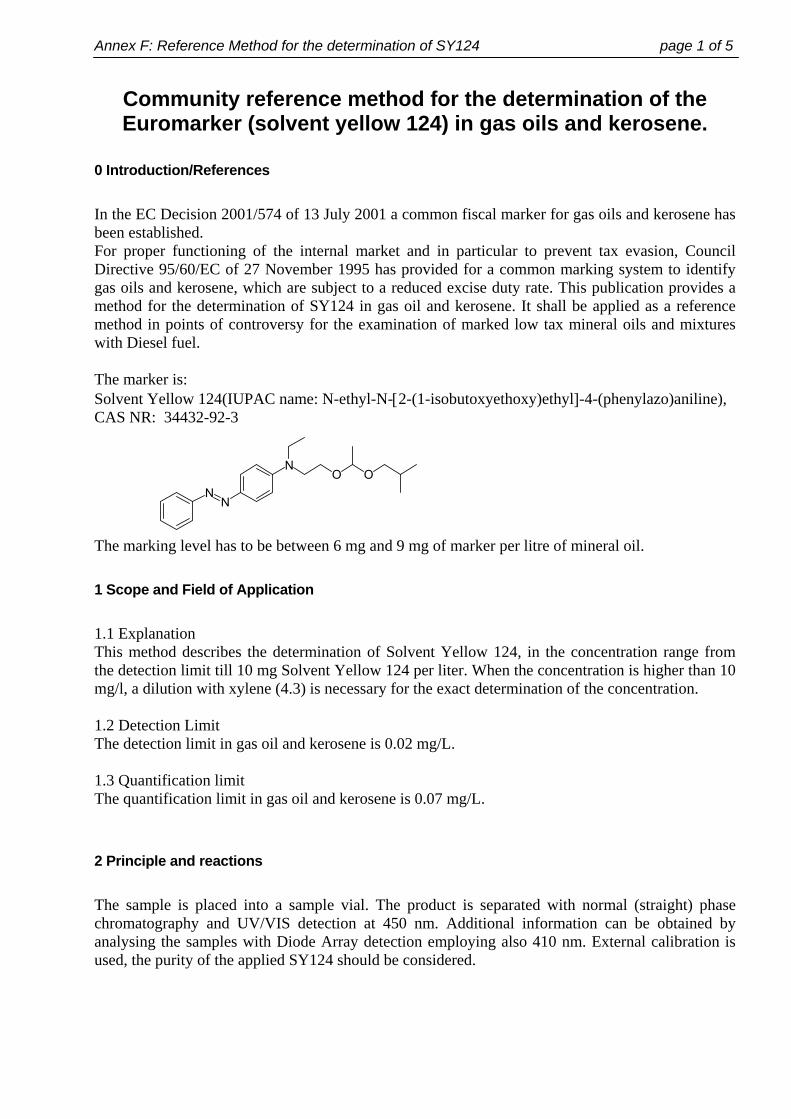
Annex F: Reference Method for the determination of SY124 page 1 of 5
Community reference method for the determination of the Euromarker (solvent yellow 124) in gas oils and kerosene.
0 Introduction/References
In the EC Decision 2001/574 of 13 July 2001 a common fiscal marker for gas oils and kerosene has been established. For proper functioning of the internal market and in particular to prevent tax evasion, Council Directive 95/60/EC of 27 November 1995 has provided for a common marking system to identify gas oils and kerosene, which are subject to a reduced excise duty rate. This publication provides a method for the determination of SY124 in gas oil and kerosene. It shall be applied as a reference method in points of controversy for the examination of marked low tax mineral oils and mixtures with Diesel fuel. The marker is: Solvent Yellow 124(IUPAC name: N-ethyl-N-[2-(1-isobutoxyethoxy)ethyl]-4-(phenylazo)aniline), CAS NR: 34432-92-3 The marking level has to be between 6 mg and 9 mg of marker per litre of mineral oil. 1 Scope and Field of Application
1.1 Explanation This method describes the determination of Solvent Yellow 124, in the concentration range from the detection limit till 10 mg Solvent Yellow 124 per liter. When the concentration is higher than 10 mg/l, a dilution with xylene (4.3) is necessary for the exact determination of the concentration. 1.2 Detection Limit The detection limit in gas oil and kerosene is 0.02 mg/L. 1.3 Quantification limit The quantification limit in gas oil and kerosene is 0.07 mg/L. 2 Principle and reactions
The sample is placed into a sample vial. The product is separated with normal (straight) phase chromatography and UV/VIS detection at 450 nm. Additional information can be obtained by analysing the samples with Diode Array detection employing also 410 nm. External calibration is used, the purity of the applied SY124 should be considered.
NN
NO O
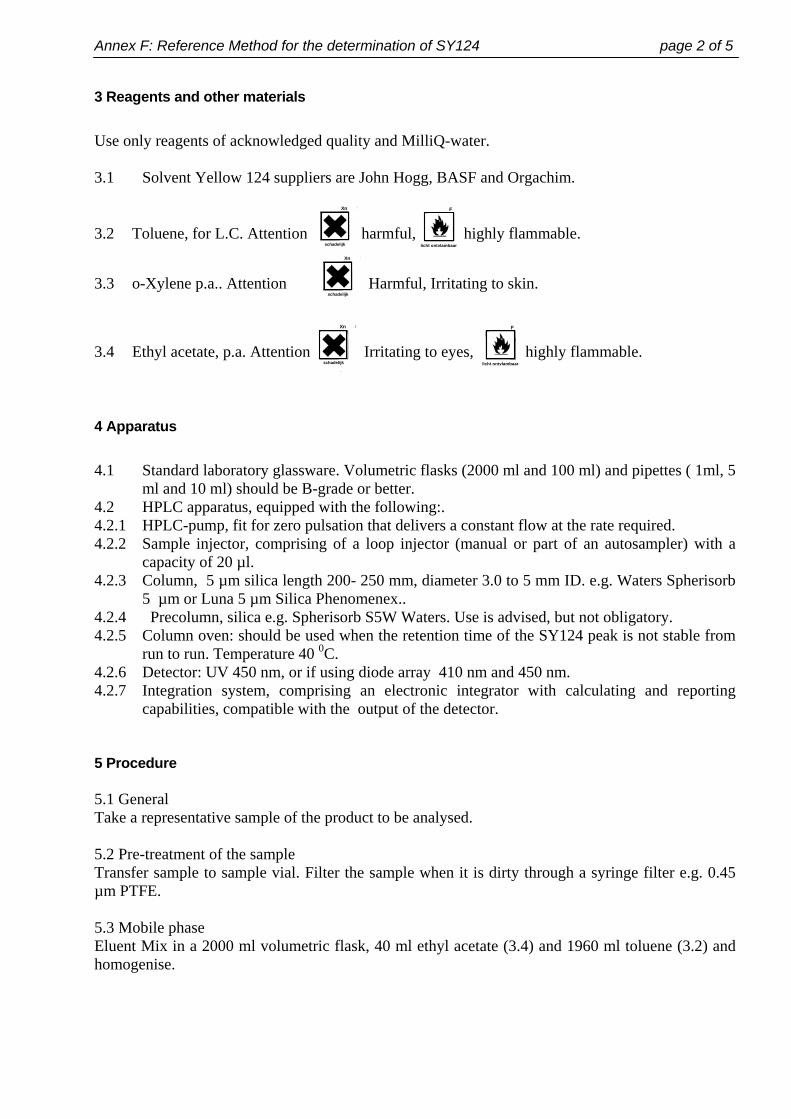
Annex F: Reference Method for the determination of SY124 page 2 of 5
3 Reagents and other materials
Use only reagents of acknowledged quality and MilliQ-water. 3.1 Solvent Yellow 124 suppliers are John Hogg, BASF and Orgachim.
3.2 Toluene, for L.C. Attention
Xn
schadelijk harmful,
F
licht ontvlambaar
highly flammable.
3.3 o-Xylene p.a.. Attention
Xn
schadelijk Harmful, Irritating to skin.
3.4 Ethyl acetate, p.a. Attention
Xn
schadelijk Irritating to eyes,
F
licht ontvlambaar
highly flammable.
4 Apparatus
4.1 Standard laboratory glassware. Volumetric flasks (2000 ml and 100 ml) and pipettes ( 1ml, 5
ml and 10 ml) should be B-grade or better. 4.2 HPLC apparatus, equipped with the following:. 4.2.1 HPLC-pump, fit for zero pulsation that delivers a constant flow at the rate required. 4.2.2 Sample injector, comprising of a loop injector (manual or part of an autosampler) with a
capacity of 20 µl. 4.2.3 Column, 5 µm silica length 200- 250 mm, diameter 3.0 to 5 mm ID. e.g. Waters Spherisorb
5 µm or Luna 5 µm Silica Phenomenex.. 4.2.4 Precolumn, silica e.g. Spherisorb S5W Waters. Use is advised, but not obligatory. 4.2.5 Column oven: should be used when the retention time of the SY124 peak is not stable from
run to run. Temperature 40 0C. 4.2.6 Detector: UV 450 nm, or if using diode array 410 nm and 450 nm. 4.2.7 Integration system, comprising an electronic integrator with calculating and reporting
capabilities, compatible with the output of the detector. 5 Procedure 5.1 General Take a representative sample of the product to be analysed. 5.2 Pre-treatment of the sample Transfer sample to sample vial. Filter the sample when it is dirty through a syringe filter e.g. 0.45 µm PTFE. 5.3 Mobile phase Eluent Mix in a 2000 ml volumetric flask, 40 ml ethyl acetate (3.4) and 1960 ml toluene (3.2) and homogenise.
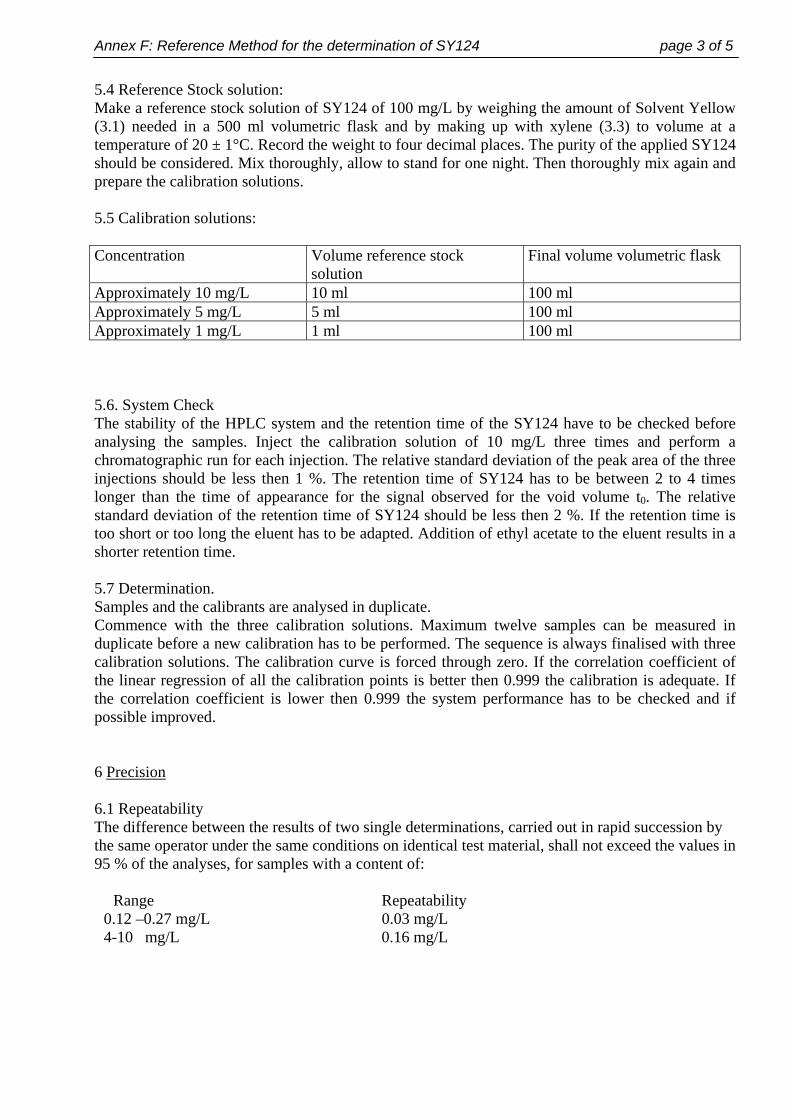
Annex F: Reference Method for the determination of SY124 page 3 of 5
5.4 Reference Stock solution: Make a reference stock solution of SY124 of 100 mg/L by weighing the amount of Solvent Yellow (3.1) needed in a 500 ml volumetric flask and by making up with xylene (3.3) to volume at a temperature of 20 ± 1°C. Record the weight to four decimal places. The purity of the applied SY124 should be considered. Mix thoroughly, allow to stand for one night. Then thoroughly mix again and prepare the calibration solutions. 5.5 Calibration solutions: Concentration Volume reference stock
solution Final volume volumetric flask
Approximately 10 mg/L 10 ml 100 ml Approximately 5 mg/L 5 ml 100 ml Approximately 1 mg/L 1 ml 100 ml 5.6. System Check The stability of the HPLC system and the retention time of the SY124 have to be checked before analysing the samples. Inject the calibration solution of 10 mg/L three times and perform a chromatographic run for each injection. The relative standard deviation of the peak area of the three injections should be less then 1 %. The retention time of SY124 has to be between 2 to 4 times longer than the time of appearance for the signal observed for the void volume t0. The relative standard deviation of the retention time of SY124 should be less then 2 %. If the retention time is too short or too long the eluent has to be adapted. Addition of ethyl acetate to the eluent results in a shorter retention time. 5.7 Determination. Samples and the calibrants are analysed in duplicate. Commence with the three calibration solutions. Maximum twelve samples can be measured in duplicate before a new calibration has to be performed. The sequence is always finalised with three calibration solutions. The calibration curve is forced through zero. If the correlation coefficient of the linear regression of all the calibration points is better then 0.999 the calibration is adequate. If the correlation coefficient is lower then 0.999 the system performance has to be checked and if possible improved. 6 Precision 6.1 Repeatability The difference between the results of two single determinations, carried out in rapid succession by the same operator under the same conditions on identical test material, shall not exceed the values in 95 % of the analyses, for samples with a content of:
Range Repeatability 0.12 –0.27 mg/L 0.03 mg/L 4-10 mg/L 0.16 mg/L
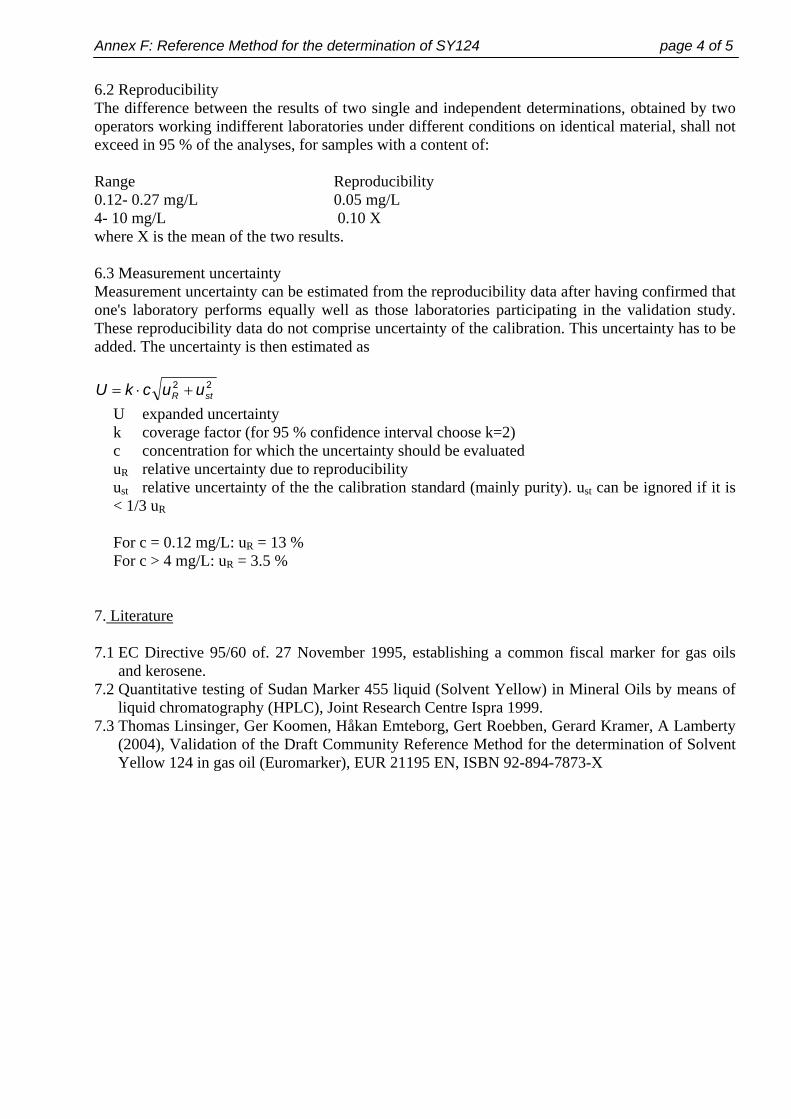
Annex F: Reference Method for the determination of SY124 page 4 of 5
6.2 Reproducibility The difference between the results of two single and independent determinations, obtained by two operators working indifferent laboratories under different conditions on identical material, shall not exceed in 95 % of the analyses, for samples with a content of: Range Reproducibility 0.12- 0.27 mg/L 0.05 mg/L 4- 10 mg/L 0.10 X where X is the mean of the two results. 6.3 Measurement uncertainty Measurement uncertainty can be estimated from the reproducibility data after having confirmed that one's laboratory performs equally well as those laboratories participating in the validation study. These reproducibility data do not comprise uncertainty of the calibration. This uncertainty has to be added. The uncertainty is then estimated as
U expanded uncertainty k coverage factor (for 95 % confidence interval choose k=2) c concentration for which the uncertainty should be evaluated uR relative uncertainty due to reproducibility ust relative uncertainty of the the calibration standard (mainly purity). ust can be ignored if it is < 1/3 uR For c = 0.12 mg/L: uR = 13 % For c > 4 mg/L: uR = 3.5 %
7. Literature 7.1 EC Directive 95/60 of. 27 November 1995, establishing a common fiscal marker for gas oils
and kerosene. 7.2 Quantitative testing of Sudan Marker 455 liquid (Solvent Yellow) in Mineral Oils by means of
liquid chromatography (HPLC), Joint Research Centre Ispra 1999. 7.3 Thomas Linsinger, Ger Koomen, Håkan Emteborg, Gert Roebben, Gerard Kramer, A Lamberty
(2004), Validation of the Draft Community Reference Method for the determination of Solvent Yellow 124 in gas oil (Euromarker), EUR 21195 EN, ISBN 92-894-7873-X
22stR uuckU +⋅=
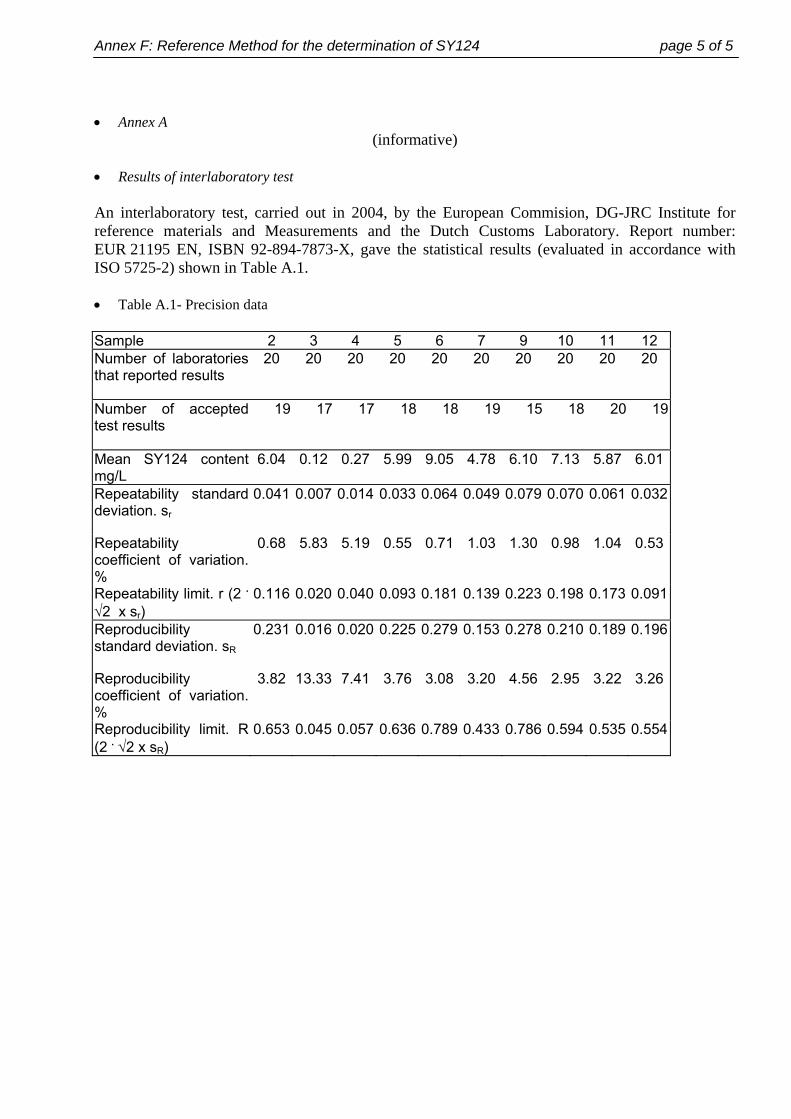
Annex F: Reference Method for the determination of SY124 page 5 of 5
• Annex A (informative)
• Results of interlaboratory test
An interlaboratory test, carried out in 2004, by the European Commision, DG-JRC Institute for reference materials and Measurements and the Dutch Customs Laboratory. Report number: EUR 21195 EN, ISBN 92-894-7873-X, gave the statistical results (evaluated in accordance with ISO 5725-2) shown in Table A.1. • Table A.1- Precision data Sample 2 3 4 5 6 7 9 10 11 12 Number of laboratories that reported results
20 20 20 20 20 20 20 20 20 20
Number of accepted test results
19 17 17 18 18 19 15 18 20 19
Mean SY124 content mg/L
6.04 0.12 0.27 5.99 9.05 4.78 6.10 7.13 5.87 6.01
Repeatability standard deviation. sr
0.041 0.007 0.014 0.033 0.064 0.049 0.079 0.070 0.061 0.032
Repeatability coefficient of variation. %
0.68 5.83 5.19 0.55 0.71 1.03 1.30 0.98 1.04 0.53
Repeatability limit. r (2 . √2 x sr)
0.116 0.020 0.040 0.093 0.181 0.139 0.223 0.198 0.173 0.091
Reproducibility standard deviation. sR
0.231 0.016 0.020 0.225 0.279 0.153 0.278 0.210 0.189 0.196
Reproducibility coefficient of variation. %
3.82 13.33 7.41 3.76 3.08 3.20 4.56 2.95 3.22 3.26
Reproducibility limit. R (2 . √2 x sR)
0.653 0.045 0.057 0.636 0.789 0.433 0.786 0.594 0.535 0.554