dvb-t measurements with promax tv explorer … measurements with promax tv explorer ii+ and ... i...
TRANSCRIPT
DVB-T measurements with PROMAX TV EXPLORER II+ and analysis of DVB
transport streams 1
1
CONTENTS
1. Summary…………………………………………………………………………………. 4
2. Preface…………………………………………………………………………………… 5
3. Abbreviations…………………………………………………………………………….. 6
4. Introducing KaHo Sint-Lieven………………………………………………………….. 8
5. Project description……………………………………………………………………….10
6. Action Plan……………………………………………………………………………….. 11
7. Theoretical part………………………………………………………………………….. 13
7.1 Analog television………………………………………………………………. 13
7.1.1 Description of a line in the PAL system…………………………...14
7.2 Transport stream……………………………………………………………….15
7.2.1 Program Specific Information……………………………………………….18
PAT
PMT
CAT
NIT
7.3.1 Descriptors………………………………………………………….. 19
7.3 Elementary Stream…………………………………………………………… 20
7.3.1 Image codification………………………………………………….. 20
Transformation
Quantification
Entropic codification
7.3.2 Video codification…………………………………………………... 22
7.3.3 Audio codification…………………………………………………... 24
7.4 MPEG 2 standard……………………………………………………………... 25
7.4.1 Hierarchy……………………………………………………………. 25
7.4.2 Scalability…………………………………………………………… 26
7.4.3 Levels and profiles………………………………………………..... 27
7.5 DVB-SI…………………………………………………………………………. 28
NIT
SDT
EIT
TDT
TOD
2 Anna Arias
BAT
ST
RST
DIT
SIT
7.6 Measurements on the digital signal…………………………………………. 30
7.7 Error-correcting algorithms…………………………………………………… 32
Viterbi algorithm
Reed Solomon algorithm
7.8 System used in digital television…………………………………………….. 33
COFDM
QAM
Constellation diagram
8. Practical part…………………………………………………………………………….. 35
8.1 Analog signal tests……………………………………………………………. 35
8.1.1 Test using the STB and an oscilloscope………………… 35
8.1.2 Test using a vectorscope and a TV signal generator….. 38
8.2 Explanation of TsReader software………………………………………….. 41
8.2.1 Available graphs on light version of the TsReader……………... 47
8.2.1.1 Mux usage stacked area………………………………...48
8.2.1.2 PID Usage……………………………………………….. 49
8.2.1.3 Video Bit rate area chart…………………………….….. 50
8.2.1.4 Active PIDs Chart…………………………….…………. 51
8.2.2 Parameters displayed on the TsReader…………………………. 52
TEI errors
Continuity Errors
CRC errors
Section
Example PAT packet……………………………………. 55
Example PMT packet……………………………………. 56
8.3 TV EXPLORER II+ of PROMAX…………………………………………….. 63
8.3.1 Installation of the software………………………………………… 63
8.3.2 Available measurements in the TV Explorer II+ equipment…… 67
Channel Power
C/N
MER
DVB-T measurements with PROMAX TV EXPLORER II+ and analysis of DVB
transport streams 3
3
MER by carrier
BER
CBER
VBER
8.4 Graphs representations in TV Explorer II+………………………… 72
Constellation Diagram
Spectogram
Merogram
9. Final Conclusion………………………………………………………………………… 75
10. Bibliography……………………………………………………………………………. 76
4 Anna Arias
1. SUMMARY
In this project ways to study Digital Television (DTV) have been under scrutiny.
DTV has been introduced in the whole world. Analog television has been changed for
digital television because it gives better results. Digital television has a better quality of
the image, the programs are sent using less bandwidth (permitting a bigger number of
channels), etc.
Because of the analog switch off 3rd of November of 2008, in Belgium Digital
Terrestrial Television (DVB-T) has been introduced. The antennas only make it
possible to receive DTV. Therefore it is of capital importance to understand its working
principles and to take into full consideration its characteristics. Besides DVB has not
just been implanted in Belgium but is a universal phenomenon. There are three types
of Digital Television: ISDB-T (Japan and parts of South America), ATSC (USA) and
DVB-T. DVB-T has been chosen for Europe, Russia, Oceania, Africa, etc. To transmit
DVB also cable and satellite is used. Since our laboratory in Kaho Sint-Lieven Gent
has only the possibility to receive DTV with an antenna, the focus of the present project
will be on DVB-T.
Throughout the project, Transport Stream i.e. the way DTV data is transmitted,
is defined. I try to explain how it works and which are its characteristics.
There are many ways to analyze DTV. For the present project I used an
apparatus from Promax, TV Explorer II+, and a computer program, TsReader.
The objective of my project is to show and explain how a Transport Stream is
composed and how it can be analyzed.

DVB-T measurements with PROMAX TV EXPLORER II+ and analysis of DVB
transport streams 5
5
2. PREFACE
First of all, I would like to thank all the people, who have helped me during my
stay in Belgium.
I must thank my parents who gave me the support not only to live through the
Erasmus Experience and who – frankly- have given me careful attention a whole life
long.
I have to thank also my mentors. My supervisor in Ghent, eng. Patrik Debbaut,
and my mentor in Catalonia, eng. Xavier Giró. They where the ones who have guided
me during my entire project. Since the first day I arrived here in Ghent.
I also have to thank Erik Van Achter, who teaches Academic Writing at KaHo-
Sint Lieven, who was always willing to help me in writing my text in a decent English.
Finally I must remember all the people who work on the international relations
areas, in Ghent and Barcelona and who have made this Erasmus programme possible
and helped me in many aspects to adapt to a new country.

6 Anna Arias
3. ABBREVIATIONS
Abbreviattion Meaning
BAT Bouquet Association Table
BER Bit Error Ratio
CAT Conditional Acces Table
CBER BER before viterbi decoder
COFDM Coded Orthogonal Frequency Division Multiplexing
CRC Cyclic Redundancy Check
DAB Digital Audio Broadcasting
DCT Discrete Cosine Transform
DIT Discontinuity Information Table
DPCM Differential Pulse-Code Modulation
DTV Digital Television
DTV Digital Television
DVB Digital Video Broadcasting
DVB-SI Digital Video Broadcasting-Service Information
DVB-T Digital Video Broadcasting Terrestrial
EIT Event Information Table
ES Elementary Stream
IRD Integrated Receiver/decoder
MER Modulation Error Ratio
MN Noise Margin
MPEG Moving Pictures Experts Group
NIT Network Information Table
OFDM Orthogonal Frequency Division Multiplexing
PAL Phased Alternated Line
PAT Program Association Table
PCR Program Clock Reference
PMT Program Map Table
PS Program Stream
PSI Program Specific information
QAM Quadrature Amplitude Modulation
QEF Quasi-Error-Free

DVB-T measurements with PROMAX TV EXPLORER II+ and analysis of DVB
transport streams 7
7
RLE Run Length Encoding
RLE Run-Length Encoding
RST Running Status Table
SDT Service Description Table
SIT Selection Information Table
ST Stuffing Table
STB Set-Top Box
TDT Time of Date Table
TEI Transport Error Indicator
TOT Time Offset Table
TS Transport Stream
TVC Televisió de Catalunya
UTC Coordinated Universal Time
VBER BER after viterbi decoder
VLC Variable Length Code
VLC Variable Length Coding
PID Packet Identifier
TPS Transmission parameters Signalling
VOL Video Object Layer
8 Anna Arias
4. INTRODUCING KAHO SINT-LIEVEN
The Katholieke Hogeschool Sint-Lieven is a young higher education institution in the
East of Flanders with about 4800 students and 500 employees. Although it is a young institution
it has a rich tradition. The history of KaHo Sint- Lieven comes about in the histories of the 8
former higher education institutions, which have merged in 1995.
Since the merger, KaHo Sint-Lieven has reorganized and grouped into 3 campuses in 3
regions in Aalst, Gent and Sint-Niklaas. Each campus has its own traditions and can look back
on a rich – be it shorter or longer – past. Some of the eight founding institutions were
established in the 19th century.
KaHo Sint-Lieven organizes bachelors, masters, posgraduates and short educations
concerning the study-areas of biotechnology, health care, business studies, teacher training,
industrial sciences and technology and nautical sciences.
K.U Leuven association
K.U.Leuven association
In accordance with the ideas of the Sobonne (1999) and Bologna (2000) declarations
about the restructuring of higher education in Europe, the Flemish Minister of Education in going
through a process to reform the Flemish higher education system.
One of the first objectives in this information process is to stimulate co-operation
between institutions of higher education. Therefore universities and hogescholen have drawn up
agreements in order to create “associations”, linking both types of institutions togheter.
KaHo Sint-Lieven has decided to associated with the Catholic University of Leuven (KU
Leuven), Flanders’ largest and oldest university. On 11th July 2002 the association agreement
between the KU Leuven and KaHo Sint-Lieven was signed.
The below institutions constitute the “Association KU Leuven”:
• Katholieke Universiteit Leuven
• Katholieke Universiteit Brussel
• Europese Hogeschool Brussel
• Hogeschool Sint-Lukas Brussel
• Hogeschool voor Wetenschap & Kunst
• Katholieke Hogeschool Brugge-Oostende
DVB-T measurements with PROMAX TV EXPLORER II+ and analysis of DVB
transport streams 9
9
• Katholieke Hogeschool Kempen
• Katholieke Hogeschool Leuven
• Katholieke Hogeschool Limburg
• Katholieke Hogeschool Mechelen
• Katholieke Hogeschool Zuid-Westvlaanderen
• Lessius Hogeschool
• Groep T
• Katholieke Hogeschool Sint-Lieven

10 Anna Arias
5. PROJECT DESCRIPTION
The project is divided in three parts: a study of how DVB is transmitted, options
to analyze TS with TsReader and uses and main functions of the PROMAX TV
Explorer II/+ equipment.
Before I started to analyze Transport Streams, I studied the composition of it.
This was the first part. It’s really necessary to know what information is needed and
important to know how to interpret the results obtained. It also was essential to be able
to explain the results, if they are right and why, and what they mean. At the beginning
of the project I did some tests to know if we were able to receive DTV. The roof
antenna is horizontally polarized, and the DTV in Ghent is transmitted vertically
polarized. The signal is very strong, because the transmitter is close to the university.
So we haven’t had any problems with the polarization. I tried to receive DTV with an
indoor antenna (AVT100 antenna visiosat) and the results were good too.
The second part dealt with software capable of analysing TS. After testing some
computer programs, we decided that the most appropriate for use in this project is the
TsReader. It permits to see what is contained in a TS, the programs and data within a
TS, showing errors, private data, etc. We decided to work with the light version
because it gives enough functions and it’s for free on the net. It is not possible to
record Transport Streams, but this function is available in the PROMAX equipment. I
worked with Transport Streams from Philips and CISCO, that I received from my
supervisor. With those TS, I could do some measurements with TsReader and check if
it was a good tool to use to study DTV.
The last part of the project was to work with the equipment from Promax, the
TV-Explorer II/+. This permits receiving DTV, record TS and perform the most
important measurements.
Another option of the equipment is to connect it to the PC and transfer the files
recorded through a USB, providing us a lot of information. It allows watching the
available channels, shows the constellation diagram, the BER, MER, … Definitely, it
offers a good way to see all the characteristics of the DTV, permitting to choose some
parameters.
DVB-T measurements with PROMAX TV EXPLORER II+ and analysis of DVB
transport streams 11
11
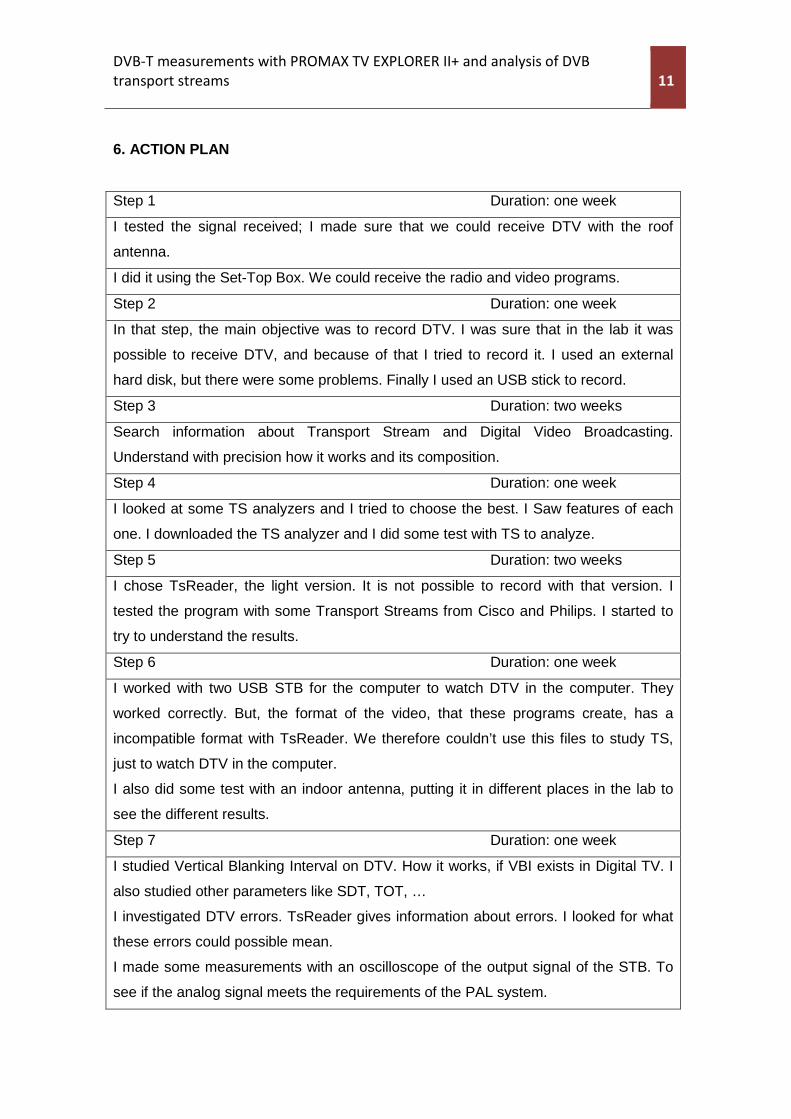
6. ACTION PLAN
Step 1 Duration: one week
I tested the signal received; I made sure that we could receive DTV with the roof
antenna.
I did it using the Set-Top Box. We could receive the radio and video programs.
Step 2 Duration: one week
In that step, the main objective was to record DTV. I was sure that in the lab it was
possible to receive DTV, and because of that I tried to record it. I used an external
hard disk, but there were some problems. Finally I used an USB stick to record.
Step 3 Duration: two weeks
Search information about Transport Stream and Digital Video Broadcasting.
Understand with precision how it works and its composition.
Step 4 Duration: one week
I looked at some TS analyzers and I tried to choose the best. I Saw features of each
one. I downloaded the TS analyzer and I did some test with TS to analyze.
Step 5 Duration: two weeks
I chose TsReader, the light version. It is not possible to record with that version. I
tested the program with some Transport Streams from Cisco and Philips. I started to
try to understand the results.
Step 6 Duration: one week
I worked with two USB STB for the computer to watch DTV in the computer. They
worked correctly. But, the format of the video, that these programs create, has a
incompatible format with TsReader. We therefore couldn’t use this files to study TS,
just to watch DTV in the computer.
I also did some test with an indoor antenna, putting it in different places in the lab to
see the different results.
Step 7 Duration: one week
I studied Vertical Blanking Interval on DTV. How it works, if VBI exists in Digital TV. I
also studied other parameters like SDT, TOT, …
I investigated DTV errors. TsReader gives information about errors. I looked for what
these errors could possible mean.
I made some measurements with an oscilloscope of the output signal of the STB. To
see if the analog signal meets the requirements of the PAL system.
12 Anna Arias
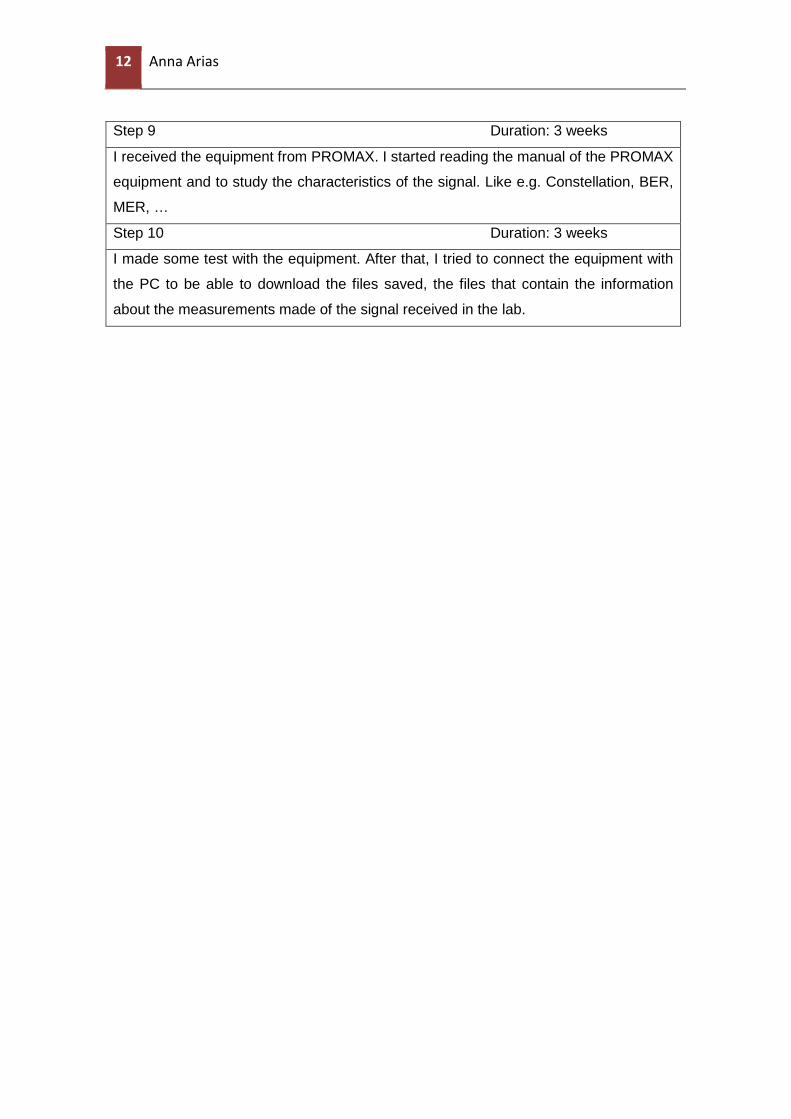
Step 9 Duration: 3 weeks
I received the equipment from PROMAX. I started reading the manual of the PROMAX
equipment and to study the characteristics of the signal. Like e.g. Constellation, BER,
MER, …
Step 10 Duration: 3 weeks
I made some test with the equipment. After that, I tried to connect the equipment with
the PC to be able to download the files saved, the files that contain the information
about the measurements made of the signal received in the lab.
DVB-T measurements with PROMAX TV EXPLORER II+ and analysis of DVB
transport streams 13
13
7. THEORETICAL PART
7.1 ANALOG TELEVISION
In what follows, a brief explanation will be given to understand better the
information explained in the practical part about the output signal of a Set-Top box.
In Europe, the analog colour system used is PAL. In this system, the luminance
signal and the chrominance signal are sent separately, forming together a composite
video baseband signal. The chrominance information is a quadrature amplitude
modulated subcarrier.
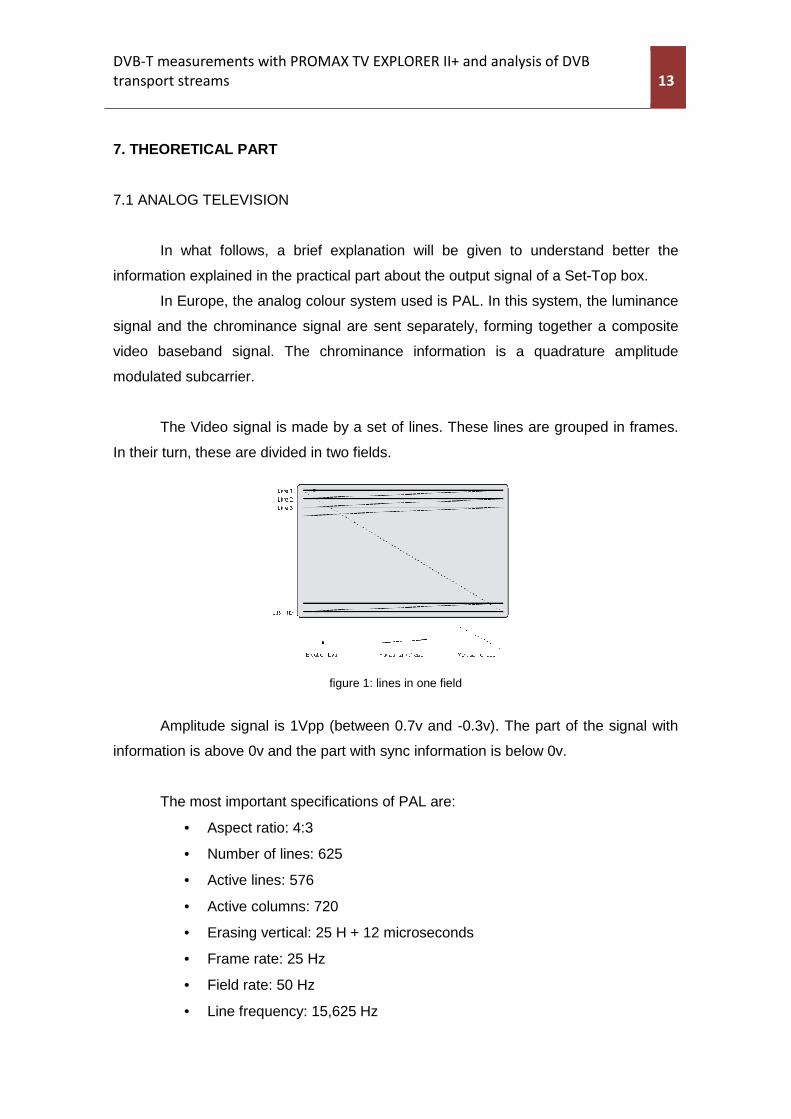
The Video signal is made by a set of lines. These lines are grouped in frames.
In their turn, these are divided in two fields.
figure 1: lines in one field
Amplitude signal is 1Vpp (between 0.7v and -0.3v). The part of the signal with
information is above 0v and the part with sync information is below 0v.
The most important specifications of PAL are:
• Aspect ratio: 4:3
• Number of lines: 625
• Active lines: 576
• Active columns: 720
• Erasing vertical: 25 H + 12 microseconds
• Frame rate: 25 Hz
• Field rate: 50 Hz
• Line frequency: 15,625 Hz
14 Anna Arias
• Subcarrier chrominance frequency: 4,4336 MHz
• Line period: 64 microseconds
• Active line period: 52 microseconds
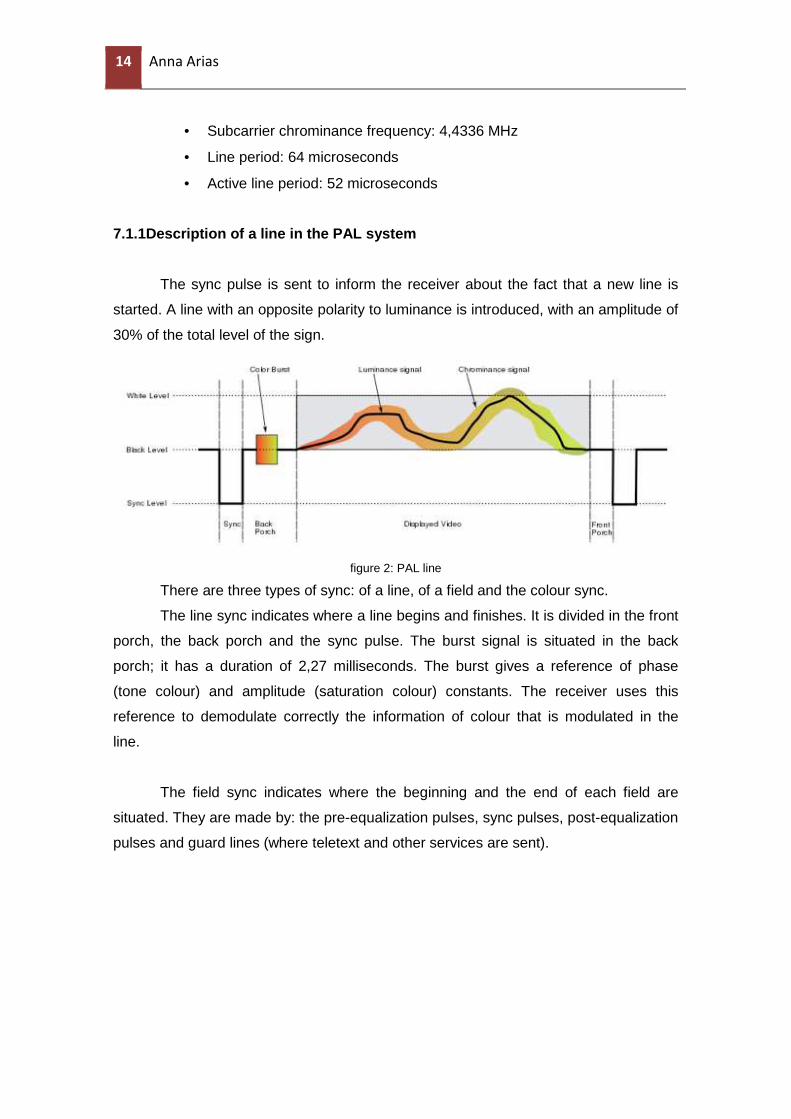
7.1.1Description of a line in the PAL system
The sync pulse is sent to inform the receiver about the fact that a new line is
started. A line with an opposite polarity to luminance is introduced, with an amplitude of
30% of the total level of the sign.
figure 2: PAL line
There are three types of sync: of a line, of a field and the colour sync.
The line sync indicates where a line begins and finishes. It is divided in the front
porch, the back porch and the sync pulse. The burst signal is situated in the back
porch; it has a duration of 2,27 milliseconds. The burst gives a reference of phase
(tone colour) and amplitude (saturation colour) constants. The receiver uses this
reference to demodulate correctly the information of colour that is modulated in the
line.
The field sync indicates where the beginning and the end of each field are
situated. They are made by: the pre-equalization pulses, sync pulses, post-equalization
pulses and guard lines (where teletext and other services are sent).
DVB-T measurements with PROMAX TV EXPLORER II+ and analysis of DVB
transport streams 15
15
7.2 TRANSPORT STREAM
The goal of the project is to analyze transport streams. Throughout the project it
will be explained how this takes place, mentioning the composition and the
characteristics of a transport stream. To be able to fully understand all the results and
the management of the software and equipment a brief explanation is written.
MPEG-2 and DVB specify the workings of Digital Television (in Europe). First MPEG 2
specification is explained.
To generate a TS, the point of departure are the Elementary Streams. A set of
ES forms the program streams of the Transport Stream.
The first step is to split the ES into packets. These packets are called PES packets.
They are composed of the PES header and the payload. The length of the payload is
variable, up to 64 kBytes, and depends on the application. The payload is composed of
a variable number of data of one Elementary Stream and is written in the same order
as the original ES.
In the PES header we can find the Stream_id to be able to know to which ES
they belong. This is a unique number inside the program stream. With that number it is
possible to reconstruct a determined ES. One of the objectives is to give the timing
information and characteristics of the ES that ES is not capable of giving. Like e.g. the
dimensions of the image, image frequency, level, profile, aspect ratio, ...
The second step in the generation of the TS, is to select the PES packets and
insert them within small packets of 188 bytes. If there is less data than 188, because it
is difficult to have all the time the exact data, it contains null data. However, these
packets always have to contain data from only one PES packet.
In the header of the TS packet we can find the PID. The PID indicates to which
Elementary Stream the TS Packet belongs. This number has to be unique for all the
TS. In the header information about transport level and multiplexing is stored. Some of
this information is transport priority, continuity counter and adaptation field control. The
continuity counter is a number that increases each time TS packet is sent, to indicate
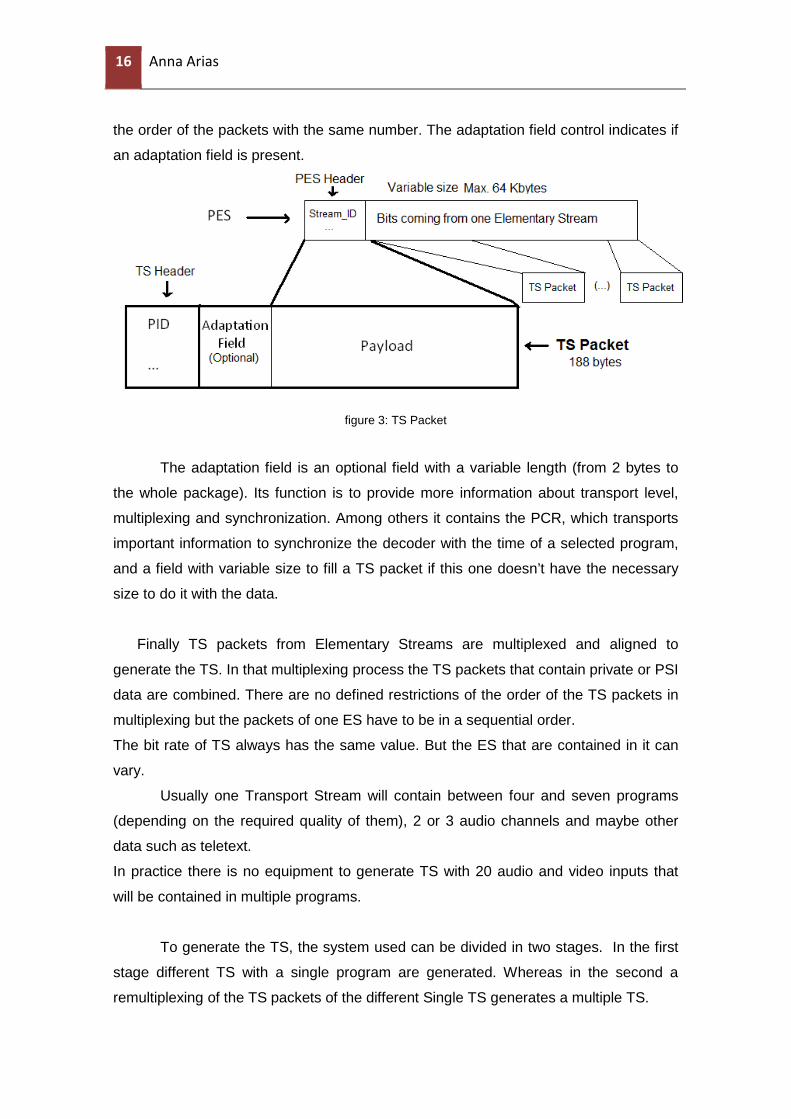
16 Anna Arias
the order of the packets with the same number. The adaptation field control indicates if
an adaptation field is present.
figure 3: TS Packet
The adaptation field is an optional field with a variable length (from 2 bytes to
the whole package). Its function is to provide more information about transport level,
multiplexing and synchronization. Among others it contains the PCR, which transports
important information to synchronize the decoder with the time of a selected program,
and a field with variable size to fill a TS packet if this one doesn’t have the necessary
size to do it with the data.
Finally TS packets from Elementary Streams are multiplexed and aligned to
generate the TS. In that multiplexing process the TS packets that contain private or PSI
data are combined. There are no defined restrictions of the order of the TS packets in
multiplexing but the packets of one ES have to be in a sequential order.
The bit rate of TS always has the same value. But the ES that are contained in it can
vary.
Usually one Transport Stream will contain between four and seven programs
(depending on the required quality of them), 2 or 3 audio channels and maybe other
data such as teletext.
In practice there is no equipment to generate TS with 20 audio and video inputs that
will be contained in multiple programs.
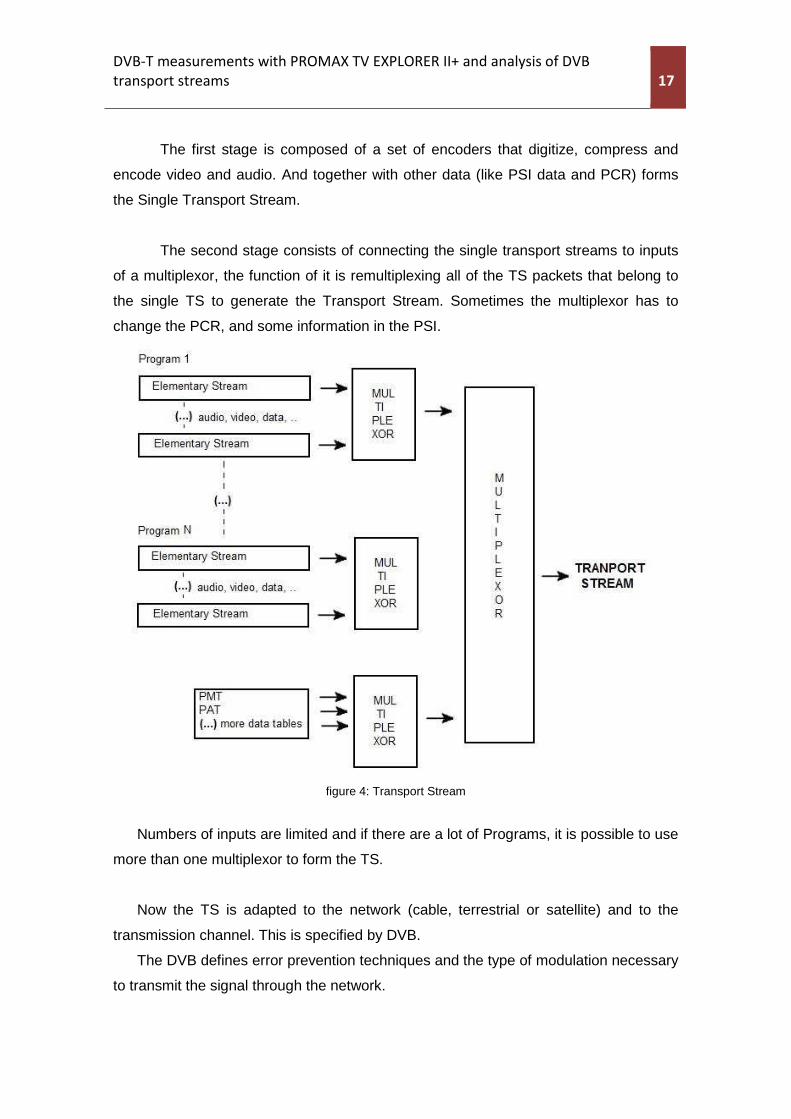
To generate the TS, the system used can be divided in two stages. In the first
stage different TS with a single program are generated. Whereas in the second a
remultiplexing of the TS packets of the different Single TS generates a multiple TS.
DVB-T measurements with PROMAX TV EXPLORER II+ and analysis of DVB
transport streams 17
17
The first stage is composed of a set of encoders that digitize, compress and
encode video and audio. And together with other data (like PSI data and PCR) forms
the Single Transport Stream.
The second stage consists of connecting the single transport streams to inputs
of a multiplexor, the function of it is remultiplexing all of the TS packets that belong to
the single TS to generate the Transport Stream. Sometimes the multiplexor has to
change the PCR, and some information in the PSI.
figure 4: Transport Stream
Numbers of inputs are limited and if there are a lot of Programs, it is possible to use
more than one multiplexor to form the TS.
Now the TS is adapted to the network (cable, terrestrial or satellite) and to the
transmission channel. This is specified by DVB.
The DVB defines error prevention techniques and the type of modulation necessary
to transmit the signal through the network.
18 Anna Arias
7.2.1 Program Specific information
With the PSI, MPEG-2 provides a method to describe the contents of a
transport stream with the aim of simplifying processes, guide demultiplexation and
presentation of programs.
There are four PSI data:
• Program Association Table (PAT)
All TS have to contain a valid and complete PAT.
It lists every program in a multiplex transport stream. Each entry in the PAT
points to a PMT. TS packets that contain PAT information always have a PID of
0x0000.
The first entry in the PAT, program 0, is reserved for network data and
contains the PID of Network Information Table (NIT) packets.
Any change inside the transmitted programs has to be described in an updated
PAT version.
PAT is divided in 255 sections to minimize the data loss. Each section
transports part of the totality of PAT. If one packet is lost or there are error bits
in a small section of the PAT, we can decode the other sections.
• Program Map Table (PMT)
The PMT table lists elementary streams making up each program with
its PID's.
MPEG-2 requires at least, an identification of the program: program number,
formats of streams, PID of the PCR, Elementary Streams and PID of the
program.
When more information is needed, it is possible to use descriptors. The
PMT always is without encryption.
• Conditional Access Table (CAT)
CAT is a service that allows the broadcasters to restrict some contents
and to prevent unauthorized use.
DVB-T measurements with PROMAX TV EXPLORER II+ and analysis of DVB
transport streams 19
19
It also denies the access of general users to private content, and
provides the necessary protocols and systems to access users’ ability to play a
program. For example, CAT is used in pay-per-view or interactive features.
MPEG only establishes the data structure; the details will depend on the
encrypted system used.
In any TS with one or more encrypted ES, a detailed CAT table has to be within
the TS.
CAT provides details of the scrambling system in use and provides the
PID values of TS packets that contain the CA information.
The PID 0x0001 is for TS packets that contain CAT information.
• Network Information Table (NIT)
Contents are private, specified by the broadcaster. NIT contains
information about the physical network that carries the TS. Like maps of the
services with TS identifiers, channel frequencies, features of the modulation,
service name, etc.
PID of the TS packets with NIT information is 0x0010. Also this table
contains the private stream information too. For example, TeleText and
subtitles.
Descriptors
If the information conveyed by the PSI tables is not enough descriptors are
used. Descriptors are a set of syntactic structures transmitting the additional data.
There are a lot of descriptors, each directed to one type of information. The location of
them is always within one loop section, although it is used in private sections too.
20 Anna Arias
7.3 ELEMENTARY STREAM
7.3.1 Image codification
To make a video ES starts with the compression of images. Compression of
data is defined as the reducing process of a quantity of necessary data to effectively
represent information, in this case an image.
This is based on the reduction of spatial redundancy and irrelevance of images.
So, images have the common characteristic that the nearest pixels are correlated.
There are three ways to reduce data: elimination of redundant code, elimination
of redundant pixels and elimination of visual redundancy (information that no one can
perceive).
It is possible to compress with loss of data or without loss data. The first one
gives a higher compression factor than the other.
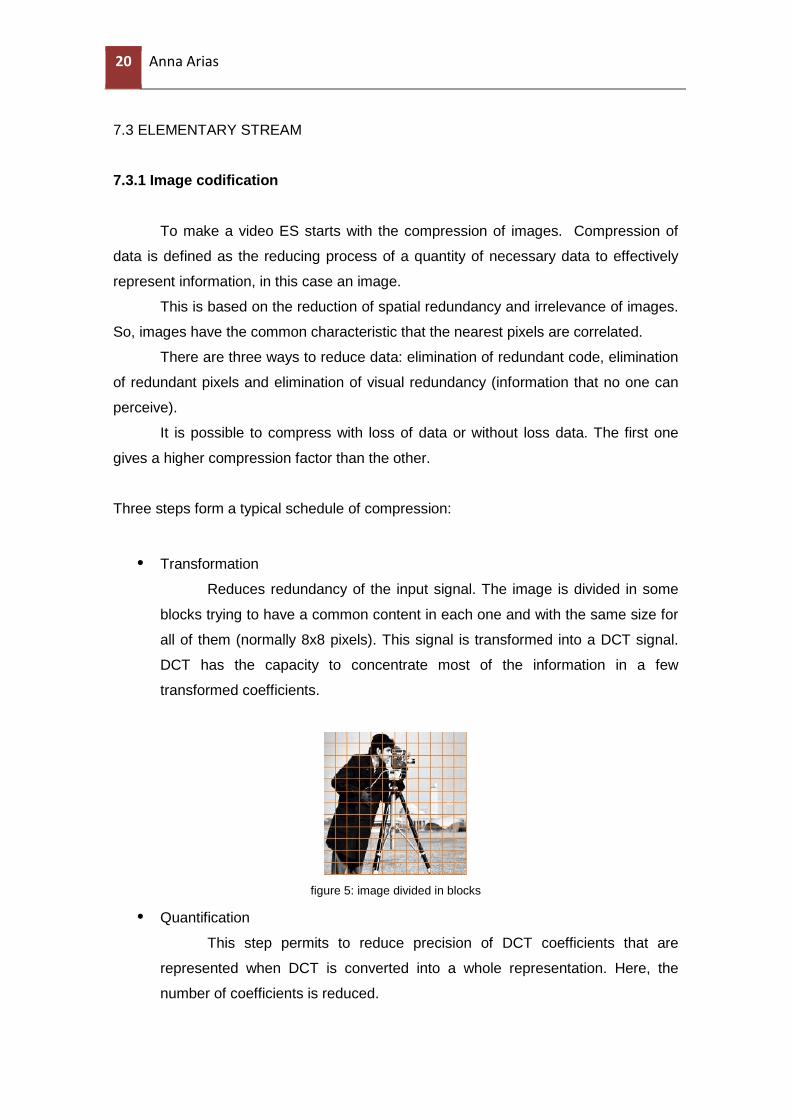
Three steps form a typical schedule of compression:
• Transformation
Reduces redundancy of the input signal. The image is divided in some
blocks trying to have a common content in each one and with the same size for
all of them (normally 8x8 pixels). This signal is transformed into a DCT signal.
DCT has the capacity to concentrate most of the information in a few
transformed coefficients.
figure 5: image divided in blocks
• Quantification
This step permits to reduce precision of DCT coefficients that are
represented when DCT is converted into a whole representation. Here, the
number of coefficients is reduced.

DVB-T measurements with PROMAX TV EXPLORER II+ and analysis of DVB
transport streams 21
21
The Bit rate is controlled by varying the steps of the quantification of the
coefficients of the transformed image. The human eye is more sensitive to low
frequencies than to high frequencies.
figure 6: example of quantification
• Entropic codification
This codification is used to codify quantified coefficients. It is calculated
with the number of bits per used symbol and uses three kinds of codification:
Zig-zag reader + RLE, DPCM and VLC.
The reading method used is zig-zag. This one reads the matrix symbols
in a zig-zag manner.
The zig-zag reading permits that consecutive zeros can be codified
efficiently through Run Length Encoding (RLE).
figure 7: zig zag reader
RLE compression keeps the symbol value and counts how many equal
symbols there are consecutively. It generates a sequence of values where a
number of symbols and symbols are contained.
Example:
Original sequence: (1,1,8,8,8,8,8,2,2,2,4,4,4,1,3)
RLE codification: [(2,1),(5,8)(3,2)(3,4)(1,1)(1,3)]
22 Anna Arias
DPCM codifies the difference between a value and the previous one.
The difference between both is minimum.
VLC assigns code words of variable length of bits for each symbol to
their likelihood of appearing in the sequence to send. Symbols, which are more
likely to appear, they are codified with less numbers of bits and vice verse.
7.3.2 Video codification
Video is a consecution of images. Images are commonly very similar to
previous or next ones. Video sequences present a high temporal redundancy. Video
algorithms of compression do difference operation to try to identify temporal
redundancy to codify just the difference between images.
A simple prediction of pixels to pixels doesn’t give a good result normally,
because it is ineffective.
Therefore movement prediction is used, frame prediction of video sequence
made through partitions of an image that contain several pixels. Estimation of pixels is
based in level treatment of macroblocks.
To get the correct vector movement block matching is used. This gives the
vector to apply to each macroblock of the image to find position that gives the minimum
difference.
Predict movement implies that one macroblock in a predicted image is always
referenced to another image.
Depending on the position of the reference image with a regard to the image to be
encoded, there are three kinds of prediction:
• Backward
Prediction of each macroblock takes reference in the later frame.
• Forward
Prediction of each macroblock takes reference in the previous frame.

DVB-T measurements with PROMAX TV EXPLORER II+ and analysis of DVB
transport streams 23
23
• Bidirectional
Prediction of each macroblock is done using values of the previous and
later frame.
If consecutive frames don’t have any temporal redundancy, the frame to encode
is just processed like an image, looking for space redundancy.
Compression standards of video use type of images to compress data. Instead
of coding each picture that form video, it is possible to codify an image totally and later
codify differences between this one and next ones.
For example, in video sequence with a fixed plane, can be codified just the
parts with movement, winning capacity of compression.
Frames of a sequence can be I, P or B, depending the kind of prediction used in
each case.
• Image I
They are used to decode other images that compose video. Normally
these need more space than the others. Just take profit of the space
redundancy in its codification. Give random access inside the sequence. And
can be used to predict P and B images.
• Images P
They are predicted referenced an image that can be I or P before in
time. Needing previous decoding of the reference image. Accumulates errors.
• Images B
They are predicted with the reference of two images that can be I o P.
Needing the previous decoding of both images.
24 Anna Arias
Example:
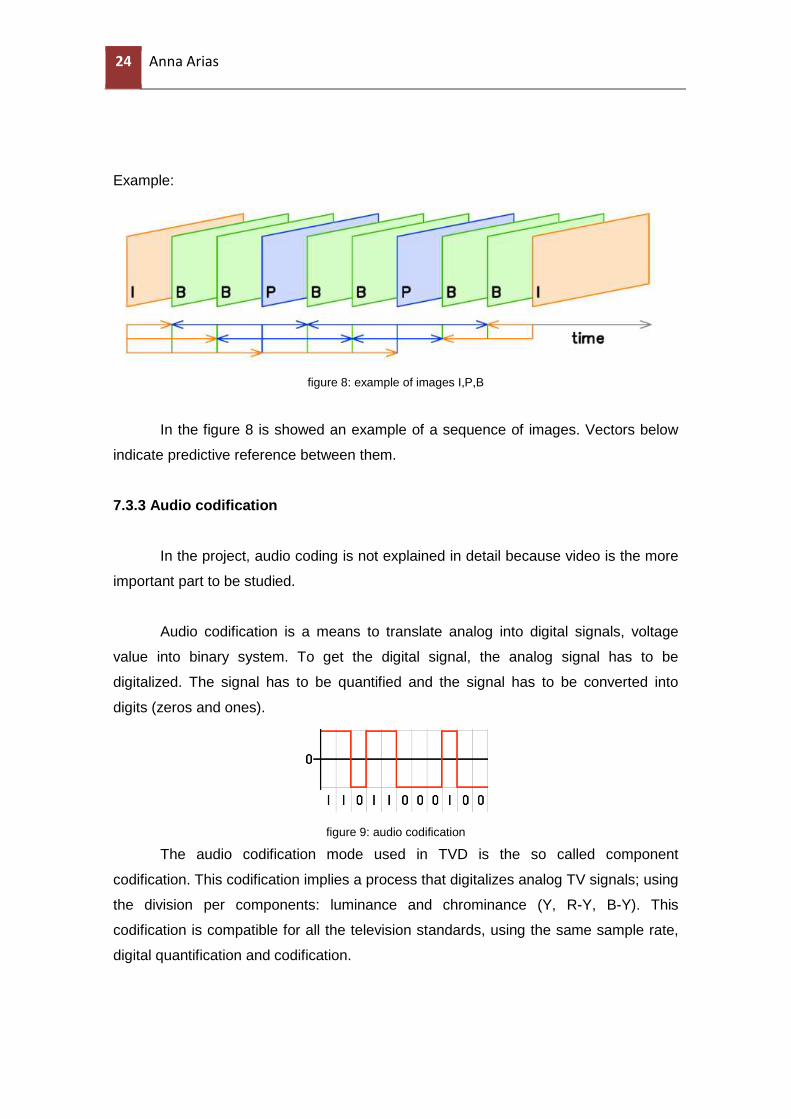
figure 8: example of images I,P,B
In the figure 8 is showed an example of a sequence of images. Vectors below
indicate predictive reference between them.
7.3.3 Audio codification
In the project, audio coding is not explained in detail because video is the more
important part to be studied.
Audio codification is a means to translate analog into digital signals, voltage
value into binary system. To get the digital signal, the analog signal has to be
digitalized. The signal has to be quantified and the signal has to be converted into
digits (zeros and ones).
figure 9: audio codification
The audio codification mode used in TVD is the so called component
codification. This codification implies a process that digitalizes analog TV signals; using
the division per components: luminance and chrominance (Y, R-Y, B-Y). This
codification is compatible for all the television standards, using the same sample rate,
digital quantification and codification.
DVB-T measurements with PROMAX TV EXPLORER II+ and analysis of DVB
transport streams 25
25
7.4 MPEG 2 STANDARD
MPEG 2 standardizes several processes related with encoding image:
hierarchy, scalability and levels and profiles.
7.4.1 Hierarchy
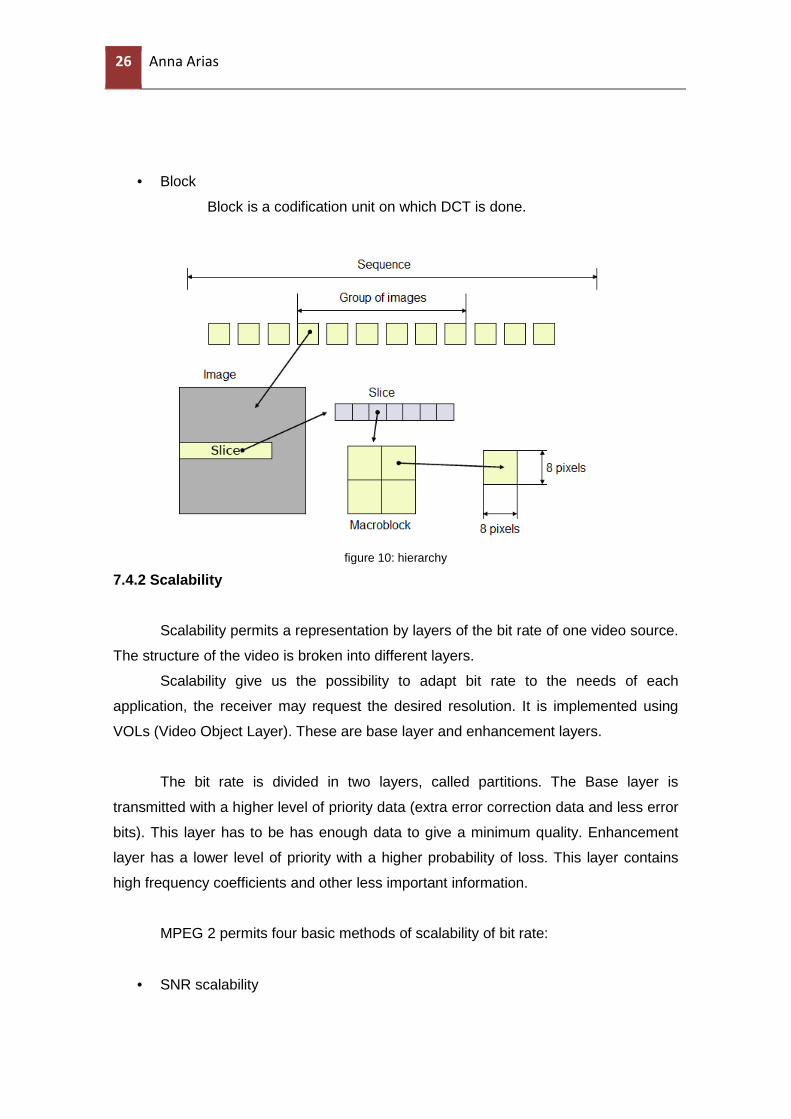
Video elementary stream is organized in those hierarchies groups:
• Sequence
Is formed by one or more image groupe. In its header it defines
dimension of images, image frequency, buffer size and ratio aspect of pixels.
• Image Group
Images that can be transmitted in different order than the order have to
be showed. The first one always is an I image.
• Picture
Picture is a unit that contains luminance and the two components of
chrominance.
The header defines if it is an image I, P or B, the value maxim and
minimum of value of movement vectors and its position within the image group.
• Slice
Slice is a basic resynchronization unit of the system, a point to recover
against errors. The decoder can reject a corrupt slice and continue with the next
one. The number of slices can vary between one per picture to one per
macroblock, depending error protection against noise selected.
• Macroblock
Macroblock is the basic unit where movement compensation is made.
The header gives information about the kind of codification used in the
macroblock, scale of quantifier and vector movement.
26 Anna Arias
• Block
Block is a codification unit on which DCT is done.
figure 10: hierarchy
7.4.2 Scalability
Scalability permits a representation by layers of the bit rate of one video source.
The structure of the video is broken into different layers.
Scalability give us the possibility to adapt bit rate to the needs of each
application, the receiver may request the desired resolution. It is implemented using
VOLs (Video Object Layer). These are base layer and enhancement layers.
The bit rate is divided in two layers, called partitions. The Base layer is
transmitted with a higher level of priority data (extra error correction data and less error
bits). This layer has to be has enough data to give a minimum quality. Enhancement
layer has a lower level of priority with a higher probability of loss. This layer contains
high frequency coefficients and other less important information.
MPEG 2 permits four basic methods of scalability of bit rate:
• SNR scalability
DVB-T measurements with PROMAX TV EXPLORER II+ and analysis of DVB
transport streams 27
27
The different layers are coded at identical sample rates, but with
different picture quality.
• Spatial scalability
This scalability is based on coding base layer in lower sampling
dimensions than enhancement layers.
• Temporal scalability
Video is coded with a lower frame rate. The enhancement layers can do
a reconstruction as prediction, to improve the quality of the video.
• Data Partitioning
This scalability consist of break the block of 64 quantized transform
coefficient into two bit streams: The base layer, with the critical lower
frequencies, and the enhancements layers, with the higher frequency data.
7.4.3 Levels and profiles
To provide a definition of a unique codification standard was impossible; the
majority of the applications should use a little subset of offered possibilities by the
standard. Because of that MPEG took the decision to make a standard of data
transmission composed of a set of profiles and levels so as to satisfy the specific
requirements of the applications.
The profile is basically the degree of complexity expected in the encoder. The
level is a set of parameters, like the size of the image or the bit rate used in this profile.
Levels indicate vertical and horizontal resolution of the image.

28 Anna Arias
figure 11: levels and profiles
7.5 DVB-SI
Digital Video Broadcasting-Service Information is a normatively defined. It is a
standard of data transmission in DTV emissions. This information service gives
facilities about the navigation within DVB to the user.
DVB-SI works on MPEG-2, complementing Program Specific Information. DVB
adds information that helps to tune particular services or to show interesting programs.
Necessary elements to develop Electronic Guide Program are given by DVB-SI.
DVB-SI basically consists of four information service tables and a set of
additional tables. The next four ones are the principals:
• NIT
The Network Information Table is specified by DVB. On MPEG 2, NIT
was defined but the content was not specified. Necessary information is
exposed in NIT to syntonize channels of a service provider.
• SDT
The Service Description Table describes services that are part of a TS.
There is always one SDT per TS. In the SDT, the parameters associated to
every service are listed. Like e.g. name of the service, service identifier and
service status.
• EIT
DVB-T measurements with PROMAX TV EXPLORER II+ and analysis of DVB
transport streams 29
29
The Event Information Table gives information about the event; grouping
all present and future events that will be contained in MPEG multiplex. EIT
provides information like e.g. starting times.
• TDT
The Time of date and table gives information about present time and
date.
• TOT
The Time offset tables transmit the actual date and hour according to the
UTC. It also transmits information about local time difference. The transmission
of TOT is optional, but if it is transmitted it must happen at least every 30
seconds.
The following tables are the additional ones:
• BAT
The Bouquet Association Table could be helpful for the IRD, to show the
available services in a user friendly way.
• ST
The Stuffing Table is used to invalidate non-existent sections.
• RST
The Running Status Table permits to update the status of an event (if it
is running or not) when there are unexpected problems in the programming.
• DIT
The DIT is used when the bit stream is finite. It is inserted where the SI
information could have discontinuities.
• SIT
The Selection Information Table is just used when the bit streams are
finite. It transports a summary of SI information required to describe the streams
within finite bit streams.
30 Anna Arias
7.6 MEASUREMENTS ON THE DIGITAL SIGNAL
These measurements are used to measure the quality of the signal that arrives to
the receiver.
• BER
Bit Error Ratio is the main parameter describing transmission quality. It
is defined as the ratio between the number of erroneous bits and the number of
total bits transmitted.
• CBER
BER before Reed Solomon decoder. The error bits of a TS packet would
be estimated comparing errors bits before and after Reed Solomon decoding.
If BER value is higher than 10-3, the measurement is no reliable.
Quasi error free corresponds to the value before Viterbi decoder. BER of
7x10⁻² to 7x10⁻³, depending on the convolution code chosen.
• VBER
BER after Viterbi decoder. This measure is made after Viterbi decoder.
These errors must have a value between 7x10⁻² and 10-5. Outside these ranges
the measurement has no reliability.
QEF in Viterbi decoder output is 2x10⁻⁴.
• MER
DVB-T measurements with PROMAX TV EXPLORER II+ and analysis of DVB
transport streams 31
31
Measurement done on the symbols of the modulations type QAM to
check that the constellation diagram will have an acceptable form. This is really
useful when it is impossible to show the diagram because it gives a value of the
error number bits.
Graphically, MER can be defined as the difference between the ideal
constellation and the constellation received.
• N (Level Noise)
The received noise power is the total interference power present in a
system, when the information signal of the power is erased.
• C (Power)
To do the measure of the channel power, the bandwidth of the
modulated signal has to be defined. The equipment, which measures the
average received modulated carrier power, integrates the carrier in the whole
bandwidth.
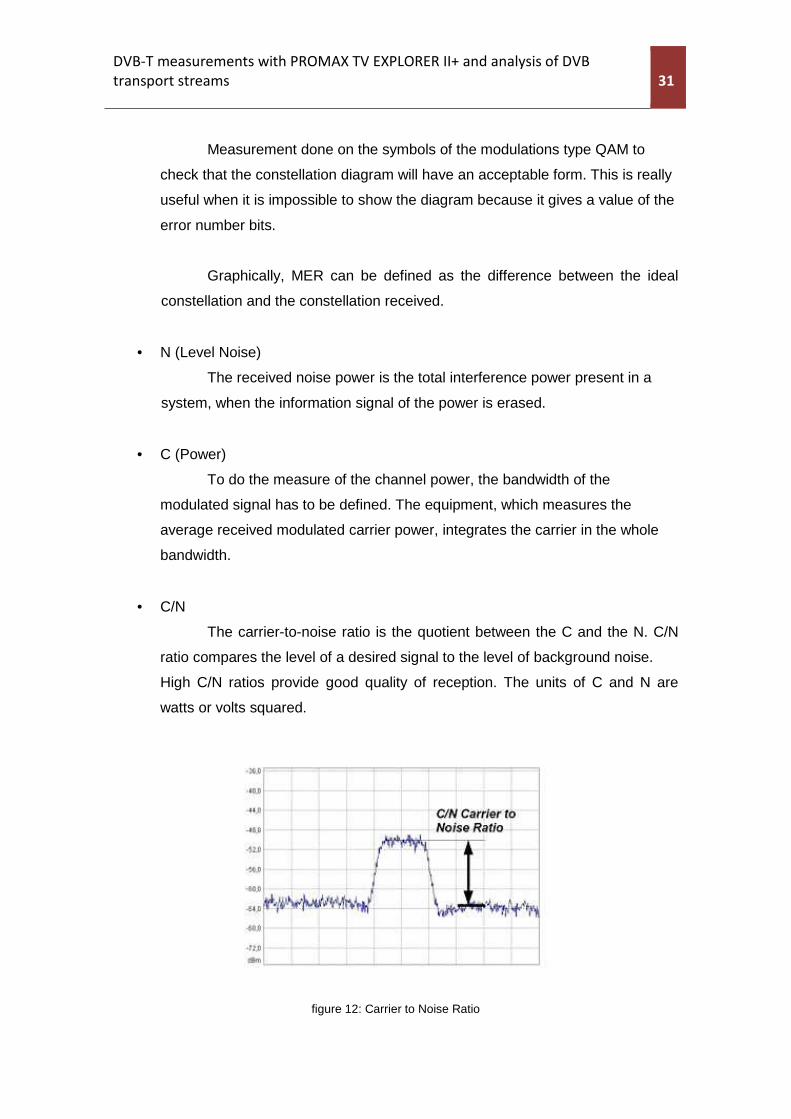
• C/N
The carrier-to-noise ratio is the quotient between the C and the N. C/N
ratio compares the level of a desired signal to the level of background noise.
High C/N ratios provide good quality of reception. The units of C and N are
watts or volts squared.
figure 12: Carrier to Noise Ratio

32 Anna Arias
7.7 ERROR-CORRECTING ALGORITHMS
Viterbi algorithm
Andrew Viterbi designed the Viterbi algorithm in 1967. The Viterbi algorithm is a
technique to decode convolutional codes.
The information is convoluted before it is transmitted by the channel. Because
the messages are convoluted, the messages have redundant information into the
transmitted signal. This redundant information helps correcting errors.
The algorithm can find the most probable sequence of states in a Hidden
Markov Model. From a sample, the algorithm obtains the optimal sequence that best
explains the sequence of samples.
Reed Solomon algorithm
Reed Solomon algorithm is used to correct errors in digital transmissions.
This code forms part of the Forward error codes. This means that the errors are
corrected in the receiver.
The algorithm uses redundancy bits to correct the errors. In DVB the algorithm
introduces 16 bits in each packet of the transport stream (188,204). This permits to
correct 8 error bits of each packet.
DVB-T measurements with PROMAX TV EXPLORER II+ and analysis of DVB
transport streams 33
33
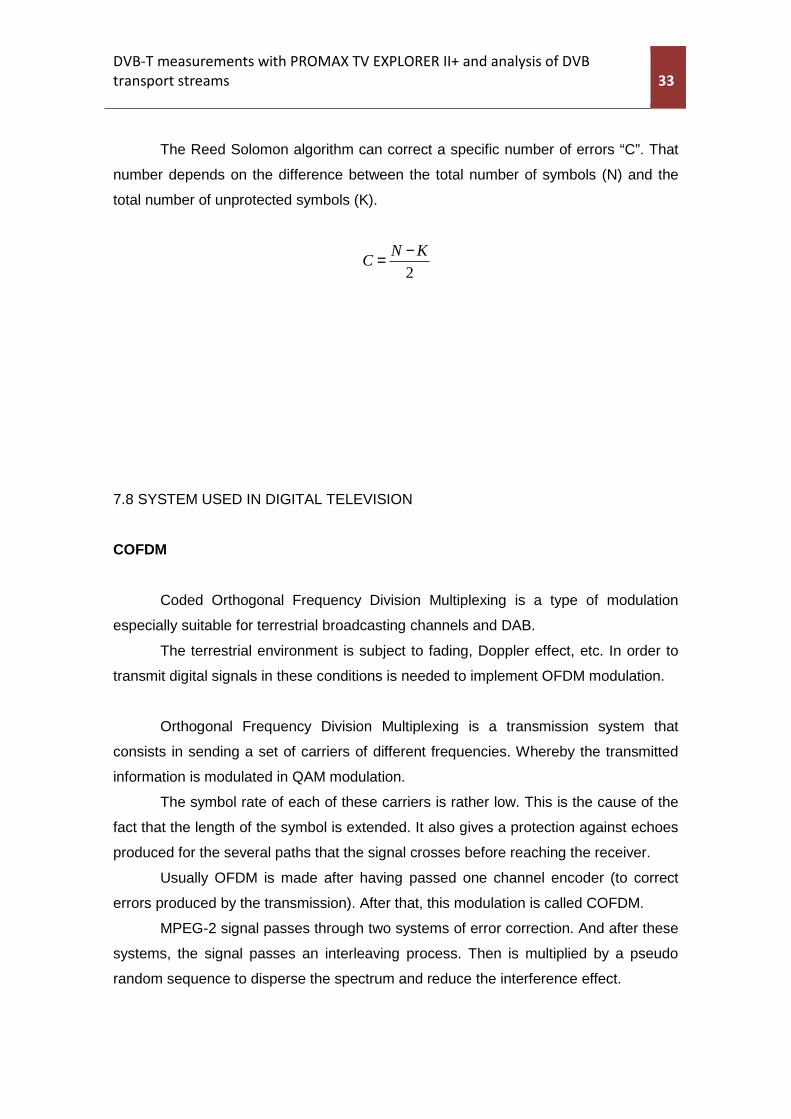
The Reed Solomon algorithm can correct a specific number of errors “C”. That
number depends on the difference between the total number of symbols (N) and the
total number of unprotected symbols (K).
C = N − K
2
7.8 SYSTEM USED IN DIGITAL TELEVISION
COFDM
Coded Orthogonal Frequency Division Multiplexing is a type of modulation
especially suitable for terrestrial broadcasting channels and DAB.
The terrestrial environment is subject to fading, Doppler effect, etc. In order to
transmit digital signals in these conditions is needed to implement OFDM modulation.
Orthogonal Frequency Division Multiplexing is a transmission system that
consists in sending a set of carriers of different frequencies. Whereby the transmitted
information is modulated in QAM modulation.
The symbol rate of each of these carriers is rather low. This is the cause of the
fact that the length of the symbol is extended. It also gives a protection against echoes
produced for the several paths that the signal crosses before reaching the receiver.
Usually OFDM is made after having passed one channel encoder (to correct
errors produced by the transmission). After that, this modulation is called COFDM.
MPEG-2 signal passes through two systems of error correction. And after these
systems, the signal passes an interleaving process. Then is multiplied by a pseudo
random sequence to disperse the spectrum and reduce the interference effect.
34 Anna Arias
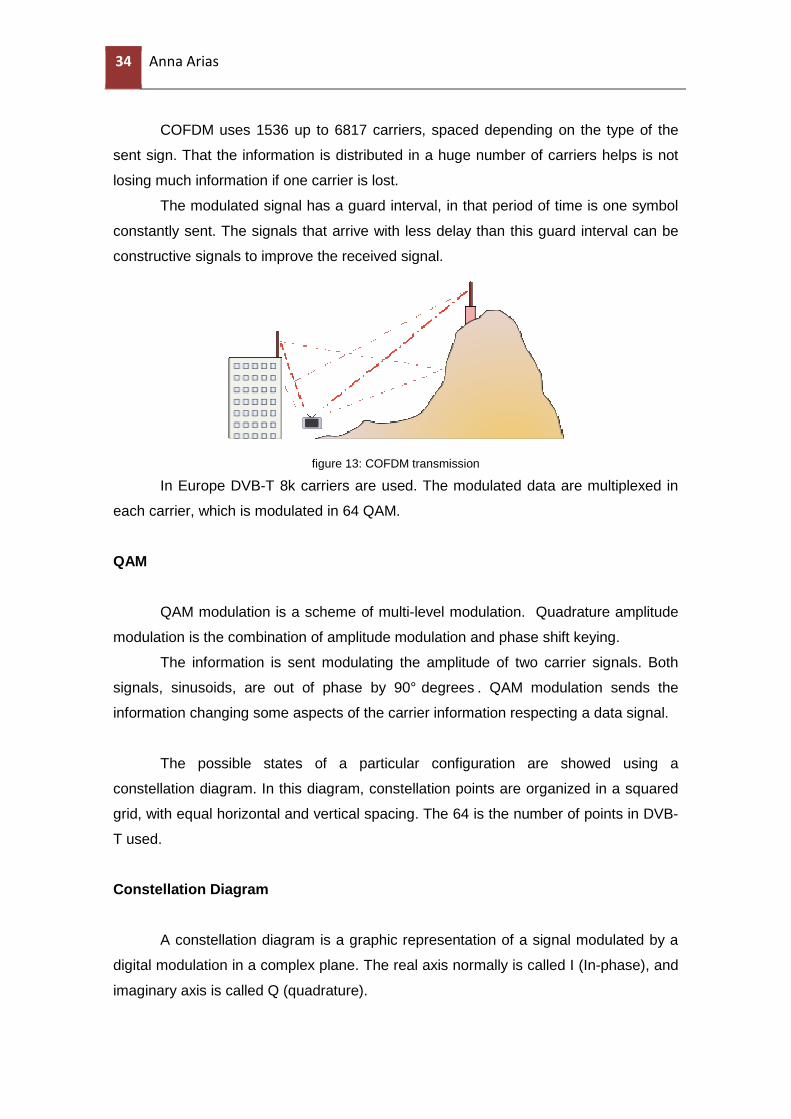
COFDM uses 1536 up to 6817 carriers, spaced depending on the type of the
sent sign. That the information is distributed in a huge number of carriers helps is not
losing much information if one carrier is lost.
The modulated signal has a guard interval, in that period of time is one symbol
constantly sent. The signals that arrive with less delay than this guard interval can be
constructive signals to improve the received signal.
figure 13: COFDM transmission
In Europe DVB-T 8k carriers are used. The modulated data are multiplexed in
each carrier, which is modulated in 64 QAM.
QAM
QAM modulation is a scheme of multi-level modulation. Quadrature amplitude
modulation is the combination of amplitude modulation and phase shift keying.
The information is sent modulating the amplitude of two carrier signals. Both
signals, sinusoids, are out of phase by 90° degrees . QAM modulation sends the
information changing some aspects of the carrier information respecting a data signal.
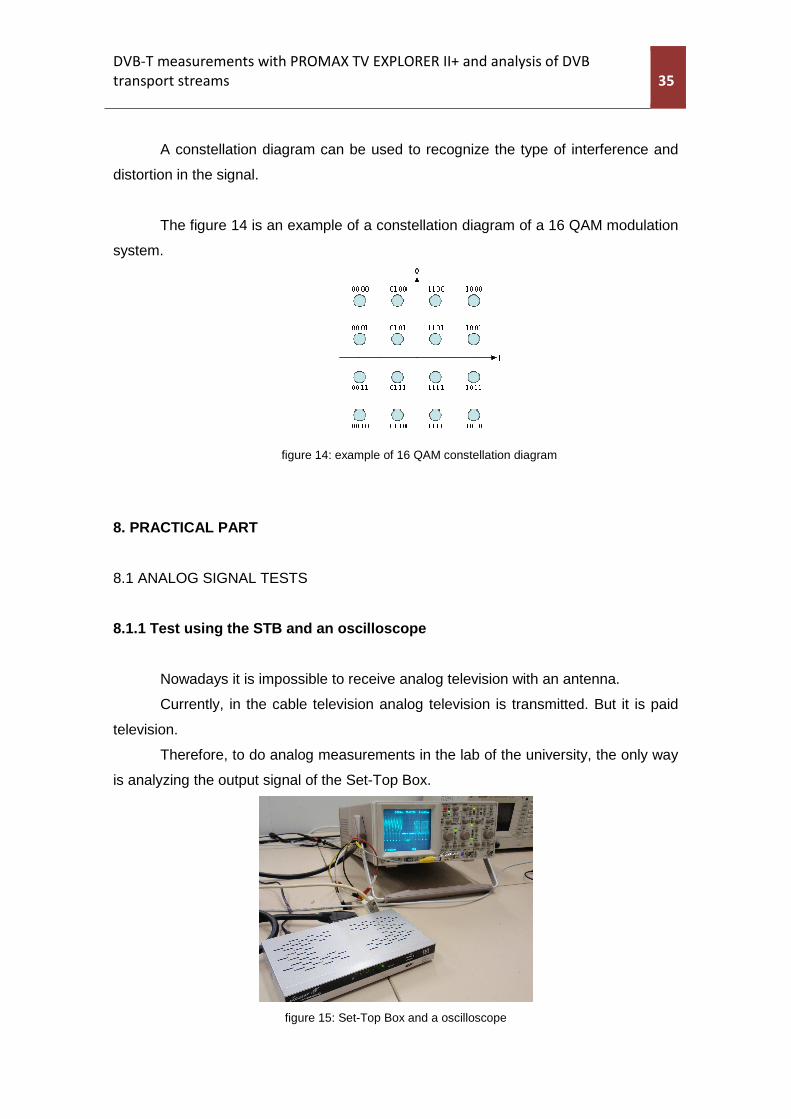
The possible states of a particular configuration are showed using a
constellation diagram. In this diagram, constellation points are organized in a squared
grid, with equal horizontal and vertical spacing. The 64 is the number of points in DVB-
T used.
Constellation Diagram
A constellation diagram is a graphic representation of a signal modulated by a
digital modulation in a complex plane. The real axis normally is called I (In-phase), and
imaginary axis is called Q (quadrature).
DVB-T measurements with PROMAX TV EXPLORER II+ and analysis of DVB
transport streams 35
35
A constellation diagram can be used to recognize the type of interference and
distortion in the signal.
The figure 14 is an example of a constellation diagram of a 16 QAM modulation
system.
figure 14: example of 16 QAM constellation diagram
8. PRACTICAL PART
8.1 ANALOG SIGNAL TESTS
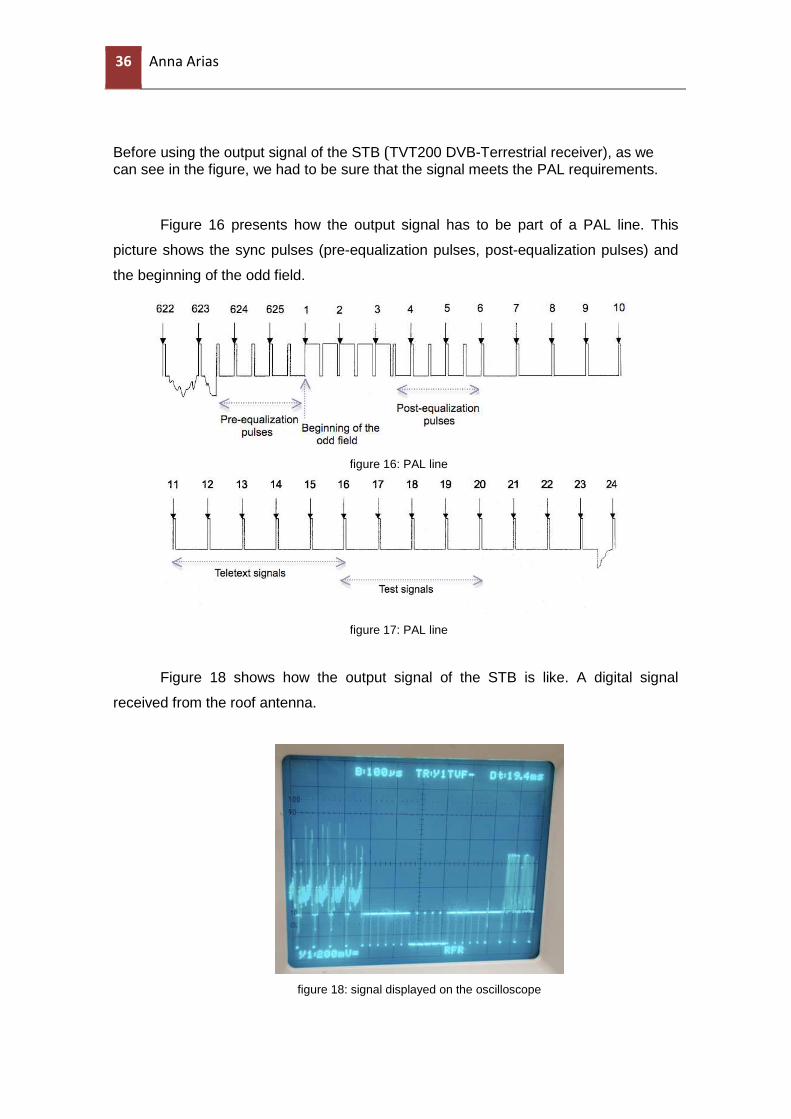
8.1.1 Test using the STB and an oscilloscope
Nowadays it is impossible to receive analog television with an antenna.
Currently, in the cable television analog television is transmitted. But it is paid
television.
Therefore, to do analog measurements in the lab of the university, the only way
is analyzing the output signal of the Set-Top Box.
figure 15: Set-Top Box and a oscilloscope
36 Anna Arias
Before using the output signal of the STB (TVT200 DVB-Terrestrial receiver), as we can see in the figure, we had to be sure that the signal meets the PAL requirements.
Figure 16 presents how the output signal has to be part of a PAL line. This
picture shows the sync pulses (pre-equalization pulses, post-equalization pulses) and
the beginning of the odd field.
figure 16: PAL line
figure 17: PAL line
Figure 18 shows how the output signal of the STB is like. A digital signal
received from the roof antenna.
figure 18: signal displayed on the oscilloscope
DVB-T measurements with PROMAX TV EXPLORER II+ and analysis of DVB
transport streams 37
37
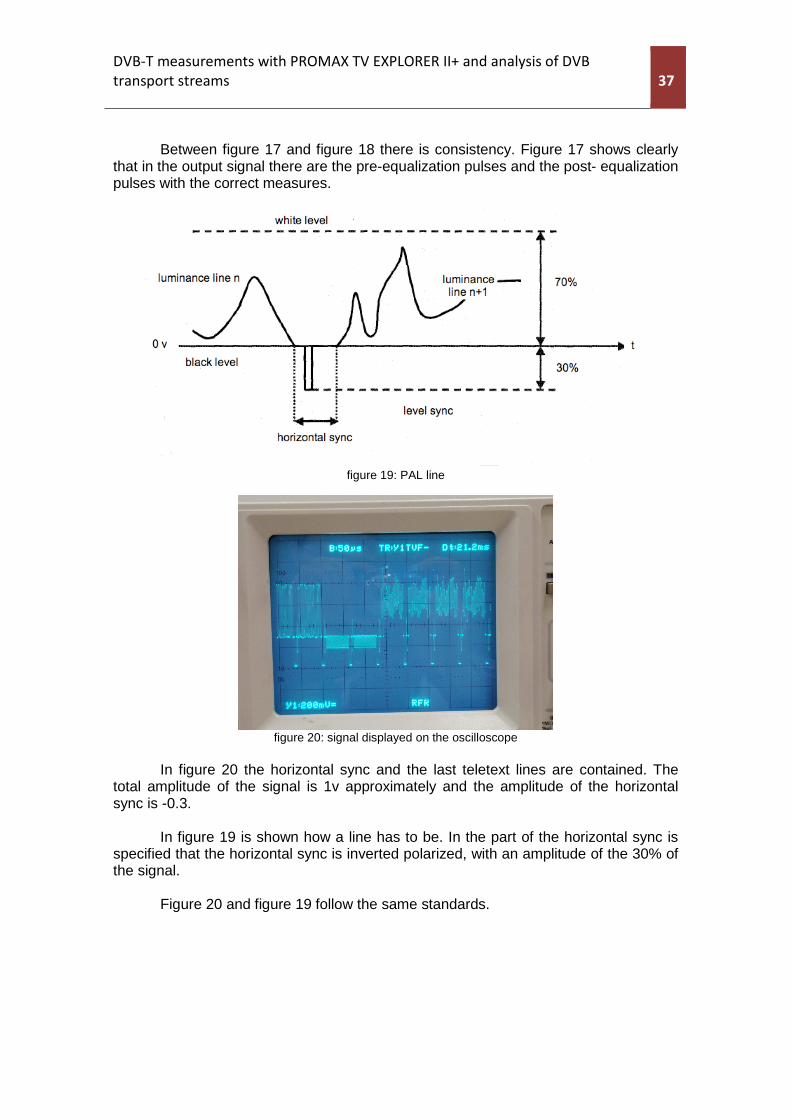
Between figure 17 and figure 18 there is consistency. Figure 17 shows clearly that in the output signal there are the pre-equalization pulses and the post- equalization pulses with the correct measures.
figure 19: PAL line
figure 20: signal displayed on the oscilloscope
In figure 20 the horizontal sync and the last teletext lines are contained. The
total amplitude of the signal is 1v approximately and the amplitude of the horizontal sync is -0.3.
In figure 19 is shown how a line has to be. In the part of the horizontal sync is
specified that the horizontal sync is inverted polarized, with an amplitude of the 30% of the signal.
Figure 20 and figure 19 follow the same standards.
38 Anna Arias
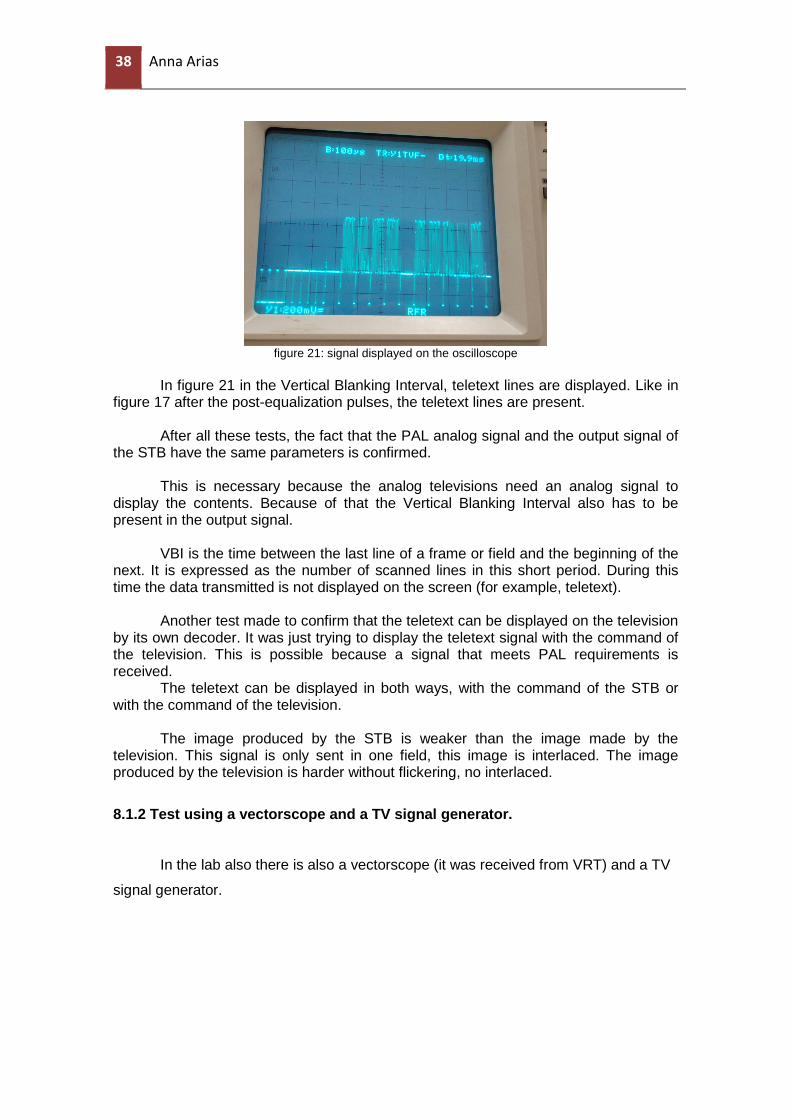
figure 21: signal displayed on the oscilloscope
In figure 21 in the Vertical Blanking Interval, teletext lines are displayed. Like in
figure 17 after the post-equalization pulses, the teletext lines are present.
After all these tests, the fact that the PAL analog signal and the output signal of the STB have the same parameters is confirmed.
This is necessary because the analog televisions need an analog signal to
display the contents. Because of that the Vertical Blanking Interval also has to be present in the output signal.
VBI is the time between the last line of a frame or field and the beginning of the next. It is expressed as the number of scanned lines in this short period. During this time the data transmitted is not displayed on the screen (for example, teletext).
Another test made to confirm that the teletext can be displayed on the television
by its own decoder. It was just trying to display the teletext signal with the command of the television. This is possible because a signal that meets PAL requirements is received.
The teletext can be displayed in both ways, with the command of the STB or with the command of the television.
The image produced by the STB is weaker than the image made by the
television. This signal is only sent in one field, this image is interlaced. The image produced by the television is harder without flickering, no interlaced.
8.1.2 Test using a vectorscope and a TV signal generator.
In the lab also there is also a vectorscope (it was received from VRT) and a TV
signal generator.
DVB-T measurements with PROMAX TV EXPLORER II+ and analysis of DVB
transport streams 39
39
figure 22: Vectorscope and TV signal generator
A vectorscope is a measure instrument used in television to see and measure
the colour component of the video signal.
A vectorscope displays an X-Y plot of two signals. That is why it is used to
represent the chrominance of the video signal.
The chrominance has two parameters, the colour saturation and the hue. The
Colour saturation is encoded as the subcarrier’s amplitude and the hue is encoded as
the subcarrier's phase.
The result is a vector, which has the origin in the centre of the screen. The
module as the saturation and the hue as phase represent this vector.
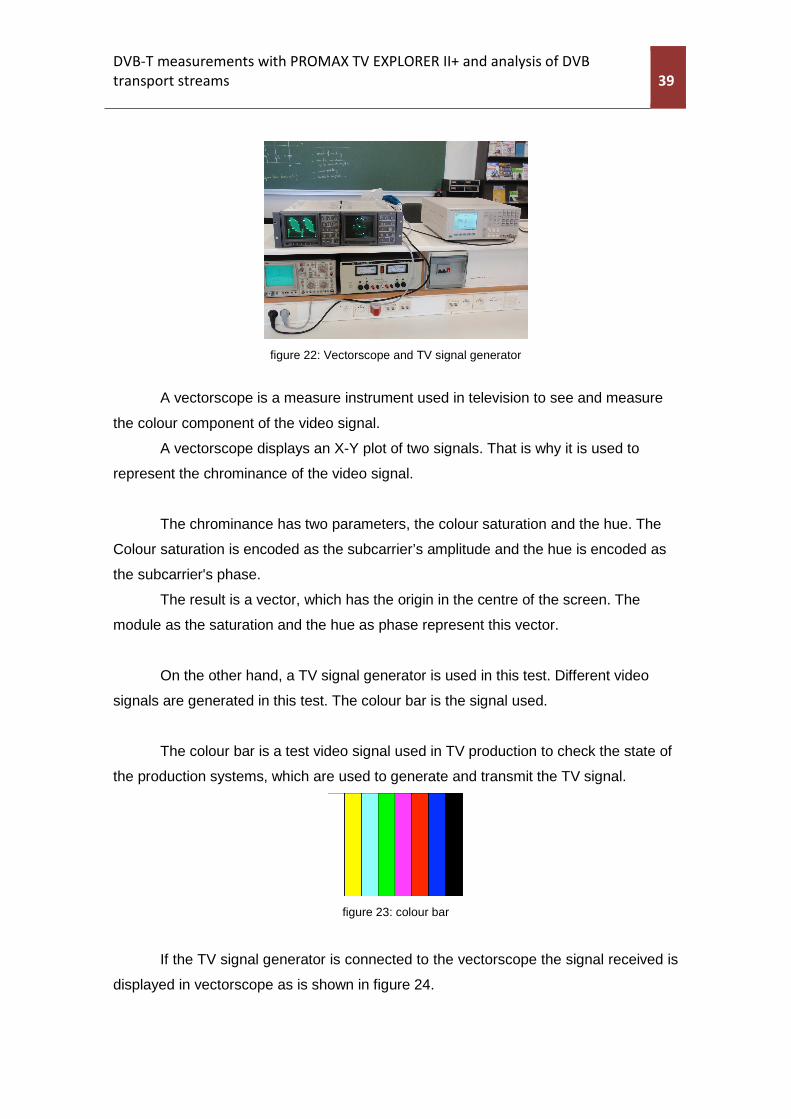
On the other hand, a TV signal generator is used in this test. Different video
signals are generated in this test. The colour bar is the signal used.
The colour bar is a test video signal used in TV production to check the state of
the production systems, which are used to generate and transmit the TV signal.
figure 23: colour bar
If the TV signal generator is connected to the vectorscope the signal received is
displayed in vectorscope as is shown in figure 24.
40 Anna Arias
figure 24: vectorscope displaying the colour bar.
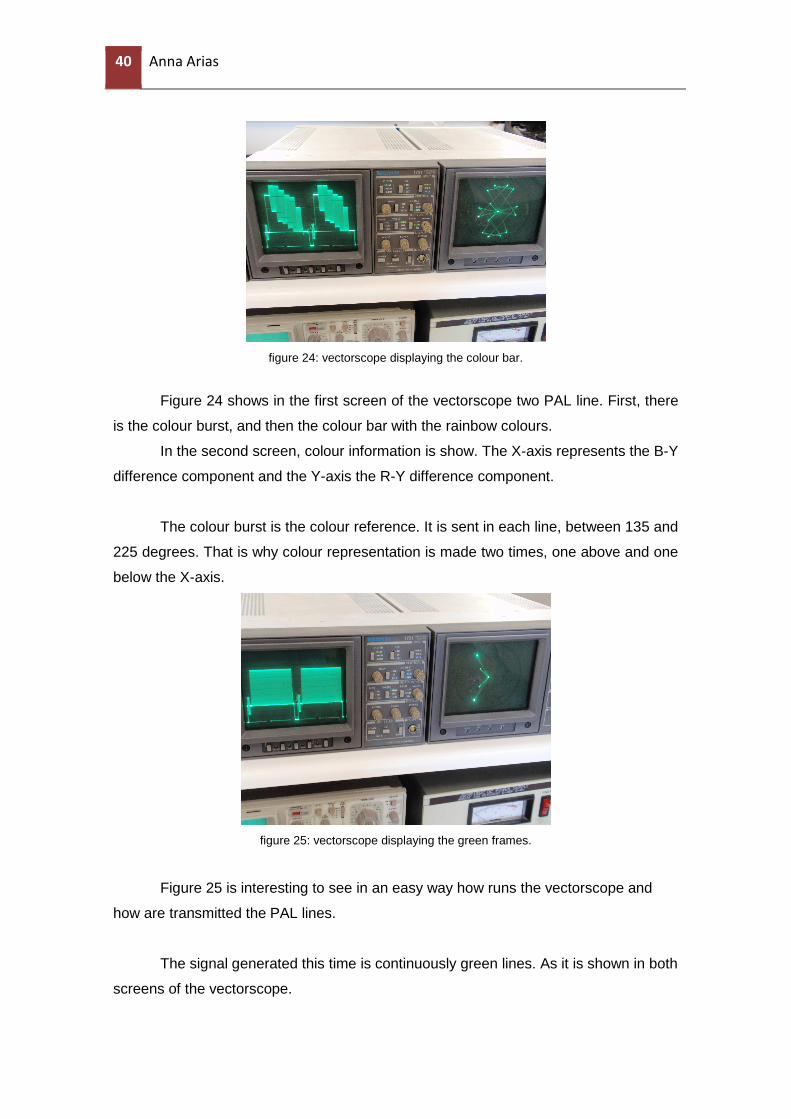
Figure 24 shows in the first screen of the vectorscope two PAL line. First, there
is the colour burst, and then the colour bar with the rainbow colours.
In the second screen, colour information is show. The X-axis represents the B-Y
difference component and the Y-axis the R-Y difference component.
The colour burst is the colour reference. It is sent in each line, between 135 and
225 degrees. That is why colour representation is made two times, one above and one
below the X-axis.
figure 25: vectorscope displaying the green frames.
Figure 25 is interesting to see in an easy way how runs the vectorscope and
how are transmitted the PAL lines.
The signal generated this time is continuously green lines. As it is shown in both
screens of the vectorscope.
DVB-T measurements with PROMAX TV EXPLORER II+ and analysis of DVB
transport streams 41
41
In the first screen the whole line is only one colour sent, the green colour. And
in the second screen there are just four vectors. The colour burst and the green colour.
8.2 EXPLANATION OF TSREADER SOFTWARE
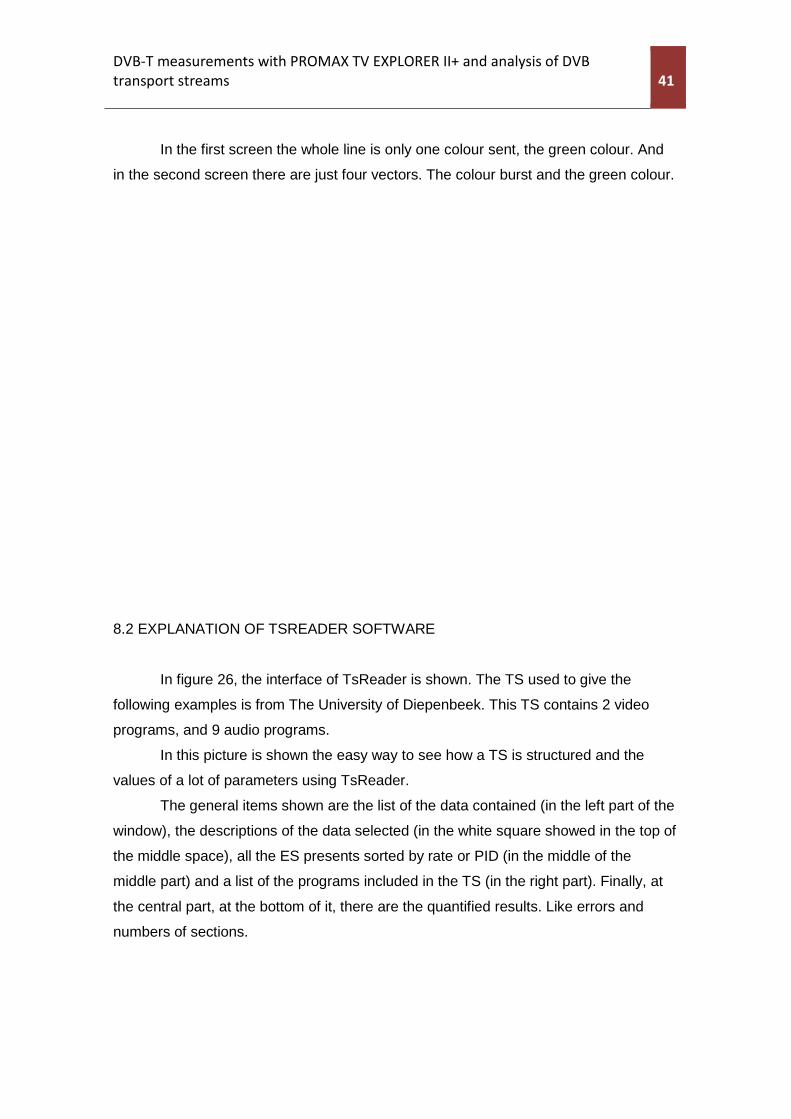
In figure 26, the interface of TsReader is shown. The TS used to give the
following examples is from The University of Diepenbeek. This TS contains 2 video
programs, and 9 audio programs.
In this picture is shown the easy way to see how a TS is structured and the
values of a lot of parameters using TsReader.
The general items shown are the list of the data contained (in the left part of the
window), the descriptions of the data selected (in the white square showed in the top of
the middle space), all the ES presents sorted by rate or PID (in the middle of the
middle part) and a list of the programs included in the TS (in the right part). Finally, at
the central part, at the bottom of it, there are the quantified results. Like errors and
numbers of sections.
42 Anna Arias
figure 26: TsReader interface
In figure 27, a radio program is selected. When a click is made above the PMT
of it, the composition of it is shown, giving some information: program number, the PID
of the PCR of this Program, PMT version, service name, format of the Streams that it
contains and the PID of the ES contained. When a PMT is selected in the list by rate of
the bit rate from ES contained in this program are selected (they take the blue colour).
DVB-T measurements with PROMAX TV EXPLORER II+ and analysis of DVB
transport streams 43
43
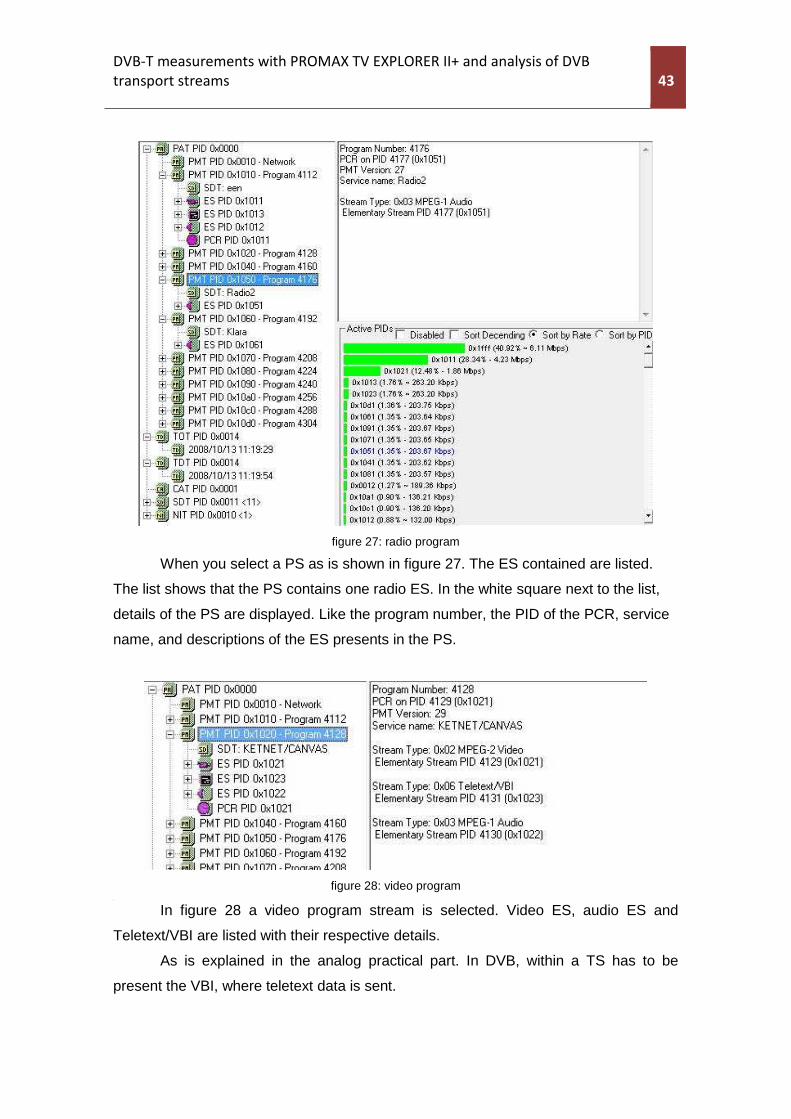
figure 27: radio program
When you select a PS as is shown in figure 27. The ES contained are listed.
The list shows that the PS contains one radio ES. In the white square next to the list,
details of the PS are displayed. Like the program number, the PID of the PCR, service
name, and descriptions of the ES presents in the PS.
figure 28: video program
1 In figure 28 a video program stream is selected. Video ES, audio ES and
Teletext/VBI are listed with their respective details.
As is explained in the analog practical part. In DVB, within a TS has to be
present the VBI, where teletext data is sent.
44 Anna Arias
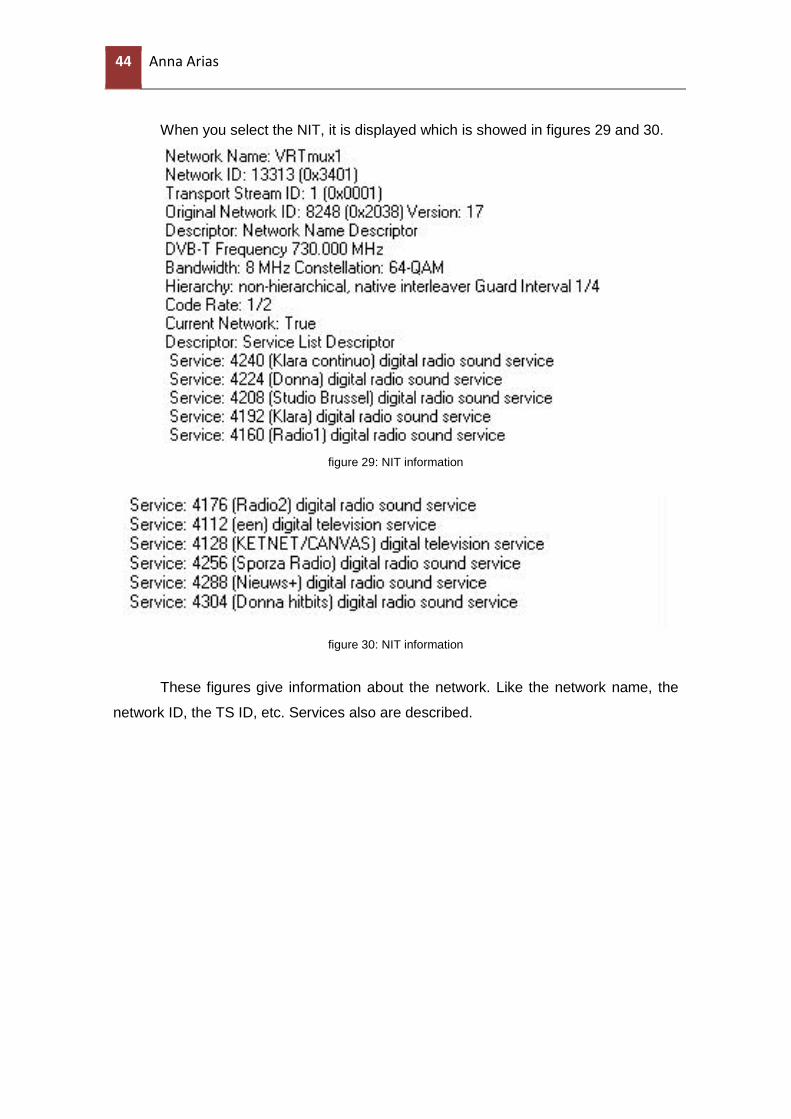
When you select the NIT, it is displayed which is showed in figures 29 and 30.
figure 29: NIT information
figure 30: NIT information
These figures give information about the network. Like the network name, the
network ID, the TS ID, etc. Services also are described.
DVB-T measurements with PROMAX TV EXPLORER II+ and analysis of DVB
transport streams 45
45
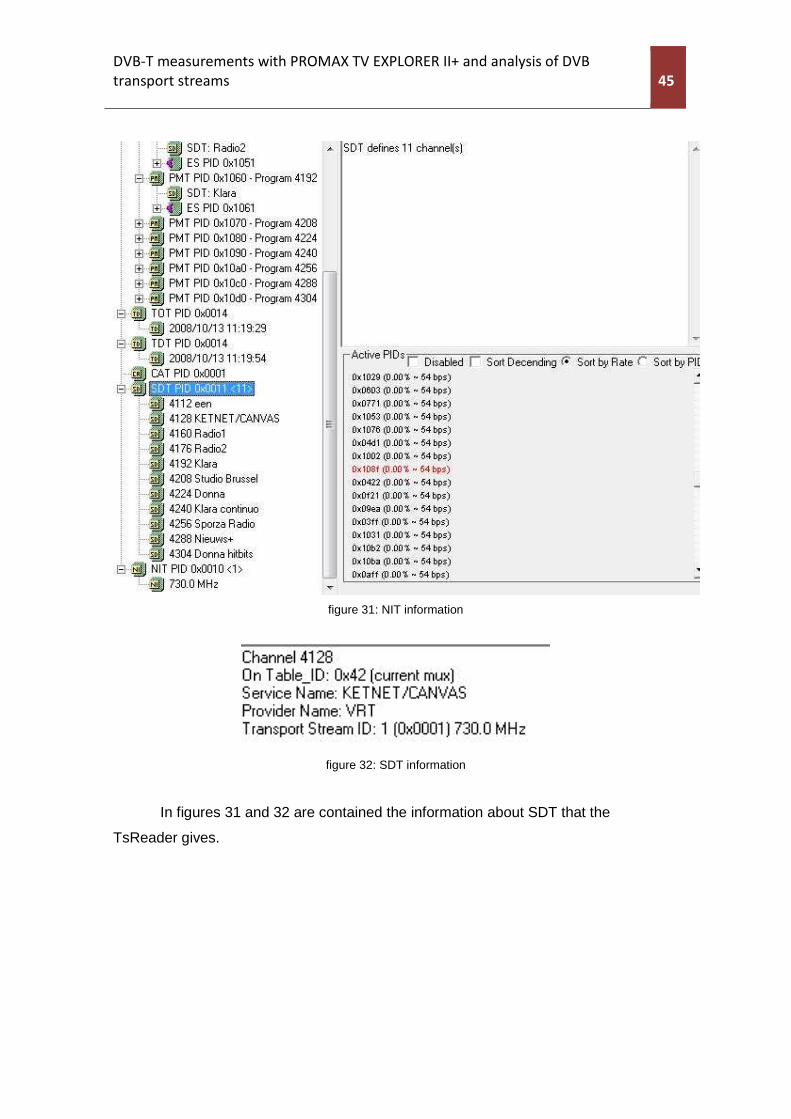
figure 31: NIT information
figure 32: SDT information
In figures 31 and 32 are contained the information about SDT that the
TsReader gives.
46 Anna Arias
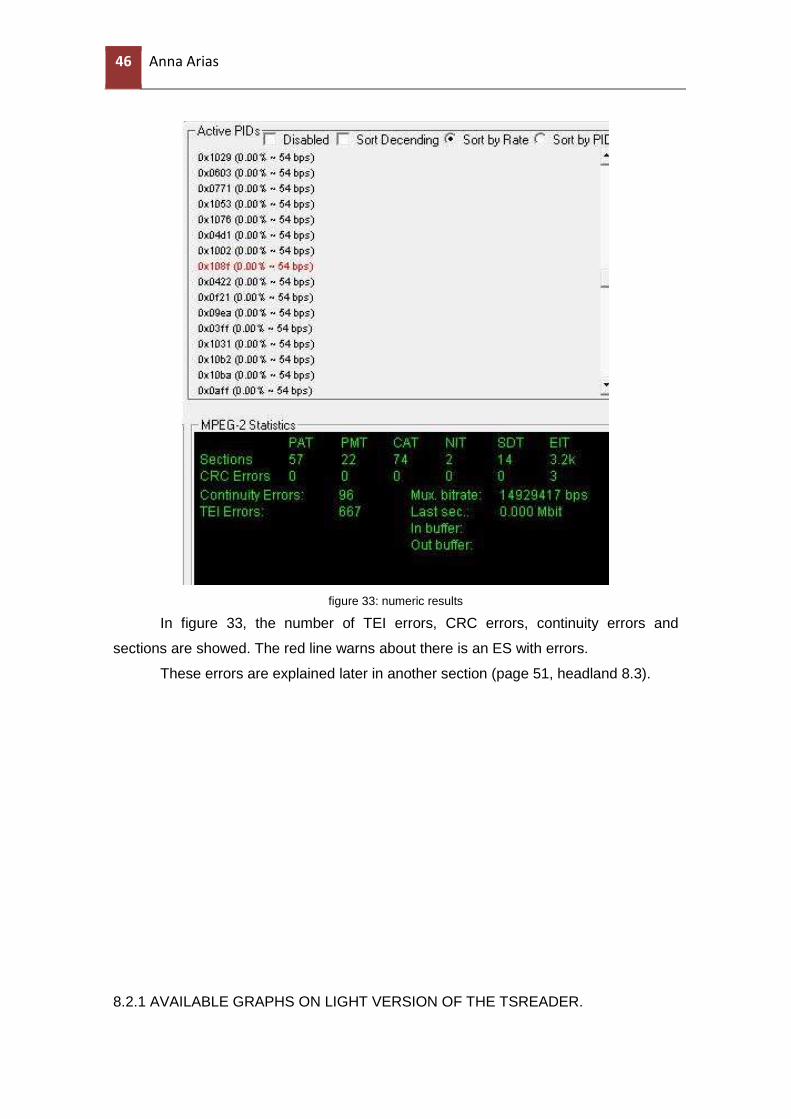
figure 33: numeric results
In figure 33, the number of TEI errors, CRC errors, continuity errors and
sections are showed. The red line warns about there is an ES with errors.
These errors are explained later in another section (page 51, headland 8.3).
8.2.1 AVAILABLE GRAPHS ON LIGHT VERSION OF THE TSREADER.
DVB-T measurements with PROMAX TV EXPLORER II+ and analysis of DVB
transport streams 47
47
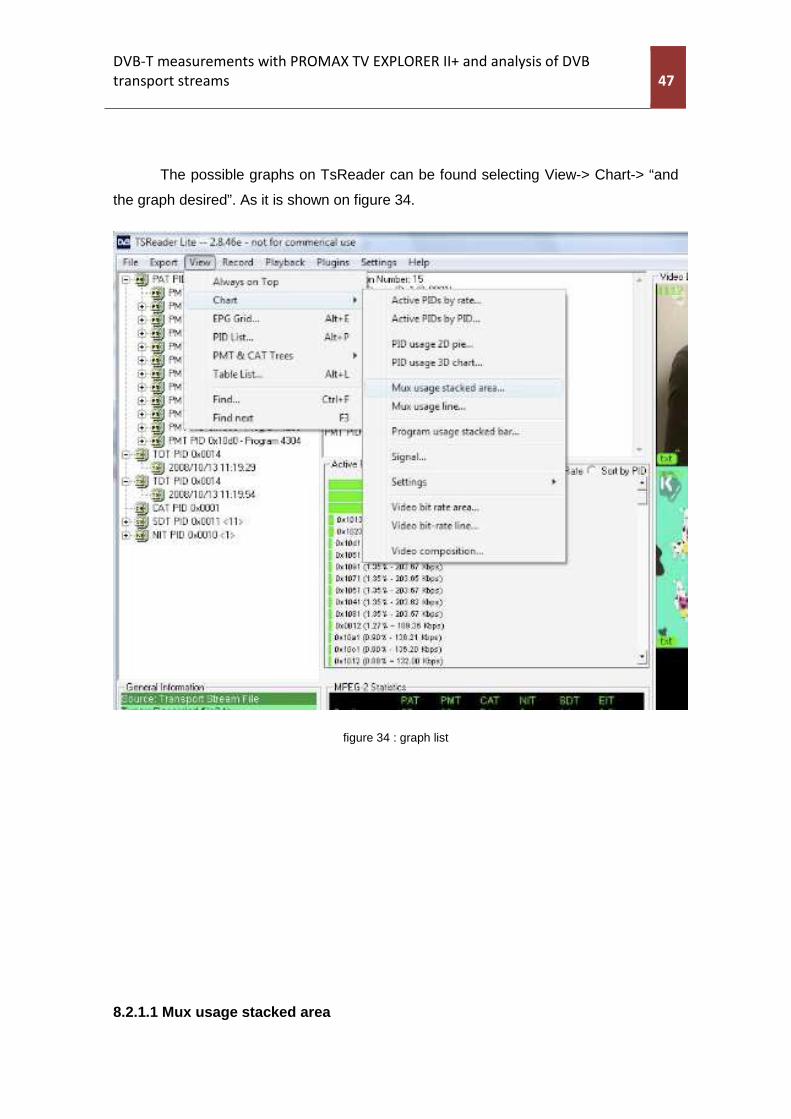
The possible graphs on TsReader can be found selecting View-> Chart-> “and
the graph desired”. As it is shown on figure 34.
figure 34 : graph list
8.2.1.1 Mux usage stacked area
48 Anna Arias
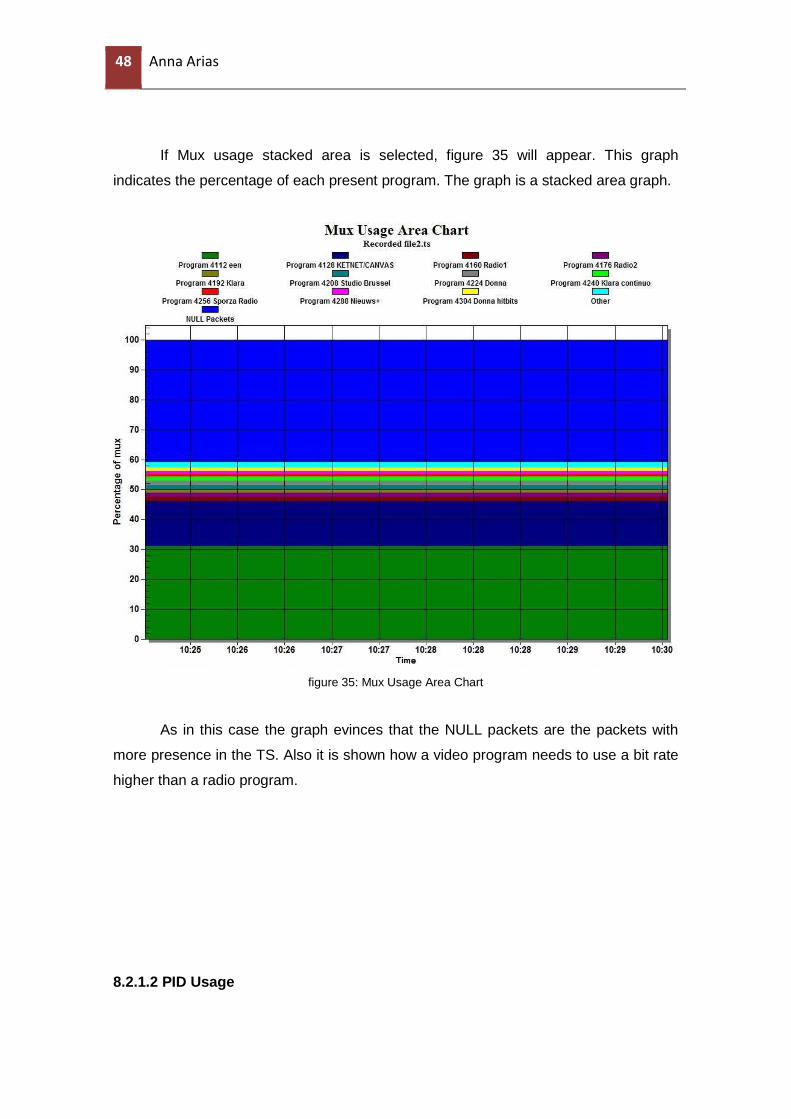
If Mux usage stacked area is selected, figure 35 will appear. This graph
indicates the percentage of each present program. The graph is a stacked area graph.
figure 35: Mux Usage Area Chart
As in this case the graph evinces that the NULL packets are the packets with
more presence in the TS. Also it is shown how a video program needs to use a bit rate
higher than a radio program.
8.2.1.2 PID Usage
DVB-T measurements with PROMAX TV EXPLORER II+ and analysis of DVB
transport streams 49
49
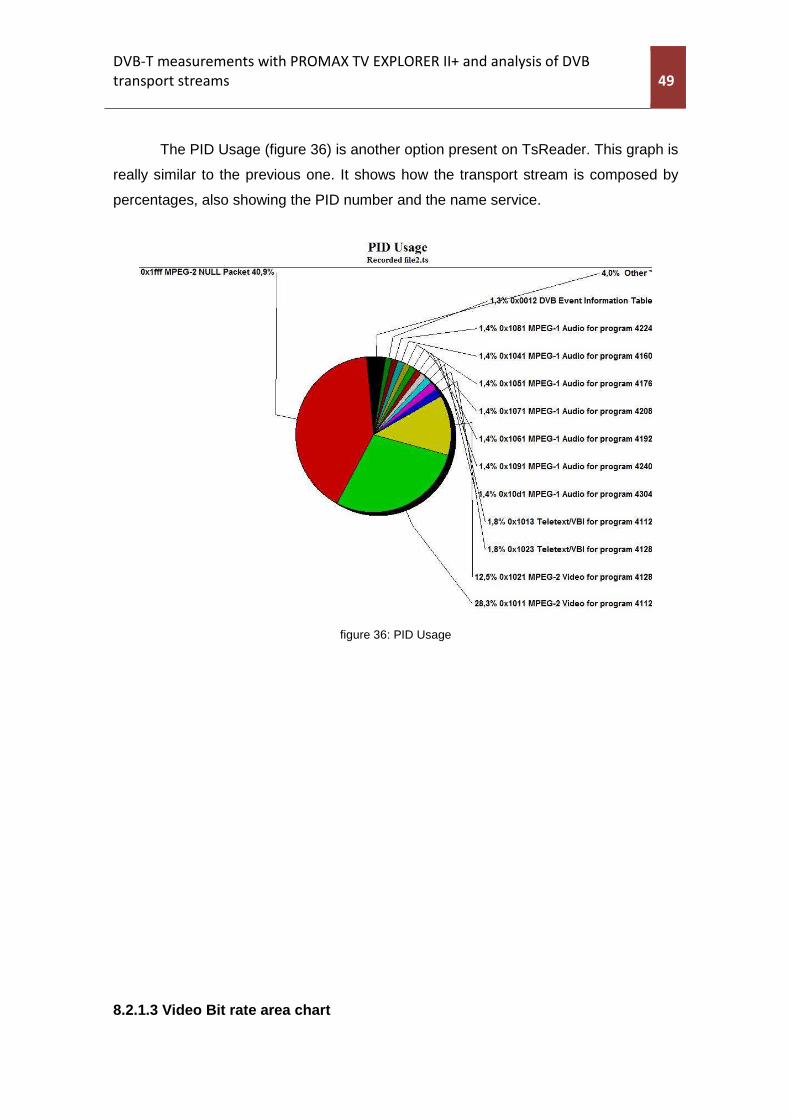
The PID Usage (figure 36) is another option present on TsReader. This graph is
really similar to the previous one. It shows how the transport stream is composed by
percentages, also showing the PID number and the name service.
figure 36: PID Usage
8.2.1.3 Video Bit rate area chart
50 Anna Arias
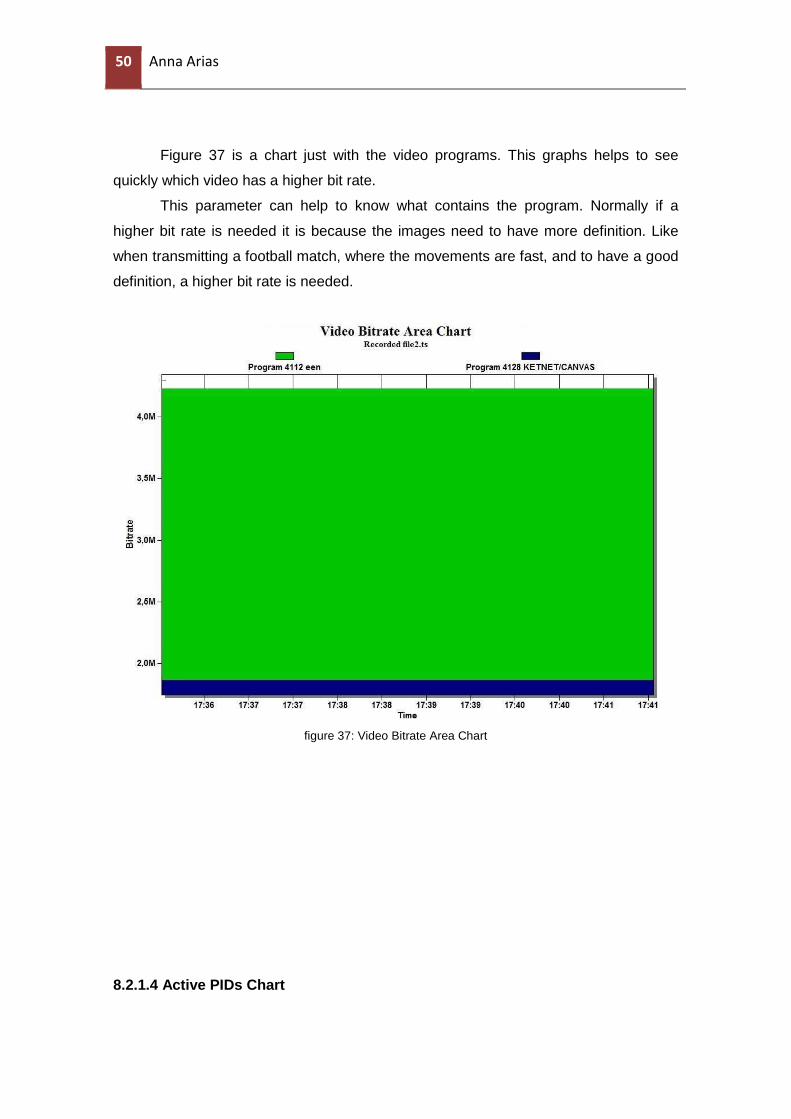
Figure 37 is a chart just with the video programs. This graphs helps to see
quickly which video has a higher bit rate.
This parameter can help to know what contains the program. Normally if a
higher bit rate is needed it is because the images need to have more definition. Like
when transmitting a football match, where the movements are fast, and to have a good
definition, a higher bit rate is needed.
figure 37: Video Bitrate Area Chart
8.2.1.4 Active PIDs Chart
DVB-T measurements with PROMAX TV EXPLORER II+ and analysis of DVB
transport streams 51
51
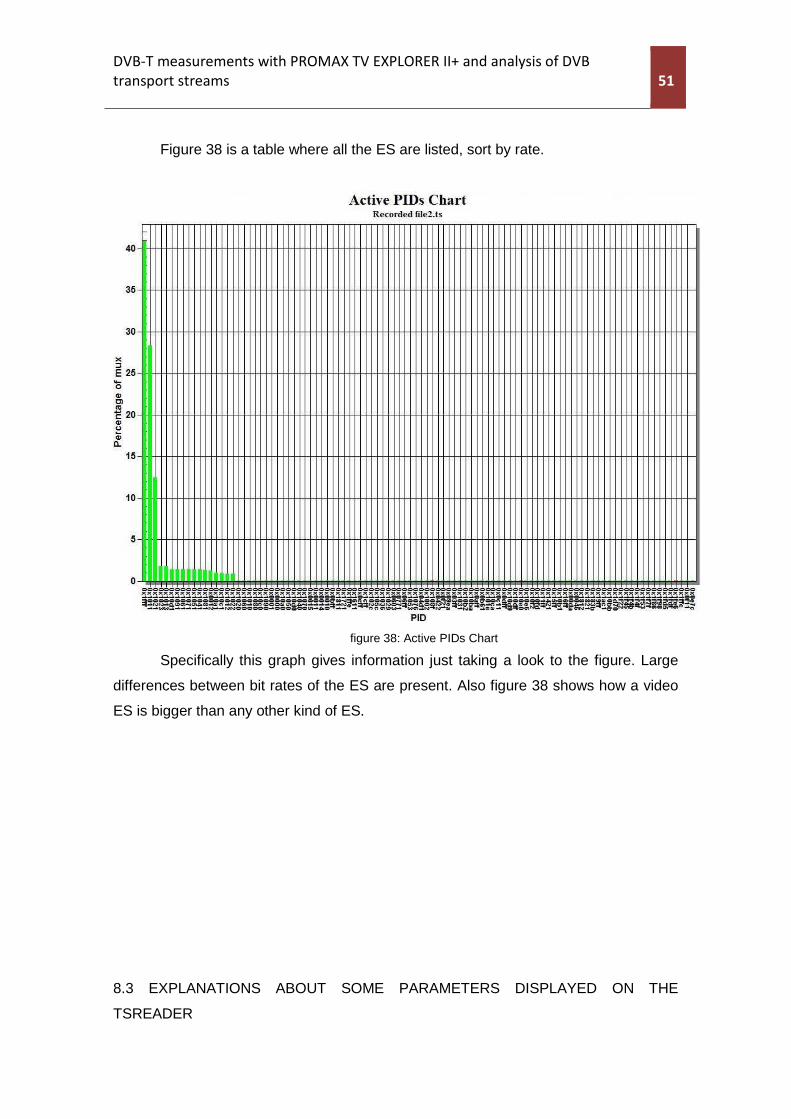
Figure 38 is a table where all the ES are listed, sort by rate.
figure 38: Active PIDs Chart
Specifically this graph gives information just taking a look to the figure. Large
differences between bit rates of the ES are present. Also figure 38 shows how a video
ES is bigger than any other kind of ES.
8.3 EXPLANATIONS ABOUT SOME PARAMETERS DISPLAYED ON THE
TSREADER
52 Anna Arias
TEI errors
The MPEG-2 only permits to correct 8 bits of a TS packet. If this number is
exceeded, Reed Solomon decoder is not able to correct all the errors within one TS
packet.
So the demodulator changes one bit in the TS header to alert the demultiplexor
that this packet can’t be demultiplexed. This flag is the Transport Error Indicator.
Continuity Errors
Each transport stream packet with the same PID carries in the header the
continuity counter, a field composed of four bits, with a range between 0 and 15.
The decoder increases this counter each time one packet is sent, to indicate the order
of the packets with the same PID. The counter continuously increases its number to
reach 15.
The objective of this counter is to ensure that none of the TS packets get lost
and that the PES packet has all of his packets.
If there is one packet lost, the discontinuity indicator, which is in the adaptation field,
indicates it.
If there are more than one or two errors per second there is a problem in the TS
and there will be problems to reproduce it.
CRC errors
The Cyclic Redundancy Check is a function that receives a data stream and like
an output originates a value with a fix length. The term is used to designate the
function and its result. They can be used like a verification sum to detect data
alterations during its transmission or storage.
CRC for Digital TV is used because it is really effective to detect errors caused
by noise in the transmission channels. But this is not safe because if the data have
been modified deliberately and not at random it can't be fully verified.
Section
DVB-T measurements with PROMAX TV EXPLORER II+ and analysis of DVB
transport streams 53
53
PAT, PMT, CAT and NIT tables have to be serialized and segmented into
sections to insert them within TS packets, which have a fixed length and which provide
a bit stream. Hence sections are just segments of the bit stream.
PSI information is repeated periodically within the TS, so independently of the
moment when the decoder synchronises the multiplex, the decoder will eventually see
it sooner or later.
Without the PAT the demultiplexation is impossible and because of that, these
packets are sent more frequently than others. PAT packets are sent every 0.5
seconds. Despite this, the PAT bit rate is smaller than the PMT bit rate.
The following graphs show bit rates for data tables, which belong to a transport
stream of a Catalan channel, TVC. These graphs are from LABMU program from
EXPERTIA Company. This program is used in the Campus Nord of Barcelona, which
belongs to the UPC (Universitat Politècnica de Barcelona).
Josep Ramon Casas (a professor in the UPC) sent me these graphs and these
examples of PAT and PMT tables.
These are stacked area graph, so the bit rate of one element is accumulated in
the second one. The last curve is the total bit rate. To know how much the bit rate is, it
is needed to take into account only the distance between the two curves.
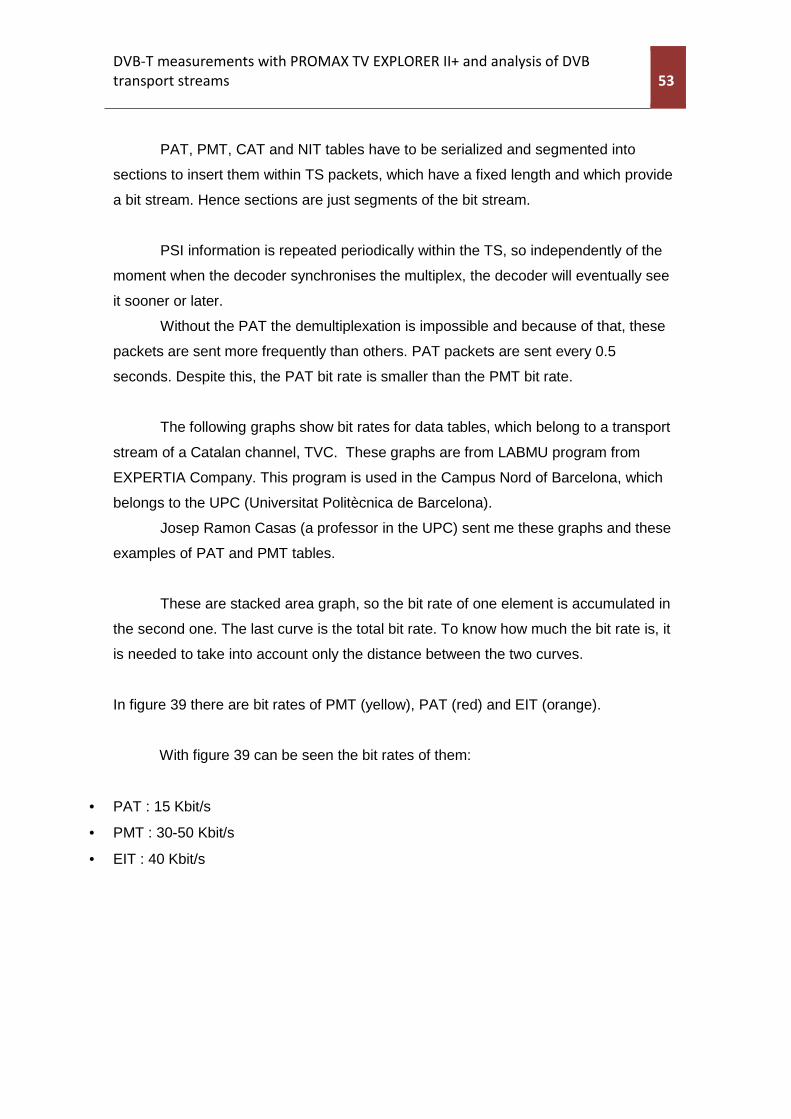
In figure 39 there are bit rates of PMT (yellow), PAT (red) and EIT (orange).
With figure 39 can be seen the bit rates of them:
• PAT : 15 Kbit/s
• PMT : 30-50 Kbit/s
• EIT : 40 Kbit/s
54 Anna Arias
figure 39: LABMU graph
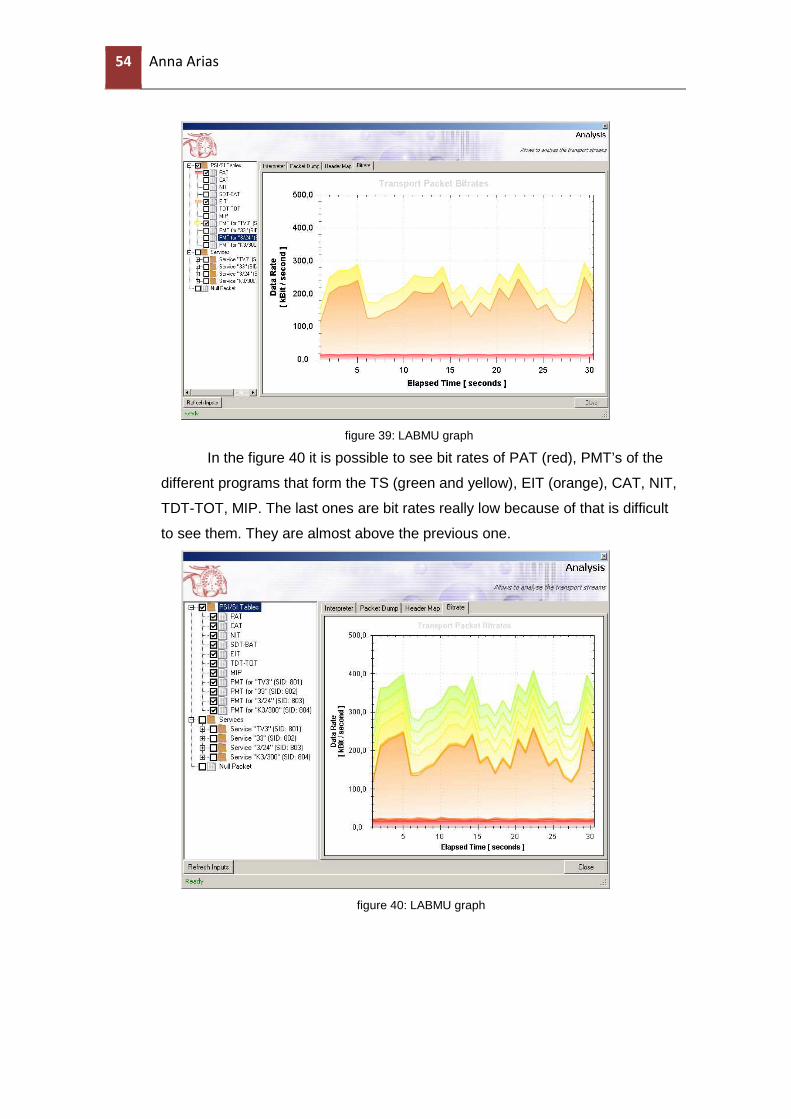
In the figure 40 it is possible to see bit rates of PAT (red), PMT’s of the
different programs that form the TS (green and yellow), EIT (orange), CAT, NIT,
TDT-TOT, MIP. The last ones are bit rates really low because of that is difficult
to see them. They are almost above the previous one.
figure 40: LABMU graph
DVB-T measurements with PROMAX TV EXPLORER II+ and analysis of DVB
transport streams 55
55
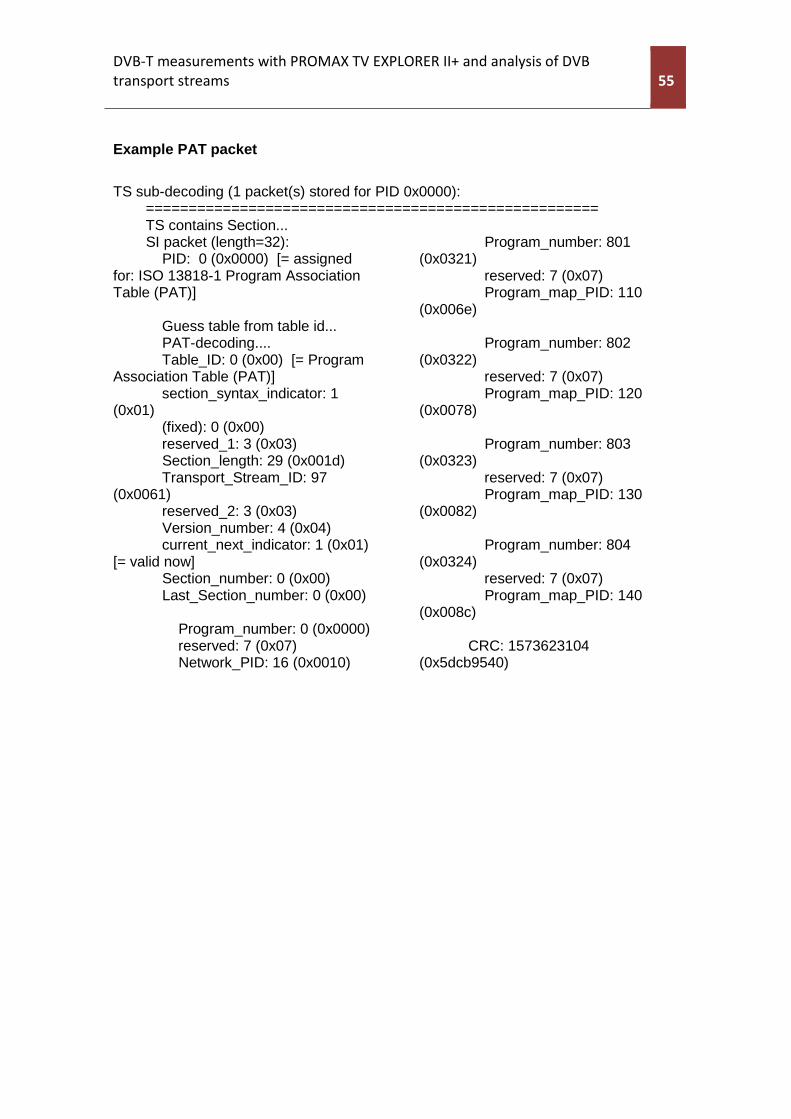
Example PAT packet
TS sub-decoding (1 packet(s) stored for PID 0x0000): ===================================================== TS contains Section... SI packet (length=32): PID: 0 (0x0000) [= assigned for: ISO 13818-1 Program Association Table (PAT)] Guess table from table id... PAT-decoding.... Table_ID: 0 (0x00) [= Program Association Table (PAT)] section_syntax_indicator: 1 (0x01) (fixed): 0 (0x00) reserved_1: 3 (0x03) Section_length: 29 (0x001d) Transport_Stream_ID: 97 (0x0061) reserved_2: 3 (0x03) Version_number: 4 (0x04) current_next_indicator: 1 (0x01) [= valid now] Section_number: 0 (0x00) Last_Section_number: 0 (0x00) Program_number: 0 (0x0000) reserved: 7 (0x07) Network_PID: 16 (0x0010)
Program_number: 801 (0x0321) reserved: 7 (0x07) Program_map_PID: 110 (0x006e) Program_number: 802 (0x0322) reserved: 7 (0x07) Program_map_PID: 120 (0x0078) Program_number: 803 (0x0323) reserved: 7 (0x07) Program_map_PID: 130 (0x0082) Program_number: 804 (0x0324) reserved: 7 (0x07) Program_map_PID: 140 (0x008c) CRC: 1573623104 (0x5dcb9540)
56 Anna Arias
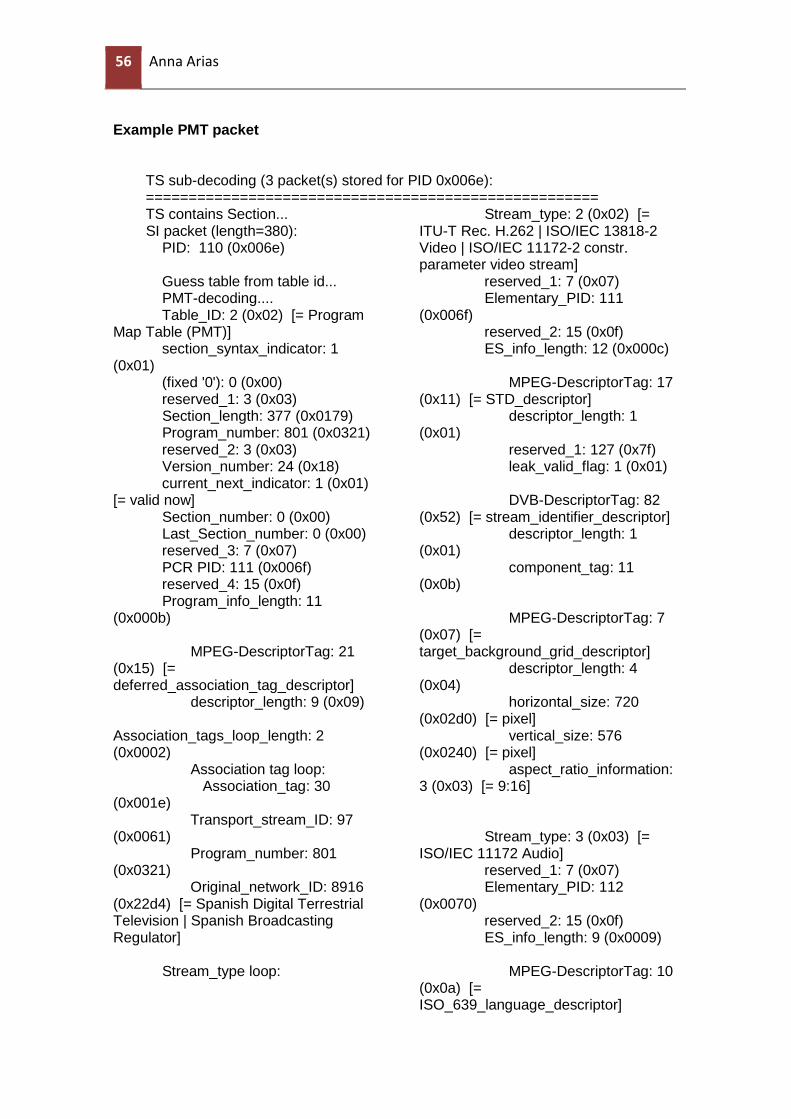
Example PMT packet
TS sub-decoding (3 packet(s) stored for PID 0x006e): ===================================================== TS contains Section... SI packet (length=380): PID: 110 (0x006e) Guess table from table id... PMT-decoding.... Table_ID: 2 (0x02) [= Program Map Table (PMT)] section_syntax_indicator: 1 (0x01) (fixed '0'): 0 (0x00) reserved_1: 3 (0x03) Section_length: 377 (0x0179) Program_number: 801 (0x0321) reserved_2: 3 (0x03) Version_number: 24 (0x18) current_next_indicator: 1 (0x01) [= valid now] Section_number: 0 (0x00) Last_Section_number: 0 (0x00) reserved_3: 7 (0x07) PCR PID: 111 (0x006f) reserved_4: 15 (0x0f) Program_info_length: 11 (0x000b) MPEG-DescriptorTag: 21 (0x15) [= deferred_association_tag_descriptor] descriptor_length: 9 (0x09) Association_tags_loop_length: 2 (0x0002) Association tag loop: Association_tag: 30 (0x001e) Transport_stream_ID: 97 (0x0061) Program_number: 801 (0x0321) Original_network_ID: 8916 (0x22d4) [= Spanish Digital Terrestrial Television | Spanish Broadcasting Regulator] Stream_type loop:
Stream_type: 2 (0x02) [= ITU-T Rec. H.262 | ISO/IEC 13818-2 Video | ISO/IEC 11172-2 constr. parameter video stream] reserved_1: 7 (0x07) Elementary_PID: 111 (0x006f) reserved_2: 15 (0x0f) ES_info_length: 12 (0x000c) MPEG-DescriptorTag: 17 (0x11) [= STD_descriptor] descriptor_length: 1 (0x01) reserved_1: 127 (0x7f) leak_valid_flag: 1 (0x01) DVB-DescriptorTag: 82 (0x52) [= stream_identifier_descriptor] descriptor_length: 1 (0x01) component_tag: 11 (0x0b) MPEG-DescriptorTag: 7 (0x07) [= target_background_grid_descriptor] descriptor_length: 4 (0x04) horizontal_size: 720 (0x02d0) [= pixel] vertical_size: 576 (0x0240) [= pixel] aspect_ratio_information: 3 (0x03) [= 9:16] Stream_type: 3 (0x03) [= ISO/IEC 11172 Audio] reserved_1: 7 (0x07) Elementary_PID: 112 (0x0070) reserved_2: 15 (0x0f) ES_info_length: 9 (0x0009) MPEG-DescriptorTag: 10 (0x0a) [= ISO_639_language_descriptor]
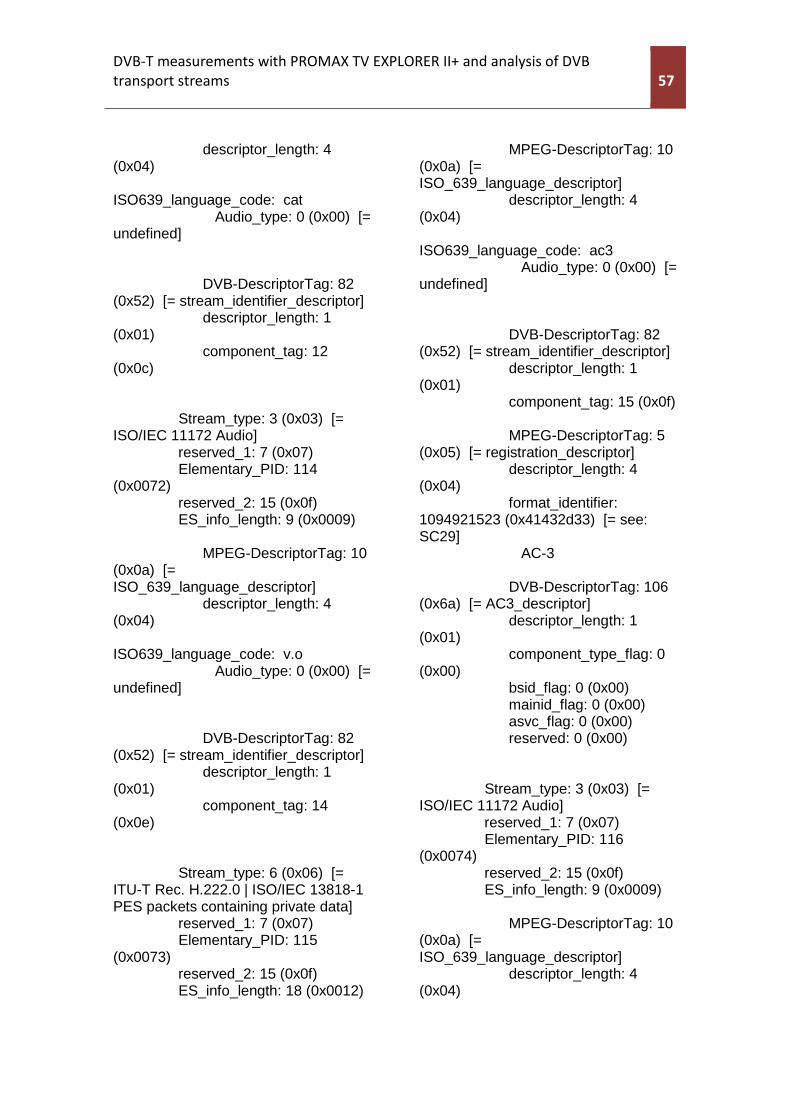
DVB-T measurements with PROMAX TV EXPLORER II+ and analysis of DVB
transport streams 57
57
descriptor_length: 4 (0x04) ISO639_language_code: cat Audio_type: 0 (0x00) [= undefined] DVB-DescriptorTag: 82 (0x52) [= stream_identifier_descriptor] descriptor_length: 1 (0x01) component_tag: 12 (0x0c) Stream_type: 3 (0x03) [= ISO/IEC 11172 Audio] reserved_1: 7 (0x07) Elementary_PID: 114 (0x0072) reserved_2: 15 (0x0f) ES_info_length: 9 (0x0009) MPEG-DescriptorTag: 10 (0x0a) [= ISO_639_language_descriptor] descriptor_length: 4 (0x04) ISO639_language_code: v.o Audio_type: 0 (0x00) [= undefined] DVB-DescriptorTag: 82 (0x52) [= stream_identifier_descriptor] descriptor_length: 1 (0x01) component_tag: 14 (0x0e) Stream_type: 6 (0x06) [= ITU-T Rec. H.222.0 | ISO/IEC 13818-1 PES packets containing private data] reserved_1: 7 (0x07) Elementary_PID: 115 (0x0073) reserved_2: 15 (0x0f) ES_info_length: 18 (0x0012)
MPEG-DescriptorTag: 10 (0x0a) [= ISO_639_language_descriptor] descriptor_length: 4 (0x04) ISO639_language_code: ac3 Audio_type: 0 (0x00) [= undefined] DVB-DescriptorTag: 82 (0x52) [= stream_identifier_descriptor] descriptor_length: 1 (0x01) component_tag: 15 (0x0f) MPEG-DescriptorTag: 5 (0x05) [= registration_descriptor] descriptor_length: 4 (0x04) format_identifier: 1094921523 (0x41432d33) [= see: SC29] AC-3 DVB-DescriptorTag: 106 (0x6a) [= AC3_descriptor] descriptor_length: 1 (0x01) component_type_flag: 0 (0x00) bsid_flag: 0 (0x00) mainid_flag: 0 (0x00) asvc_flag: 0 (0x00) reserved: 0 (0x00) Stream_type: 3 (0x03) [= ISO/IEC 11172 Audio] reserved_1: 7 (0x07) Elementary_PID: 116 (0x0074) reserved_2: 15 (0x0f) ES_info_length: 9 (0x0009) MPEG-DescriptorTag: 10 (0x0a) [= ISO_639_language_descriptor] descriptor_length: 4 (0x04)

58 Anna Arias
ISO639_language_code: ad. Audio_type: 0 (0x00) [= undefined] DVB-DescriptorTag: 82 (0x52) [= stream_identifier_descriptor] descriptor_length: 1 (0x01) component_tag: 16 (0x10) Stream_type: 6 (0x06) [= ITU-T Rec. H.222.0 | ISO/IEC 13818-1 PES packets containing private data] reserved_1: 7 (0x07) Elementary_PID: 801 (0x0321) reserved_2: 15 (0x0f) ES_info_length: 10 (0x000a) DVB-DescriptorTag: 89 (0x59) [= subtitling_descriptor] descriptor_length: 8 (0x08) ISO639_language_code: cat Subtitling_type: 16 (0x10) [= DVB subtitles (normal) with no monitor aspect ratio critical] Composition_page_id: 1 (0x0001) Ancillary_page_id: 1 (0x0001) Stream_type: 6 (0x06) [= ITU-T Rec. H.222.0 | ISO/IEC 13818-1 PES packets containing private data] reserved_1: 7 (0x07) Elementary_PID: 811 (0x032b) reserved_2: 15 (0x0f) ES_info_length: 10 (0x000a) DVB-DescriptorTag: 89 (0x59) [= subtitling_descriptor] descriptor_length: 8 (0x08)
ISO639_language_code: eng Subtitling_type: 16 (0x10) [= DVB subtitles (normal) with no monitor aspect ratio critical] Composition_page_id: 1 (0x0001) Ancillary_page_id: 1 (0x0001) Stream_type: 6 (0x06) [= ITU-T Rec. H.222.0 | ISO/IEC 13818-1 PES packets containing private data] reserved_1: 7 (0x07) Elementary_PID: 812 (0x032c) reserved_2: 15 (0x0f) ES_info_length: 10 (0x000a) DVB-DescriptorTag: 89 (0x59) [= subtitling_descriptor] descriptor_length: 8 (0x08) ISO639_language_code: spa Subtitling_type: 16 (0x10) [= DVB subtitles (normal) with no monitor aspect ratio critical] Composition_page_id: 1 (0x0001) Ancillary_page_id: 1 (0x0001) Stream_type: 6 (0x06) [= ITU-T Rec. H.222.0 | ISO/IEC 13818-1 PES packets containing private data] reserved_1: 7 (0x07) Elementary_PID: 813 (0x032d) reserved_2: 15 (0x0f) ES_info_length: 10 (0x000a) DVB-DescriptorTag: 89 (0x59) [= subtitling_descriptor] descriptor_length: 8 (0x08) ISO639_language_code: ara
DVB-T measurements with PROMAX TV EXPLORER II+ and analysis of DVB
transport streams 59
59
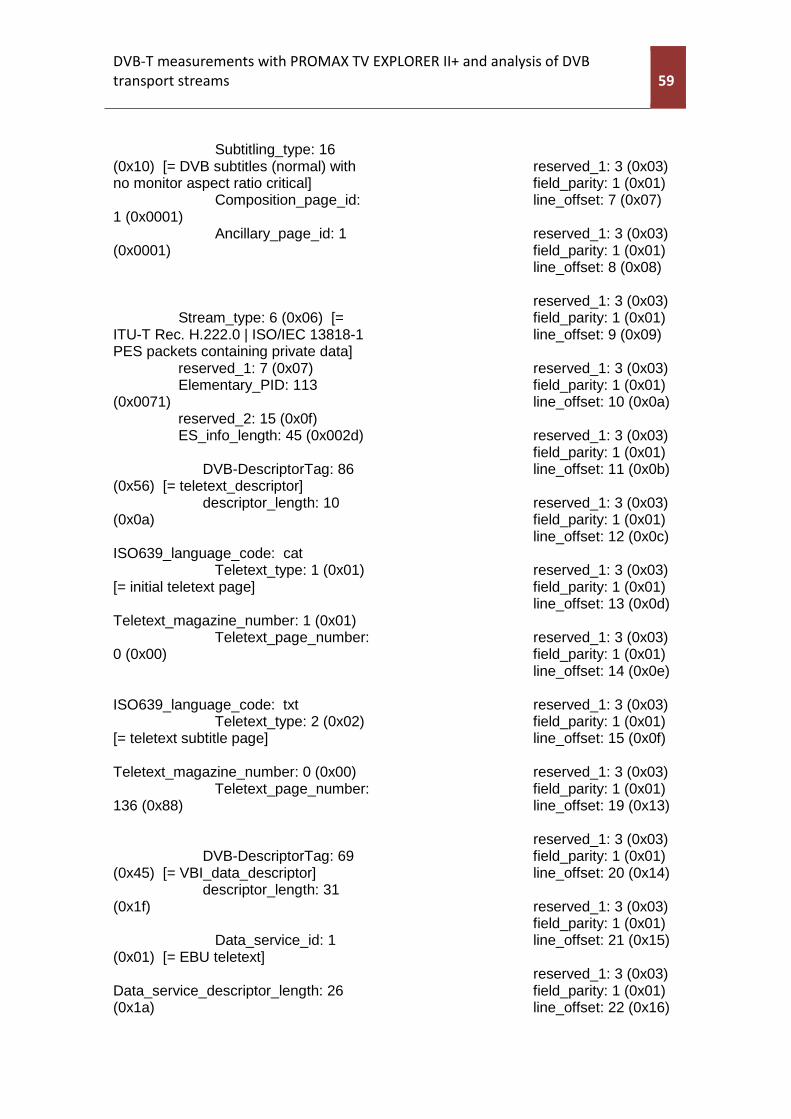
Subtitling_type: 16 (0x10) [= DVB subtitles (normal) with no monitor aspect ratio critical] Composition_page_id: 1 (0x0001) Ancillary_page_id: 1 (0x0001) Stream_type: 6 (0x06) [= ITU-T Rec. H.222.0 | ISO/IEC 13818-1 PES packets containing private data] reserved_1: 7 (0x07) Elementary_PID: 113 (0x0071) reserved_2: 15 (0x0f) ES_info_length: 45 (0x002d) DVB-DescriptorTag: 86 (0x56) [= teletext_descriptor] descriptor_length: 10 (0x0a) ISO639_language_code: cat Teletext_type: 1 (0x01) [= initial teletext page] Teletext_magazine_number: 1 (0x01) Teletext_page_number: 0 (0x00) ISO639_language_code: txt Teletext_type: 2 (0x02) [= teletext subtitle page] Teletext_magazine_number: 0 (0x00) Teletext_page_number: 136 (0x88) DVB-DescriptorTag: 69 (0x45) [= VBI_data_descriptor] descriptor_length: 31 (0x1f) Data_service_id: 1 (0x01) [= EBU teletext] Data_service_descriptor_length: 26 (0x1a)
reserved_1: 3 (0x03) field_parity: 1 (0x01) line_offset: 7 (0x07) reserved_1: 3 (0x03) field_parity: 1 (0x01) line_offset: 8 (0x08) reserved_1: 3 (0x03) field_parity: 1 (0x01) line_offset: 9 (0x09) reserved_1: 3 (0x03) field_parity: 1 (0x01) line_offset: 10 (0x0a) reserved_1: 3 (0x03) field_parity: 1 (0x01) line_offset: 11 (0x0b) reserved_1: 3 (0x03) field_parity: 1 (0x01) line_offset: 12 (0x0c) reserved_1: 3 (0x03) field_parity: 1 (0x01) line_offset: 13 (0x0d) reserved_1: 3 (0x03) field_parity: 1 (0x01) line_offset: 14 (0x0e) reserved_1: 3 (0x03) field_parity: 1 (0x01) line_offset: 15 (0x0f) reserved_1: 3 (0x03) field_parity: 1 (0x01) line_offset: 19 (0x13) reserved_1: 3 (0x03) field_parity: 1 (0x01) line_offset: 20 (0x14) reserved_1: 3 (0x03) field_parity: 1 (0x01) line_offset: 21 (0x15) reserved_1: 3 (0x03) field_parity: 1 (0x01) line_offset: 22 (0x16)
60 Anna Arias
reserved_1: 3 (0x03) field_parity: 0 (0x00) line_offset: 7 (0x07) reserved_1: 3 (0x03) field_parity: 0 (0x00) line_offset: 8 (0x08) reserved_1: 3 (0x03) field_parity: 0 (0x00) line_offset: 9 (0x09) reserved_1: 3 (0x03) field_parity: 0 (0x00) line_offset: 10 (0x0a) reserved_1: 3 (0x03) field_parity: 0 (0x00) line_offset: 11 (0x0b) reserved_1: 3 (0x03) field_parity: 0 (0x00) line_offset: 12 (0x0c) reserved_1: 3 (0x03) field_parity: 0 (0x00) line_offset: 13 (0x0d) reserved_1: 3 (0x03) field_parity: 0 (0x00) line_offset: 14 (0x0e) reserved_1: 3 (0x03) field_parity: 0 (0x00) line_offset: 15 (0x0f) reserved_1: 3 (0x03) field_parity: 0 (0x00) line_offset: 19 (0x13) reserved_1: 3 (0x03) field_parity: 0 (0x00) line_offset: 20 (0x14) reserved_1: 3 (0x03) field_parity: 0 (0x00) line_offset: 21 (0x15) reserved_1: 3 (0x03) field_parity: 0 (0x00) line_offset: 22 (0x16)
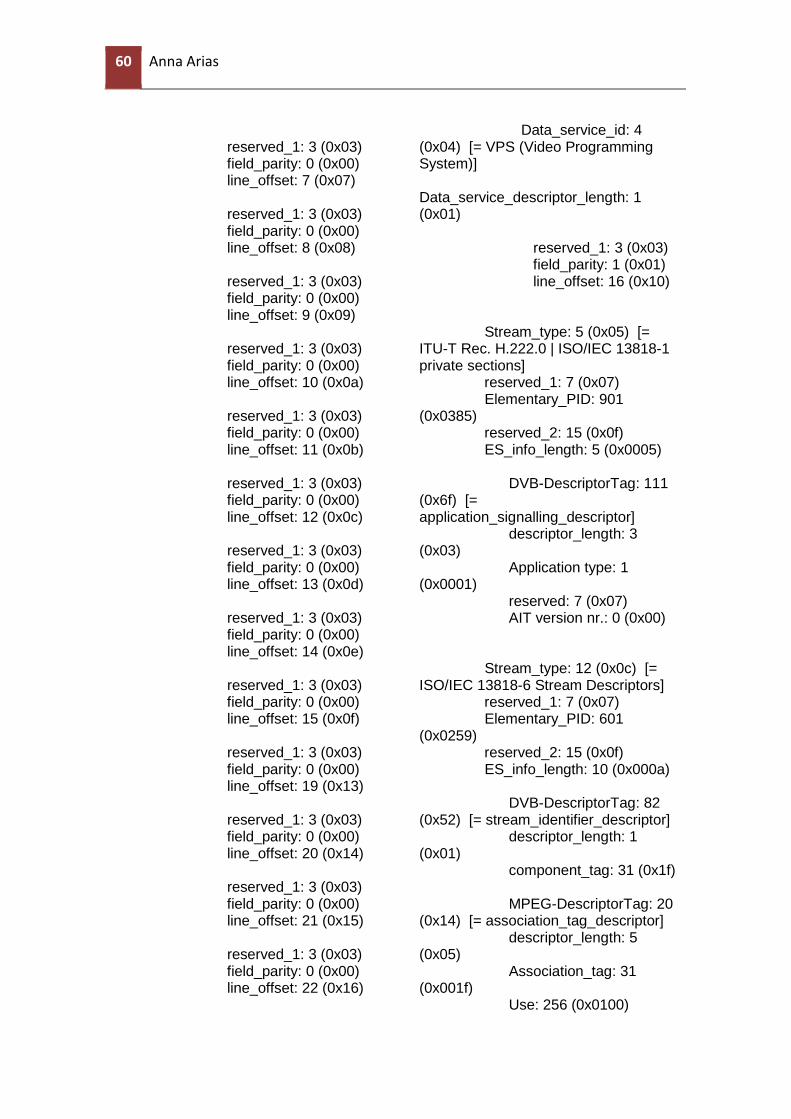
Data_service_id: 4 (0x04) [= VPS (Video Programming System)] Data_service_descriptor_length: 1 (0x01) reserved_1: 3 (0x03) field_parity: 1 (0x01) line_offset: 16 (0x10) Stream_type: 5 (0x05) [= ITU-T Rec. H.222.0 | ISO/IEC 13818-1 private sections] reserved_1: 7 (0x07) Elementary_PID: 901 (0x0385) reserved_2: 15 (0x0f) ES_info_length: 5 (0x0005) DVB-DescriptorTag: 111 (0x6f) [= application_signalling_descriptor] descriptor_length: 3 (0x03) Application type: 1 (0x0001) reserved: 7 (0x07) AIT version nr.: 0 (0x00) Stream_type: 12 (0x0c) [= ISO/IEC 13818-6 Stream Descriptors] reserved_1: 7 (0x07) Elementary_PID: 601 (0x0259) reserved_2: 15 (0x0f) ES_info_length: 10 (0x000a) DVB-DescriptorTag: 82 (0x52) [= stream_identifier_descriptor] descriptor_length: 1 (0x01) component_tag: 31 (0x1f) MPEG-DescriptorTag: 20 (0x14) [= association_tag_descriptor] descriptor_length: 5 (0x05) Association_tag: 31 (0x001f) Use: 256 (0x0100)
DVB-T measurements with PROMAX TV EXPLORER II+ and analysis of DVB
transport streams 61
61
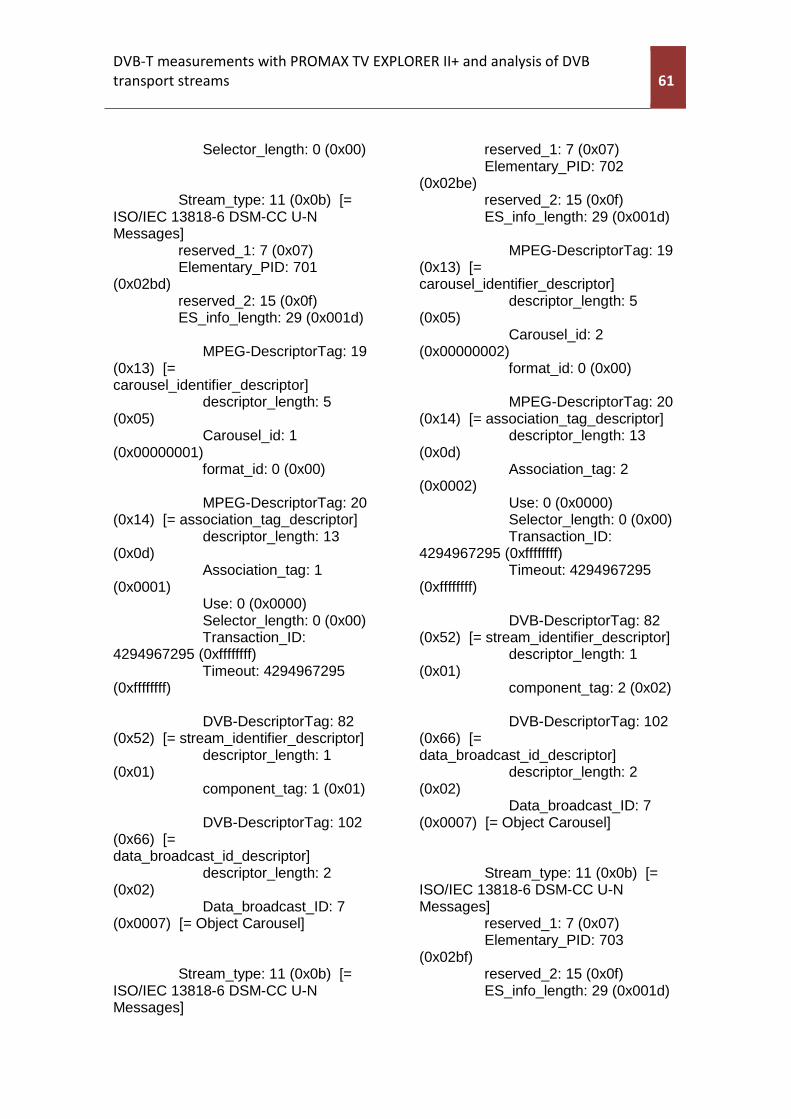
Selector_length: 0 (0x00) Stream_type: 11 (0x0b) [= ISO/IEC 13818-6 DSM-CC U-N Messages] reserved_1: 7 (0x07) Elementary_PID: 701 (0x02bd) reserved_2: 15 (0x0f) ES_info_length: 29 (0x001d) MPEG-DescriptorTag: 19 (0x13) [= carousel_identifier_descriptor] descriptor_length: 5 (0x05) Carousel_id: 1 (0x00000001) format_id: 0 (0x00) MPEG-DescriptorTag: 20 (0x14) [= association_tag_descriptor] descriptor_length: 13 (0x0d) Association_tag: 1 (0x0001) Use: 0 (0x0000) Selector_length: 0 (0x00) Transaction_ID: 4294967295 (0xffffffff) Timeout: 4294967295 (0xffffffff) DVB-DescriptorTag: 82 (0x52) [= stream_identifier_descriptor] descriptor_length: 1 (0x01) component_tag: 1 (0x01) DVB-DescriptorTag: 102 (0x66) [= data_broadcast_id_descriptor] descriptor_length: 2 (0x02) Data_broadcast_ID: 7 (0x0007) [= Object Carousel] Stream_type: 11 (0x0b) [= ISO/IEC 13818-6 DSM-CC U-N Messages]
reserved_1: 7 (0x07) Elementary_PID: 702 (0x02be) reserved_2: 15 (0x0f) ES_info_length: 29 (0x001d) MPEG-DescriptorTag: 19 (0x13) [= carousel_identifier_descriptor] descriptor_length: 5 (0x05) Carousel_id: 2 (0x00000002) format_id: 0 (0x00) MPEG-DescriptorTag: 20 (0x14) [= association_tag_descriptor] descriptor_length: 13 (0x0d) Association_tag: 2 (0x0002) Use: 0 (0x0000) Selector_length: 0 (0x00) Transaction_ID: 4294967295 (0xffffffff) Timeout: 4294967295 (0xffffffff) DVB-DescriptorTag: 82 (0x52) [= stream_identifier_descriptor] descriptor_length: 1 (0x01) component_tag: 2 (0x02) DVB-DescriptorTag: 102 (0x66) [= data_broadcast_id_descriptor] descriptor_length: 2 (0x02) Data_broadcast_ID: 7 (0x0007) [= Object Carousel] Stream_type: 11 (0x0b) [= ISO/IEC 13818-6 DSM-CC U-N Messages] reserved_1: 7 (0x07) Elementary_PID: 703 (0x02bf) reserved_2: 15 (0x0f) ES_info_length: 29 (0x001d)

62 Anna Arias
MPEG-DescriptorTag: 19 (0x13) [= carousel_identifier_descriptor] descriptor_length: 5 (0x05) Carousel_id: 3 (0x00000003) format_id: 0 (0x00) MPEG-DescriptorTag: 20 (0x14) [= association_tag_descriptor] descriptor_length: 13 (0x0d) Association_tag: 3 (0x0003) Use: 0 (0x0000) Selector_length: 0 (0x00) Transaction_ID: 4294967295 (0xffffffff) Timeout: 4294967295 (0xffffffff) DVB-DescriptorTag: 82 (0x52) [= stream_identifier_descriptor] descriptor_length: 1 (0x01) component_tag: 3 (0x03) DVB-DescriptorTag: 102 (0x66) [= data_broadcast_id_descriptor] descriptor_length: 2 (0x02) Data_broadcast_ID: 7 (0x0007) [= Object Carousel] Stream_type: 11 (0x0b) [= ISO/IEC 13818-6 DSM-CC U-N Messages] reserved_1: 7 (0x07) Elementary_PID: 704 (0x02c0) reserved_2: 15 (0x0f) ES_info_length: 29 (0x001d) MPEG-DescriptorTag: 19 (0x13) [= carousel_identifier_descriptor] descriptor_length: 5 (0x05) Carousel_id: 4 (0x00000004)
format_id: 0 (0x00) MPEG-DescriptorTag: 20 (0x14) [= association_tag_descriptor] descriptor_length: 13 (0x0d) Association_tag: 4 (0x0004) Use: 0 (0x0000) Selector_length: 0 (0x00) Transaction_ID: 4294967295 (0xffffffff) Timeout: 4294967295 (0xffffffff) DVB-DescriptorTag: 82 (0x52) [= stream_identifier_descriptor] descriptor_length: 1 (0x01) component_tag: 4 (0x04) DVB-DescriptorTag: 102 (0x66) [= data_broadcast_id_descriptor] descriptor_length: 2 (0x02) Data_broadcast_ID: 7 (0x0007) [= Object Carousel] CRC: 3464519067 (0xce805d9b)
DVB-T measurements with PROMAX TV EXPLORER II+ and analysis of DVB
transport streams 63
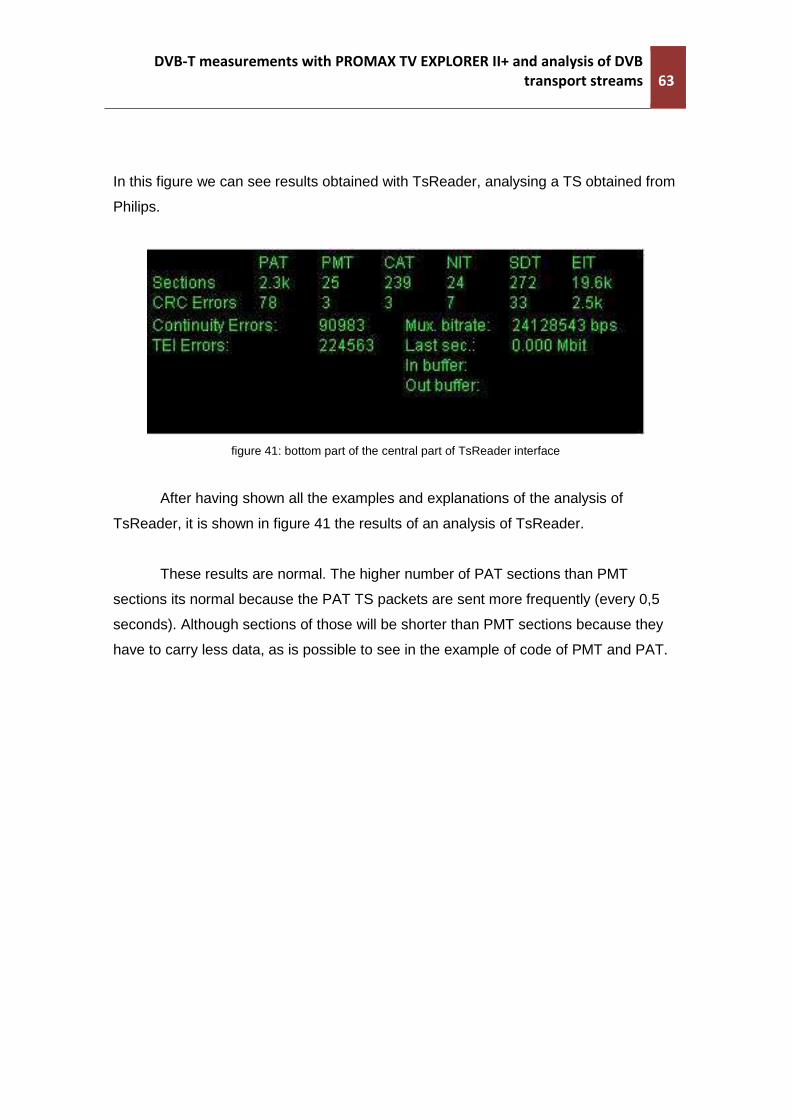
In this figure we can see results obtained with TsReader, analysing a TS obtained from
Philips.
figure 41: bottom part of the central part of TsReader interface
After having shown all the examples and explanations of the analysis of
TsReader, it is shown in figure 41 the results of an analysis of TsReader.
These results are normal. The higher number of PAT sections than PMT
sections its normal because the PAT TS packets are sent more frequently (every 0,5
seconds). Although sections of those will be shorter than PMT sections because they
have to carry less data, as is possible to see in the example of code of PMT and PAT.
64 Anna Arias Fuentes
8.3 TV EXPLORER II+ OF PROMAX
8.3.1 Installation of the software
In the installation process some problems occurred because the computer used
had the Vista Windows installed. The software for the computer obtained from
PROMAX on the other hand was for Windows XP. I tried to download different files for
the computer in the PROMAX website, but no of them resolved the problem. Finally I
explained my problem to the customer services centre of PROMAX Company.
They sent me another setup, which you can find at:
http://home.promax.es/ftp/Zips/USB_driver_XP_VISTA.zip
This setup doesn’t install the program. It just unzips the files in a folder (you can
choose the location of the folder). In this folder you will have all the necessary files to
install the drivers. You have to click in the folder to see the files. Here you will see one
folder called DISK1, click on this folder. Here, click on the setup file.
The installation is rather easy. Follow the steps, accept the terms of the license
agreement and then indicate where you want the location of the folder with the files of
the program.
The next step is to connect the TV Explorer II+ to the PC, using the USB cable.
The computer asks you if you want to install the necessary driver software of the
equipment. Select the option to do it automatically. Follow a few steps and the
installation of the device will be completed.
After that part, Windows displays a new dialog box. Windows has found New
Hardware, USB-Serial-Port. Select again the automatic option and follow the steps.
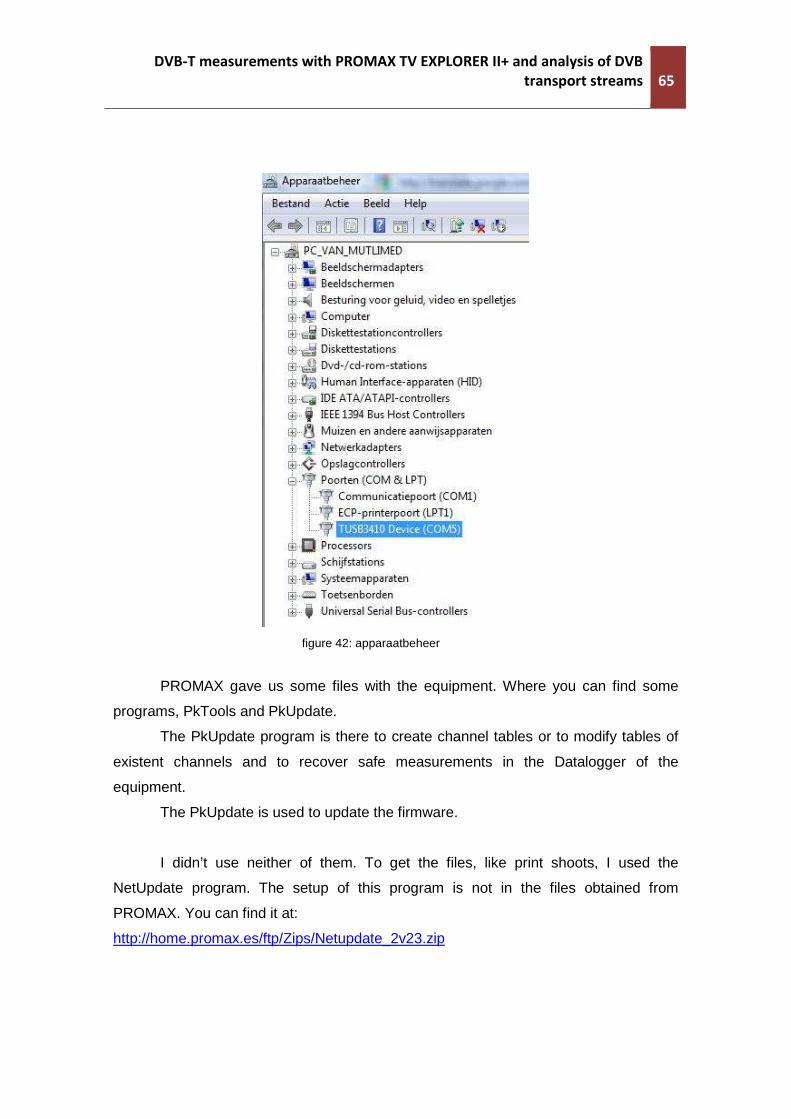
Now, choose My computer -> Configuratiescherm -> Apparaatbeheer, to see
figure 42 on the screen.
DVB-T measurements with PROMAX TV EXPLORER II+ and analysis of DVB
transport streams 65
figure 42: apparaatbeheer
PROMAX gave us some files with the equipment. Where you can find some
programs, PkTools and PkUpdate.
The PkUpdate program is there to create channel tables or to modify tables of
existent channels and to recover safe measurements in the Datalogger of the
equipment.
The PkUpdate is used to update the firmware.
I didn’t use neither of them. To get the files, like print shoots, I used the
NetUpdate program. The setup of this program is not in the files obtained from
PROMAX. You can find it at:
http://home.promax.es/ftp/Zips/Netupdate_2v23.zip
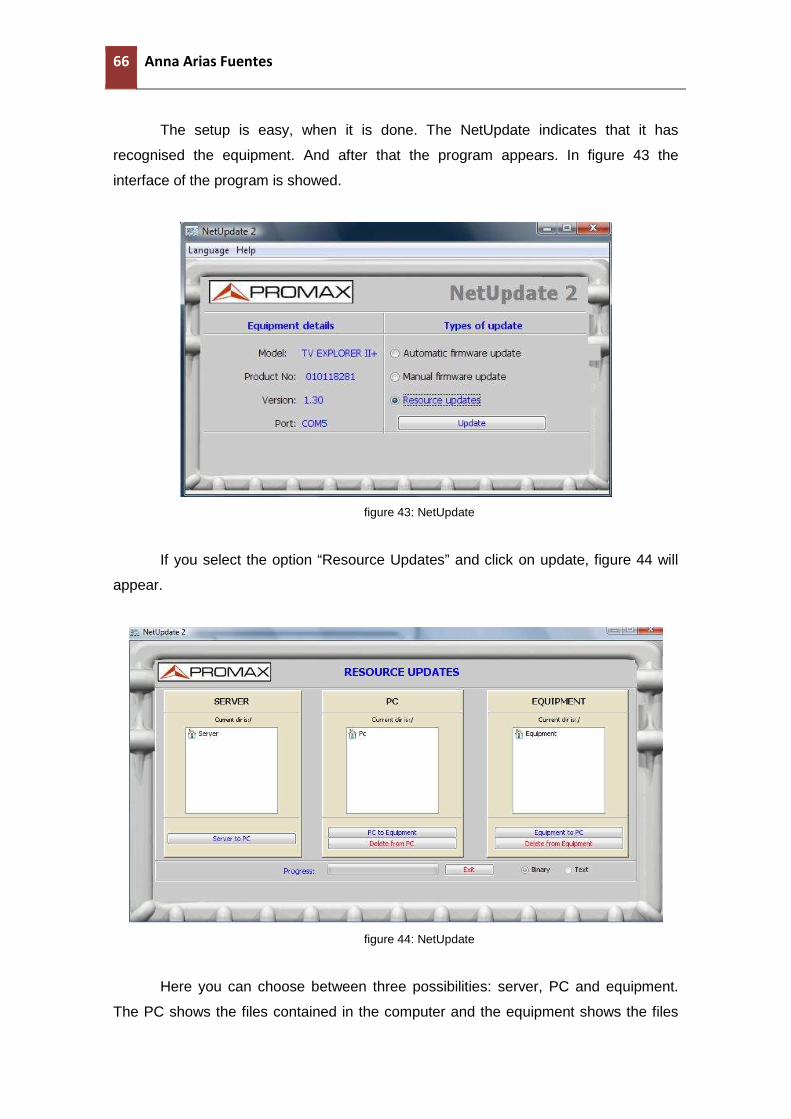
66 Anna Arias Fuentes
The setup is easy, when it is done. The NetUpdate indicates that it has
recognised the equipment. And after that the program appears. In figure 43 the
interface of the program is showed.
figure 43: NetUpdate
If you select the option “Resource Updates” and click on update, figure 44 will
appear.
figure 44: NetUpdate
Here you can choose between three possibilities: server, PC and equipment.
The PC shows the files contained in the computer and the equipment shows the files

DVB-T measurements with PROMAX TV EXPLORER II+ and analysis of DVB
transport streams 67
contained in the TV Explorer II+. If you click in one of the folders, you will see the files
contained therein, like it is shown in figure 45.
figure 45: NetUpdate
If you press on the folder called PrintScreen. You will see the print shoots
made. If you want to see the video files (program streams) recorded, you can click on
the video folder.
If you want to transfer a file between the computer and the equipment, you just
have to drag the file, from the equipment to the PC, or vice verse.
In the bottom part, on the right, you can see two options, namely Binary and
Text. This is for when you want to choose a file of another folder than PrintScreen.
These folders contain data files (about diagram constellations, spectrums, etc.). If you
want only to safe files you must take them selecting Binary. If on the other hand, you
want to use them (in the extension file .csv), you can do it with some programs like
Excel.
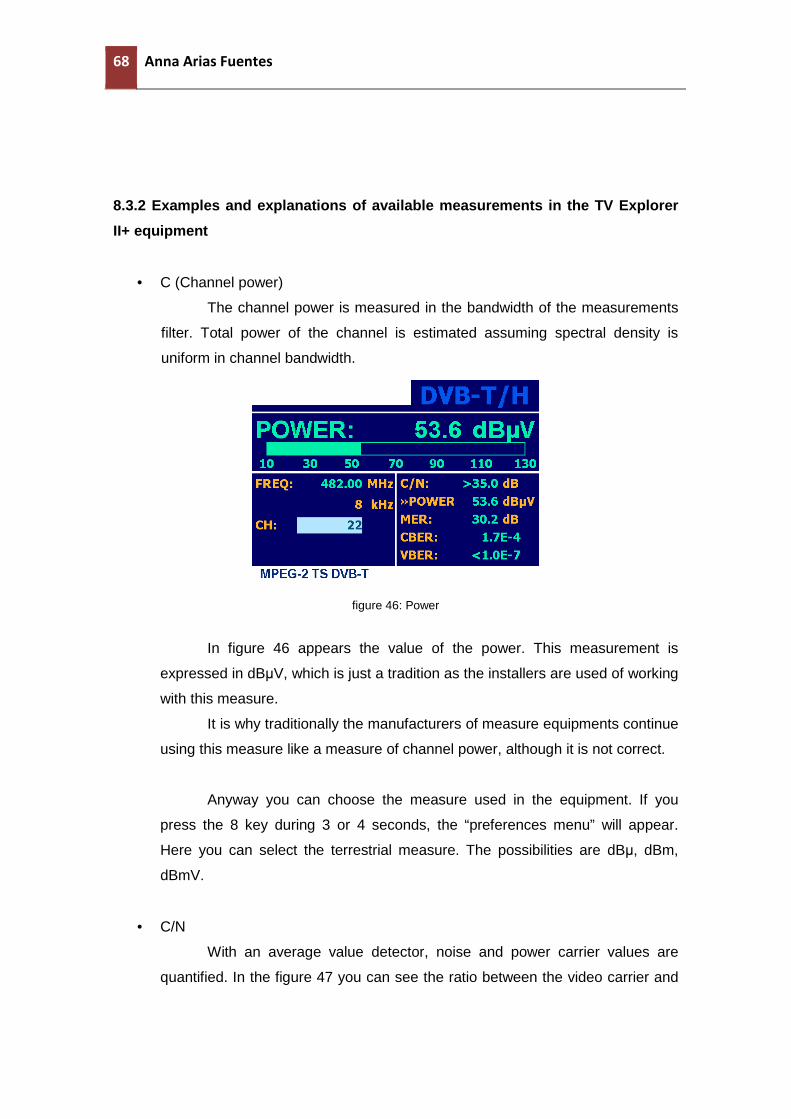
68 Anna Arias Fuentes
8.3.2 Examples and explanations of available measurements in the TV Explorer
II+ equipment
• C (Channel power)
The channel power is measured in the bandwidth of the measurements
filter. Total power of the channel is estimated assuming spectral density is
uniform in channel bandwidth.
figure 46: Power
In figure 46 appears the value of the power. This measurement is
expressed in dBµV, which is just a tradition as the installers are used of working
with this measure.
It is why traditionally the manufacturers of measure equipments continue
using this measure like a measure of channel power, although it is not correct.
Anyway you can choose the measure used in the equipment. If you
press the 8 key during 3 or 4 seconds, the “preferences menu” will appear.
Here you can select the terrestrial measure. The possibilities are dBµ, dBm,
dBmV.
• C/N
With an average value detector, noise and power carrier values are
quantified. In the figure 47 you can see the ratio between the video carrier and
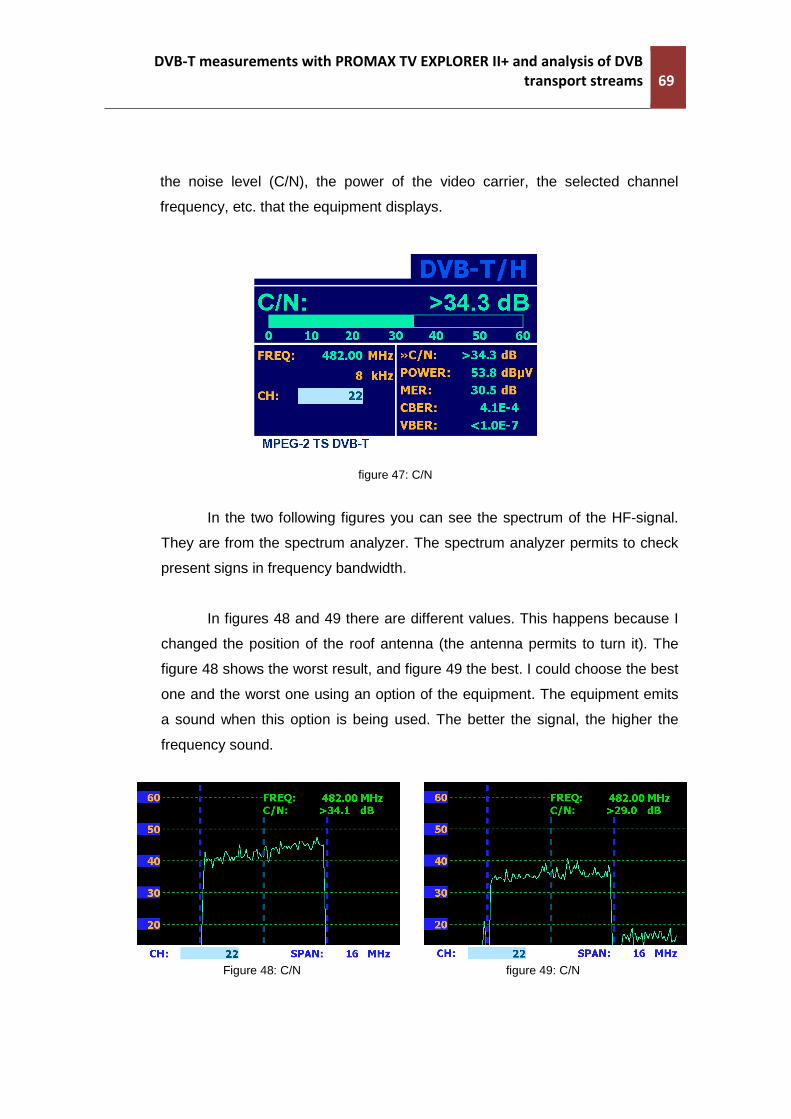
DVB-T measurements with PROMAX TV EXPLORER II+ and analysis of DVB
transport streams 69
the noise level (C/N), the power of the video carrier, the selected channel
frequency, etc. that the equipment displays.
figure 47: C/N
In the two following figures you can see the spectrum of the HF-signal.
They are from the spectrum analyzer. The spectrum analyzer permits to check
present signs in frequency bandwidth.
In figures 48 and 49 there are different values. This happens because I
changed the position of the roof antenna (the antenna permits to turn it). The
figure 48 shows the worst result, and figure 49 the best. I could choose the best
one and the worst one using an option of the equipment. The equipment emits
a sound when this option is being used. The better the signal, the higher the
frequency sound.
Figure 48: C/N figure 49: C/N
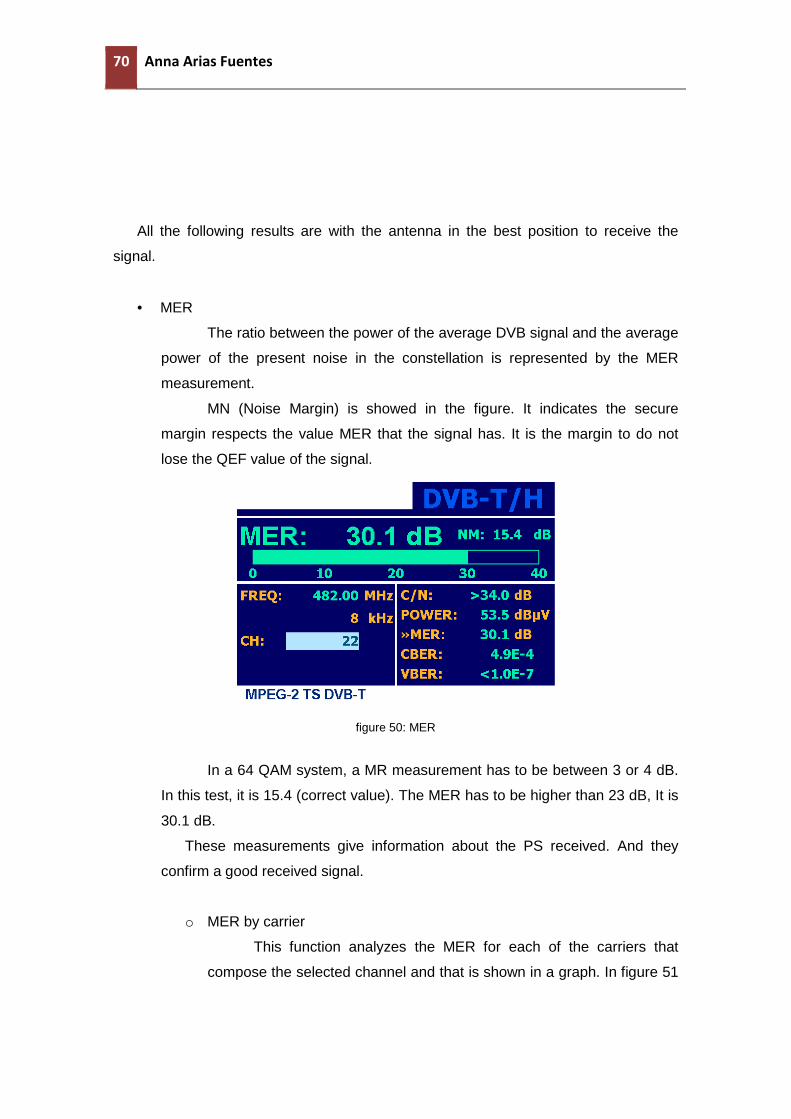
70 Anna Arias Fuentes
All the following results are with the antenna in the best position to receive the
signal.
• MER
The ratio between the power of the average DVB signal and the average
power of the present noise in the constellation is represented by the MER
measurement.
MN (Noise Margin) is showed in the figure. It indicates the secure
margin respects the value MER that the signal has. It is the margin to do not
lose the QEF value of the signal.
figure 50: MER
In a 64 QAM system, a MR measurement has to be between 3 or 4 dB.
In this test, it is 15.4 (correct value). The MER has to be higher than 23 dB, It is
30.1 dB.
These measurements give information about the PS received. And they
confirm a good received signal.
o MER by carrier
This function analyzes the MER for each of the carriers that
compose the selected channel and that is shown in a graph. In figure 51
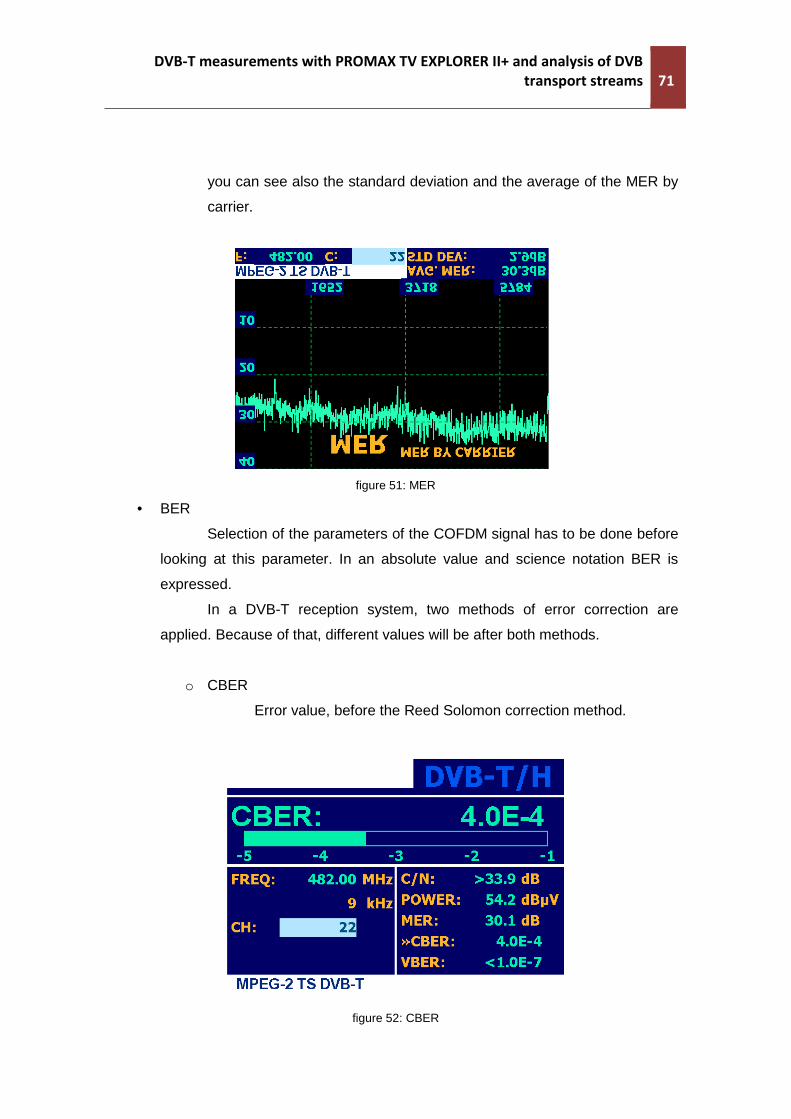
DVB-T measurements with PROMAX TV EXPLORER II+ and analysis of DVB
transport streams 71
you can see also the standard deviation and the average of the MER by
carrier.
figure 51: MER
• BER
Selection of the parameters of the COFDM signal has to be done before
looking at this parameter. In an absolute value and science notation BER is
expressed.
In a DVB-T reception system, two methods of error correction are
applied. Because of that, different values will be after both methods.
o CBER
Error value, before the Reed Solomon correction method.
figure 52: CBER
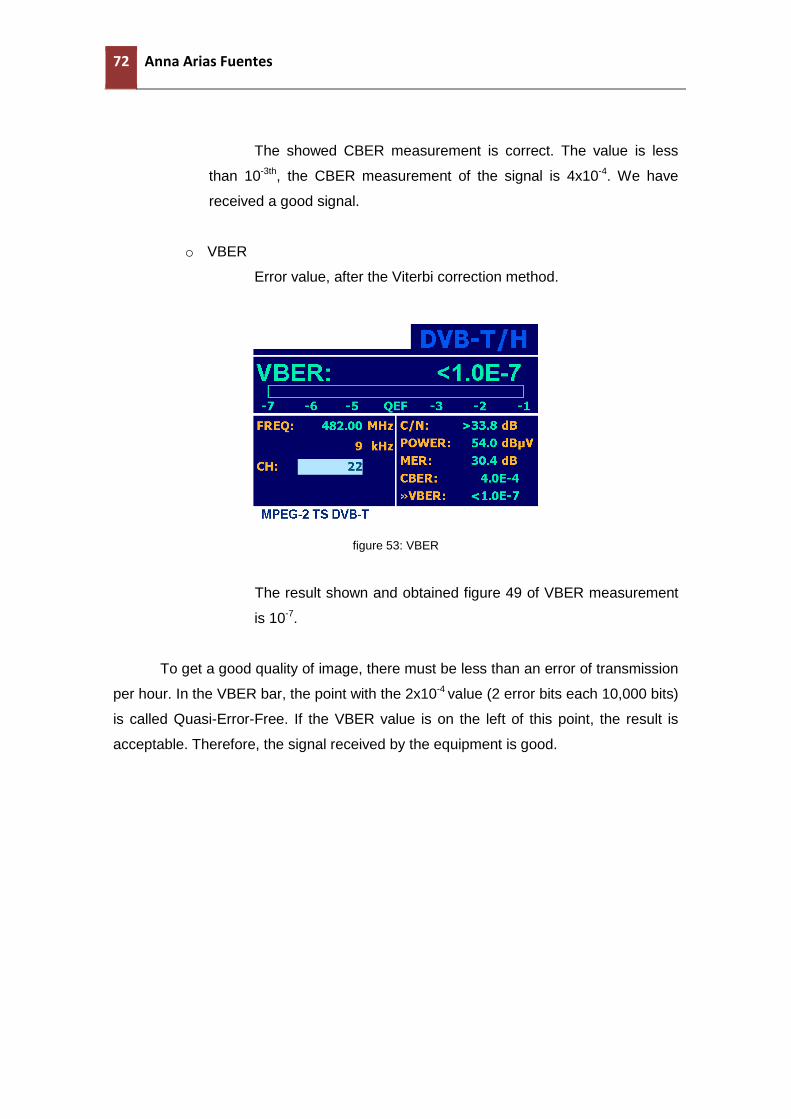
72 Anna Arias Fuentes
The showed CBER measurement is correct. The value is less
than 10-3th, the CBER measurement of the signal is 4x10⁻⁴. We have
received a good signal.
o VBER
Error value, after the Viterbi correction method.
figure 53: VBER
The result shown and obtained figure 49 of VBER measurement
is 10-7.
To get a good quality of image, there must be less than an error of transmission
per hour. In the VBER bar, the point with the 2x10⁻⁴ value (2 error bits each 10,000 bits)
is called Quasi-Error-Free. If the VBER value is on the left of this point, the result is
acceptable. Therefore, the signal received by the equipment is good.
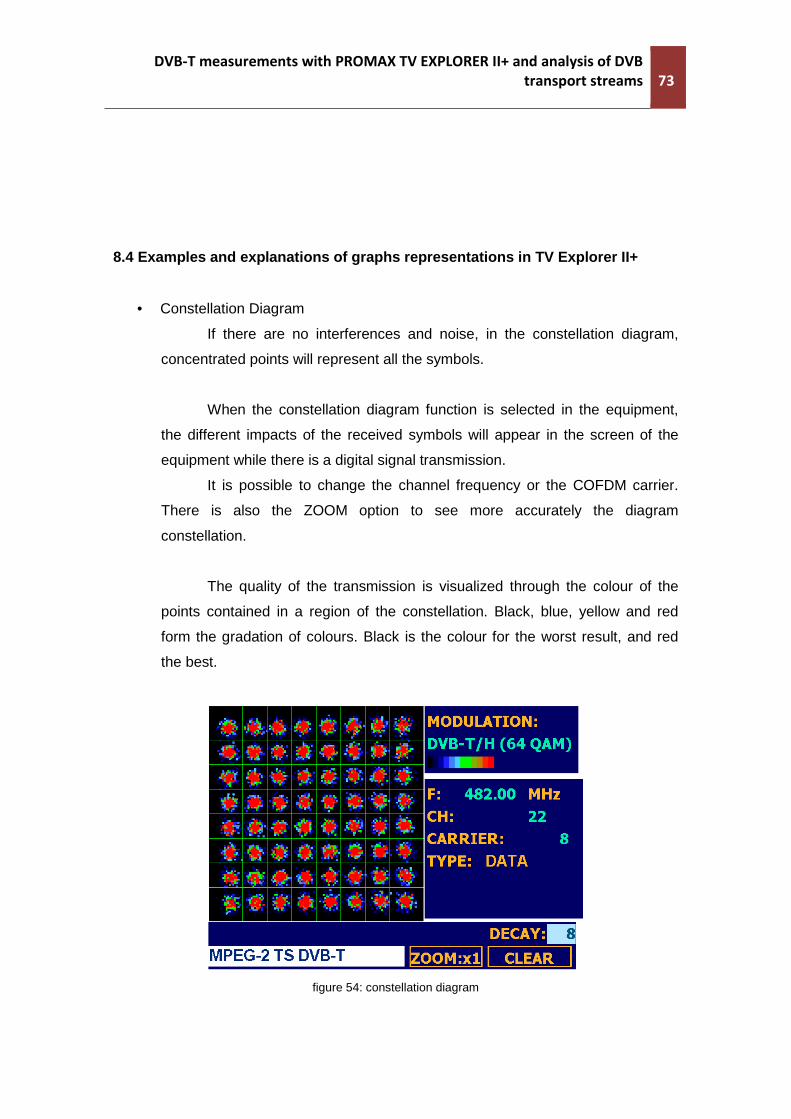
DVB-T measurements with PROMAX TV EXPLORER II+ and analysis of DVB
transport streams 73
8.4 Examples and explanations of graphs representations in TV Explorer II+
• Constellation Diagram
If there are no interferences and noise, in the constellation diagram,
concentrated points will represent all the symbols.
When the constellation diagram function is selected in the equipment,
the different impacts of the received symbols will appear in the screen of the
equipment while there is a digital signal transmission.
It is possible to change the channel frequency or the COFDM carrier.
There is also the ZOOM option to see more accurately the diagram
constellation.
The quality of the transmission is visualized through the colour of the
points contained in a region of the constellation. Black, blue, yellow and red
form the gradation of colours. Black is the colour for the worst result, and red
the best.
figure 54: constellation diagram
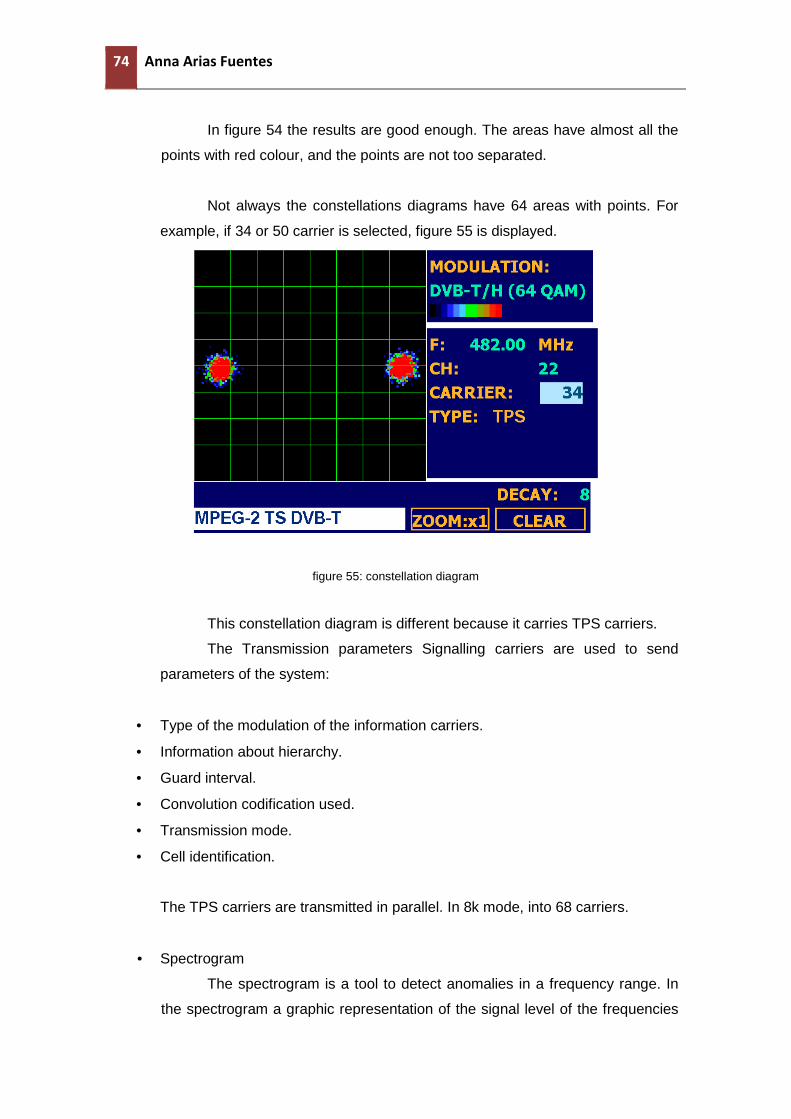
74 Anna Arias Fuentes
In figure 54 the results are good enough. The areas have almost all the
points with red colour, and the points are not too separated.
Not always the constellations diagrams have 64 areas with points. For
example, if 34 or 50 carrier is selected, figure 55 is displayed.
figure 55: constellation diagram
This constellation diagram is different because it carries TPS carriers.
The Transmission parameters Signalling carriers are used to send
parameters of the system:
• Type of the modulation of the information carriers.
• Information about hierarchy.
• Guard interval.
• Convolution codification used.
• Transmission mode.
• Cell identification.
The TPS carriers are transmitted in parallel. In 8k mode, into 68 carriers.
• Spectrogram
The spectrogram is a tool to detect anomalies in a frequency range. In
the spectrogram a graphic representation of the signal level of the frequencies
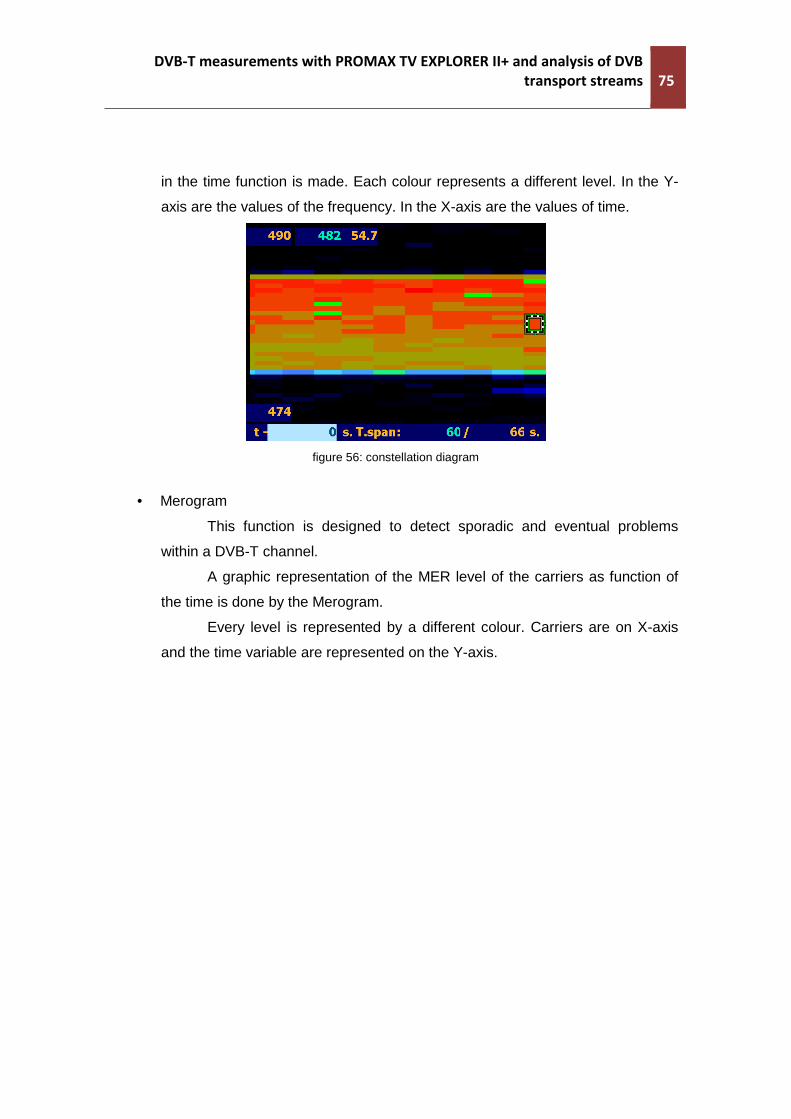
DVB-T measurements with PROMAX TV EXPLORER II+ and analysis of DVB
transport streams 75
in the time function is made. Each colour represents a different level. In the Y-
axis are the values of the frequency. In the X-axis are the values of time.
figure 56: constellation diagram
• Merogram
This function is designed to detect sporadic and eventual problems
within a DVB-T channel.
A graphic representation of the MER level of the carriers as function of
the time is done by the Merogram.
Every level is represented by a different colour. Carriers are on X-axis
and the time variable are represented on the Y-axis.

76 Anna Arias Fuentes
9. FINAL CONCLUSION
During my stay in Gent I could learn a lot about how television is transmitted. I did many tests with analog and digital signals. These tests help me understanding the learned knowledge.
To practice with the learned theory is really important. Because I could learn
more, understand and reassert part of different subjects that I have studied during my college in Barcelona.
I also think that this was a good experience to see the differences in television
system used in Belgium than Catalonia. To transmit and receive television there are many specified standards. But all
the countries have their characteristics. As in Belgium cable television is the system picket for the majority of the population. And the terrestrial is not much watched, it has just 3 channels.
In Catalonia analog signal is still transmitted. The next year the DVB will be
launched and analog television will disappear. Nowadays it is possible to receive both, analog and digital television. With the STB it is possible to receive many DVB-T channels (tens). And the cable television is not really used for Catalan citizens.
With my project the study of DVB signals is started in KaHo-Sint Lieven. The
next year surely will be another student continuing the study. Interesting things to study would be how to record transport stream. Because
right now it is only possible to record program streams. And maybe try it through the signals received by the USB receiver is a good idea.
My final conclusion about the Erasmus in general is that I have learned in all the
possible aspects. I studied a lot about important and interesting knowledge about my field, I knew people from the entire world, I learned how to live in a foreign country and I have improved my English and learned a little Dutch. I am really happy for all that I have lived in those months.
Anna Arias
DVB-T measurements with PROMAX TV EXPLORER II+ and analysis of DVB
transport streams 77
10. BIBLIOGRAPHY
WEBSITES
• http://www.dvb.org/
• http://www.sateliteinfos.com/actu/tp.asp/tp/16472/inicio-de-la-plataforma-
belga-telesat.html
• http://support.microsoft.com/default.aspx?scid=kb;en-us;184006
• http://www.bretl.com/mpeghtml/mpegpsi.HTM
• http://www.tdtzone.com/el-ber-y-su-medida.html
• http://www.etherguidesystems.com/Glossary/Default.aspx
• http://2000newsarchive.broadcastengineering.com/ar/broadcasting_cond
itional_access/
• http://www.etherguidesystems.com/Help/SDOs/MPEG/Syntax/Tablesecti
ons/cats.aspx
• http://www.aero.org/publications/crosslink/winter2002/04.html
• http://74.125.77.132/search?q=cache:W9CQbvAHPcoJ:cva.stanford.edu/
classes/ee482s/projects/group2_proposal.pdf+viterbi+algorithm+applicati
ons&cd=1&hl=ca&ct=clnk&client=firefox-a
• http://www.bbc.co.uk/rd/pubs/papers/paper_15/paper_15.shtml
• http://www.hdtvtotal.com/module-pagesetter-viewpub-tid-1-pid-954.html
DOCUMENTS
• "Sistemas audiovisuales I. Televisión analógica y digital", Edicions UPC 2000
from Francesc Tarrés (UPC Barcelona).
• Information technology — Generic coding of moving pictures and associated audio information: Systems from ISO/IEC 13818-1
• DVB information from Rohde&Schwarz
• Digital Video Broadcasting (DVB); DVB specification for data broadcasting from
78 Anna Arias Fuentes
ETSI
• MPEG fundamentals and protocol analysis from Tektronix
• AV communications documentation from Xavier Giró (UPC Terrassa-
Barcelona).