dvrpc’s use of openstreetmap and google transit feed … · dvrpc’s use of openstreetmap and...
TRANSCRIPT
DVRPC’s Use of OpenStreetMap and Google Transit Feed in Transportation Planning
March, 2011GIS-T Conference, Hershey, PA
Presented by:
Drashti Joshi, Wolfgang Scherr
DVRPC, Office of Modeling and Analysis
Outline
Travel forecasting at DVRPC The regional travel model (TIM) The network model
New data sources for the regional network model Google Transit feeds (GTFS) OpenStreetMap (OSM) Other
Creation of the network modelApplications
Transit service analysis Network flow simulation Travel time
Conclusions
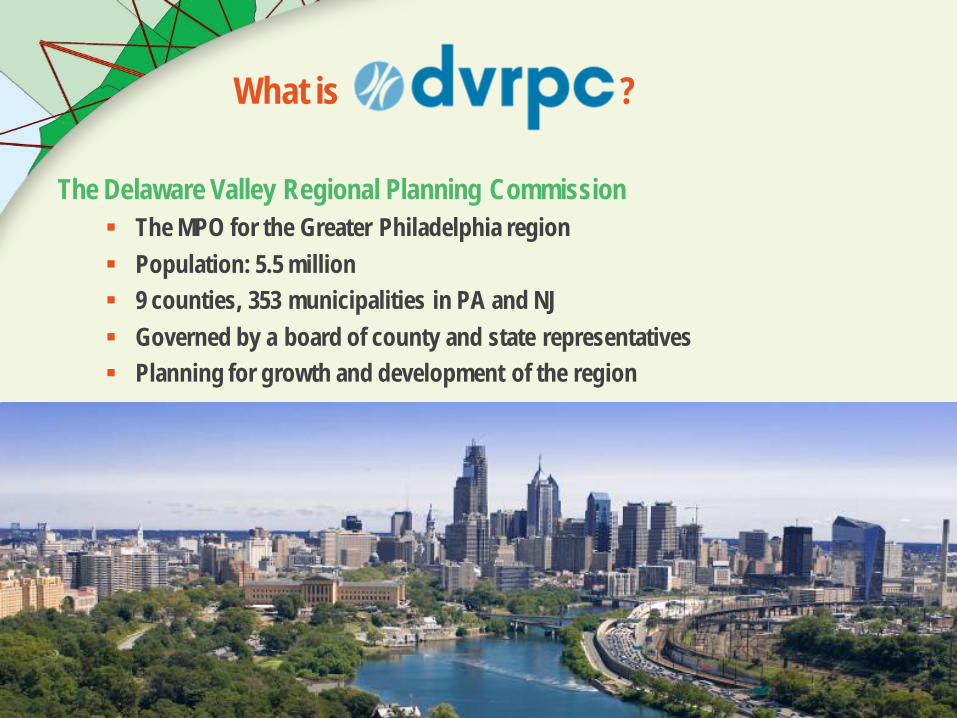
What is ?
The Delaware Valley Regional Planning Commission The MPO for the Greater Philadelphia region Population: 5.5 million 9 counties, 353 municipalities in PA and NJ Governed by a board of county and state representatives Planning for growth and development of the region
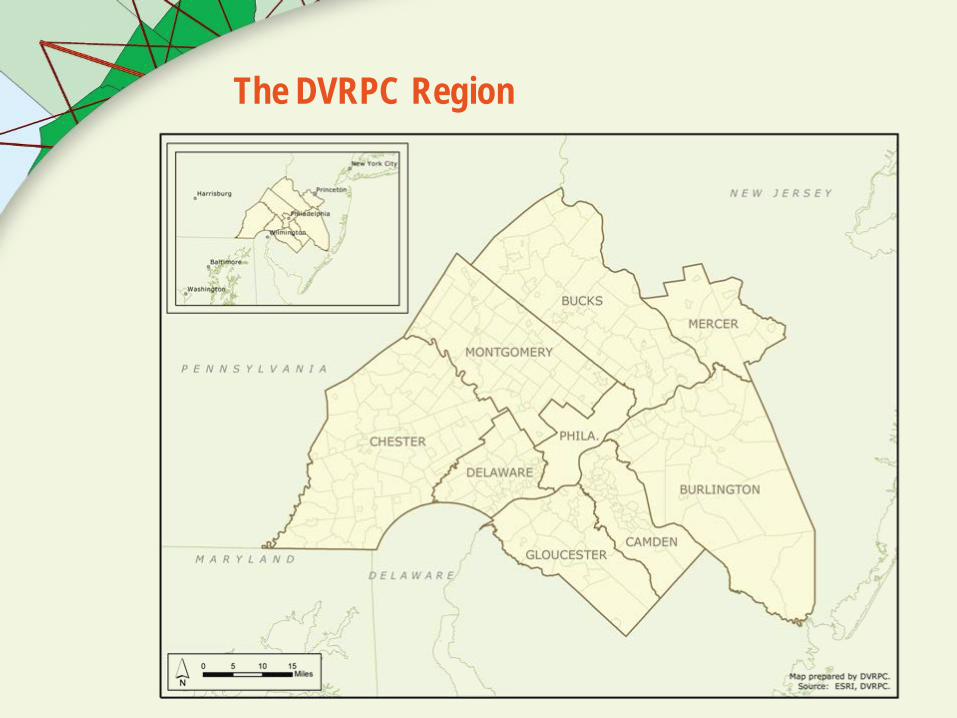
The DVRPC Region
DVRPC’s Travel Modeling
Office of Modeling 8 full time permanent staff Responsible for the majority of travel forecasts in the region Region-wide forecasts:
• Air quality conformity analysis• Long range planning
Detailed forecasts for subarea studies:• Highway alternatives analysis• Transit studies / FTA New Starts
The network model represents transport supply in the forecasting model allows to compute for the entire region:
• Travel times• Travel cost• Routes (paths) for highway vehicles • Routes (paths) for transit passengers
Data Sources for DVRPC’s Network Model (1)
When looking for data sources, we had choices: Government GIS Commercial street data: NAVTEQ, TeleAtlas Web 2.0 data
• The “new internet”• Open source geography data, emerging• Voluntary geographic information (VGI)• Examples: OpenStreetMap, Wikimapia, Google Earth
Requirements for DVRPC’s Network Model Geographically accurate Routable street data Reliable transit service data Automated updates if possible
Data Sources for DVRPC’s Network Model (2)
Data sources chosen for TIM 2.0: OpenStreetMap (OSM) – main source streets Google transit feeds (GTFS) – main source transit Regional GIS
• Street data for two counties (Philadelphia, Montgomery)• Boundaries, hydrography
Why web 2.0 data? OSM: Overall fair data quality, routability GTFS: Accurate schedules, regular updates, standardization Both: No copy right restrictions, no cost
The OpenStreetMap
www.osm.org Started in 2004 Organization: OSM foundation
• non-profit, based in the U.K. Volunteers
They generate the map• Upload data from their private GPS devices• Edit directly on www.osm.org
Local user groups • Currently no active user group in the Delaware Valley
Data distribution Free of charge Can be used for any commercial or non-commercial purpose Distributed under a “Creative Common” license agreement
• As users of the data, we give reference to the copy rightData content
Routable street network plus other geography U.S. data derived from an import of the 2005 TIGER file In the U.K., the data start being used in commercial navigation services
Google Transit Feeds (GTFS)
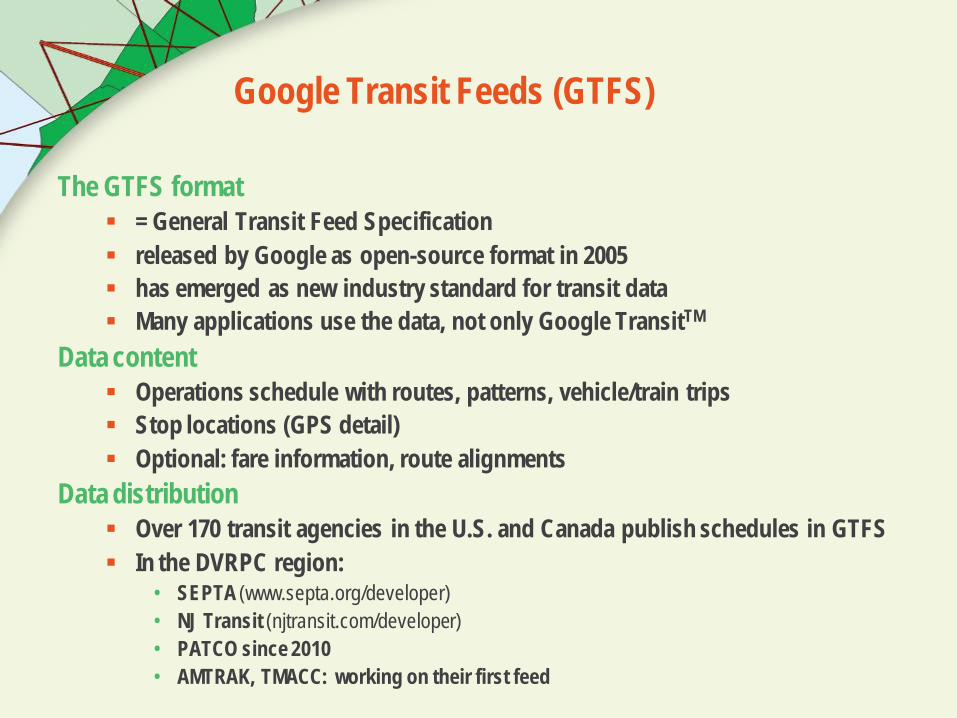
The GTFS format = General Transit Feed Specification released by Google as open-source format in 2005 has emerged as new industry standard for transit data Many applications use the data, not only Google TransitTM
Data content Operations schedule with routes, patterns, vehicle/train trips Stop locations (GPS detail) Optional: fare information, route alignments
Data distribution Over 170 transit agencies in the U.S. and Canada publish schedules in GTFS In the DVRPC region:
• SEPTA (www.septa.org/developer)• NJ Transit (njtransit.com/developer)• PATCO since 2010• AMTRAK, TMACC: working on their first feed
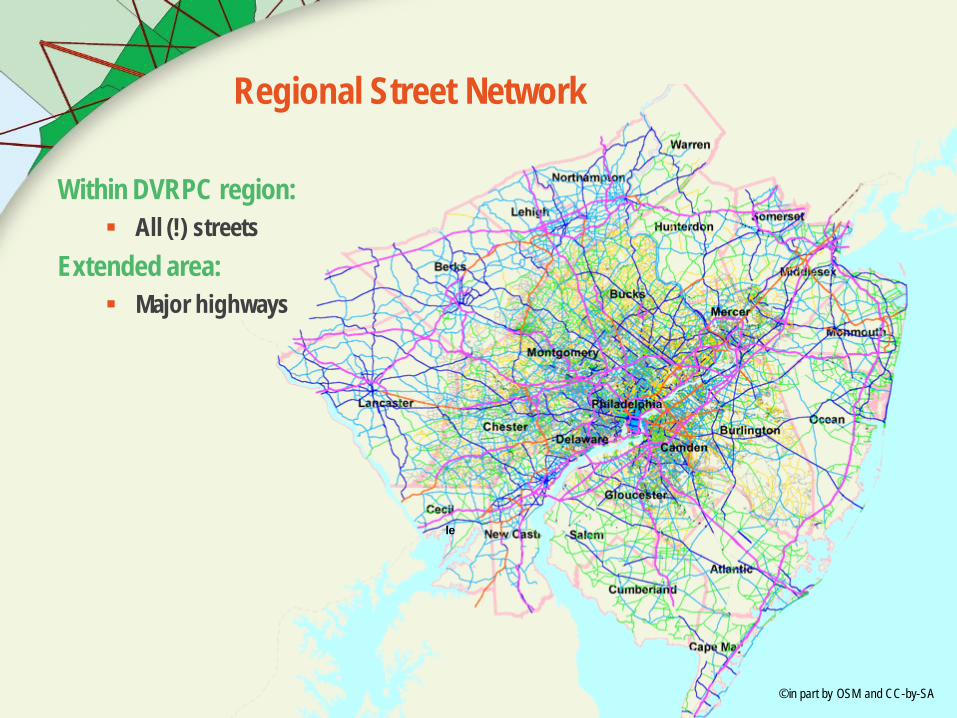
Regional Street Network
le
© in part by OSM and CC-by-SA
Within DVRPC region: All (!) streets
Extended area: Major highways
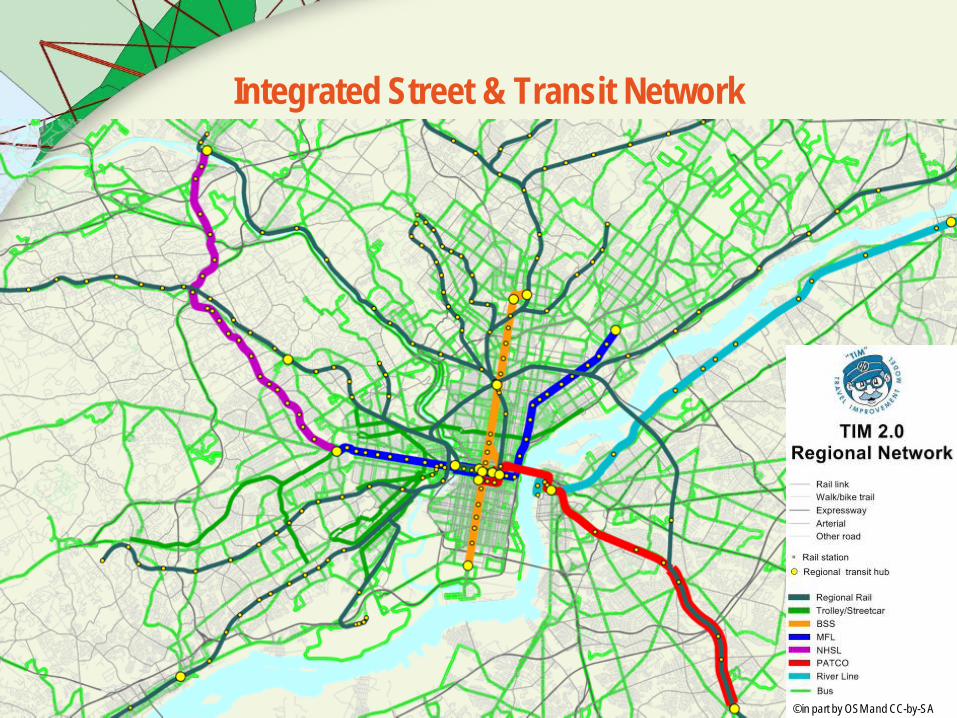
Integrated Street & Transit Network
© in part by OSM and CC-by-SA
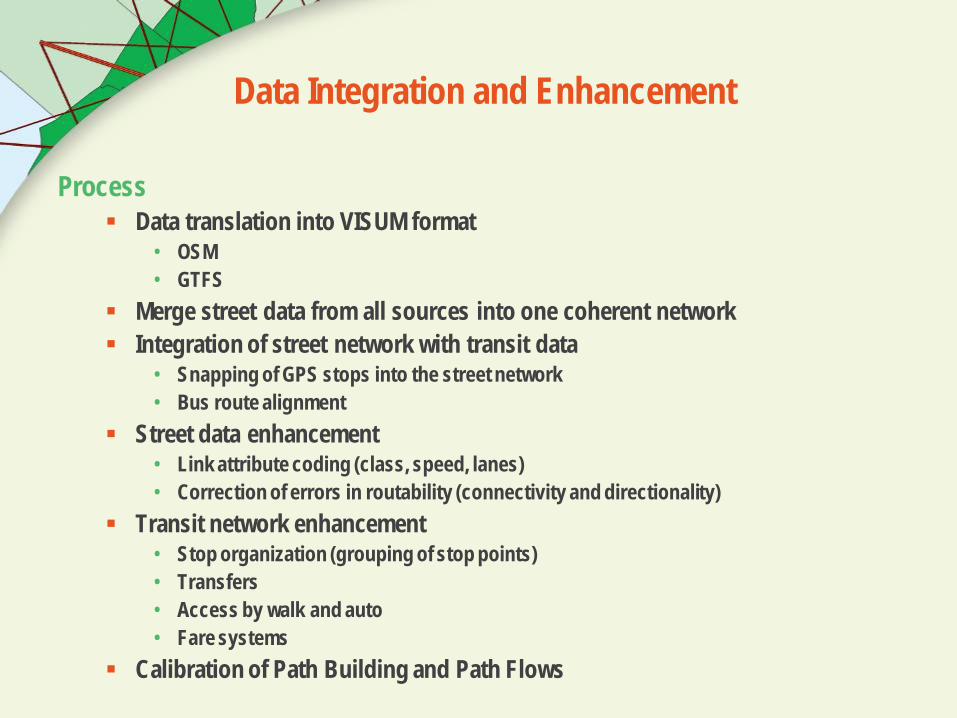
Data Integration and Enhancement
Process Data translation into VISUM format
• OSM• GTFS
Merge street data from all sources into one coherent network Integration of street network with transit data
• Snapping of GPS stops into the street network• Bus route alignment
Street data enhancement• Link attribute coding (class, speed, lanes)• Correction of errors in routability (connectivity and directionality)
Transit network enhancement• Stop organization (grouping of stop points)• Transfers• Access by walk and auto• Fare systems
Calibration of Path Building and Path Flows
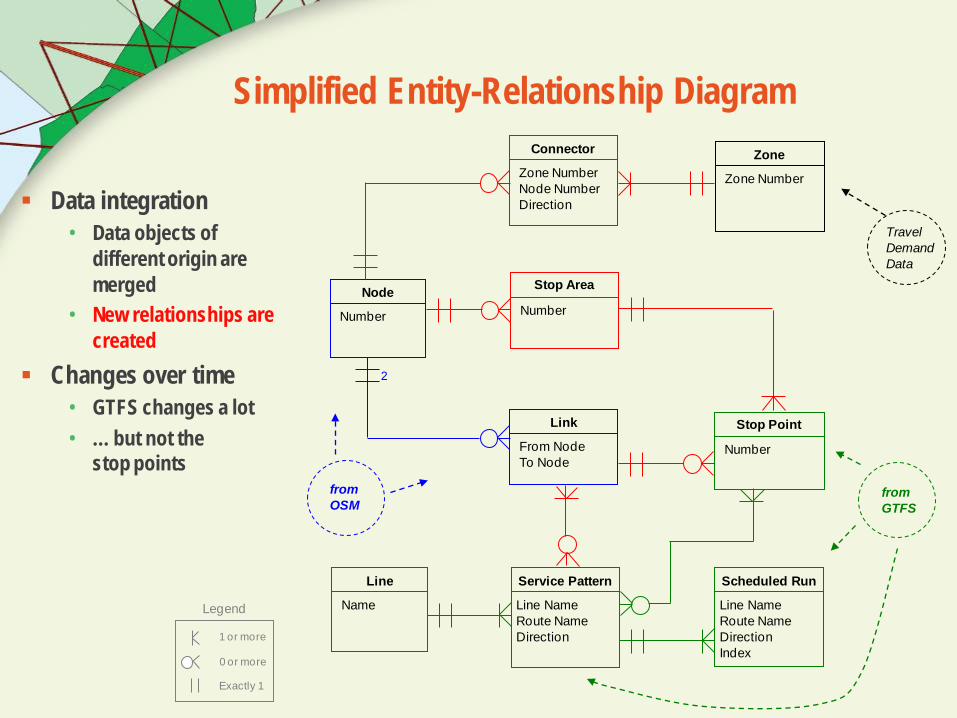
Simplified Entity-Relationship Diagram
Data integration• Data objects of
different origin are merged
• New relationships are created
Changes over time• GTFS changes a lot• … but not the
stop pointsfrom OSM
Stop Point
Number
Line
Name
Service Pattern
Line NameRoute NameDirection
Scheduled Run
Line NameRoute NameDirectionIndex
Travel DemandData
Stop Area
Number
from GTFS
Node
Number
Link
From NodeTo Node
2
1 or more
0 or more
Exactly 1
Legend
Connector
Zone NumberNode NumberDirection
Zone
Zone Number
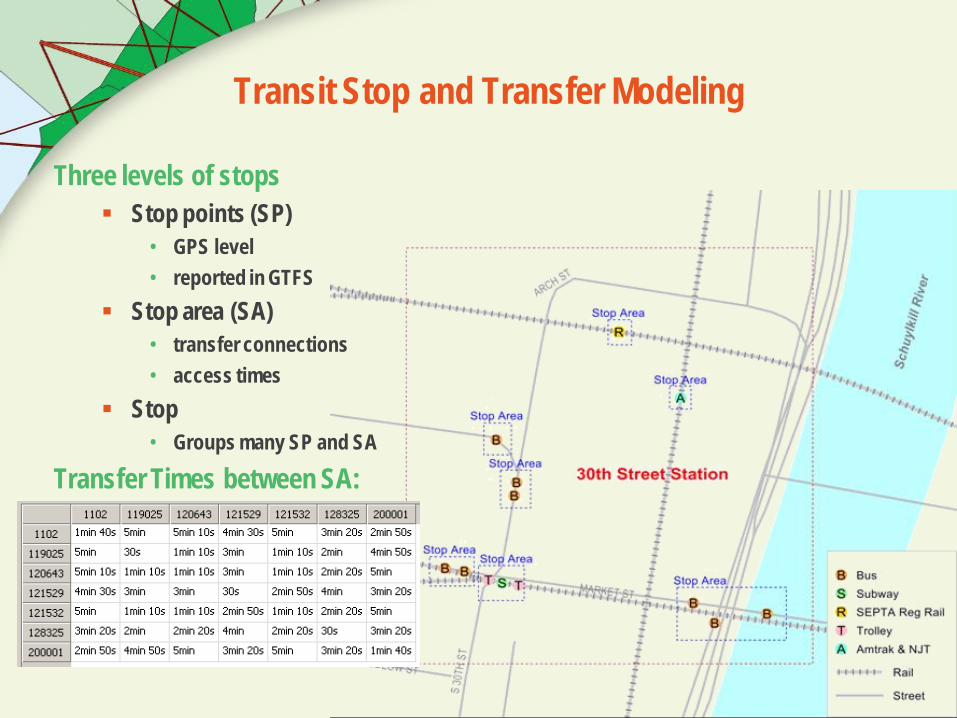
Transit Stop and Transfer Modeling
Three levels of stops Stop points (SP)
• GPS level• reported in GTFS
Stop area (SA)• transfer connections• access times
Stop• Groups many SP and SA
Transfer Times between SA:
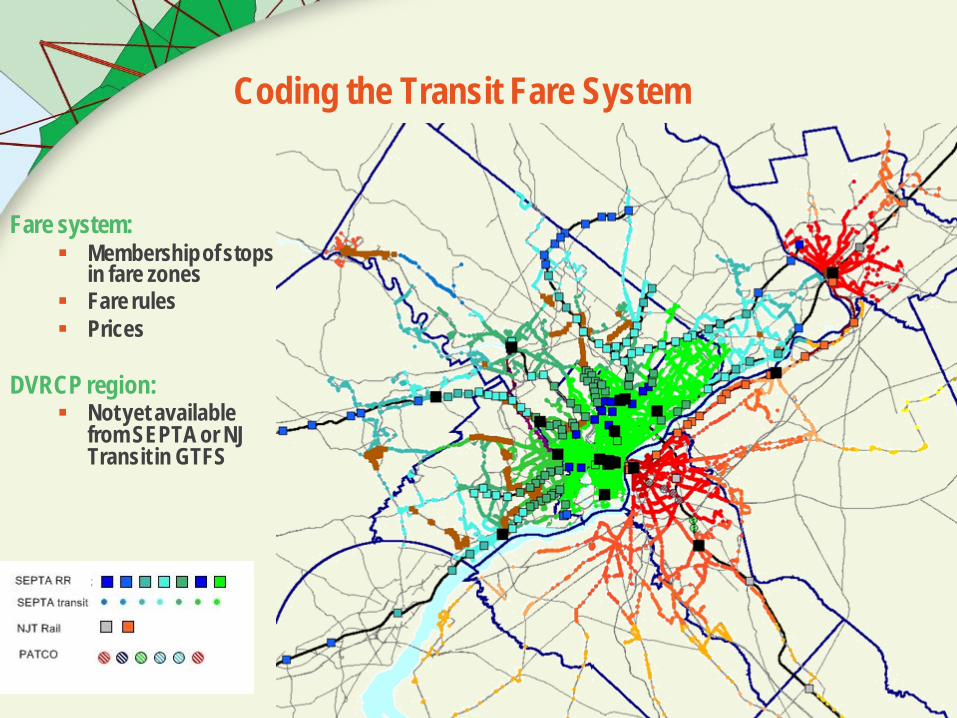
Coding the Transit Fare System
Fare system: Membership of stops
in fare zones Fare rules Prices
DVRCP region: Not yet available
from SEPTA or NJ Transit in GTFS
Applications
Examples on the following slides Transit service analysis (service frequency and speed) Network flow simulation (“assignment”) Travel time computation (“isochrones”)
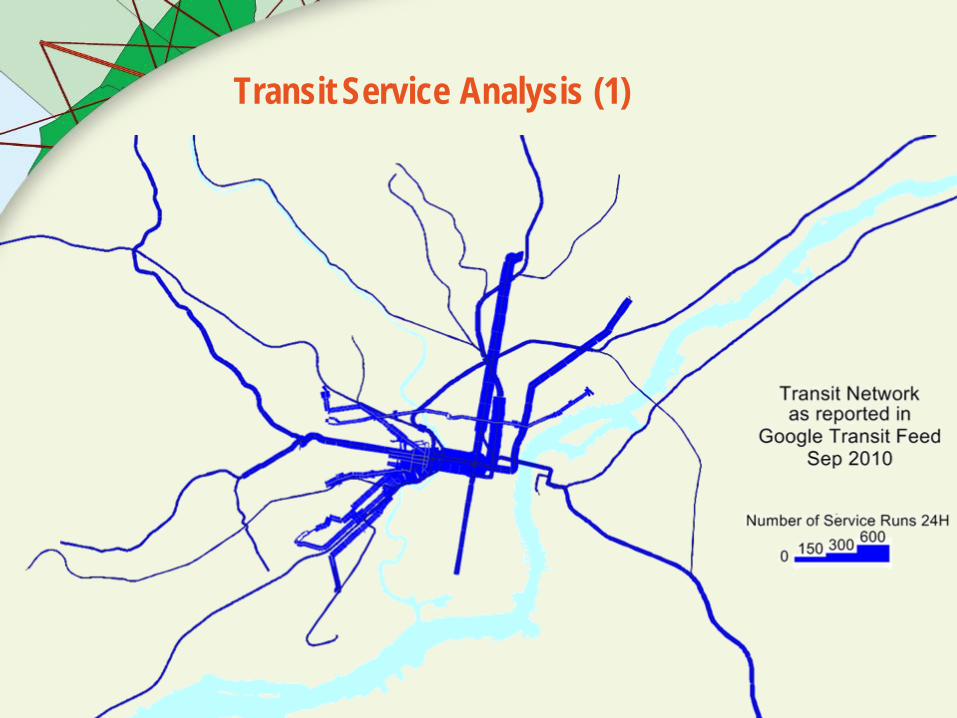
Transit Service Analysis (1)
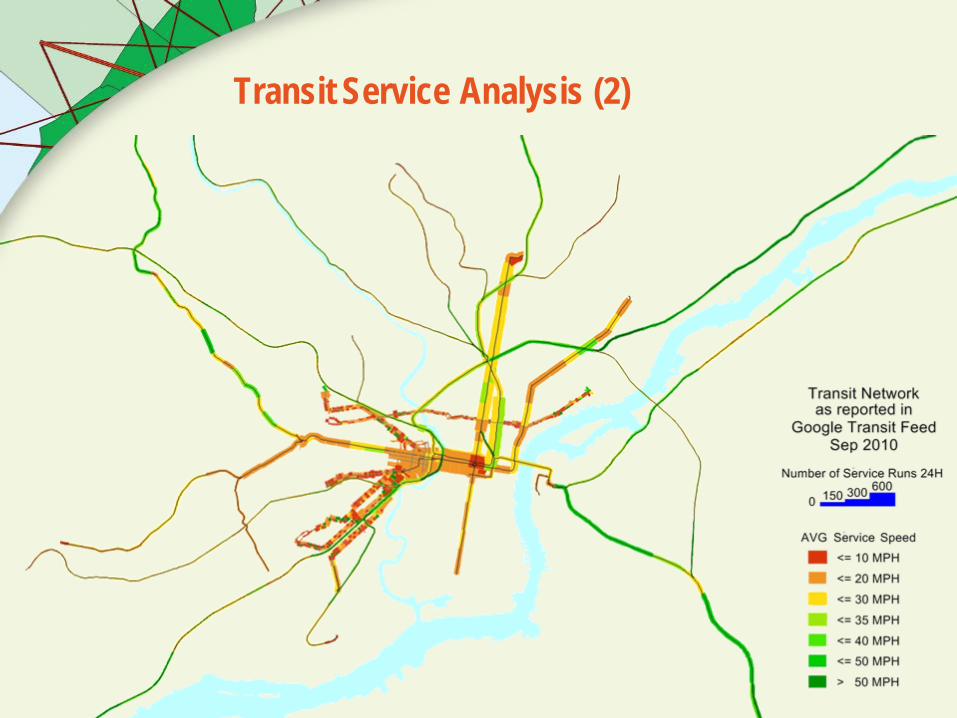
Transit Service Analysis (2)
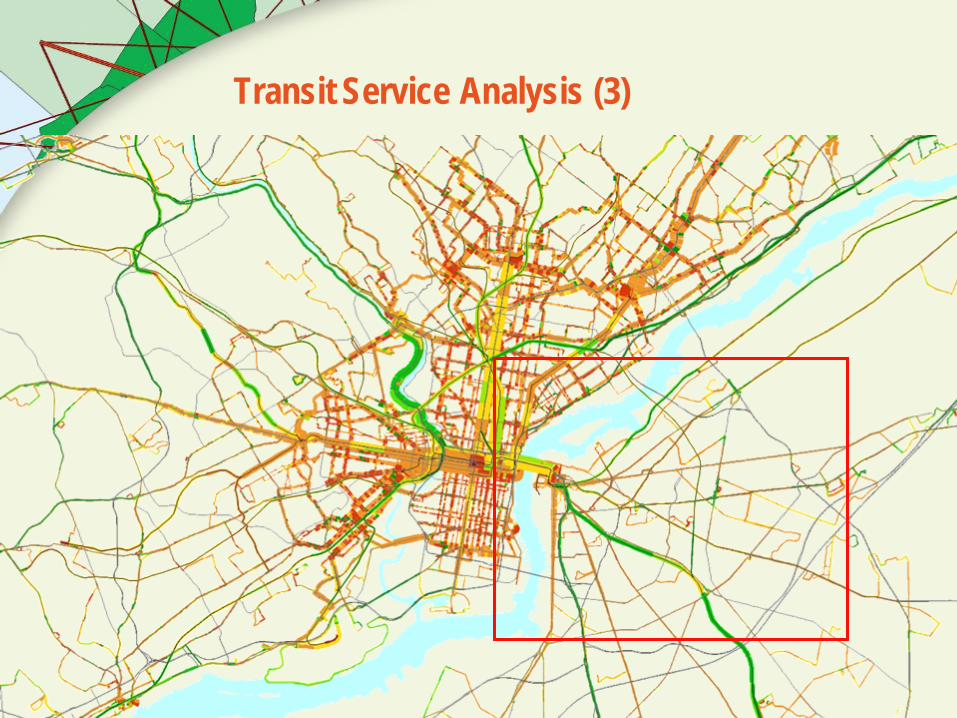
Transit Service Analysis (3)
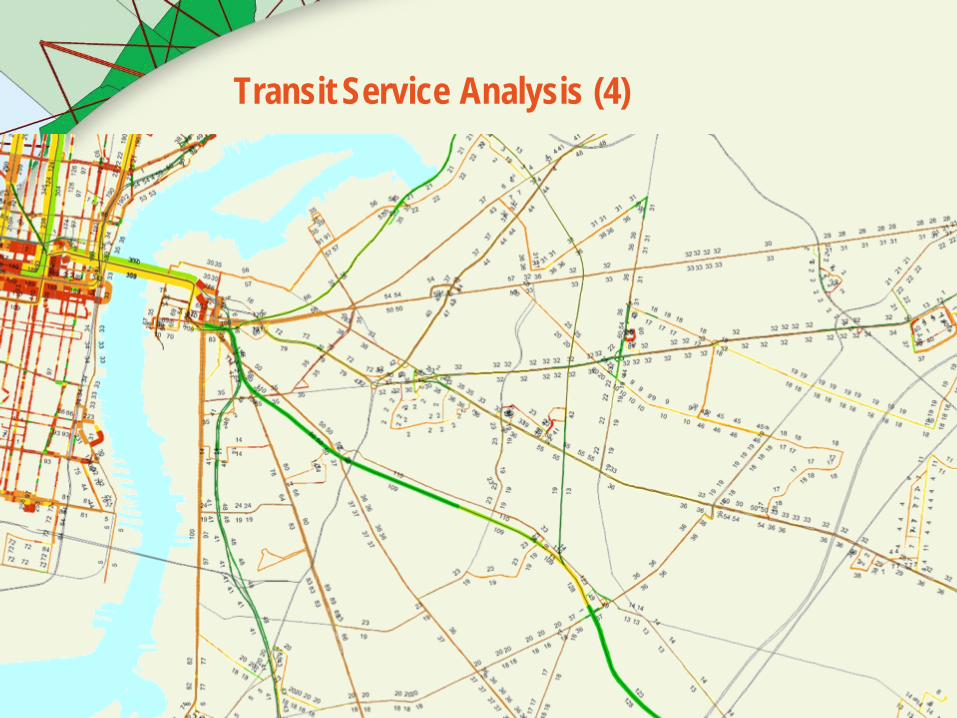
Transit Service Analysis (4)
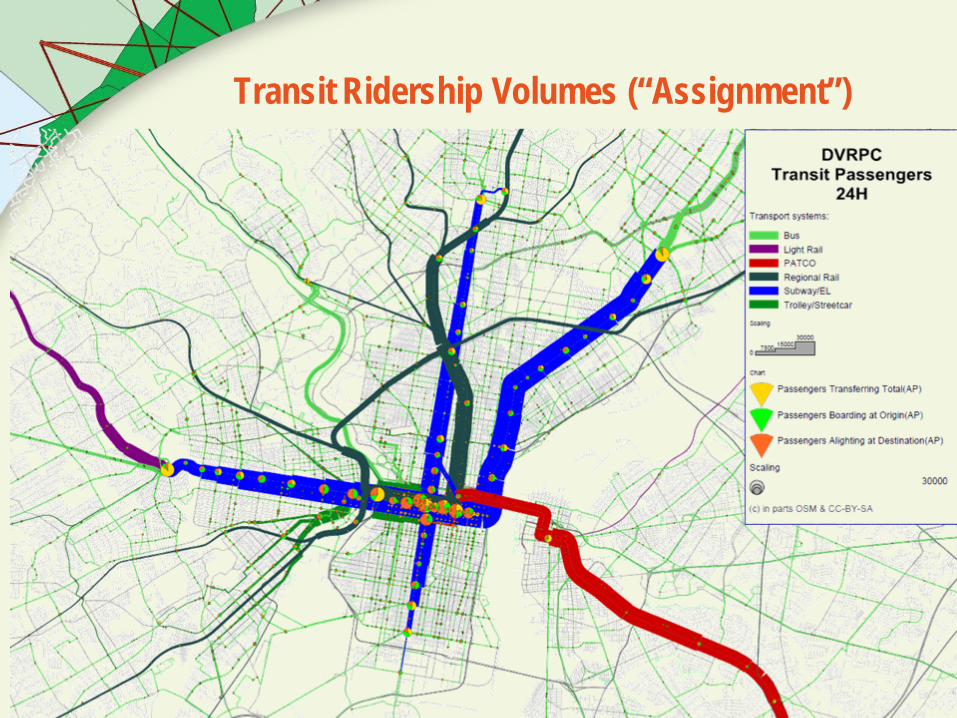
Transit Ridership Volumes (“Assignment”)
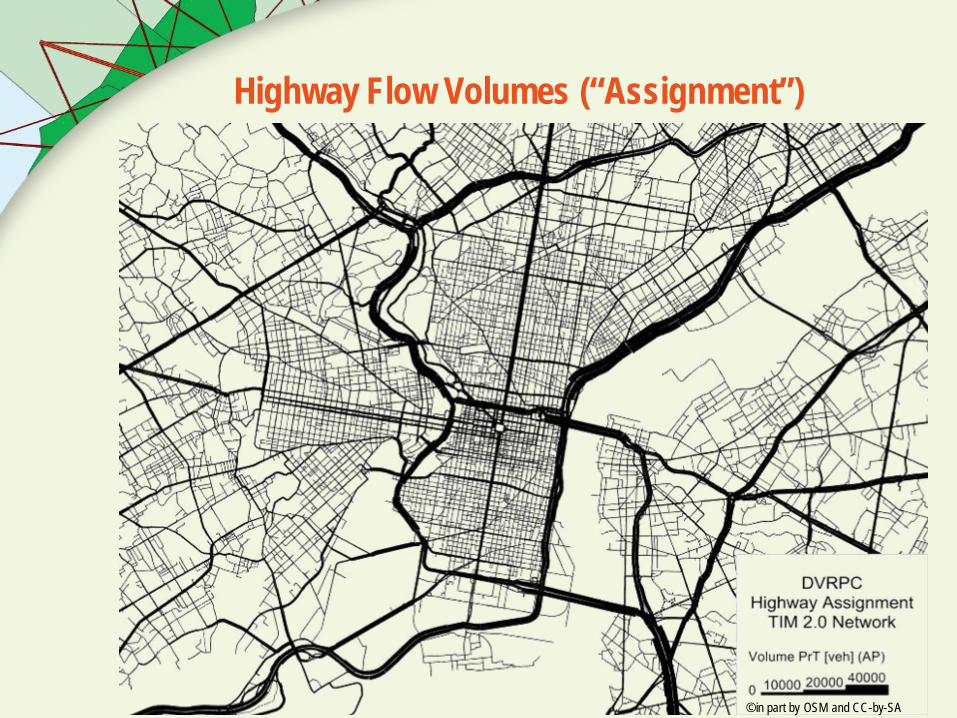
Highway Flow Volumes (“Assignment”)
© in part by OSM and CC-by-SA
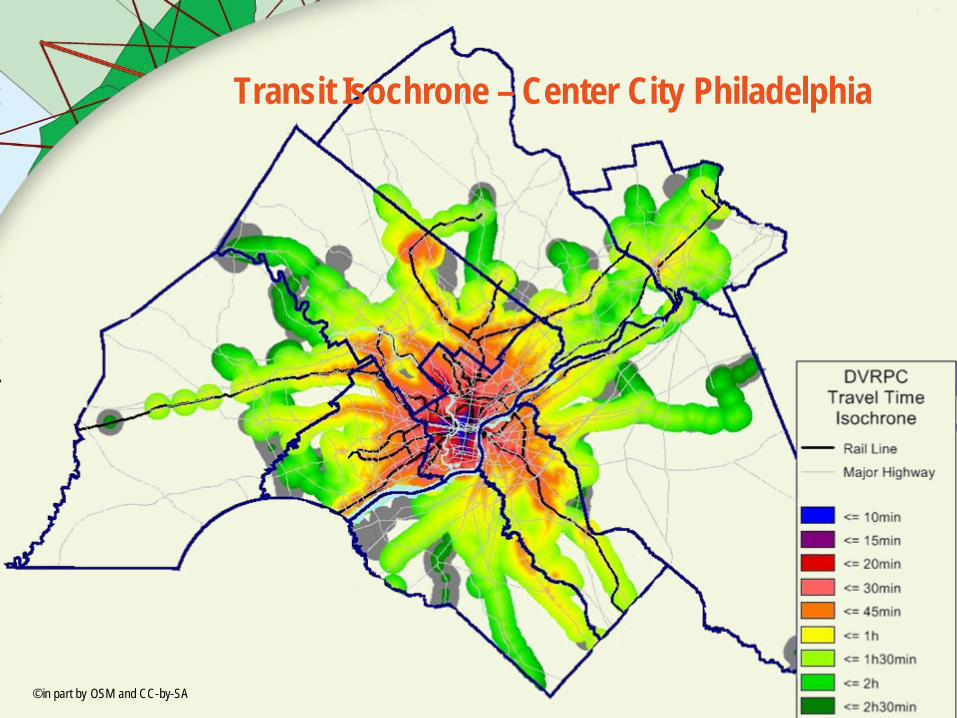
Transit Isochrone – Center City Philadelphia
© in part by OSM and CC-by-SA
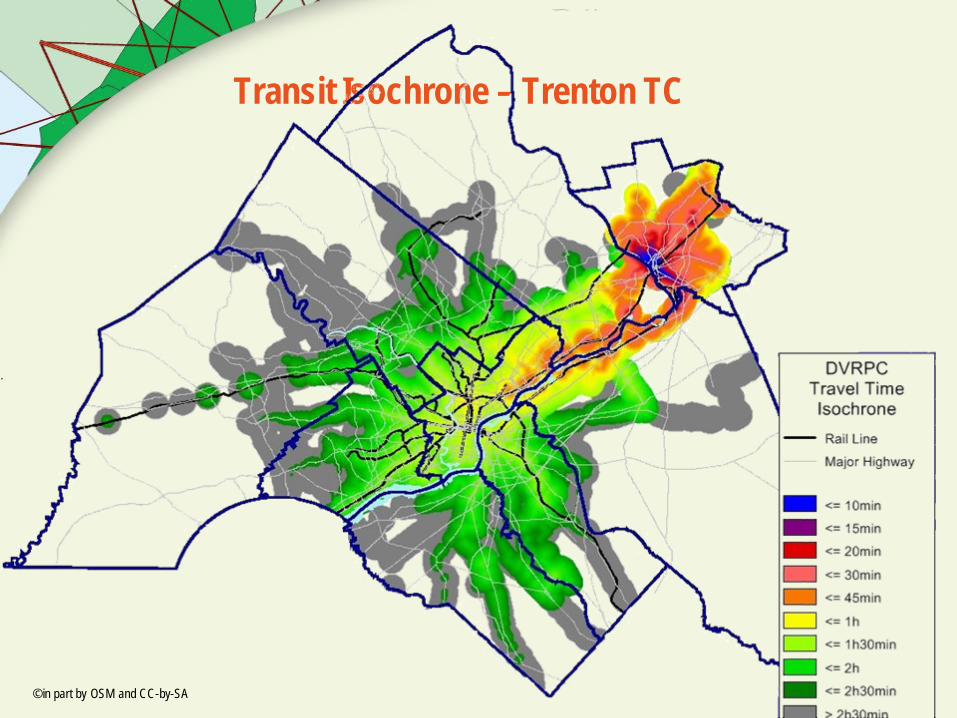
Transit Isochrone – Trenton TC
© in part by OSM and CC-by-SA
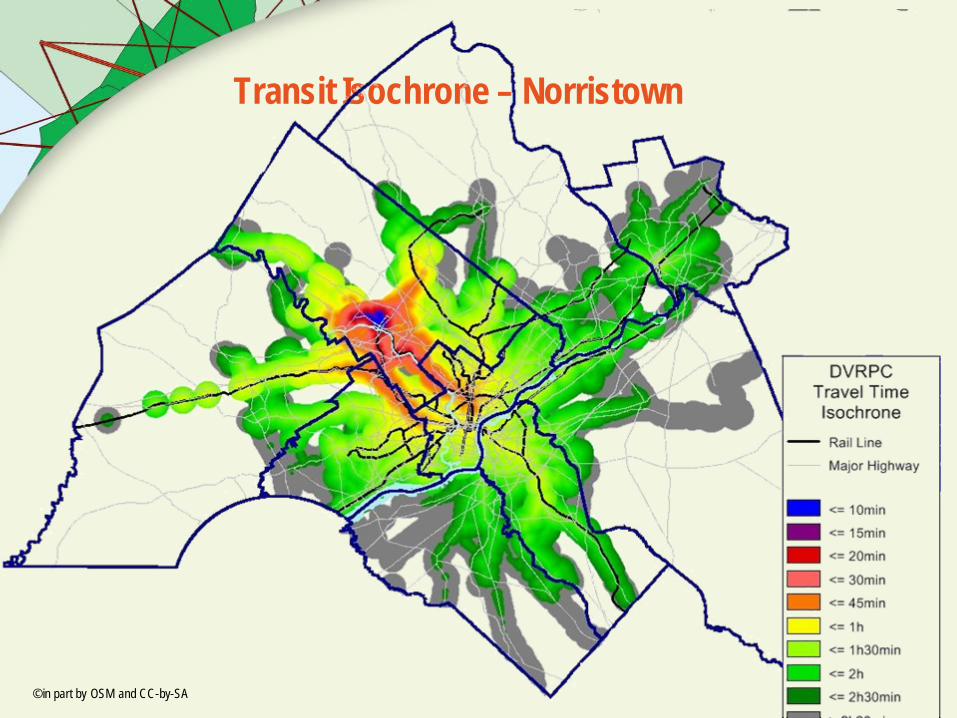
Transit Isochrone – Norristown
© in part by OSM and CC-by-SA

Transit Isochrone – Doylestown
© in part by OSM and CC-by-SA
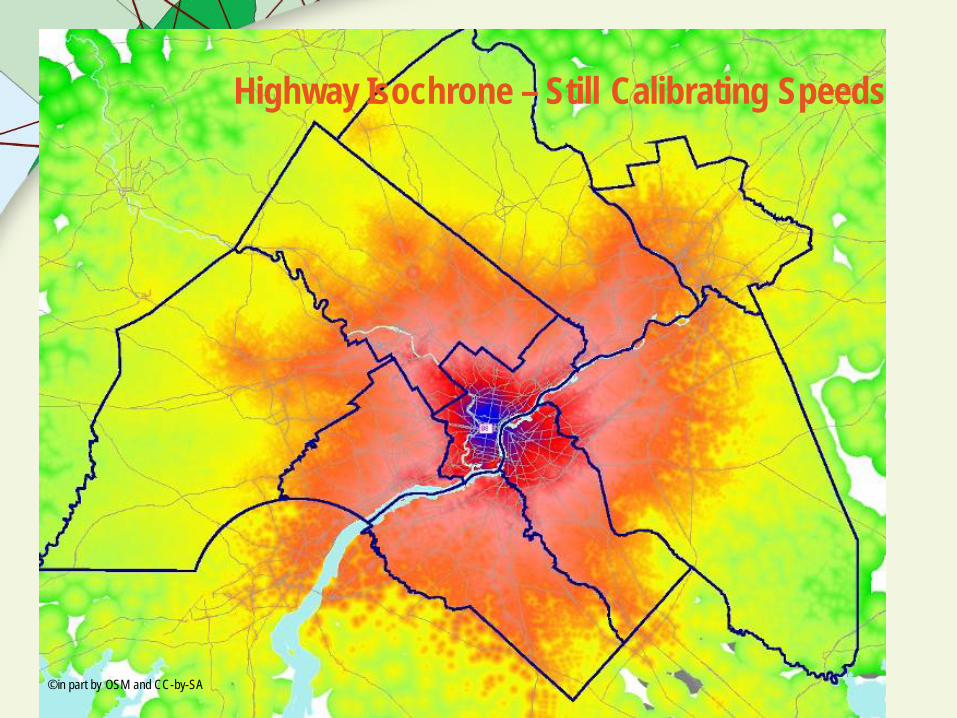
Highway Isochrone – Still Calibrating Speeds
© in part by OSM and CC-by-SA
Summary and Conclusions
Use of web 2.0 network data in a forecasting model To our knowledge, first MPO in the U.S. to do so Benefit from the OSM
• Provided routable street data • No cost, without copyright restrictions
Benefit from Google Transit feeds• Accurate representation of transit service in operational detail• Ability for regular updates in a standard format
Open question – future relationships with web 2.0 OSM was a one-time, one-way data exchange
• will someone feed our enhancements back? Established relationships with people behind the Google feeds (SEPTA, NJ Transit)
Benefits of the new network model for DVRPC Geographically accurate street representation High level of detail
• All streets• GPS bus stops• Long term benefits (activity-based model, non-motorized travel, operational studies)
Interaction between the modes• Better modeling of P&R, effect of buses on street capacity
Better representation of times of day Extended model area