dw global resource efficiency index - voxia.ch · source: iea, oecd, iot analytics, industry data...
TRANSCRIPT

Investing in a Fast Transforming World Systematic Global Equity Strategies
© DW Transformative & Disruptive Innovation
March 2017
DuraWealth

Meeting future market needs thanks to Innovations
DuraWealth 2 of 14
For qualified investors only
We live in a fast transforming world
Since over 250 years, the 1st, 2nd and 3rd Industrial revolutions lead to the increase of
life quality, saving of natural resources and wealth creation
Today, the global economy lives a structural transformation linked to the 4th Industrial
revolution
Industrial Revolution 4.0 from WEF Video Clip

It is a simple Investment Product, listed daily on SIX, with a fast implementation,
modest fee and managed by a strong Lead Manager: Bank Julius Baer
It uses the technology skills of the DW team to classify transformative technologies
It replicates the actively managed © DW Global Disruptive Innovation Index
It employs index methods developed in 2007, with real track records
It replicates strategies that adds alpha in bull and bear markets
It reflects long horizon societal trends with high market growth prospects of > 8% p.a.
It acts as portfolio diversifiers in global portfolios
DuraWealth 3 of 14
For qualified investors only
Why to invest in the DW Equity Tracker Certificate (AMC)
Equity Tracker

Longer Horizon Greater Outperformance vs. MSCI World and Index Peers (since 2010)
Performance of the © DW Global Disruptive Innovation Index
Source: FIS, DuraWealth (daily data, rounded, as of 31.01.2017)
EURCHF
USD
DuraWealth active 4 of 14
For qualified investors only
17.9%
19.0%
19.6%
18.5%
7.0%
5.1%
3.6%
13.1%
17.3%
0% 5% 10% 15% 20%
MSCI World Equity AC Index (NTR)
FTSE Environ. Opportunities 100 Index
MSCI Global Environment Index (P)
DW Global Resource Efficiency Index (TR)
DW Global Disruptive Innovation Index (TR)
Ann. Return (top bars)Ann. Risk (bottom bars): 01//2010 - present [CHF]
16.5%
18.0%
19.7%
16.7%
17.1%
12.0%
10.0%
8.5%
18.6%
23.0%
0% 5% 10% 15% 20% 25%
MSCI World Equity AC Index (NTR)
FTSE Environ. Opportunities 100 Index
MSCI Global Environment Index (P)
DW Global Resource Efficiency Index (TR)
DW Global Disruptive Innovation Index (TR)
Ann. Return (top bars)Ann. Risk (bottom bars): 01//2010 - present [EUR]
14.1%
16.2%
18.0%
14.9%
7.2%
5.3%
3.8%
18.1%
0% 5% 10% 15% 20%
MSCI World Equity AC Index (NTR)
FTSE Environ. Opportunities 100 Index
MSCI Global Environment Index (P)
DW Global Disruptive Innovation Index (TR)
Ann. Return (top bars)Ann. Risk (bottom bars): 01//2010 - present [USD]

Performance - Line charts
Source: FIS, DuraWealth (data as of 31.01.2017)
EURCHF
USD
DuraWealth 5 of 14
For qualified investors only
Longer Horizon Greater Value vs. MSCI World and Index Peers (since 2010)
50
100
150
200
250
300
350
01/2
010
05/2
01
0
09/2
010
01/2
011
05/2
01
1
09/2
011
01/2
012
05/2
01
2
09/2
012
01/2
013
05/2
013
09/2
013
01/2
014
05/2
014
09/2
014
01/2
015
05/2
015
09/2
015
01/2
016
05/2
016
09/2
016
01/2
017
DW Global Disruptive Innovation Index (TR) MSCI World Equity AC Index (NTR)
MSCI Global Environment Index (P) FTSE Environ. Opportunities 100 Index
Performance since 01/2010 [USD]
50
100
150
200
250
300
350
01/2
010
05/2
010
09/2
010
01/2
011
05/2
011
09/2
011
01/2
012
05/2
012
09/2
012
01/2
013
05/2
013
09/2
013
01/2
014
05/2
014
09/2
014
01/2
015
05/2
015
09/2
015
01/2
016
05/2
016
09/2
016
01/2
017
DW Global Disruptive Innovation Index (TR) MSCI World Equity AC Index (NTR)
MSCI Global Environment Index (P) FTSE Environ. Opportunities 100 Index
Performance since 01/2010 [CHF]
50
150
250
350
450
01/2
010
05/2
010
09/2
010
01/2
011
05/2
011
09/2
011
01/2
012
05/2
012
09/2
012
01/2
013
05/2
013
09/2
013
01/2
014
05/2
014
09/2
014
01/2
015
05/2
015
09/2
015
01/2
016
05/2
016
09/2
016
01/2
017
DW Global Disruptive Innovation Index (TR) MSCI World Equity AC Index (NTR)
MSCI Global Environment Index (P) FTSE Environ. Opportunities 100 Index
Performance since 01/2010 [EUR]

© DW Global Disruptive Innovation IndexExtracting Value from Global Equities through Innovation and Technology Screening
DuraWealth 6 of 14
For qualified investors only
Systematic Investment Process
Step 4: Quant Factor
Filter to select
30 stocks
Step 3: Systematic screening of companies with exposure to selected
technologies & sectors
Step 5:
Index
Step 1: Selection of multi-sector markets
Transformative & Disruptive Innovation
Step 2: Sub-sector allocation in related markets
Selection of transformative technologies
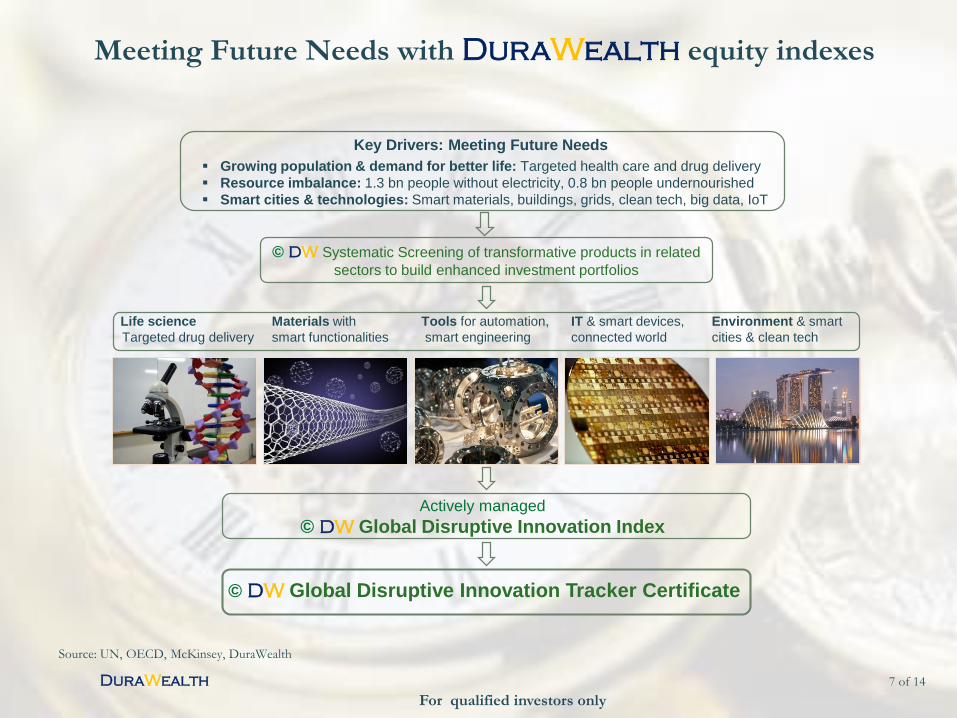
Meeting Future Needs with DuraWealth equity indexes
DuraWealth 7 of 14
For qualified investors only
Source: UN, OECD, McKinsey, DuraWealth
Life science
Targeted drug delivery
Materials with
smart functionalities
Tools for automation,
smart engineering
IT & smart devices,
connected world
Environment & smart
cities & clean tech
Key Drivers: Meeting Future Needs
Growing population & demand for better life: Targeted health care and drug delivery
Resource imbalance: 1.3 bn people without electricity, 0.8 bn people undernourished
Smart cities & technologies: Smart materials, buildings, grids, clean tech, big data, IoT
Actively managed
© DW Global Disruptive Innovation Index
© DW Systematic Screening of transformative products in related
sectors to build enhanced investment portfolios
© DW Global Disruptive Innovation Tracker Certificate

Source: IEA, OECD, IoT Analytics, industry data
Companies producing transformative technologies are included in the © DW Global Disruptive
Innovation Certificate Portfolio
These technologies allow for saving of ± 30% in electricity, water, heating and natural resources
Efficient Use of Resources ► Positive Societal Impact
© DW Systematic Screening of transformative productsExtracting Value from Global Equities through Innovation and Technology Screening
DuraWealth 8 of 14
For qualified investors only
5 sectors 20+ application areas (A1…) 30+ transformative technologies 55+ companies
2
3
1
A1
5
4
A2
Time 2010 - 2020+
Environment Smart Home Connected appliances Smart fridges, lights
Materials Wearables Composites Smart glasses, watches
Life Science Connected Health Genomics Non-invasive cures
Inf. Technology 2D/3D IT-architectures Quantum computing
Tools Electron Microscopes Photolithography Automation .
Industrial Internet Remote asset & car control 3D printing
Smart Grids & City Smart metering Smart environ. mgmt.

DW Global Disruptive Innovation Tracker (AMC) - Summary
DuraWealth 9 of 14
For qualified investors only
The DW Global Disruptive Innovation Index tracks performance of 30 listed stocks, with established
quantitative methods since 2007. The Index is focused on firms operating in the areas of transformative
technologies, regrouped in five sectors: life sciences, tools, materials, environment and IT
This Index weighting is UCITS-compliant, reviewed quarterly, rebalanced twice a year. The Tracker replicates the
Index by direct investing in the thirty selected companies
An achieved outperformance over
• Key index peers incl. MSCI, S&P, SGI Indexes
• Key asset classes incl. MSCI World Equity, Bloomberg Commodity, HFRX Hedge Funds, S&P Private Equity
• The Index is calculated since 07/2013
Source: FIS (USD, as of 30.12.2016),
DuraWealth
Country allocation Currency allocation Sector (ICB) allocation Stock selection top 5
3.5%
3.5%
3.6%
3.6%
3.7%
3.0% 3.3% 3.5% 3.8% 4.0%
Alexion
Mobileye
AsmlHolding
HitachiHigh-Tech
Tesla
9.9%
16.6%
16.5%
26.7%
30.4%
0% 25% 50%
Industrials
Basic Materials
Consumer Goods
Technology
Health Care
3.4%
6.8%
20.3%
26.1%
43.4%
0% 10% 20% 30% 40% 50%
DKK
GBP
EUR
JPY
USD
3.2%
3.3%
3.4%
6.8%
10.4%
13.4%
26.1%
33.5%
0% 15% 30% 45%
Denmark
Netherlands
South Korea
Taiwan
UK
Germany
Japan
USA

Team
DuraWealth 10 of 14
For qualified investors only
Miroslav Durana, Partner, Investor Relations & Wealth Management 2005-2013: Head of index development at Credit Suisse
1997-2005: Senior portfolio manager & Research analyst at LODH, UBP and a pension fund,
managed portfolios of over CHF 1 bn in assets
MSc., PhD in Physics (ETH Zurich, Lausanne), MBA (HEC Lausanne)
Wayne Cawood, Partner, Chief Technology Officer (CTO) & Internal Controlling 1995-2016: Senior business consultant & IT manager at WCT Consulting, Orange Communications
SA (Suisse) and a South African electricity company
M.Com. in Business Management (University of Johannesburg)
Jean de Skowronski, Partner, Investor Relations & Wealth Management 2013-2015: UHNWI coverage at Credit Suisse
2009-2013: Head Swiss Financial Institutions and Public Sector at BNP Paribas
1988-2008: Head DCM Origination at CSFB & Credit Suisse
Master in Law (University of Fribourg), Attorney-at-Law (Geneva bar), MBA (INSEAD)
Pierre Montezin, Partner, Risk Management & Compliance 2013-today: Risk Manager at Osiris
1990-2007: Senior portfolio & fund manager and broker at various asset management companies incl.
EIM, Swiss Capital Alternative Investments, MAN Investments and Société Générale
Master of Business Law (Université de Paris II), Master of Economy and Finance (SciencesPo Paris)
with a team of investment professionals from S&P Dow Jones, Julius Baer, LLB AG and PwC AG

Company’s Background
DuraWealth 11 of 14
For qualified investors only
We do systematic investing since 2007
Dr. Durana et al. managed the 1st alternative energy index (DAXglobal®) for Deutsche
Börse and the 1st resource efficiency and frontier markets indexes in cooperation with
S&P Dow Jones (AuM of over CHF 2 bn – 2007-2013)
Managing the © DW Global Resource Efficiency Index (Bloomberg Ticker:
DWREUTR Index) in cooperation with S&P Dow Jones and the © DW Global
Disruptive Innovation Index 1 (2013 onwards)
1 Note: before named © DW Global Equity Innovation Index (until June 30, 2016)
DuraWealth is a pioneer in Active Systematic Equity Investing

Who is DuraWealth
DuraWealth 12 of 14
For qualified investors only
DuraWealth is a licensed asset management company founded in 2014, supervised
by the Financial Market Authority (FMA) in Liechtenstein, and is a pioneer in
Responsible Investing and listed Equity Trackers with positive societal impacts
DuraWealth cooperates with S&P Dow Jones, Bank Julius Baer, LLB AG
DuraWealth is a pioneer in Active Systematic Equity Investing

This Certificate is to be listed and daily priced on the Swiss Stock Exchange (SIX) under
ISIN number CH0328482945 soon
The Lead Manager is Bank Julius Baer ► www.juliusbaer.com
DuraWealth 13 of 14
For qualified investors only
Launching the Julius Baer Actively Managed Certificate (AMC) on
the © DW Global Disruptive Innovation Index (Equity Strategy)
The DW Global Disruptive Innovation Tracker to be listed

Incorporation data
DuraWealth Ltd. is an asset management company in Schaan (FL), supervised by the FMA
Main office: Fanalwegle 1, FL-9494 Schaan, Contact: [email protected]
Website: www.durawealth.com
DISCLAIMERThis document was produced by DuraWealth and is dedicated for informational purposes only. It is dedicated for internal use only of the receiver and shall not be
partly or fully copied, reproduced or distributed externally conform to Swiss, Liechtenstein and any applicable foreign law. The information in this document is
based on sources considered to be reliable, but its accuracy and completeness is not guaranteed. The information is subject to change at any time and without
obligation to notify the investors. Unless otherwise indicated, some figures are unaudited. Any action derived from this information is always at the investors’ own
risk. This document is not an official confirmation of terms. Past performance is no indication of future performance, and some performance data do not take
account of the commissions and costs incurred on the issue and redemption of shares or fund units. The information does not release the recipient from making
his / her own assessment. In particular, the recipient is advised to assess the information, with the assistance of an advisor if necessary, with regard to its
compatibility with his/her own circumstances in view of any legal, regulatory, tax and other implications.
This document is expressly not intended for persons who, due to their nationality / place of residence or their investor’s profile, are not permitted to access to
such information under Swiss, Liechtenstein and any applicable foreign law.