dwarakanath, b. s. - transient elevation of glycolysis … transient elevation of glycolysis confers...
TRANSCRIPT

1
Transient elevation of glycolysis confers radio-resistance by facilitating DNA repair in cells Anant Narayan Bhatt, Ankit Chauhan, Suchit Khanna, Yogesh Rai, Saurabh Singh, Ravi Soni, Namita Kalra and B S Dwarakanath*
Metabolic and Cell Signaling Group, Division of Radiation Biosciences, Institute of Nuclear Medicine and Allied Sciences, Delhi 110 054
Key words: DNP, respiratory modifiers, glycolysis and radio-resistance
Author for correspondence
B S Dwarakanath
Metabolic & Cell Signaling Group
Division of Radiation Biosciences
Institute of Nuclear Medicine and Allied Sciences
Brig SK Mazumdar Road
Delhi 110 054
INDIA
Telephone: (+91) 11 2391-8838
Fax: (+91) 11 2391-9509
E-mail: [email protected], [email protected]
2
Abstract
Cancer cells exhibit increased glycolysis for ATP production (the Warburg effect)
and macromolecular biosynthesis; it is also linked with therapeutic resistance that
is generally associated with compromised respiratory metabolism. The molecular
mechanisms by which elevated glycolysis leads to radio-resistance in cells
remain incompletely understood. To dissect the mechanisms underlying
glycolysis induced radio-resistance we stimulated glycolysis using mitochondrial
respiratory modifiers (MRMs viz. di-nitro phenol, DNP; Photosan-3, PS3;
Methylene blue, MB) in established human cell lines (HEK293, BMG-1 and OCT-
1) and investigated their radiation response. MRMs induced the glycolysis by
enhancing the levels of two important regulators of glucose metabolism GLUT-1
and HK-II and resulted in 2 fold increase in glucose consumption and lactate
production. This increase in glycolysis resulted in resistance against radiation-
induced cell death (clonogenic survival) in different cell lines at an absorbed dose
of 5 Gy. Inhibition of glucose uptake and glycolysis (using fasentin, 2-deoxy-D-
glucose and 3bromopyruvate) in DNP treated cells failed to increase the
clonogenic survival of irradiated cells, suggesting that radio-resistance linked to
inhibition of mitochondrial respiration is glycolysis dependent. Elevated glycolysis
also facilitated rejoining of radiation-induced DNA strand breaks by activating
both non-homologous end joining (NHEJ) and homologous recombination (HR)
pathways of DNA double strand break repair leading to a reduction in radiation-
induced cytogenetic damage (micronuclei formation) in these cells. These
findings suggest that enhanced glycolysis generally observed in cancer cells may
be responsible for the radio-resistance and partly by enhancing the repair of DNA
damage.
Introduction
Ionizing radiation plays an important role in the management of a majority of
malignancies [1], although many tumors like glioma and several carcinomas are

3
known to be refractory to radiotherapy with marginal benefits in survival.
However, the molecular mechanisms underlying this radio-resistance of cancer
cells remain poorly understood. One of the most common signatures of highly
malignant tumors is their capacity to metabolize more glucose to lactic acid than
normal tissues, which confers a selective growth advantage [2]. Cells derived
from hypoxic tumors typically maintain their metabolic phenotypes even under
normoxic culture conditions (Warburg effect), indicating that aerobic glycolysis is
constitutively upregulated through stable genetic or epigenetic changes [2]. It is
also reported that mitochondrial defect linked stabilization of HIF1a induces
glycolytic phenotype in cancer cells and promotes aggressiveness of tumors [2,
3]. On the other hand, efficient oxidative phosphorylation in cancer cells is
required for execution of apoptosis through the generation of reactive oxygen
species (ROS) [4]. Therefore, metabolically reprogrammed and highly glycolytic
cancer cells can easily escape the death processes, conferring resistance to
therapeutic modalities [5].
The phenotypic characteristics of enhanced glycolysis associated with
tumors have been well exploited for the diagnosis of the disease using fluoro-
deoxy glucose (FDG) based positron emission tomography (PET) imaging and
the efficacy of glycolytic inhibitors as sensitizers to radiation and
chemotherapeutic drugs has established in pre-clinical studies, while clinical trials
are at different stages of evaluation [6-9]. Considerable amount of evidences
suggest that inhibition of glycolysis leads to compromised DNA repair, which is
accompanied by the depletion of energy [ATP and AXP (AMP and ADP)] in cells
with high rates of glycolysis like the cancer cells, causing death [10-14]. However,
the mechanisms underlying enhanced resistance to radiationinduced cell death in
cells with high endogenous rates of glycolysis, like the cancer cells are not
completely understood, although alterations in pH and lactate levels have been
implicated [2]. Therefore, present studies were undertaken to examine if transient

4
stimulation of glycolysis (before irradiation) using MRMs is sufficient to confer
radioresistance and also to unravel the underlying mechanisms. Results obtained
in human malignant and non-malignant cell lines clearly show that stimulation of
glycolysis using MRMs reduces radiation-induced cell death by enhancing the
repair of DNA damage leading to a reduction in the mitotic death linked to
cytogenetic damage (micronuclei formation).
Materials and Methods:
Materials
Dulbecco’s Minimum Essential Medium (DMEM), Penicillin G, Streptomycin,
Nystatin, Dimethyl sulfoxide (DMSO), Dichlorodihydrofluorescein diacetate
(H2DCFH-DA), Potassium chloride (KCl), Magnesium chloride (MgCl2), Ethylene-
di-amine-tetra acetate
(EDTA), Protease inhibitor cocktail, HEPES, Hochest-33258 (H258), propidium iodide
(PI), RNAase, Di-nitrophenol and methylene blue were procured from Sigma
chemicals Co. (St Louis, USA). Photosan (PS3) was procured from See Lab,
Germany. Bicinchoninic acid (BCA, Thermo fisher scientific Rockford USA),
primary and HRP conjugated secondary antibodies were procured from Santa
Cruz, USA.
Methods:
Cell culture:
The cerebral glioma cell line (BMG-1; diploid, wild type p53) established by us
earlier [12] whereas; OCT-1 (oral carcinoma) and HEK293 (human embryonic
kidney) cells were obtained from NCCS, Pune, India. BMG-1 and OCT-1 cells
were maintained as monolayers in Dulbecco's modified Eagles medium (DMEM)
supplemented with fetal bovine serum (5 % for BMG-1 and 10% for OCT-1),
HEPES and antibiotics as described earlier [12]. HEK293 was grown in high

5
glucose (4.5 g/L) DMEM supplemented with 10% fetal bovine serum (FBS). All
experiments were carried out in exponentially growing cells.
Treatments:
Cells were treated with MRMs at concentrations that induce glycolysis without
any cytotoxicity (data not shown). The drug concentrations used in all the
experiments were 1 µM for DNP, 25 µg/ml for PS3 and 25 µM for MB. Cells were
exposed to 5 Gy g-ray irradiation in all experiments (unless specified otherwise in
particular experiments), using
Bhabhatron-II, a teletherapy machine from Panacea, Medical Technologies Pvt. Ltd.
(Bangalore, India) at 80 cm SSD and 35x35 cm field with a dose rate of 2 Gy/min.
Glucose consumption and lactate production assay:
BMG-1, OCT-1 and HEK293 cells were incubated in HBSS or HBSS containing
MRMs before irradiation. Cells were incubated for 4 hours; every hour HBSS
sample was taken from dishes and frozen immediately for further analysis. The
amount of glucose remaining unused and the lactate produced were estimated in
the HBSS using enzymatic assays. Glucose was determined by the glucose-
oxidase method using Tecnicon RA-500 auto analyzer. Lactate was estimated
using lactate oxidase method based kit (Randox; Cat. No.-LC2389). Glucose
consumption and lactate production were estimated at the end of every hour (up
to four hours) and presented as the average consumption or production per hour.
The number of viable cells was counted on hemocytometer using trypan blue
(0.4%) exclusion test and glucose consumption or lactate production was
normalized with respect to the number of trypan blue negative (viable) cells.
Hexokinase assay: Hexokinase enzymatic activity was measured as previously described [15].
Briefly, cells were treated for 4 hour with DNP followed by radiation before
washed with PBS and lysed using the buffer containing 50 mM Tris-HCl (pH-8.0),
1.5 mM MgCl2, 150 mM NaCl, 250mM sucrose along with protease inhibitor. The

6
cell lysate was incubated on ice for 30 min, followed by centrifugation at 14,000
rpm at 4 °C for 10 min. The protein estimation was done by BCA method. An
aliquot of 20 µg protein from freshly lysed cell supernatant was added to 1 ml of
reaction buffer containing 100 mM Tris-HCl, pH 8.0,
0.5 mM EDTA, 10 mM ATP, 10 mM MgCl2, 2 mM glucose, 0.1 mM NADP, and
0.1 U/ml of G6PD (Sigma). HK activity was determined by following the G6P-
dependent conversion of NADP to NADPH spectrophotometrically at 340 nm at
room temperature. The values were subtracted with respective blanks and the
relative enzymatic activity is presented as absorption at 340 nm.
ATP Measurement: ATP was measured using ATP bioluminescent assay kit (Sigma) following
manufacturer’s protocol. Briefly, cells were treated with MRMs followed by
irradiation for 4 hour before washed and scraped in cold PBS and pelleted at
1000 rpm for 10 min.
Further, cells were lysed in 350 �l of lysis buffer (4mM EDTA and 0.2 % Triton X-100).
100 �l of this lysate was loaded per well in triplicates with 100 �l of ATP mix in a
96well white luminescence measuring plate. Luminescence of samples along
with standards was read at 562 nm and normalized with the protein
concentration. ATP concentration is depicted as ng/mg protein.
Measurement of mitochondrial content and membrane potential:
Cells were treated with MRMs followed with or without irradiation for various time
points. Once the incubation time was completed, cells were washed with PBS
and stained for 30 minutes at 37 °C in CO2 incubator with either 100 nM
mitotracker green or 100 nM DiOC6 (both from Molecular Probes, Invitrogen) in
respective wells. After staining, cells were trypsinized and equal numbers of cells
were transferred to 96 well fluorescence reading plate. The fluorescence was
measured at 490 nm excitation and 516 nm emission for mitotracker green and
484 nm excitation and 501 nm emission for DiOC6 in quadruplicates using

7
Molecular device fluorescence plate reader. The fluorescence intensity of
mitotracker green is represented as relative mitochondrial content and the DiOC6
fluorescence intensity is represented as relative mitochondrial membrane
potential.
Macro colony assay:
Cells were plated at a density of 6,000 - 8,000 cells/cm2 in Petri dishes. 36 h
later, cells were washed with HBSS and treated with different MRMs (viz. 1 µM
di-nitro phenol, DNP; 25 µg/ml Photosan-3, PS3; 25 µM Methylene blue, MB) in
HBSS before
irradiation. Following the radiation treatment, cells were incubated for 4h at 37 ºC
in HBSS then washed twice with HBSS, trypsinized, counted and plated in
triplicates in 60 mm petri dish at very low density (100 cells/dish) for control and
MRMs treatment alone and relatively high cell density (500 cells/dish) for
radiation and MRMs with radiation.
These dishes were incubated in fresh respective media at 37 °C in a humidified
CO2 (5%) incubator for 7-10 days, depending on the cell line. Colonies of at least
50 cells (5 to 6 generations of proliferation) were scored as survivors. Colonies
were fixed with methanol and then stained with 1% crystal violet (dissolved in 7%
methanol). Plating efficiency was calculated as: PE = (No. of colonies counted/
No of cells plated) x 100. The surviving fraction was calculated as: SF = PET
/PEC. Where PET is the plating efficiency of the treated group and PEC is the value
of the control.
Single cell Gel electrophoresis (Comet assay):
Neutral comet assay was performed as described earlier [16, 17]. For 0 hour time
point (to obtain damage induction) cells were exposed on ice and processed
immediately after exposure. Briefly, treated cells were trypsinized and
resuspended in the medium at respective time points. An aliquot of 30,000-

8
40,000 cells (~ 100 ml of medium) were mixed into a suspension of 0.75% (~
500ml) warm low gelling (gelling temp = 17 °C) agarose (BDH Electran,
England), and spread onto microscopic slide (pre-coated with
0.1% agarose) kept at 45 °C. Slides were immediately transferred to a cooling
plate at 4 °C, and kept for 5 min to allow the agarose layer to gel along with the
embedded cells.
Following this, the slides carrying agarose gel with embedded cells were
immersed in the SDS lysis buffer [2.5% sodium dodecyl sulphate (SDS), 1%
sodium sarcosinate and 25 mM ethylenediaminetetraacetic acid (EDTA)] for 15
min at room temperature (25-28 °C). Slides were then washed in double distilled
water for 5 min at 4 °C, electrophoresed at 2 V/cm for 5 min, and air-dried at 45
°C. For analysis, the slides were rehydrated by immersing in distilled water at
room temperature, and stained with 25 mg/ml propidium iodide (PI) dye. Comet-
like shape forms from the DNA mass of each individual cell following these
treatments, the amount of DNA present in the tail directly corresponding with the
amount of DNA breaks induced by radiation treatment. The comets were
randomly selected (n=50) and images were acquired at 200x under BX60
fluorescence microscope (Olympus, Japan). The comets were analyzed using
OPTIMAS image analysis software (calibrated for analyzing comets) and the %
tail DNA was calculated from data generated by the software.
Micronuclei assay:
Cells were washed in PBS and fixed in carnoys fixative (3:1 V/V, Methanol:
Acetic acid). Fixed cells were dropped on the chilled glass slides. Air-dried slides
were stained with a DNA binding fluorochrome (bisbenzimidazole; hoechst-
33258) at 10 µg/ml dissolved in citric acid [0.01 M], disodium phosphate [0.45 M]
buffer containing 0.05% Tween-20 detergent; pH 7.4 as described earlier [6].
Slides were examined under fluorescence microscope using UV excitation filter.
Cells containing micronuclei were counted from 1000 cells as described earlier
[6, 18].

9
Immuno-blot:
Expression of key proteins involved in glucose catabolism and DNA repair viz.
glucose transporters GLUT-1, GLUT-4, hexokinase-II (HK-II), PFK-1, Rad51, Ku-
70 and loading control b-Actin was determined in control and treated cells by
immunoblot analysis. Cells were harvested at various time points (showed in
figure) and lysed in ice cold RIPA lysis buffer (Tris–HCl: 50mM, pH 7.4, NP-40:
1%, Na-deoxycholate: 0.25%, NaCl: 150 mM, EDTA: 1 mM, PMSF: 2 mM,
protease inhibitor cocktail, Na3VO4: 1 mM, NaF: 1 mM). The protein
concentration in the lysates was measured using BCA protein assay. Protein
(40–50 µg) was resolved on 10–15% SDS–PAGE (depending on the molecular
weight) and electroblotted onto PVDF membrane (MDI). The membrane was
then incubated in 4% skimmed milk for 1 h followed by primary antibody
incubation GLUT-1 (1:300), GLUT-4 (1:300), HK-II (1:200), PFK-2 (1:200), Rad51
(1:200), Ku-70
(1:150) from Santa Cruz Biotechnology and b-Actin (1:5000) from BD
Biosciences for 2h. Membrane was washed and incubated with the appropriate
HRP conjugated secondary antibody for 1h. After washing, the blots were
developed using ECL chemiluminescence detection reagent (Biological
industries, Israel). The signal was detected by ECL, and band intensities for
each individual protein were quantified by densitometry, corrected for background
staining, and normalized to the signal for b-
Actin.
Statistical analyses:
All the experiments were performed in triplicates or quadruplicates. Means and
standard errors were computed. Student’s t test was performed to determine
whether a significant difference exists between the groups.

10
Results
Mitochondrial respiratory modifiers induces glycolysis
To mimic the high glycolytic phenotype of cancer cells, we investigated the
glycolysis stimulating potential of few mitochondrial respiratory modifiers (MRMs)
that are known to stimulate glycolysis as a compensatory mechanism [19]. At
Treatment of exponentially growing cells with non-toxic concentrations MRMs
such as di-nitrophenol (DNP), porphyrin derivatives (photosan; PS3) and
methylene blue (MB), which interfere with the oxidative phosphorylation at
different stages in the electron transport chain (ETC), was found to enhance the
glycolysis (glucose utilization and lactate production) significantly (by
approximately two folds) in all the cell lines investigated (BMG-1, OCT-1 and
HEK293; Fig. 1A, B and C), similar to our earlier results with KCN [11, 12].
Similar increase in MRM-induced glycolysis was also seen in irradiated cells (Fig
1A, B and C). To unravel the contributing factors responsible for MRM-induced
enhancement in glycolysis, we examined the level of glycolytic enzymes and
glucose transporters under similar experimental conditions. Interestingly, we
found approximately 2.5 fold increased level of GLUT-1, while no significant
change could be seen in GLUT-4 (Fig. 1D). A 2 fold increase was also seen in
the level of hexokinase-II, one of the first two regulatory kinases (HK-II and PFK-
1) of glycolysis; however the level of PFK-1 does not change appreciably (Fig.
1D). Further, the increase in hexokinase expression also correlated with nearly
two fold increase in the total hexokinase activity (Fig. 1E) induced by DNP under
these experimental conditions. Interestingly, the hexokinase activity was
increased further by nearly 4 fold in cells treated with both DNP and radiation.
These findings suggest that inhibition of mitochondrial respiration induces
glycolysis by upregulating the level of glucose transporters viz. GLUT-1 and
glucose phosphorylating enzyme HK-II to ensure the increased flux and high
retention of glucose in the cytoplasm.

11
MRMs inhibit the process of electron transfer and ATP generation from
electron transport chain leading to incomplete respiration and reduced ATP
generation. Therefore, we measured changes in ATP levels induced by MRMs
(Fig. 2A), besides examining the mitochondrial status by analyzing the membrane
potential and mass (Fig. 2B & C). Results (Fig. 2) clearly show that none of the
three respiratory inhibitors caused any appreciable changes in ATP and
mitochondrial status (both in un-irradiated and irradiated cells), thereby
suggesting that the significant compensatory increase in glycolysis is sufficient to
meet the energy requirements in these cells. It also suggests that the effect of all
the MRMs on mitochondria is similar for compensatory increase in glycolysis.
Transient elevation of glycolysis confers radio-resistance in cells To examine if transient induction of glycolysis leads to radio-resistance, we
irradiated (5 Gy; g-Rays) the cells in the presence of MRMs (that induce
glycolysis) and then analyzed the clonogenicity using macro-colony assay.
Indeed an increase in survival was evident in all the three cell lines, which on an
average was 1.71, 1.74 and 1.9 fold in BMG-1, OCT-1 and HEK293 respectively
with all the three MRMs as compared to radiation alone (Fig 3A, B and C). We
further examined the effect of DNP mediated enhanced glycolysis on the
radiation dose response curve in the cells and found that glycolysis stimulated
cells (DNP treated) showed radio-resistance as reflected by an increase in D1
(dose of radiation to bring down the survival fraction to 0.37) in all the three cell
lines (Fig 3D).
After establishing the “proof of concept” that elevation of glycolysis for few
hours post-irradiation leads to resistance against radiation-induced cell death
using more than one inducers viz. DNP, PS3 and methylene blue, we decided to
investigate the mechanisms underlying this resistance using a pharmacologically
more suitable molecule like DNP, as PS3 and methylene blue are associated with
photo-toxicity [8, 20].
Inhibition of glycolysis reverses MRMs induced radio-resistance

12
To confirm that MRMs induced radio-resistance is mainly by induction of
glycolysis, we inhibited the glycolysis using non-toxic concentrations of 2-deoxy-
Dglucose (2-DG, hexokinase inhibitor), 3-bromo pyruvate (3-BP, hexokinase
inhibitor) and fasentin (Glut-1 inhibitor) in DNP treated BMG-1 cells before
exposing to radiation. All these known inhibitors of glycolysis failed to enhance
the clonogenicity in DNP treated and irradiated cells as compared to radiation
alone (Fig. 4A). To further substantiate that MRMs induced radio-resistance is
facilitated by induced glycolysis and not due to metabolic signaling associated
with inhibition of mitochondrial respiration; we treated BMG-1 cells with non-toxic
concentration of antimycin A (5 µg/ml), which inhibits oxidative phosphorylation
but does not induce glycolysis [21]. Cells treated with antimycin A before
radiation exposure did not show any increase in clonogenic survival (Fig. 4B);
lending further support to the notion that MRMs induced radio-resistance
observed in cells is mediated by transient stimulation of glycolysis.
Induced glycolysis facilitates DNA repair process
Since DNA damage is one of the major contributing factor for the loss of
clonogenic survival at moderate levels of absorbed radiation, we studied the
effects of induced glycolysis on the induction and repair of DNA damage using
single cell electrophoresis (Comet assay). We used changes in % tail DNA
(increase and decrease) as a parameter to measure the damage induction and
repair. Figure 5A shows the % tail DNA in BMG-1 cells, un-irradiated and
immediately after irradiation. We analyzed the data using derived equations to
determine the percentage of damage removed and presented in table 1. Cells
with stimulated glycolysis showed a faster kinetics of repair and the extent of
damage removal at the end of 30 minutes following irradiation. The extent of
damage removed was approximately 1.7 (92% / 55%) fold higher as compared to
the un-stimulated cells (Fig 5B). Analysis of the repair kinetics showed that
almost all damage repaired under conditions of stimulated glycolysis was
handled by the fast component of repair (~92%) as compared to the un-

13
stimulated cells (~55%). These results suggest that a higher rate as well as the
extent of damage removal under conditions of enhanced glycolysis is one of the
important contributing factors for enhanced resistance.
Because, radiation predominantly causes mitotic catastrophe (an event in
which a cell is destroyed during mitosis) linked death at moderate doses [22], we
investigated radiation induced cytogenetic damage, which is involved in mitotic
catastrophe.
Cytogenetic damage was assessed by counting cells with micronucleus, which
arises from unrepaired/mis-repaired DNA double strand breaks (DSBs) following
irradiation and correlates with changes in survival [23]. The kinetics of
micronuclei expression followed until 72 h post-irradiation clearly showed a
significant decrease in the fraction of cells with micronuclei in glycolysis
stimulated BMG-1, OCT-1 and HEK293 cells at all time points (Fig. 5C)
suggesting reduced residual DNA damage, in line with the enhanced repair
observed (Fig. 5B).
Induced glycolysis facilitates NHEJ and HR pathways of DNA repair
DSBs are particularly deleterious to cells and its inefficient repair can lead
to cell death. DSBs in the mammalian genome are repaired through homologous
recombination (HR) and non-homologous end joining (NHEJ) repair pathways.
Rad51 is a critical component of the HR pathway whereas; Ku-70 and Ku-80 are
critical component of NHEJ pathway [24]. To examine if a particular DSB repair
pathway is facilitated under the conditions of induced glycolysis, we examined the
status of DSB repair initiating proteins, Rad51 and Ku-70 involved in HR and
NHEJ repair pathways, respectively. Western blot analysis carried out in BMG-1
cells showed that the level of Rad51 protein increased approximately 1.5 fold at
4h following irradiation (5 Gy; Fig. 6). However, in DNP treated cells, a 2 fold
increase was noted in the level of Rad51 at 0.5 h after irradiation, which returned
to the basal level at 4h (Fig. 6), suggesting a rapid induction of repair and faster
removal of DSB leading to lesser residual DNA damage in glycolysis stimulated

14
cells. Similar results were obtained for time dependent changes in Ku-70 levels,
which was also found to be up-regulated by 2 folds, 0.5 hr after irradiation, in
DNP treated cells (Fig. 6A). Although, increase in Rad51 level correlates with the
faster repair kinetics observed here, increase in the level of Rad51 following
irradiation are at variance with earlier observations [25, 26]. These observations
are in line with our observations of a faster rate of DNA break rejoining (Fig. 5B),
wherein the damage (tail DNA) returned close to the basal level within 0.5 h
following irradiation in glycolysis stimulated cells (Fig. 5B). Inhibition of glycolysis
using 2-DG in DNP stimulated cells did not show appreciable increase in the level
of these repair proteins Rad51 and Ku70, lending support to the proposition that
stimulation of glycolysis enhances the kinetics of DNA repair by increasing the
expression of repair proteins Rad51 and Ku70. These results suggest that both
HR and NHEJ pathways of DNA repair are operationally efficient following
stimulation of glycolysis, thereby leading to a faster damage removal and
enhanced survival. Taken together, these observations suggest that DNP
induced transient elevation of glycolysis results in activation of both HR and
NHEJ pathway to facilitate the DNA repair thereby making the cells relatively
more resistant.
Discussion
Irradiation of cells causes macromolecular damage (viz DNA, protein etc)
stimulating multiple signaling pathways viz DNA repair, cell cycle check points,
apoptosis and senescence that collectively determine the fate of cells [22]. It is
well established that at moderate absorbed doses of low LET radiation (like
gamma rays and X-rays), the main contributing factor responsible for loss of
clonogenecity (cell survival) is the mitotic death linked to cytogenetic damage that
arises from residual DNA damage [22, 27]. Incomplete repair and/or mis-repair of
DNA strand breaks results in chromosomal damage that can be observed as
various chromosomal aberrations in the metaphase of the irradiated population

15
and as micronuclei in the daughter cells [27], although mitotic spindle
dysfunctions and other disturbances also lead to micronuclei formation and
related nuclear damage [28]. Therefore, alterations in the DNA repair processes
that are operative for few hours following irradiation are expected to influence the
cell survival as well as the level of cytogenetic damage. In the present study, we
observed an increase in the clonogenic survival following transient stimulation of
glycolysis (Fig. 3) that correlated with the decrease in the level of micronuclei
expression
(Fig 5C) suggesting a reduction in the residual DNA damage under these
conditions. While stimulation of glycolysis did not significantly alter the level of
induction of DNA damage (Fig 5A), the rate of DNA strand break rejoining as
well as the extent of damage removal were clearly higher that resulted in a
decrease in the residual DNA damage at the end of 30 minutes after irradiation
(Fig 5B).
It will be interesting to see whether the mechanisms underlying radio-
resistance seen in cancer cells, where a stable phenotype with enhanced
glycolysis gradually develops during tumorigenesis will be identical to the
transient stimulation of glycolysis observed here. In this respect, it is pertinent to
note that inhibition of mitochondrial respiration [29] that leads to enhanced
glycolysis (as seen here; Fig 1) often results in the stimulation of
HIF1a expression of many genes in the glycolytic pathway and upregulated in
malignantly transformed cells and tumors [30, 31]. Stimulation of glycolysis seen
as a compensatory mechanism following a fall in the mitochondrial ATP
production induced by respiratory inhibitors has been suggested to be due to the
activation of AMP kinase triggered by an increase in the AMP level (and
AMP/ATP ratio) due to ATP breakdown [29]. Some recent evidences suggest that
inhibition of mitochondrial respiration leads to accumulation of glycolytic end
products like pyruvate and lactate which could dramatically increase HIF1�
accumulation in cancer cells by inhibiting the prolyl hydroxylase enzyme activity.

16
Moreover, other mediators like the expression of TKTL1 (Transketolase-like 1, an
enzyme of pentose phosphate pathway) in head and neck carcinomas and
gliomas leads to metabolic switch by stabilizing HIF1� for improving energy yield
from glucose via glycolysis and enhancing antioxidant defence against ROS via
pentose phosphate pathway [32, 33]. In this respect it is pertinent to note that the
increase in the protein levels of regulators of glycolysis stimulated by DNP in
BMG-1 cells viz. Glut-1 and HK-II observed here (Fig. 1D) are all regulated by
HIF1a [27, 34]. Therefore, radio-resistance following DNP induced transient
elevation in glycolysis appears to partly involve similar mechanisms that are
reported as activators of glycolysis in cancer cells generally associated with
resistance to radiation and other drugs. Further, sensitization of BMG-1 cells to
radiation in the presence of Antimycin A (Fig. 4B), which inhibits mitochondrial
respiration without compensatory increase in glycolysis and the glycolytic
inhibitor 2-DG strongly suggests that MRMs (DNP, PS3 and MB) induced radio-
resistance in cells is mainly due to increase in glycolysis and not because of
inhibition of mitochondrial respiration.
DNA double strand breaks, the most lethal lesions widely considered to be
responsible for radiation-induced cell death are repaired by both homologous
recombination (HR) and non-homologous end joining (NHEJ) in a proliferating
mammalian cell population. Rad51 is a critical component of DNA DSB repair
pathway [35], which is widely reported to redistribute within the nucleus following
DNA damage suggesting the formation of repair foci involving this
recombinase[25, 26, 36], although radiation induced elevated level of this protein
enhances radio-resistance has also been reported [36]. Rapid increase in the
level of Rad51 protein at 30 minutes following irradiation in glycolysis stimulated
(DNP treated) cells observed here (Fig. 6) is similar to the observations in the
radio-resistant spheroids of DU145 carcinoma cell line [37]; which also
interestingly has a significant level of HIF1a with elevated glycolysis and
increased resistance to radiation [38]. It is pertinent to mention here that Rad51

17
gets ubiquitinated and degraded via proteasomal degradation following repair of
radiation induced DNA damage [39]. Therefore, low level of Rad51 4h post
irradiation suggest that the progression of DNA repair linked to Rad51 dynamics
is fast and facilitated under conditions of high glycolysis. Increased level of
Rad51 following irradiation seen here, particularly in DNP treated cells is at
variance with earlier reports [25, 26, 36] and may arise due to many reasons viz.
proteasomal degradation, altered metabolic status of the cells [37, 39] or changes
in the interactions with other members of the repair complex thereby altering the
immune reactivity, which needs further investigations. A profound increase in the
level of Ku-70 (Fig. 6) in DNP treated cells also facilitates a faster repair by NHEJ
conferring resistance against radiation in high glycolytic cells. Increased level of
Ku-70 has been reported to increase cellular tolerance against ischemic stress
[40] and adaptation to ischemia provides hypoxia mediated in-vivo tumor radio-
resistance [41]. Our results also suggest that increased Ku-70 level may facilitate
NHEJ pathway of DSB repair in high glycolytic cells leading to reduced
micronuclei and increased cell survival against radiation. Some recent evidences
suggest that DNA damage induced by adriamycin enhances the TIGAR and
TKTL1 expression and knocking down the TKTL1 or WRN complex both leads to
reduced glycolytic metabolism and accumulation of DNA damage in cancer cells
[33, 42]. These observations also support our results that enhanced glycolysis is
a favorable metabolic change for DNA repair, in cancer cells. Therefore, our data
suggest that enhanced glycolysis in cancer cells confers resistance against
radiationinduced cell death by facilitating DNA repair.
The transient increase in glycolysis conferring resistance against
radiationinduced cell death in normal HEK293 cells (clonogenic survival; Fig 3C)
has important implications in radiation countermeasure as pharmacological
agents that stimulate glycolysis at the systemic level may act as radio-protective
agents. Indeed, administration of low amounts of, DNP used in this study for
stimulating glycolysis has been shown to be safe for humans/canine [43].

18
Facilitated DNA repair leading to reduced cytogenetic damage and mitotic linked
cell death observed here suggestive of protection to the GI system, while the
level of HK-II and Ku-70 which are generally elevated with the increase in
glycolysis is known to inhibit intrinsic pathway of apoptosis [44] and therefore
protect hematopoietic cells.
Taken together, results of the present study clearly show that transient
induction of glycolysis by respiratory inhibitors gives rise to radio-resistance by
activating both the NHEJ and HR DNA repair pathways, thereby reducing
residual DNA damage and cytogenetic damage linked mitotic death. Further
understanding of the mechanisms underlying glycolysis induced facilitated DNA
repair and radio-resistance may help in unraveling critical molecular targets
responsible for resistance and facilitate the design and/or identification of
molecules/agents that specifically overcome resistance linked to enhanced
glycolysis, thereby enhancing the efficacy of radio- and chemotherapies.
Acknowledgements: This work was supported by grants (INM 301, 311/1.4)
funded by Defence Research and Development Organization, Government of
India. We acknowledge Dr. Sudhir Chandna for help in carrying out single cell
electrophoresis
(Comet assay); Balvir, Kamal Bhardwaj and Vikas Bhuria for support during
experiments; Director INMAS for constant support and encouragement. We thank
Dr Viney Jain for his expert advice and helpful discussions during the course of
this study.

19
References:
1. B. G. Haffty and P. M. Glazer, “Molecular markers in clinical radiation
oncology,” Oncogene, 22, 5915–5925, 2003.
2. R. A. Gatenby and R. J. Gillies, “Why do cancers have high aerobic
glycolysis?” Nat. Rev. Cancer, 4, 891-899, 2004.
3. H. Simonnet, N. Alazard, K. Pfeiffer, C. Gallou, C. Beroud, J. Demont, et al.,
“Low mitochondrial respiratory chain content correlates with tumor
aggressiveness in renal cell carcinoma,” Carcinogenesis, 23, 759–768, 2002.
4. G. Santamaria, M. Martinez-Diez, I. Fabregat and J. M. Cuezva, “Efficient
execution of cell death in non-glycolytic cells requires the generation of ROS
controlled by the activity of mitochondrial H-ATP synthase,” Carcinogenesis,
27, 925–935, 2006.
5. J. Schwaab, K. Horisberger, P. Ströbel, B. Bohn, D. Gencer, G. Kähler, et al.
“Erben Expression of Transketolase like gene 1 (TKTL1) predicts disease-free
survival in patients with locally advanced rectal cancer receiving neoadjuvant
chemoradiotherapy.” BMC Cancer, 11:363, 2011.
6. B. S. Dwarakanath and V. K. Jain, “Enhancement of radiation damage by 2-
Deoxy-Dglucose in organ cultures of brain tumors,” Indian J Med Res, 82, 266-
268, 1985.
7. B. S. Dwarakanath and V. K. Jain, “In vitro radiation response of human
intracranial meningiomas and its modification by 2-deoxy-D-glucose,” Ind J
Med Res, 92, 183188, 1990.
8. B. S. Dwarakanath, J. S. Adhikari and V. Jain, “Hematoporphyrin derivatives
potentiate the radiosensitizing effects of 2-DG in cancer cells,” Int J Radiat
Oncol
Biol Phys, 43, 1125-1133, 1999.
20
9. H. Pelicano, D. S. Martin, R. H. Xu and P. Huang, “Glycolysis inhibition for
anticancer treatment,” Oncogene, 25, 4633–4646, 2006.
10. B. S. Dwarakanath, F. Zolzer, S. Chandna, T. Bauch, J. S. Adhikari, W.U.
Muller, et al. “Heterogeneity in 2-deoxy-D-glucose induced modifications in
energetic and radiation responses of human tumor cell lines,” Int J Radiation
Oncology Biology Phys, 51, 1151-1161, 2001.
11. B. S. Dwarakanath and V. Jain, “Effects of gamma-rays and glucose analogs
on the energy metabolism of a cell line derived from human cerebral glioma,”
Ind J Biochem Biophys, 28(3), 203-9, 1991.
12. B. S. Dwarkanath and V. K. Jain, “Energy linked modifications of the radiation
response in a human cerebral glioma cell line,” Int J Radiat Oncol Biol Phys,
17, 1033-1040, 1989.
13. R. Kulkarni, A. Reither, R.A. Thomas and J. D. Tucker, “Mitochondrial mutant
cells are hypersensitive to ionizing radiation, phleomycin and mitomycin C,”
Mutat Res, 663, 46–51, 2009.
14. Y. Eguchi, S. Shimizu and Y. Tsujimoto, “Intracellular ATP Levels Determine Cell
Death Fate by Apoptosis or Necrosis,” Cancer Res, 57, 1835-1840, 1997.
15. A. Ahmad, S. Ahmad, B. K. Schneider, C. B. Allen, L. Y. Chang and C. W.
White, “Elevated expression of hexokinase II protects human lung epithelial-
like A549 cells against oxidative injury,” Am J Physiol Lung Cell Mol Physiol,
283, L573–L584,
2002. 16. O. Ostling and K. J. Johanson, “Microelectrophoretic study of radiation-
induced DNA damages in individual mammalian cells,” Biochem Biophys Res
Commun, 123, 291-8, 1984.
21
17. S. Chandna, "Single-cell gel electrophoresis assay monitors precise kinetics of
DNA fragmentation induced during programmed cell death,” Cytometry A, 61,
127-33, 2004.
18. P. I. Countryman and J. A. Heddle, “The production of micronuclei from
chromosome aberrations in irradiated cultures of human lymphocytes,” Mutat
Res, 41, 321-32, 1976.
19. C. Loesberg, H. V. Rooij, W. J. Nooijen, A. J. Meijer and L. A. Smets, “Impaired
mitochondrial respiration and stimulated glycolysis by m-iodobenzylguanidine
(MIBG),” Int J Cancer, 46(2), 276–281, 1990.
20. R. G. Sturmey, C. P. Wild and L. J. Hardie, “Removal of red light minimizes
methylene blue-stimulated DNA damage in oesophageal cells: implications for
chromoendoscopy” Mutagenesis, 24(3), 253–8, 2009.
21. K. G. Dickman and L. J. Mandel, “Differential effects of respiratory inhibitors on
glycolysis in proximal tubules,” AJP-Renal Physiol, 258(6), F1608-F1615,
1990.
22. D. Eriksson and T. Stigbrand, “Radiation-induced cell death mechanisms,“ Tumor
Biology, 31(4), 363-72, 2010.
23. J. Midander and L. Révész, “The frequency of micronuclei as a measure of cell
survival in irradiated cell populations,” Int J Radiat Biol Relat Stud Phys Chem
Med, 38(2), 237-42, 1980. 24. X. Liu, E. K. Han, M. Anderson, Y. Shi, D. Semizarov, G. Wang, et. al.,
“Acquired resistance to combination treatment with temozolomide and ABT-
888 is mediated by both base excision repair and homologous recombination
DNA repair pathways,” Mol Cancer Res, 7(10), 1686-92, 2009.
25. S. E. Henson, S. Tsai, C. S. Malone, S. V. Soghomonian, Y. Ouyang, R. Wall,
et al., “Pir51, a Rad51-interacting protein with high expression in aggressive
22
lymphoma, controls mitomycin C sensitivity and prevents chromosomal
breaks.” 601, 113–124, 2006
26. E. Raderschall, K. Stout, S. Freier, V. Suckow, S. Schweiger, and T. Haaf,
“Elevated Levels of Rad51 Recombination Protein in Tumor Cells.” Cancer
Res. 62, 219–225, 2002
27. D. Murray, and R.E. Meyn, “Differential repair of gamma-ray-induced DNA
strand breaks by various cellular subpopulations of mouse jejunal epithelium
and bone marrow in vivo,” Radiat Res, 109(1), 153-64, 1987.
28. M. Fenech , M. Kirsch-Volders, A. T. Natarajan, J. Surralles, J. W. Crott, J.
Parry, et al., “Molecular mechanisms of micronucleus, nucleoplasmic bridge
and nuclear bud formation in mammalian and human cells,” Mutagenesis,
26(1), 125-32, 2011.
29. R. E. Airley, J. Loncaster, J. A. Raleigh, A. L. Harris, S. E. Davidson, R. D.
Hunter, et al., “GLUT-1 and CAIX as intrinsic markers of hypoxia in carcinoma
of the cervix:
relationship to pimonidazole binding” Int J Cancer, 104(1), 85-91, 2003.
30. A. Marín-Hernández , J. C. Gallardo-Pérez, S. J. Ralph, S. Rodríguez-Enríquez and R.
Moreno-Sánchez, “HIF-1alpha modulates energy metabolism in cancer cells by
inducing over-expression of specific glycolytic isoforms,” Med Chem, 9(9),
1084101, 2009.
31. H. Lu, R. A. Forbes and A. Verma, “Hypoxia-inducible factor 1 activation by
aerobic glycolysis implicates the warburg effect in carcinogenesis,” J Biological Chem, 277, 23111-23115, 2002.
32. W. Sun, Y. Liu, C. A. Glazer, C. Shao, S. Bhan, S. Demokan, et al., “TKTL1 is activated by promoter hypomethylation and contributes to head and neck squamous cell carcinoma carcinogenesis through increased aerobic glycolysis and HIF1alpha stabilization.” Clin Cancer Res., 16(3), 857-866, 2010.

23
33. C. Wanka, J. P. Steinbach, J. Rieger, “Tp53-induced glycolysis and apoptosis regulator (TIGAR) protects glioma cells from starvation-induced cell death by upregulating respiration and improving cellular redox homeostasis.” J Biol Chem, 287(40), 33436-33446, 2012.
34. H. Pelicano, D. S. Martin, R. H. Xu and P.Huang, “Glycolysis inhibition for
anticancer treatment,” Oncogene, 25, 4633–4646, 2006.
35. G. Chen, S. S. Yuan, W. Liu, Y. Xu, K. Trujillo, B. Song, et al., “Radiation-
induced assembly of Rad51 and Rad52 recombination complex requires ATM
and c-Abl,” J Biol Chem, 274, 12748–12752, 1999.
36. S. Vispe, C. Cazaux, C. Lesca and M. Defais, “Overexpression of Rad51
protein stimulates homologous recombination and increases resistance of
mammalian cells to ionizing radiation,” Nucleic Acids Res, 26, 2859-64, 1998.
37. M. Taghizadeh, S. Khoei, A. R. Nikoofar, L. Ghamsari and B. Goliaei, “The role
of Rad51 protein in radioresistance of spheroid model of DU145 prostate
carcinoma cell line,” Iran J Radiat Res, 7(1),19-25, 2009.
38. D. Khaitan, S. Chandna, M. B. Arya and B. S. Dwarakanath, “Differential
mechanisms of radiosensitization by 2-deoxy-D-glucose in the monolayers and
multicellular spheroids of a human glioma cell line,” Cancer Biol Ther, 5,1142–
1151, 2006.
39. B. T. Bennett and K. L. Knight, “Cellular localization of human Rad51C and
regulation of ubiquitin-mediated proteolysis of Rad51,” J Cellular Biochem, 96,
1095– 1109, 2005.
40. T. Sugawara , N. Noshita , A. Lewén , G. W. Kim and P. H. Chan, “Neuronal
expression of the DNA repair protein Ku-70 after ischemic preconditioning
corresponds to tolerance to global cerebral ischemia,” Stroke, 32(10), 2388-
93, 2001.

24
41. D. L. Schwartz, J. Bankson, L. Bidaut, Y. He , R. Williams, R. Lemos, et al.,
“HIF-1dependent stromal adaptation to ischemia mediates in vivo tumor
radiation resistance,” Mol Cancer Res, 9(3), 259-70, 2011.
42. B. Li, J. M. Iglesias-Pedraz, L. Y. Chen, F. Yin, E. Cadenas, S. Reddy, et al.
“Downregulation of the Werner syndrome protein induces a metabolic shift that
compromises redox homeostasis and limits proliferation of cancer cells.” Aging
Cell.;13(2), 367-378. 2014.
43. C.S. Liang and W. B. Jr. Hood, “Companrson of cardiac output responses to
2,4Dinitrophenol-induced hypermetabolism and muscular work,” The J Clin
Investigation, 52, 2283-2292, 1973.
44. M. Sawada, W. Sun, P. Hayes, K. Leskov, D. A. Boothman and S.
Matsuyama, “Ku70 suppresses the apoptotic translocation of Bax to
mitochondria,” Nat. Cell Biol., 5, 320-329, 2003.
Figure Legends
Figure 1. Mitochondrial respiratory modifiers (MRMs; PS3, DNP & MB) induced
glycolysis (glucose consumption and lactate production) observed at every hour
till 4 hours of the drug treatment and presented as average per hour in BMG-1
(A), OCT-1 (B) and HEK293 (C) cells. (D) Protein expression profile of glucose
transporter and glycolytic enzymes in BMG-1 cells Western blots and their
derived quantitative values from the densitometry are shown. (E) Relative
hexokinase enzymatic activity in unirradiated and irradiated (5 Gy g-rays) BMG-1
cells is presented as absorbance at 340 nm obtained from coupled enzymatic
assay. The concentration of different treatments used was as follows, PS3, 25
µg/ml; DNP, 1 µM; MB, 25 µM. The data shown are the mean values (±1 SD) of
nine observations from three independent experiments. Statistical significance *p
< 0.05.

25
Figure 2. MRMs did not induce differential changes in energy and mitochondrial
status in either un-irradiated or irradiated (5 Gy g-rays) BMG-1 cells. (A) Shows
MRMs induced glycolysis compensate the ATP production, equally in all the
modifiers. (B) & (C) shows that the effects of MRMs on mitochondrial mass and
membrane potential are also similar. The concentrations of different MRMs used
were as follows, PS3, 25 µg/ml; DNP, 1 µM; MB, 25 µM.
Figure 3. Enhanced radio-resistance (clonogenic survival; macro-colony assay) by
MRMs (PS3, DNP and MB) induced glycolysis observed at an absorbed dose of
5 Gy in BMG-1 (A), OCT-1 (B) and HEK293 (C). The figure (D) represents the
dose response curve of BMG-1, OCT-1 and HEK293 cells against radiation in
DNP and vehicle treated cells. The concentrations of MRMs used were as
follows, PS3, 25 µg/ml; DNP, 1 µM; MB, 25 µM. After treatment cells were
incubated for 4 hours in liquid holding before plating for macro colony formation.
Surviving fraction of un-irradiated and irradiated samples was calculated by
considering the plating efficiency of un-irradiated control as 1. The data shown
are the mean values (± 1 SD) of nine observations from three independent
experiments. Statistical significance *p < 0.05.
Figure 4. Inhibition of glycolysis by 2-DG (5 mM), 3-BP (5 µM) and fasentin (25
µM) followed by DNP treatment before irradiation (5 Gy) reverses the effect of
glycolysis induced radio-resistance in BMG-1 cells (A). Inhibition of mitochondrial
respiration without up-regulating glycolysis (using 5 µg/ ml Antimycin A) does not
confer radioresistance in BMG-1 cells (B). The data shown are the mean values
(± 1 SD) of nine observations from three independent experiments. Differences
were statistically significant (*p < 0.05).
Figure 5. Effects of DNP (1 µM) induced glycolysis on the induction (A) and
kinetics of repair (B) of radiation (5 Gy) induced DNA damage assayed using

26
single-cell gel electrophoresis in BMG-1 cells. (C) Reduction in the radiation
induced cytogenetic damage (micronuclei expression) observed in glycolysis
stimulated (DNP treated) BMG1, OCT-1 and HEK293 cells. The data shown are
the mean values (± 1 SD) of three independent experiments. Differences were
statistically significant (*p < 0.05).
Figure 6. Time dependent changes in the levels of DNA repair proteins (Rad51
and Ku70) observed following irradiation (5 Gy) showing the effects of DNP (1
µM) and DNP>2-DG (5 mM) in BMG-1 cells. Numbers shown below the bands in
the western blots represent the values normalized with respective b-actin using
densitometry on Imagequant 5.2 program and represents the fold change relative
to unirradiated control of each group.
Table 1: Table represents the DNA damage and repair parameters like damage induction and damage removal after 30 minutes between treated and untreated irradiated groups. The values were obtained from figure 5 A & B and applied in the derived formulas to obtain the final fold change of damage removed.
Parameters Formula/derivation Result
Damage Induction, DI Tail DNA, TD at 0 min. – TD in un-irradiated sample
DI without DNP, DIc 47 – 31.5 (a.u.) (values obtained from Fig. 5A)
15.5
DI for DNP treated, DId 44 – 31 (a.u.) (values obtained from Fig. 5A)
13.0
% Damage removed at 30 min., DR30min. [(TD0min. – TD30min)/DI] x 100
DR without DNP, DRc30min [(47 – 38.5)/15.5] x 100 = [0.55] x 100
(values obtained from Fig. 5A & B)
55%
DI for DNP treated, DRd30min [(44 – 32)/13] x 100 = [0.92] x 100
(values obtained from Fig. 5A & B)
92%
Fold change in damage removed at 30 min.
DRd30min/ DRc30min

27
92/55 1.7
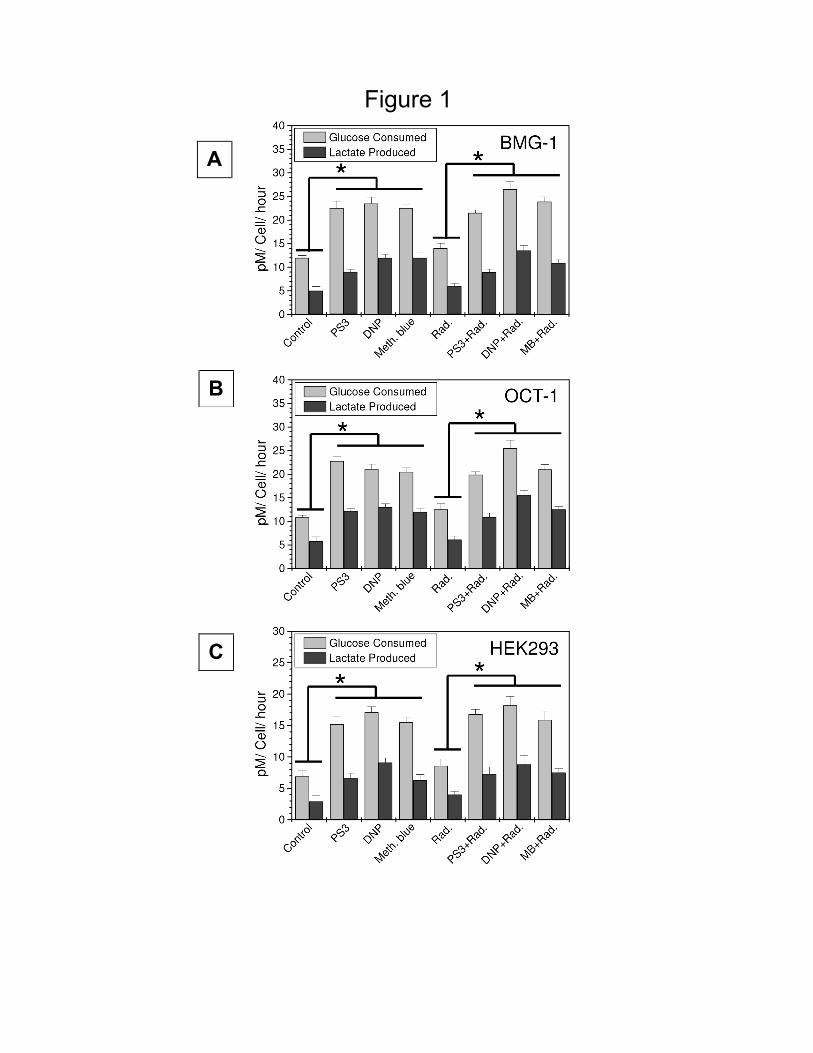
Figure 1
A
B
C

Control DNP Radiation DNP+Rad.
D
E
0
2
4
6
8
10
12
14
PFK-1 HK-II Glut-4 Fol
d C
hang
e (n
orm
aliz
ed w
ith �
-
) A
ctin
Glut-1
Control DNP *
*
Glut-1
Glut-4
HK-II
PFK-1
� Actin -
Con. DNP
*
*
0.000
0.004
0.008
0.012
0.016
0.020
Rel
ativ
e H
exok
inas
e A
ctiv
ity Absorbance at 340 nM

Figure 2
A
C
B

Figure 3
A
B
C

D

Figure 4
A
B
0.0
0.2
0.4
0.6
0.8
1.0
1.2
Irradiated Unirradiated
Sur
vivi
ng fr
actio
n
Control Antimycin A

Figure 5
C
A

Figure 6
Ku 70
�-Actin
1.0 1.31 1.54 1.0 2.0 0.84 1.0 0.54 0.76
1.0 1.24 1.41 1.0 2.0 0.87 1.0 0.73 1.36
Rad51
4 0.5 hrs. after IR
Control DNP DNP > 2-DG
0.5 4
hrs. after IR 0.5 4
hrs. after IR