dwi/ adc mri principles/ applications in veterinary medicine
TRANSCRIPT

Magnetic Resonance Imaging: The Diffusion and ADC Imaging way
Robert Cruz, DVM, MSc (Rad Health Sci), DACVR

Outline Basics (very) of MRI-DWI and ADC
physics Image contrast formation DWI in brain lesions and oncology Cases
Human cases (best examples, biopsy) Vet medicine cases (not confirmed, wlel most
of them)

Conventional Magnetic Resonance: Magnetic Nuclei. Image contrast based on proton behavior in the tissue
No magnetic field Applied magnetic field
•Net Magnetization Vector (M)•Increases as Bo Increases•High field strength – better signal•Natural precessional frequency
•It varies with field strength (ω0=B0 x γ)

Net magnetization vector This net magnetization
becomes the source of our MR signal and is used to produce MR images.
Absorption of RF energy.

Longitudinal relaxation or T1 relaxation
As energy is absorbed from the RF pulse, the net magnetization rotates away from the longitudinal direction. The amount of rotation (termed the flip angle) depends on the strength and duration of the RF pulse.
Longitudinal relaxation or T1 relaxation: The rate at which this longitudinal magnetization grows back is different for protons associated with different tissues
Fundamental source of contrast in T1-weighted images.

T1-weighted images

During the RF pulse, the protons begin to precesstogether (they become “in phase”).
Immediately after the 90° RF pulse, the protons are still in phase but begin to dephase due to several effects

Different tissues have different values of T2 and dephase at different rates.
Different tissues have different rates of T2 relaxation. T2-weighted contrast.
Image is obtained at a time when the relaxation curves are widely separated T2-weighted contrast will be maximized.
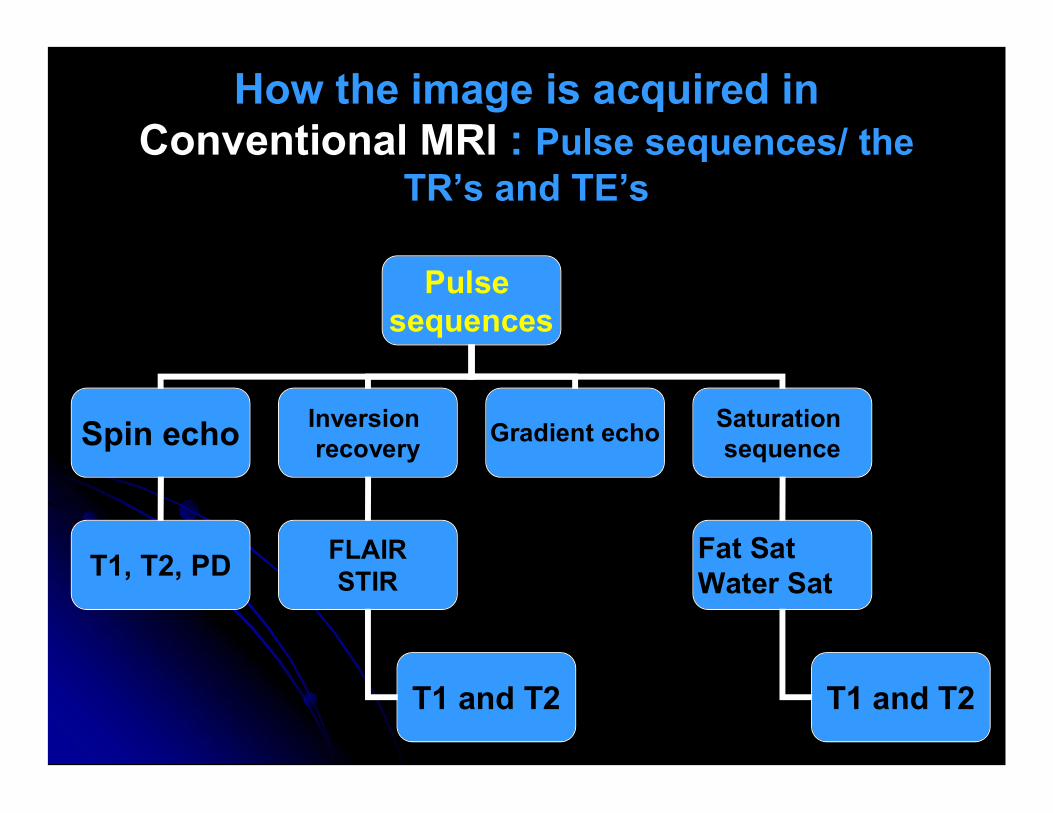
How the image is acquired inConventional MRI : Pulse sequences/ the
TR’s and TE’sPulse
sequences
Spin echo Inversion recovery
T1, T2, PD FLAIRSTIR
Gradient echo
T1 and T2
Saturation sequence
Fat SatWater Sat
T1 and T2


MRI Diffusion-Weighted Imaging: a little bit of history first (by knowing our history we
will built a better future!) History of Diffusion of molecules
In 1827, Robert Brown used a microscope to observe the continuous random motion of pollen grains suspended in water. Then A. Einstein published paper explaining that pollen was being moved by water molecules in motion
This movement, later named Brownian motion in his honor, is the cause of molecular diffusion.
Diffusion of molecules in a liquid medium Molecules in a liquid that is contained within a small cavity will
diffuse randomly until they encounter the walls: diffusion will be unrestricted.
Diffusion becomes increasingly restricted as the molecules encounter the walls

•Denis Le Bihan et al described how the “microscopic random translational motion” of molecules in fluid could be used to obtain physiologic information:
1. The water molecules found in tissues are either intracellular, extracellular, or in a vessel.
1. Diffusion of intracellular water molecules is impeded by organelles and the cell membrane.
2. Diffusion of extracellular water is affected by the cellularity of the tissue, tissue tracts, and the boundaries of the tissue compartments
MRI Diffusion-Weighted Imaging: a little bit of history first
Normal liver Liver tumor

•In 1965 first description of DWI•In 1986 diffusion MRI : diagnostic tool for neurologic disorders.•Denis Le Bihan et al described how the “microscopic random translational motion” of molecules in fluid could be used to obtain physiologic information:
MRI Diffusion-Weighted Imaging: a little bit of history first
Normal liver Liver tumor

MRI Diffusion-Weighted Imaging: a little bit of history first
In 1990, Michael Moseley et al published an article on early detection of regional cerebral ischemia in cats and compared routine T2-weighted MRI, DWI, and magnetic resonance spectroscopy

MR Diffusion weighted images Signal is based on motion of water molecules Molecular motion leads to loss of signal A strong MRI signal comes from tissues with stationary molecules The Apparent Diffusion Coefficient (ADC) can be measured to obtain a quantitative evaluation

Pulsed Gradient in Diffusion-weighted MR Imaging for image formationTwo strong gradient pulses are used/applied that allow controlled diffusion weighting, according to the following equation:
The degree of diffusion-weighting applied is indicated by the b-value (measured in s mm−2).

Pulsed Gradient in Diffusion-weighted MR Imaging for image formationTwo strong gradient pulses are used/applied that allow controlled diffusion weighting, according to the following equation:
The degree of diffusion-weighting applied is indicated by the b-value (measured in s mm−2).

Tissues with highly mobile water, such as cerebrospinal fluid (CSF) (strong diffusion) appear dark due to dephasing part of the contributing spins. Hyperintense areas = reduced diffusionHowever, the hyperintense lesion on a diffusion-weighted image may reflect a strong T2 effect (aka: T2 "shine-through" effect) instead of reduced diffusion.
MRI Diffusion-Weighted ImagingImage contrast:
1. tissue cellularity2. integrity of cell membranes

MRI Diffusion-Weighted ImagingImage contrast:
1. tissue cellularity2. integrity of cell membranes

The Tricky part: T2 shine throughAreas of restricted diffusion may appear bright in the DWI sequence: false positive for real leisonApparent diffusion coefficient (ADC) is a measure of the magnitude of diffusion (of water molecules) within tissue, and is commonly clinically calculated using MRI with diffusion weighted imaging (DWI)

The Tricky part:Areas of increased diffusion:
May appear hyperintense, isointense,orhypointense on DWI images depending on the strength of the T2 and diffusion components,
But will appear hyperintense on the ADC map
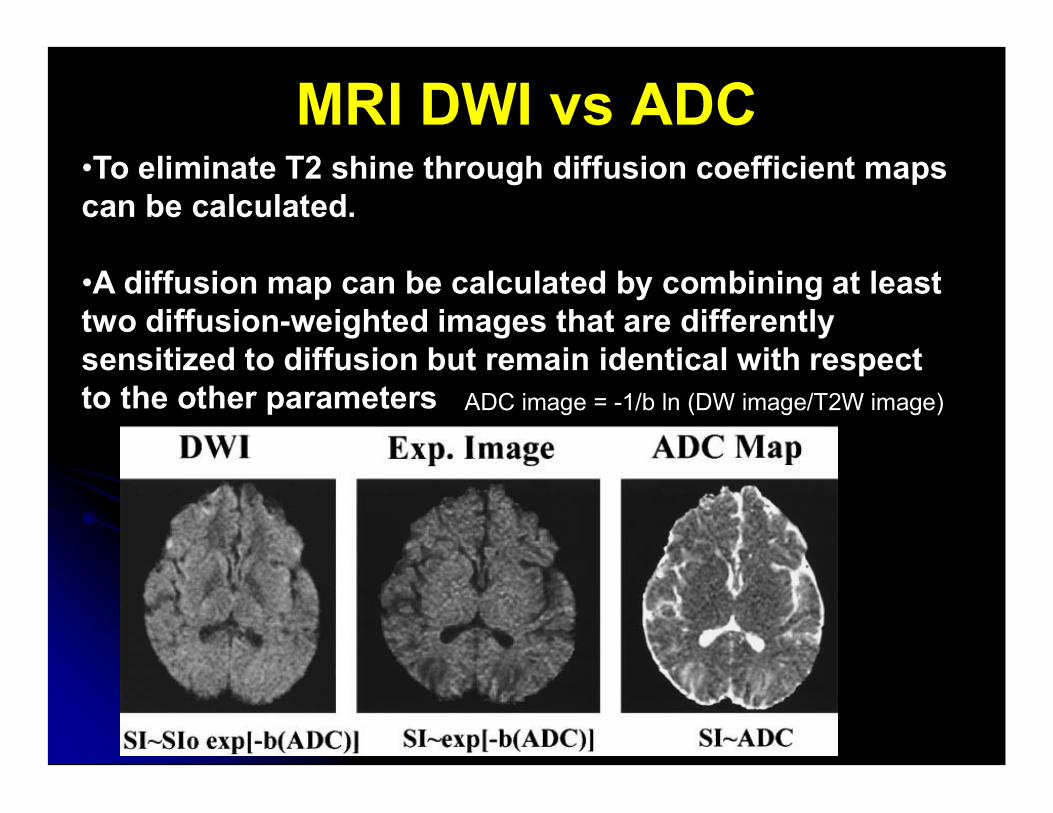
•To eliminate T2 shine through diffusion coefficient maps can be calculated. •A diffusion map can be calculated by combining at least two diffusion-weighted images that are differently sensitized to diffusion but remain identical with respect to the other parameters
MRI DWI vs ADC
ADC image = -1/b ln (DW image/T2W image)

DWI/ADC-indications: Mandatory in all patients referred with a suspicion of stroke or cerebrovascular disease• Any cystic lesions (e.g., to differentiate abscess from necrotic tumor, or epidermoid from arachnoid cyst)• Trauma to detect diffuse axonal injury (DAI) and hemorrhagic lesions; findings on DWI are believed to correlate closely with outcome• Brain tumors to assess cell density• The modus operandi should be: “diffusion imaging for all neuro-patients”
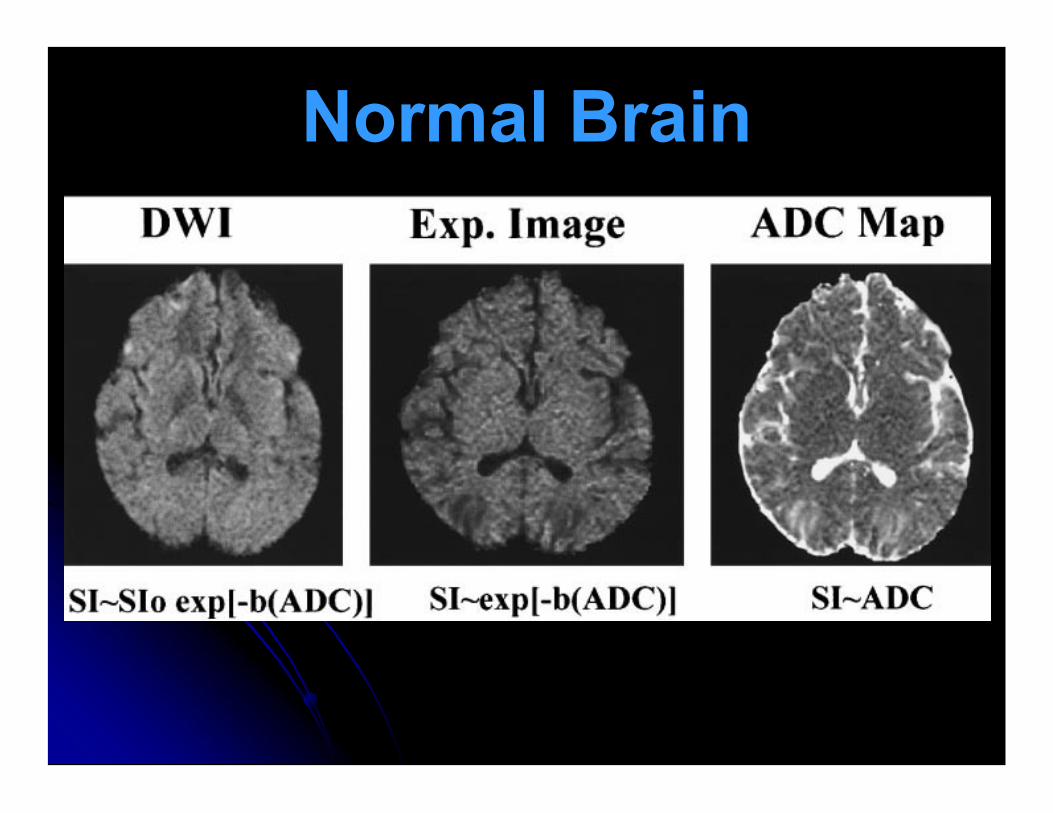
Normal Brain

StrokeTheories for decreased diffusion in acute stroke
1. Failure of Na+/K+ ATPase and other ionic pumps with loss of ionic gradients across membranes. This leads to a massive shift of water from the extracellular into the intracellular compartment (cytotoxic edema) 2. Decrease in the size of the extracellular space due to fluid shifts and cell swelling with a resultant increase in extracellular space tortuosity Increased intracellular viscosity and intracellular space tortuosity secondary to breakdown of organelles and the cytoskeletonIncreased cell membrane permeability

Acute Infarction. Human dataEarly (within the first 6 hours after stroke)
CT signs of brain ischemia are subtle and difficult to detect. On conventional MR images, early (within the first 6 hours after stroke) morphologic signs (produced by tissue swelling) are detected in 50% of acute infarctions; however, signal abnormalities are not detected. With diffusion-weighted imaging of acute infarction (within the first 6 hours after stroke), 94% sensitivity and 100% specificity have been reported.

Acute InfarctionEarly (within the first 6 hours after stroke)

Strokes

Infarct Evolution

Infarct: Top- 2hrs; bottom 3 d after tx

Non hemorrhagic infarct
Oligodendroglioma

MRI Diffusion-Weighted Imaging in oncology
Measures random motion of water in tissue Motion decreases in cellular tissue (tumor) Motion increases in necrosis or apoptosis (treated
tumor) Can do subjective and quantitative analysis
Quantitative measurement is ADC (apparent diffusion coefficient)
Does not require contrast

Diffusion Weighted MRI w/o ADC: Basic Image in oncology
Viable tumors High cell density Less water motion Bright (higher signal)
Necrotic tumors Few membranes More water motion Dark
Tumor
Cystic changes/necrosis
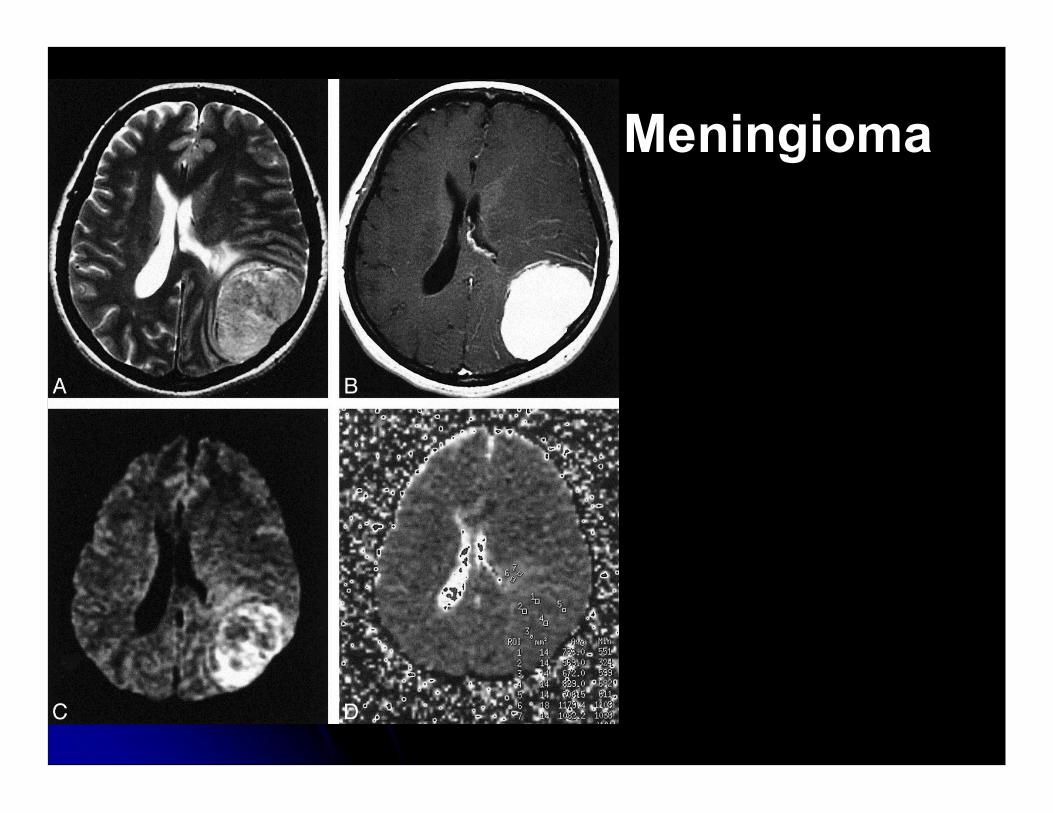
Meningioma

Astrocytoma

Mets

Atrocytoma in dogs

Meningioma

Liver mets; DWI w/o ADCB value effects
b= 300 b=600

Radiation Tumor response: radiation necrosis

Radiation Tumor response: tumor is seen

Radiation Tumor responseThe value of diffusion-weighted imaging for monitoring the chemotherapeutic response of osteosarcoma: a comparison between average apparent diffusion coefficient and minimum apparent diffusion coefficient: Human DataWith both the average ADC and the minimum ADC, post-chemotherapy values were significantly higher than pre-chemotherapy values (P < 0.05). The patients with a good response had a significantly higher minimum ADC ratio than those with a poor response (1.01 + or - 0.22 and 0.55 + or - 0.29 respectively, P < 0.05). CONCLUSION: The minimum ADC is useful for evaluating the chemotherapeutic response of osteosarcoma


Presumptive brain mass/tumorDog from UOG

Vasogenic edema: previous case

DWI LiverB=0
B=500
ADC

DWI Liver: tumor
b= 500 ADC

USUAL APPEARANCE OF CEREBRAL ABSCESS ON MRI

USUAL APPEARANCE OF CEREBRAL ABSCESS ON MRIDWI: Same patient in previous two slides. There is marked high signal intensity in the abscess corresponding to restricted diffusion of water molecules in the cavity. Note mild hyperintensity surrounding the cavity due to “T2 shine through” from edema.