dyer river - · pdf filemaine statewide tmdl for nps pollution june 2016 appendix 6-11 3 w hy...
TRANSCRIPT

WATERSHED DESCRIPTION
This TMDL applies to a 9.35 mile section of Dyer River, located in the Towns of Jefferson and Newcastle, Maine. The impaired segment of the Dyer River begins in the central portion of the watershed and flows south through a predominantly forested area, crossing .Clary Road and County Road along the way. After crossing Jones Woods Road, the stream flows through agriculture and then into a wetland before crossing South Dyer Neck Road and joining the Sheepscot River. The Dyer River watershed covers an area of 27.63 square miles. The majority of the watershed is located within the Towns of Jefferson and Newcastle, however, smaller portions of the watershed lie within the surrounding towns of Whitefield and Somerville.
Runoff from agricultural land located throughout the �
south central portion of the watershed are likely the largest source of nonpoint source (NPS) pollution to Dyer River. Runoff from cultivated lands, active hay lands, and grazing areas can transport nitrogen and phosphorus to the nearest section of the stream.
The Dyer River watershed is predominately non-�
developed (97.5%). Forested areas (80.9%) within the watershed absorb and filter pollutants helping protect both water quality in the stream and stream channel stability. Wetlands (8.6%) may also help filter nutrients.
Non-forested areas within the watershed are �
predominantly agricultural (7.33%) and are located in the south central portion of the watershed.
Developed areas (2.5%) with impervious surfaces in close �
proximity to the steam may impact water quality.
Dyer River is on Maine’s 303(d) list of Impaired Streams �
(Maine DEP, 2013).
Waterbody Facts
Segment ID: ME0105000305_528R03
Town: Jefferson and Newcastle, ME
County: Lincoln
Impaired Segment Length: 9.35 miles
Classification: Class B
Direct Watershed: 27.63 mi2
(17,683 acres)
Impairment Cause Listing: Dissolved Oxygen
Watershed Agricultural Land Use: 7.33%
Major Drainage Basin: Kennebec River
AgricultureForestWetlandDeveloped
Dyer River
TMDL TMDL TMDL TMDL Summary Summary Summary Summary Appendix Appendix Appendix Appendix 6666----11111111
Watershed Land Uses Definitions
• Total Maximum Daily Load (TMDL) represents the total
amount of pollutants that a waterbody can receive and still
meet water quality standards.
• Nonpoint Source Pollution refers to pollution that comes
from many diffuse sources across the landscape, and is
typically transported by rain or snowmelt runoff.

Maine Statewide TMDL for NPS Pollution June 2016
APPENDIX 6-11 2
Figure 1: Land Use in the Dyer River Watershed

Maine Statewide TMDL for NPS Pollution June 2016
APPENDIX 6-11 3
WHY IS A TMDL ASSESSMENT NEEDED
The Dyer River, a Class B freshwater stream, has been assessed by Maine DEP as not meeting water quality standards for the designated use of aquatic life, and placed on the 303(d) list of impaired waters under the Clean Water Act. The Clean Water Act requires that all 303(d)-listed waters undergo a TMDL assessment that describes the impairments and establishes a target to guide the measures needed to restore water quality. The goal is for all waterbodies to comply with state water quality standards.
Agriculture in the Dyer River watershed makes up about 7% of the total land area. This is almost three times the area of developed land, which accounts for 2.5% of land area. 31% of the impaired stream segment length passes through agricultural lands (Figure 1) therefore making agricultural land uses a likely contributor of sediment and nutrient enrichment to the stream. The close proximity of many agricultural lands to the stream further increases the likelihood that nutrients from disturbed soils, manure, and fertilizers will reach the stream. A large cattle operation located on Jones Woods Road and North Newcastle Road is known to spread liquid manure on all hay fields. Excess nutrient input into Dyer River through tributaries in the area is a great concern. However, the Dyer River watershed also has 8.6% wetlands, which may naturally lower dissolved oxygen concentrations in the portions of the river that flow through them.
WATER QUALITY DATA ANALYSIS
Maine DEP uses a variety of data types to measure the ability of a stream to adequately support aquatic life, including; dissolved oxygen, benthic macroinvertebrates, and periphyton (algae). The aquatic life impairment in the Dyer River is based on historic dissolved oxygen data.
TMDL ASSESSMENT APPROACH: NUTRIENT MODELING OF IMPAIRED AND ATTAINMENT STREAMS
NPS pollution is difficult to measure directly, because it comes from many diffuse sources spread across the landscape. For this reason, a nutrient loading model, MapShed, was used to estimate the sources of pollution based on well-established hydrological equations; detailed maps of soil, land use, and slope; many years of daily weather data; and direct observations of agriculture and other land uses within the watershed.
The nutrient loading estimates for the impaired stream were compared to similar estimates for five non-impaired (attainment) streams of similar watershed land uses across the state. The TMDL for the impaired stream was set as the mean nutrient loading estimate of these attainment stream watersheds, and units of mass per unit watershed area per year (kg/ha/year) were used. The difference in loading estimates between the impaired and attainment watersheds represents the percent reduction in nutrient loading required under this TMDL. The attainment streams and their nutrient and sediment loading estimates and TMDL are presented below in Table 1.
Dyer River downstream of the Jones Woods Road crossing. Station 917.
Photo: FB Environmental

Maine Statewide TMDL for NPS Pollution June 2016
APPENDIX 6-11 4
Table 1: Numeric Targets for Pollutant Loading Based on MapShed Model Outputs for Attainment Streams
Attainment Streams Town TP load
(kg/ha/yr) TN load
(kg/ha/yr) Sediment load (1000 kg/ha/yr)
Martin Stream Fairfield 0.14 3.4 0.008
Footman Brook Exeter 0.33 6.4 0.058
Upper Kenduskeag Stream Corinth 0.29 5.6 0.047
Upper Pleasant River Gray 0.22 4.6 0.016
Moose Brook Houlton 0.25 5.9 0.022
Total Maximum Daily Load 0.24 5.2 0.030
Maine Statewide TMDL for NPS Pollution June 2016
APPENDIX 6-11 5
RAPID WATERSHED ASSESSMENT
Habitat Assessment
A Habitat Assessment survey was conducted on both the impaired and attainment stream. The assessment approach is based on the Rapid Bioassessment Protocols for Use in Wadeable Streams and Rivers (Barbour et al., 1999), which integrates various parameters relating to the structure of physical habitat. The habitat assessments include a general description of the site and physical characterization and visual assessment of in-stream and riparian habitat quality.
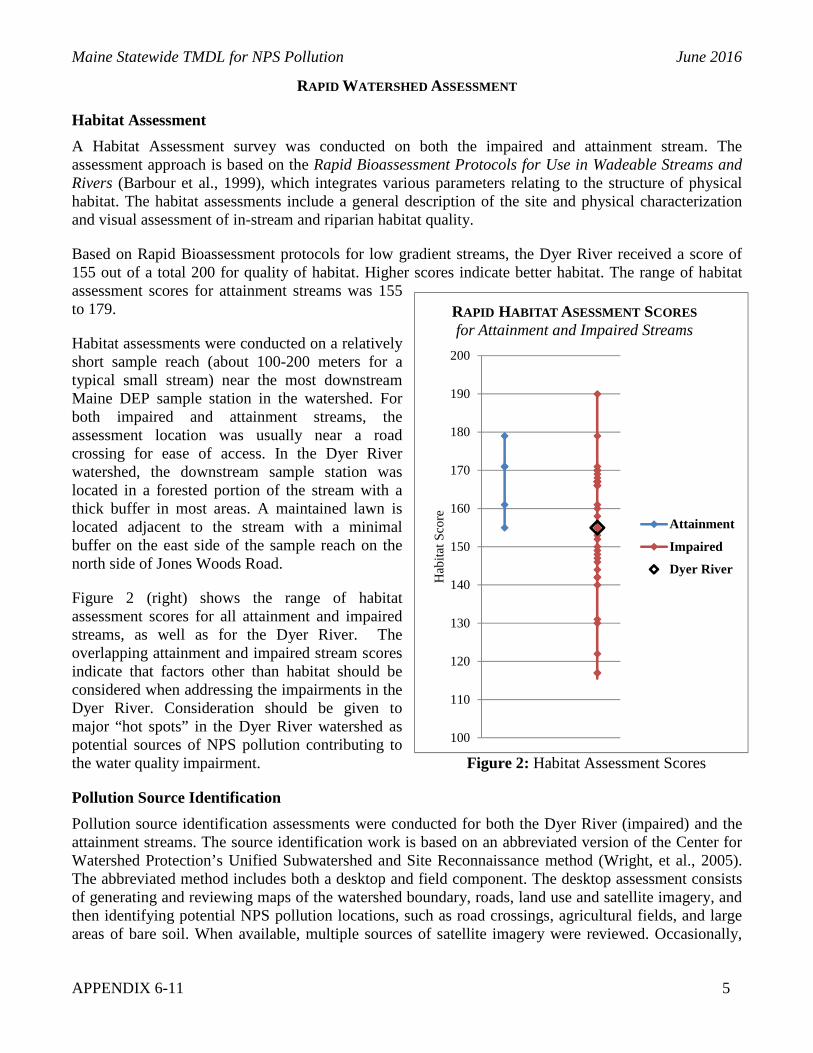
Based on Rapid Bioassessment protocols for low gradient streams, the Dyer River received a score of 155 out of a total 200 for quality of habitat. Higher scores indicate better habitat. The range of habitat assessment scores for attainment streams was 155 to 179.
Habitat assessments were conducted on a relatively short sample reach (about 100-200 meters for a typical small stream) near the most downstream Maine DEP sample station in the watershed. For both impaired and attainment streams, the assessment location was usually near a road crossing for ease of access. In the Dyer River watershed, the downstream sample station was located in a forested portion of the stream with a thick buffer in most areas. A maintained lawn is located adjacent to the stream with a minimal buffer on the east side of the sample reach on the north side of Jones Woods Road.
Figure 2 (right) shows the range of habitat assessment scores for all attainment and impaired streams, as well as for the Dyer River. The overlapping attainment and impaired stream scores indicate that factors other than habitat should be considered when addressing the impairments in the Dyer River. Consideration should be given to major “hot spots” in the Dyer River watershed as potential sources of NPS pollution contributing to the water quality impairment. Figure 2: Habitat Assessment Scores
Pollution Source Identification
Pollution source identification assessments were conducted for both the Dyer River (impaired) and the attainment streams. The source identification work is based on an abbreviated version of the Center for Watershed Protection’s Unified Subwatershed and Site Reconnaissance method (Wright, et al., 2005). The abbreviated method includes both a desktop and field component. The desktop assessment consists of generating and reviewing maps of the watershed boundary, roads, land use and satellite imagery, and then identifying potential NPS pollution locations, such as road crossings, agricultural fields, and large areas of bare soil. When available, multiple sources of satellite imagery were reviewed. Occasionally,
100
110
120
130
140
150
160
170
180
190
200
Hab
itat S
core
RAPID HABITAT ASESSMENTSCORESfor Attainment and Impaired Streams
Attainment
Impaired
Dyer River
Maine Statewide TMDL for NPS Pollution June 2016
APPENDIX 6-11 6
the high resolution of the imagery allowed for observations of livestock, row crops, eroding stream banks, sediment laden water, junkyards, and other potential NPS concerns that could affect stream quality. As many potential pollution sources as possible were visited, assessed and documented in the field. Field visits were limited to NPS sites that were visible from roads or a short walk from a roadway. Neighborhoods were assessed for NPS pollution at the whole neighborhood level including streets and storm drains (where applicable). The assessment does not include a scoring component, but does include a detailed summary of findings and a map indicating documented NPS sites throughout the watershed.
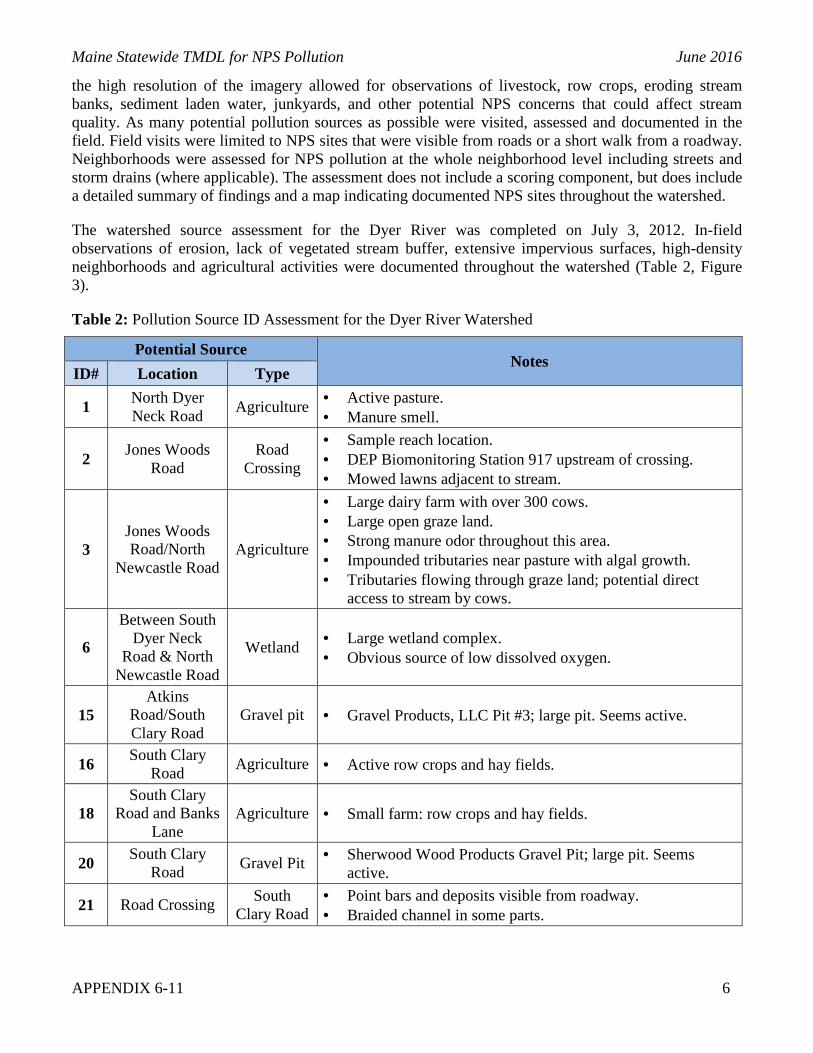
The watershed source assessment for the Dyer River was completed on July 3, 2012. In-field observations of erosion, lack of vegetated stream buffer, extensive impervious surfaces, high-density neighborhoods and agricultural activities were documented throughout the watershed (Table 2, Figure 3).
Table 2: Pollution Source ID Assessment for the Dyer River Watershed
Potential Source Notes
ID# Location Type
1 North Dyer Neck Road
Agriculture • Active pasture. • Manure smell.
2 Jones Woods
Road Road
Crossing
• Sample reach location. • DEP Biomonitoring Station 917 upstream of crossing. • Mowed lawns adjacent to stream.
3 Jones Woods Road/North
Newcastle Road Agriculture
• Large dairy farm with over 300 cows. • Large open graze land. • Strong manure odor throughout this area. • Impounded tributaries near pasture with algal growth. • Tributaries flowing through graze land; potential direct
access to stream by cows.
6
Between South Dyer Neck
Road & North Newcastle Road
Wetland • Large wetland complex. • Obvious source of low dissolved oxygen.
15 Atkins
Road/South Clary Road
Gravel pit • Gravel Products, LLC Pit #3; large pit. Seems active.
16 South Clary
Road Agriculture • Active row crops and hay fields.
18 South Clary
Road and Banks Lane
Agriculture • Small farm: row crops and hay fields.
20 South Clary
Road Gravel Pit • Sherwood Wood Products Gravel Pit; large pit. Seems
active.
21 Road Crossing South
Clary Road • Point bars and deposits visible from roadway. • Braided channel in some parts.

Maine Statewide TMDL for NPS Pollution June 2016
APPENDIX 6-11 7
Figure 3b: Source ID Locations in the Upper and Lower Dyer River Watershed. Note that this map only shows the lower portion of the impaired stream and watershed.

Maine Statewide TMDL for NPS Pollution June 2016
APPENDIX 6-11 8
NUTRIENT LOADING – MAPSHED ANALYSIS
The MapShed model was used to estimate stream loading of sediment, total nitrogen and total phosphorus in Dyer River (impaired) plus five attainment watersheds throughout the state.. The model estimated nutrient loads over a 15-year period (1990-2004), which was determined by the available weather data provided within MapShed. This extended period captures a wide range of hydrologic conditions to account for variations in nutrient and sediment loading over time.
Many quality assured and regionally calibrated input parameters are provided with MapShed. Additional input parameters were manually entered into the model based on desktop research and field observations, as described in the sections on Habitat Assessment and Pollution Source Identification. These manually adjusted parameters included estimates of livestock animal units, agricultural stream miles with intact vegetative buffer, Best Management Practices (BMPs), and estimated wetland retention and/or drainage areas.
Livestock Estimates
Livestock waste contains nutrients which can cause water quality impairment. The nutrient loading model considers numbers and types of animals. Table 3 (right) provides estimates of livestock (numbers of animals) in the watershed, based on direct observations made in the watershed, plus other publicly available data.
The Dyer River watershed is predominantly forested, with substantial mixed agricultural land uses as well. In the upper watershed, small crops were grown in hobby farm operations. Hay fields were most common. In the lower watershed pasture and hay fields dominate. A very large dairy farm is located on Jones Woods Road. An estimated 300 cows are located here. Large pastures were observed with grazing cows and a strong manure smell was documented. Three tributaries drain these fields into the Dyer River, and multiple impoundments on these tributaries were green with significant algal growth. A conversation with a neighbor during our habitat assessment indicated the use of liquid manure on the dairy’s fields. This farm is considered a hot spot and a clear source of NPS pollution to the Dyer River. About 10 alpacas were also observed along North Newcastle Road. This hobby farm was not in close proximity to the Dyer River.
Vegetated Stream Buffer in Agricultural Areas
Vegetated stream buffers are areas of trees, shrubs, and/or grasses adjacent to streams, lakes, ponds or wetlands which provide nutrient loading attenuation (Evans & Corradini, 2012). MapShed considers natural vegetated stream buffers within agricultural areas as providing nutrient load attenuation. The width of buffer strips is not defined within the MapShed manual, and was considered to be 75 feet for this analysis. Geographic Information System (GIS) analysis of recent aerial photos along with field reconnaissance observations were used to estimate the number of agricultural stream miles with and without vegetative buffers, and these estimates were directly entered into the model.
Table 3: Livestock Estimates in the Dyer River Watershed
Type Dyer River Dairy Cows 300 Beef Cows Broilers Layers Hogs/Swine Sheep Horses Turkeys Other 10 (alpacas) Total 310

Maine Statewide TMDL for NPS Pollution June 2016
APPENDIX 6-11 9
The Dyer River is a 9.4 mile-long impaired segment as listed by Maine DEP. As modeled, the total stream miles (including tributaries) within the watershed was calculated as 74.9 miles. Of this total, 2.9 stream miles are located within agricultural areas; of this length, 1.4 miles (48%) show a 75-foot or greater vegetated buffer (Table 4, Fig. 4). By contrast, agricultural stream miles (as modeled) with a 75-foot vegetated buffer in the attainment stream watersheds ranged from 34% to 92%, with an average of 61%.
Table 4: Summary of Vegetated Buffers in Agricultural Areas
Dyer River
• 74.9 stream miles in watershed (includes ephemeral streams)
• 2.9 stream miles in agricultural areas
• 48% of agricultural stream miles have a vegetated buffer

Maine Statewide TMDL for NPS Pollution June 2016
APPENDIX 6-11 10
Figure 4: Agricultural Stream Buffer in the Dyer River Watershed

Maine Statewide TMDL for NPS Pollution June 2016
APPENDIX 6-11 11
Best Management Practices (BMPs)
For this modeling effort, four commonly used BMPs were entered based on literature values. These estimates were applied equally to impaired and attainment stream watersheds. More localized data on agricultural practices would improve this component of the model.
• Cover Crops: Cover crops are the use of annual or perennial crops to protect soil from erosion during time periods between harvesting and planting of the primary crop. The percent of agricultural acres cover crops used within the model is estimated at 4%. This figure is based on information from the 2007 USDA Census stating that 4.1% of cropland acres is left idle or used for cover crops or soil improvement activity, and not pastured or grazed (USDA, 2007b).
• Conservation Tillage: Conservation tillage is any kind of system that leaves at least 30% of the soil surface covered with crop residue after planting. This reduces soil erosion and runoff and is one of the most commonly used BMPs. This BMP was assumed to occur in 42% of agricultural land. This figure is based on a number given by the Conservation Tillage Information Center’s 2008 Crop Residue Management Survey stating that 41.5% of U.S. acres are currently in conservation tillage (CTIC, 2000).
• Strip Cropping / Contour Farming: This BMP involves tilling, planting and harvesting perpendicular to the gradient of a hill or slope using high levels of plant residue to reduce soil erosion from runoff. This BMP was assumed to occur in 38% of agricultural lands, based on a study done at the University of Maryland (Lichtenberg, 1996).
• Grazing Land Management: This BMP consists of ensuring adequate vegetation cover on grazed lands to prevent soil erosion from overgrazing or other forms of over-use. This usually employs a rotational grazing system where hays or legumes are planted for feed and livestock is rotated through several fenced pastures. In this TMDL, a figure of 75% of hay and pasture land is assumed to utilize grazing land management. This figure is based on a study by Farm Environmental Management Systems of farming operations in Canada (Rothwell, 2005).
Pollutant Load Attenuation by Lakes, Ponds and Wetlands
Depositional environments such as ponds and wetlands can attenuate watershed sediment loading. This information is entered into the nutrient loading model by a simple percentage of watershed area draining to a pond or a wetland. The Dyer River watershed is 9% wetland, and overall 30% of the watershed drains to wetlands. Percent of watershed draining to a wetland in the attainment watersheds ranged from 15% to 60%, with an average of 35%.
NUTRIENT MODELING RESULTS
The MapShed model simulates surface runoff using daily weather inputs of rainfall and temperature. Erosion and sediment yields are estimated using monthly erosion calculations and land use/soil composition values for each source area. Below, selected results from the watershed loading model are presented. The TMDL itself is expressed in units of kilograms per hectare per year. The additional results shown below assist in better understanding the likely sources of pollution. The model results for the Dyer River indicate that no reductions of sediment or nutrients are needed to improve water quality. Below, loading for sediment, nitrogen and phosphorus are discussed individually.

Maine Statewide TMDL for NPS Pollution June 2016
APPENDIX 6-11 12
Sediment
Sediment loading in the Dyer River watershed is primarily attributed to crop land which accounts for 40% of the total sediment load. Agricultural sources combined (including crop land) attribute over half of the sediment loading in the Dyer River watershed (Table 5 and Figure 5). High density development and forested land also contribute significantly to the sediment load at 22% and 21% of the total load, respectively. Note that total loads by mass cannot be directly compared between watersheds due to differences in watershed area. See section TMDL: Target Nutrient Levels for the Dyer River below for loading estimates that have been normalized by watershed area.
Figure 5: Total Sediment Loads by Source in the Dyer River Watershed
0%
10%
20%
30%
40%
50%
Tot
al S
edim
ent
Sediment Sources
Sediment Load by Source
Table 5: Total Sediment Loads by Source
Dyer River Sediment Sediment
(1000kg/year) (%) Source Load Hay/Pasture 7.97 14% Crop land 23.57 40% Forest 12.12 21% Wetland 0.40 1% Disturbed Land 0 0% Sandy Areas 0.08 0% Low Density Mixed 0.78 1% Medium Density Mixed 0 0% High Density Mixed 12.85 22% Low Density Residential 0.71 1% Medium Density Residential 0 0% High Density Residential 0 0% Farm Animals 0 0% Septic Systems 0 0% Source Load Total: 58.48 100%
Pathway Load Stream Banks 45.10 - Subsurface / Groundwater 0 -
Total Watershed Mass Load: 103.58

Maine Statewide TMDL for NPS Pollution June 2016
APPENDIX 6-11 13
Total Nitrogen
Nitrogen loading in the Dyer River watershed is attributed primarily to farm animals, making up 42% of the total load. Agricultural sources combined (including farm animals) account for almost 60% of the nitrogen load in the Dyer River watershed. Forested land contributes 21% of the total load. Table 6 and Figure 6 show the estimated total nitrogen load in terms of mass and percent of total and by source. Note that total loads by mass cannot be directly compared between watersheds due to differences in watershed area. See section TMDL: Target Nutrient Levels for the Dyer River below for loading estimates that have been normalized by watershed area.
Figure 6: Total Nitrogen Loads by Source in the Dyer River Watershed
0%
10%
20%
30%
40%
50%
Tot
al N
TN Sources
TN Load by Source
Table 6: Total Nitrogen Loads by Source
Dyer River Total N Total N
(kg/year) (%) Source Load Hay/Pasture 359.9 5% Crop land 727.9 11% Forest 1377.7 21% Wetland 364.8 5% Disturbed Land 0 0% Sandy Areas 0.2 0% Low Density Mixed 24.3 0% Medium Density Mixed 0 0% High Density Mixed 643.3 10% Low Density Residential 21.9 0% Medium Density Residential 0 0% High Density Residential 0 0% Farm Animals 2795.6 42% Septic Systems 345.5 5% Source Load Total: 6661.2 100%
Pathway Load Stream Banks 37.6 - Subsurface / Groundwater 23019.5 -
Total Watershed Mass Load: 29718.3

Maine Statewide TMDL for NPS Pollution June 2016
APPENDIX 6-11 14
Total Phosphorus
Phosphorus loading in the Dyer River watershed is attributed primarily to farm animals, making up almost 60% of the total phosphorus load. Agricultural sources combined (including farm animals) account for 80% of the total load to the Dyer River. Phosphorus loads are presented in Table 7 and Figure 7. Note that total loads by mass cannot be directly compared between watersheds due to differences in watershed area. See section TMDL: Target Nutrient Levels for the Dyer River below for loading estimates that have been normalized by watershed area
Figure 7: Total Phosphorus Loads by Source in the Dyer River Watershed
0%
20%
40%
60%
80%
Tot
al P
Sources of TP
TP load by Source
Table 7: Total Phosphorus Loads by Source
Dyer River Total P Total P
(kg/year) (%) Source Load Hay/Pasture 116.7 13% Crop land 71.7 8% Forest 76.5 9% Wetland 18.4 2% Disturbed Land 0 0% Sandy Areas 0.1 0% Low Density Mixed 2.6 0% Medium Density Mixed 0 0% High Density Mixed 63.9 7% Low Density Residential 2.3 0% Medium Density Residential 0 0% High Density Residential 0 0% Farm Animals 518.7 59% Septic Systems 3.1 0% Source Load Total: 874.0 100%
Pathway Load Stream Banks 11.0 - Subsurface / Groundwater 781.0 -
Total Watershed Mass Load: 1665.9

Maine Statewide TMDL for NPS Pollution June 2016
APPENDIX 6-11 15
TMDL: TARGET NUTRIENT LEVELS FOR THE DYER RIVER
The existing loads for sediments and nutrients in the impaired segment of the Dyer River are listed in Table 8, along with the TMDL numeric target which was calculated from the average loading estimates of five attainment watersheds throughout the state. Table 9 presents a more detailed view of the modeling results and calculations used in Table 8 to define TMDL reductions, and compares the existing sediment and nutrient loads in the Dyer River to TMDL endpoints derived from the attainment waterbodies. An annual time frame provides a mechanism to address the daily and seasonal variability associated with nonpoint source loads.
Table 8: TMDL Targets Compared to Dyer River Pollutant Loading
TMDL POLLUTANT LOADS Annual Loads per Unit Area
Estimated Loads Dyer River
Total Maximum Daily Load Numeric Target
TMDL % REDUCTIONS
Dyer River
Sediment Load (1000 kg/ha/year) 0.015 0.030 No Reduction Needed
Nitrogen Load (kg/ha/year) 4.31 5.2 No Reduction
Needed
Phosphorus Load (kg/ha/year) 0.24 0.24 No Reduction Needed
Future Loading
The prescribed reduction in pollutants discussed in this TMDL reflects reduction from estimated existing conditions. Expansion of agricultural and development activities have the potential to increase runoff and associated pollutant loads to the Dyer River. To ensure that the TMDL targets are attained, future agriculture or development activities in the watershed will need to meet the TMDL targets. Future growth from population increases is a moderate threat in the Dyer River watershed because Lincoln County has increasing population trends, with a 3% increase between 2000 and 2008 (USM MSAC, 2009). The growth in agricultural lands is also increasing, with a 24% increase in the total number of farms in Lincoln County between 2002 and 2007. However, a decrease of 2% was seen in the land (acres) in farms between 2002 and 2007, and a 21% decrease occurred in the average farm size in this time period as well (USDA, 2007a). Future activities and BMPs that achieve TMDL reductions are addressed below.
Next Steps
The use of agricultural and developed area BMPs can reduce sources of polluted runoff in the Dyer River. It is recommended that municipal officials, landowners, and conservation stakeholders in Jefferson and Newcastle work together to develop a watershed management plan to:
Encourage greater citizen involvement through the development of a watershed coalition to �
ensure the long term protection of the Dyer River;
Address existing nonpoint source problems in the Dyer River watershed by instituting BMPs �
where necessary; and

Maine Statewide TMDL for NPS Pollution June 2016
APPENDIX 6-11 16
Prevent future degradation of the Dyer River through the development and/or strengthening of a �
local Nutrient Management Ordinance.
The Dyer River watershed in located within the larger Sheepscot River watershed which currently has two main associations focused on improving water quality within the greater watershed. The Sheepscot Valley Conservation Association and the Sheepscot River Watershed Coalition teamed up in 2011 and acquired an EPA 319 grant used to survey the Dyer River watershed. Bacteria sampling and an NPS survey were conducted in the summer of 2011. Recommendations following the survey included monitoring river setbacks from forestry and agricultural land uses, maintaining a long-term bacteria sampling program, investigating additional non-agricultural bacteria sources, providing outreach to state agencies that monitor gravel pits, and engaging the local community in conservation and awareness of environmental issues in the Dyer River watershed (Baeder, 2011).
Table 9: Modeling Results Calculations for Derived Numeric Targets and Reduction Loads for Dyer River
Dyer River Area Sediment TN TP ha 1000kg/yr kg/yr kg/yr
Land Uses Hay/Pasture 399 8.0 360.0 116.7 Crop land 131 23.6 728.0 71.7 Forest 5556 12.1 1377.7 76.5 Wetland 591 0.4 364.8 18.4 Disturbed Land 0 0.0 0.0 0.0 Sandy Areas 28 0.1 0.2 0.1 Low Density Mixed 30 0.8 24.3 2.6 High Density Mixed 139 12.9 643.3 63.9 Low Density Residential 27 0.7 21.9 2.3
Other Sources Farm Animals
2795.6 518.7 Septic Systems
345.5 3.07
Pathway Loads Stream Banks
45.1 37.6 11.0 Groundwater 23019.5 781.0
Total Annual Load 104 x 1000 kg 29718 kg 1666.0 kg
Total Area 6901 ha Total Maximum Daily 0.015 4.31 0.24
Load 1000kg/ha/year kg/ha/year kg/ha/year

Maine Statewide TMDL for NPS Pollution June 2016
APPENDIX 6-11 17
REFERENCES
Barbour, M.T., J. Gerritsen, B.D. Snyder, and J.B. Stribling. 1999. Rapid Bioassessment Protocols for Use in Wadeable Streams and Rivers: Periphyton, Benthic Macroinvertebrates and Fish, Second Edition. EPA 841-B-99-002. U.S. Environmental Protection Agency; Office of Water; Washington, D.C.
Baeder, C. & M. Hoffman. 2011. Dyer River Watershed Bacteria and NPS Survey Report. Sheepscot Valley Conservation Association. Newcastle, Maine.
Conservation Tillage Information Center (CTIC). 2000. Crop Residue Management Survey. National Association of Conservation Districts. Retrieved from: http://www.ctic.purdue.edu/CTIC/CTIC.html.
Davies, S. P., and L. Tsomides. 2002. Methods for Biological Sampling of Maine's Rivers and Streams. DEP LW0387-B2002, Maine Department of Environmental Protection, Augusta, ME.
Evans, B.M., & Corradini , K.J. 2012. MapShed Version 1.0 Users Guide. Penn State Institute of Energy and the Environment. Retrieved from: http://www.ctic.purdue.edu.
Lichtenberg, E. 1996. Using Soil and Water Conservation Practices to Reduce Bay Nutrients: How has Agriculture Done? Economic Viewpoints. Maryland Cooperative Extension Service, University of Maryland at College Park and University of Maryland Eastern Shore, Department of Agricultural and Resource Economics, 1(2).
Maine Department of Environmental Protection (Maine DEP). 2013. Draft 2012 Integrated Water Quality Monitoring and Assessment Report. Bureau of Land and Water Quality, Augusta, ME.
Rothwell, N. 2005. Grazing Management in Canada. Farm Environmental Management in Canada. http://publications.gc.ca/Collection/Statcan/21-021-M/21-021-MIE2005001.pdf.
University of Southern Maine Muskie School of Public Service, Maine Statistical Analysis Center (USM MSAC). December, 2009. Retrieved from: http://muskie.usm.maine.edu/justiceresearch/Publications/County/Lincoln.pdf
United States Department of Agriculture (USDA). 2007a. 2007 Census of Agriculture: Lincoln County, Maine. Retrieved from: http://www.agcensus.usda.gov/Publications/2007/Online_Highlights/County_Profiles/Maine/cp23015.pdf
United States Department of Agriculture (USDA). 2007b. 2007 Census of Agriculture: State and County Reports. National Agricultural Statistics Service. Retrieved from: http://www.agcensus.usda.gov/Publications/2007/Full_Report/Volume_1,_Chapter_1_State_Level/Maine/st23_1_008_008.pdf
Wright, T., C. Swann, K. Cappiella, and T. Schueler. 2005. Unified Subwatershed and Site Reconnaissance: A User’s Manual. Center for Watershed Protection. Ellicott City, MD.