dynamic and earthquake response of model structures … · 13th world conference on earthquake...
TRANSCRIPT

13th World Conference on Earthquake Engineering Vancouver, B.C., Canada
August 1-6, 2004 Paper No. 787
DYNAMIC AND EARTHQUAKE RESPONSE OF MODEL STRUCTURES AT THE VOLVI – GREECE EUROPEAN TEST SITE
G.C. MANOS 1, V. KOURTIDES2, B. YASIN2, V.J. SOULIS2
SUMMARY
This paper presents results of the measured response of two model structures which are constructed at the Volvi- Greece European Test Site for Earthquake Engineering. Despite the disadvantage of being unable to produce significant in-situ levels of ground motion, when desired, as can be generated by an earthquake simulator, this is in part compensated by the realistic foundations conditions, which are present for these model structures that are supported on the soft soil deposits in-situ. The current extension of the in-situ facility includes the possibility of subjecting the model structures to low to medium intensity man-made dynamic excitations. At this point in time the model structures that are built at the test site include: a) A 6-story Reinforced Concrete building with masonry infills b) A single bridge pier specimen built for the purposes of the currently running Euro-Risk program, which is supported by the European Union. The variation of the fundamental dynamic characteristics of the 6-story 1/3 3-D frame model structure was measured over a period of eight years. Masonry infills were added to this model structure at a certain period of its life span. So far, only one earthquake of moderate intensity has subjected the 6-story model structure to seismic loads and excited the permanent instrumentation system. The current sequence of experiments includes man-made dynamic excitations for both the 6-story structure and the single bridge pier. The main objective of the recent tests, which is discussed in this paper, is to identify influences on the dynamic structural response arising from the flexible support conditions.
1. INTRODUCTION 1.1. Description of the test site The Volvi test site is located at the Mygdonian valley in Greece, which is bounded from North and South at the villages of Stivos and Profitis by sloping rocky formations, whereas thick layers of alluvia deposits form the central part. Figure 1 shows a transverse cross-section of the valley at its narrowest part. This location was selected as the best position to deploy a considerable number of accelerographs in order to record the distribution of the prototype earthquake ground motion along the valley and to identify influences arising from the variation of the stiffness of the various soil-layers. For this purpose, some of these instruments are located on the stiff rocky slopes at the ends of the valley whereas the rest are placed at various locations within this section of the valley, as depicted in figure 1. In this figure, the various soil
1 Professor, Laboratory of Strength of Materials, Department of Civil Engineering, Thessaloniki 54006, tel.: 2310995657, fax: 2310995769, email: [email protected] 2Researcher, Civil Engineer, Department of Civil Engineering., Thessaloniki 54006, tel.: 2351039479

layers are also shown together with the values of their respective shear wave velocity (Vs) as found by Pitilakis (1995). As can be seen, at the central part of the valley, a number of accelerographs have been concentrated, both at the surface as well as at a certain depth in the alluvium soil layer. It is here that the model structures have been built. Figure 1. A transverse cross-section of the Volvi-valley at its narrowest part together with the test-site Figure 2. Lay out of the European Test Site at Volvi with the 6th Story Structure and the Bridge Pier The first model structure is a 6-story reinforced concrete frame model building with masonry infills (figures 1 and 2). This model structure was built at the Volvi test site in 1994, being similar to a structure,
Accelerographs
Prophitis
Stivos
SSEtogether with the Strong Motion Netwrok
Model Structure at the European Site at Volvi - Greece
NNW
100m
50m
0.5 km 1 km
( Vs = shear Wave Velocity m/secFrom Pitilakis et. al.)
Vs = 100 -200
Vs = 200 - 400
Vs > 400
Max. Capacity 20 KNtMoving Crane Facility
LAY OUT OF EUROSEIS TEST SITE
10m
7,54m
10,0
3.625,0m
9,80
2.95
2.469.2
7,100,3
5
3,30 3,70
0.4
Total weight = 153,6tStore House
3.15
3.3
6 1.5
2
6.46
Store House
A 3,3
8
2.52
2,0 7,
0
6,50
m
9,0
0m
6,75
Reaction Mass
PIER MODEL
2,5
8,25
3,35
4,00
m
6,0
SECTION A - A
PIER MODEL
8,25m
5,00
5,82
5,00m
1.5
3.5
7,0
5-Story Model
Uti
lity
Roo
m
3.5
5-Story Model
2,0
3.5
Reaction MassMax. Capacity 20 KNtMoving Crane Facility4.
2
Reaction Mass3.5
1.5
A
4,30
2,00
4,30m

with approximately the same dimensions but without masonry infills, which has been studied by Okada (1992) and co-workers at Chiba Field Station of the Institute of Industrial Science of the University of Tokyo in Japan. The second model structure is a single bridge pier and its foundation block (Pier B1). This bridge pier model structure was recently built (2004) at the Volvi test site and is similar to corresponding bridge piers that were tested at ELSA laboratories of the European Joint Research Center (Pinto 1996), but of larger dimensions and a different cross-section detailing as will be explained below. The lay out at the Test Site is depicted in figure 2; apart from the structural models and the network of strong motion accelerographs this facility also includes a crane, a store house and a power generated hydraulic system.
2. THE VOLVI 3-D 6-STORY MODEL STRUCTURE. 2.1. Description of the model structure. Figures 3, and photos 1 and 2 depict this structure that is made of reinforced concrete cast in-situ. The basic properties for the concrete and the reinforcement have been monitored through samples taken during construction. The average concrete strength was found equal to 26Mpa for the columns and 15.8Mpa for the slabs; the yield stress of the longitudinal and transverse reinforcement was found equal to 338Mpa and 319Mpa, respectively. The masses at each story, both from the dead weight of the structural elements as well as the extra mass that was symmetrically distributed at each story slab are recorded in detail (Manos 1995b, 1997, 1998, 2000). 2.2. Studied structural configurations. This 5-story structure, at the European Test Site at Volvi, must be considered, in the 10 year period of its existence, in the following six basic structural configurations: Figure 3. The 6–story model structure (Masonry scheme 2b, September 1997 – January 2004)
3 2
14
800mm
100mm
1710mm
800mm
850mm
1.81m
850mm 1610mm100mm 100mm
850mm
900mm 1710mm 900mm
3500mm
VOLVIMODEL STRUCTURE
100mm
2000mm
250mm
2500mm
850mm
(Αdditional 6th Floor)
1000mm 110mm
1610mm
110mm
400mm
5000mm
3500mm
typical slabthickness 80mm
845mm
80mm75mm
FOUNDATION SLAB
deep
880mm
220mm400mm
265mm
1570mm155mm
1000mm
1000mm
1000mm
1000mm
Added Mass33.35KN

a. Reinforced concrete structure without added weight and without any masonry infills (“Virgin” structure, September - November, 1994). b. Reinforced concrete structure with 50KN added weight but without any masonry infills (“Bare” structure, November 1994 - June, 1995). c. Reinforced concrete structure with 50KN added weight and with masonry infills in all but the ground floor (Masonry scheme 1, July 1995 - December 1996). d. Reinforced concrete structure with 50KN added weight and with masonry infills in all floors (Masonry scheme 2a, January 1997- August 1997). e. Apart from the existing added weight of 50KN, extra weight of approximately 30KN is placed on top of a sixth floor specially constructed for this purpose (Masonry scheme 2b, September 1997 – January 2004, figure 3). f. The extra weight of approximately 30KN is placed on a sixth floor, but this time suspended from the steel girders forming the 6th floor. Moreover, the tops of the 6th floor columns are braced with a T section steel beam that is part of a medium excitation fixture, to be attached at the 6th floor level (Masonry scheme 2c, February 2004 - today). Photo1. 5th –story structure with masonry infills. Photo 2. 6th – story structure with masonry infills. The above five basic configurations were combined with the selected presence of a number of diagonal steel cables at the bays of the story frames to thus form various sub-formations. The first main sub-formation is when all diagonal steel cables are active (by being pre-stressed) and the second main sub-formation when all diagonals are inactive (being loose). These sub-formations were employed in all three configurations, i.e. the “Virgin”, the “Bare” and the “Masonry scheme 1” and “Masonry scheme 2”. From September 1997 a 6th story was added together with 30KN extra weight at this story, as indicated in figure 3 and photographs 1 and 2. In all these cases, the symmetry in the mass and stiffness distribution is maintained with respect to both x-x and y-y axes. In addition, for the “Bare” structure with added weight and without masonry infills, an additional asymmetric scheme of active diagonals was
employed, whereby the presence of the diagonal cables was non-symmetric. For all cases low-level excitations were introduced and the corresponding dynamic response was measured. For each configuration, based on this measured response, the modal shapes and frequencies were identified. 2.3. Instrumentation – Low amplitude dynamic tests. A permanent instrumentation system was utilized to monitor the earthquake structural response. Each story has three acceleration sensors mounted at the mid-plane of the corresponding slab; additional sensors are mounted on the foundation block. This data acquisition system, constructed and then proof-tested at Aristotle University, Earthquake Simulator Facility, is operating at the test site on a continuous basis. The instrumentation aims to monitor all aspects of the input ground motion at the foundation level of the test structure as well as the acceleration response of the model at every story. By comparing the ground motion recorded at the free surface by the accelerographs located nearby (at a distance of approximately 12m, with the motion that will be recorded at the foundation, possible variations are expected to be identified. Moreover, the permanent instrumentation is combined with portable equipment from the Earthquake Simulator Facility of Aristotle University to conduct low-amplitude dynamic tests. A large number of low-amplitude dynamic tests have been conducted in-situ over an extended period from 1995 till today. A special technique was developed for deriving the dynamic characteristics of this model structure from the measured response during these in-situ low-amplitude dynamic tests. By combining the large volume of the response measurement data from the various in-situ low-vibration sequences, the most important mode shapes and eigen-frequencies were identified. Summary results of this data analysis from a large number of in-situ measurements are given by Manos et.al (2000). When viewing these results, careful consideration must also be paid to the structural changes introduced to the test structure during this period, as outlined in 2.2. above. The following summarize the most important observations: - The fundamental frequency of the structure without the ground floor masonry infills exhibited only
relatively small changes with time. When masonry infills were added at the ground floor, apart from the large increase in the observed fundamental frequency values, a variation of these values with time was also observed, due to the increase of the stiffness of the infills with time. This occurred within a period of the first eight months.
- The presence of the diagonals in the upper four floors has little effect on the stiffness of the structure, due to the stiffness of the masonry infill. Furthermore, the presence of the diagonals only at the first story (without infills) does not result in any significant increase in the structural stiffness. As expected, the addition of the 6th floor extension with its extra mass, lowered the fundamental frequency values.
A more detailed presentation of the modal analysis results, obtained from these measurements for certain cases of the model structure, is included in the following section 2.4. 2.4. Modal analysis of the observed response. As mentioned in section 2.2, from September 1994 till May 1995 the 6-story model structure had no masonry infills. From October 1995 till January 1997 this model structure had masonry infills in all but the ground floor (pilotis). Masonry infills were added at the ground floor in February 1997. The last low-intensity vibration sequence, before adding the ground floor masonry infills, was performed during January 1997. From February 1997 till September 1997 the 5-story structure had masonry infills in all five stories. A sixth story was added to the structure together with additional mass by the end of September 1997. The last low-intensity vibration sequence before adding the sixth story was performed on 12th September, 1997. Prior to these tests, additional low-intensity vibration sequences were performed; one during February 1997, immediately after the construction of the ground floor masonry infills, and another one three months later (April 1997). The modal analysis in the case with the masonry infills was more complex, as the modes to be extracted from the measured response, were coupled, containing translational as well as torsional response. The in-situ investigation included numerous low-intensity vibration tests with the pull out force applied in a

direction parallel to one of the axes of the test structure (e.g. the x-x axis, symbolized as pull-out x-x). In one forcing sequence the pull-out force was applied at the mid-point of the slab-side between the columns (either x-x or y-y) whereas at the second test sequence (symbolized as φ- φ) the force was applied at the corner of the same slab-side. The full test sequence contains five tests corresponding to the force being applied at a different story (from the 1st to the 6th). The response, measured in this way, was analyzed at the Earthquake Simulator Facility of Aristotle University, by obtaining the fast Fourier transform (FFT) amplitude and phase spectra. Then, for each test sequence, certain steps were taken in combining the response from all fifteen measuring points and thus extracting the mode shapes, as can be seen in figure 4 for the x-x translational mode of 6th story structure with masonry infills. 2.5. Basic observations on the influence of the masonry infills on the dynamic response. As was to be expected, the presence of the masonry infills in the upper stories has significantly influenced both the eigen-frequency values and mode shapes that were obtained from the structural configurations without the masonry infills. The following conclusive observations can be deduced from these results at this stage: - When masonry infills are in all but the ground floor (pilotis) the ground floor (being more flexible)
exhibits increased deformation demands. - The presence of the masonry infills in all five floors introduced coupled (translational-torsional)
modes of response despite the fact that all masonry was built with the same materials and in such a way as not to disturb the symmetry of the structural system.
- The presence of the masonry infills initiated noticeable rocking at the soil-foundation interface. The presence of this rocking response was identified during the last stages of testing for the 5-story structure. It was possible to measure this rocking response with additional instrumentation placed at the foundation level in close proximity to the foundation slab.
Figure 4. Measured x-x translational mode of 6th story structure with masonry infills.

3. THE SINGLE BRIDGE PIER MODEL. This structure is a small scale representation of a single bridge pier. This type of structure has attracted research interest in the last decade, especially following the spectacular damage of bridges during the Northridge and Kobe earthquakes. Towards the objective of increasing our understanding on the earthquake behavior of bridge structures and in the framework of prenormative research of Eurocode 8 a series of pseudo-dynamic tests on 1:2.5 scaled bridge piers were conducted at ELSA Laboratoty of the Joint Research Center, Ispra (Pinto 1996). Moreover, shaking table tests on a 1:8 scale bridge model were carried out in the Structural Dynamic Testing Laboratory of ISMES, Seriate, Italy. Whereas the cross-section of the ELSA models was a hollow rectangular cross-section, more closely representing the cross-section of a prototype bridge pier, the cross-section of the ISMES piers as well as the ones to be presented in this work are of a monolithic prismatic cross-section, dictated by scaling considerations. The overall cross-section dimensions of the ISMES model piers and the model pier to be tested at the Volvi test site are quite similar. The cross-section of the Volvi model pier, together with the reinforcing details, is shown in figure 5. Whereas the tests conducted both at ELSA and ISMES had the foundation block of the corresponding pier rigidly attached either on the strong reaction floor or on the shaking table platform, the Volvi pier foundation rests on the soil surface at the test site.
Figure 5. Dimensions and reinforcing details of Volvi pier cross-section
3.1. Configurations of the Volvi model pier. Two bridge pier models with their foundation blocks have been built at the Laboratory of Strength of Materials of Aristotle University, according to the final design (Model Pier A1 and A2). These models, A1 and A2, are identical in all reinforcing details, cross-sectional dimensions and material properties to the model Pier which has been built at the Volvi test site (see figures 5 and 6). They differ only in the following:
- The height of piers A1 and A2 is 1800mm whereas the height of the Volvi pier (B1) is 4000mm. The height is measured from the top of the foundation block to the top of the pier.
- The foundation block of piers A1 and A2 is 1m x 1m in plan with a thickness of 0.3m. On the contrary, the foundation block of the Volvi pier is a properly formed single footing, with a bottom plan with dimensions 2.48m x 2.48m and a top plan 1.62m x 1.62m. The total thickness of this foundation block is 0.6m.
Models A1 and A2 served the purpose of ensuring the strength capacity of the Volvi model Pier structure. They have been tested at the Strong Reaction Frame of the Laboratory of Strength of Materials
L=1.020 m
L=1.020 m
8Φ6
Φ6/100 (mm)

under combined loading conditions resembling the ones at the test site. In this way, the various features of the cyclic performance of these model structures could be observed and recorded at the Laboratory ensuring that they do not exhibit undesirable deviations from the ones predicted by the preliminary and final design in the framework of the objectives of this research program. The differences in height and foundation of these piers from the Volvi pier have been introduced in order to accommodate these models (A1 and A2) within the space limitation of the strong reaction frame at the laboratory. These two piers were tested, as is presented in a summary form below.
Figure 6. Reinforcing details of model piers A1 and A2. Table 1. Geometric and material characteristics of the current project pier models.
Dimensions Measured Steel Strength Model Code Name Height (m) Cross-section
Foundation
Measured Concrete Strength (at the
bottom cross-section) Yield Ultimate
A1 1.8 20cm x 50cm 1.0m x 1.0m x 0.3m 26.0Mpa 344.8Mpa 470.9Mpa A2 1.8 20cm x 50cm 1.0m x 1.0m x 0.3m 26.0Mpa 344.8Mpa 470.9Mpa B1 4.0 20cm x 50cm 2.5m x 2.5m x 0.6m -- 344.8Mpa 470.9Mpa
- A model pier structure (Model Pier B1) with a height of 4000mm and a foundation block 1m x 1m x 0.3m was also built at the Laboratory. This pier has identical material characteristics and construction details for the concrete and reinforcing bar parts with those of models A1 and A2.
- An extended foundation footing of 2.5m x 2.5m x 0.6m, built separately from the model pier B1, has a hollow part in its top with the appropriate dimensions so that the 1m x 1m x 0.3m block of pier B1 could be totally encased. This extended foundation was also built at the Laboratory of Strength of Materials of Aristotle University and was transported to the test site. The main advantage of the composite foundation scenario is that building time was gained in this way during the bad weather of the winter months. Furthermore, the compatibility of the various fixtures for attaching the constructed part of Model Pier B1 with that of the extended foundation was tested inside the laboratory. Finally, the damage and subsequent failure of pier B1 will be dealt with in the future in-situ by means of the
1
Φ6/100
3
4 7
1
Φ6/100
14Φ
6 L
=4.2
50 m
7Φ6 L=1.400 m3
2Φ6 L=0.960 m4 2Φ6 L=0.960 m7
2
6
5
7Φ6 L=1.400 m2 5 7Φ6 L=1.400 m
7Φ6 L=1.400 m6
B B
AA AA 2
4

total replacement of the damaged upper part of the model B1 with its foundation block of 1m x 1m x 0.3m with a new identical part, which could again be totally encased in the hollow top part of the extended foundation footing.
- A steel platform has been designed and constructed that was rigidly attached at the top of the Volvi pier B1. This steel platform represents the deck of the pier. On top of this platform, weights in the form of concrete slabs are fixed. This provides the necessary weight in order to apply the desired level of axial load on the cross-sections of the pier. In addition, these added masses also generate horizontal forces of a desired amplitude at this “deck” level. This will be utilized during the artificial excitation tests that are planned in the near future, as well as in the eventuality of an earthquake event that will excite the bridge pier model structure at the test site. The R.C. slabs which are fixed at the model B1 pier bridge deck, have been constructed at the laboratory and have been transported to the test site. They are of two types. The first type (6 pieces) is of 1.1m x 2.0m x 0.15m whereas the second type is 1.7m x 2.0m x 0.15m. The total weight of the steel platform and the R.C. slabs is approximately 9 tones. The axial load of the pier cross-section adjacent to the foundation at the bottom of the pier is approximately 100KN. The overall dimensions of the deck are 2000mm x 4000mm.
Photo 3a and 3b Pier A2 at the strong reaction frame. Photo 3c. Pier B1 at the laboratory
3.2. Obtained Results - Piers A1 and A2 tested at the laboratory
Pier models A1 and A2 have been tested at the strong reaction frame at the laboratory. They were subjected to combined horizontal and vertical loads. The horizontal load was applied through a predetermined cyclic variation of the applied horizontal displacement at a location 1.42m from the bottom cross-section of the pier (see photos 3a, b, c). This cyclic displacement was applied with a progressively increasing amplitude, up to a maximum amplitude of 20mm, with consecutive sinusoidal cycles having a frequency of 1Hz. The aim was to keep the vertical load constant during the application of the horizontal cyclic displacements. For this purpose, two different schemes were tried at the laboratory. In the first scheme, which was used for model A1, two one-way active hydraulic jacks without any electronic control were utilized, together with a system of accumulators. However, this scheme did not successfully maintain the vertical load constant at its predetermined level. A variation of the vertical load could be observed during the cyclic variation of the horizontal load. This variation of the vertical load increased as the amplitude of the horizontal displacement at the top of the pier was increased. The second scheme of
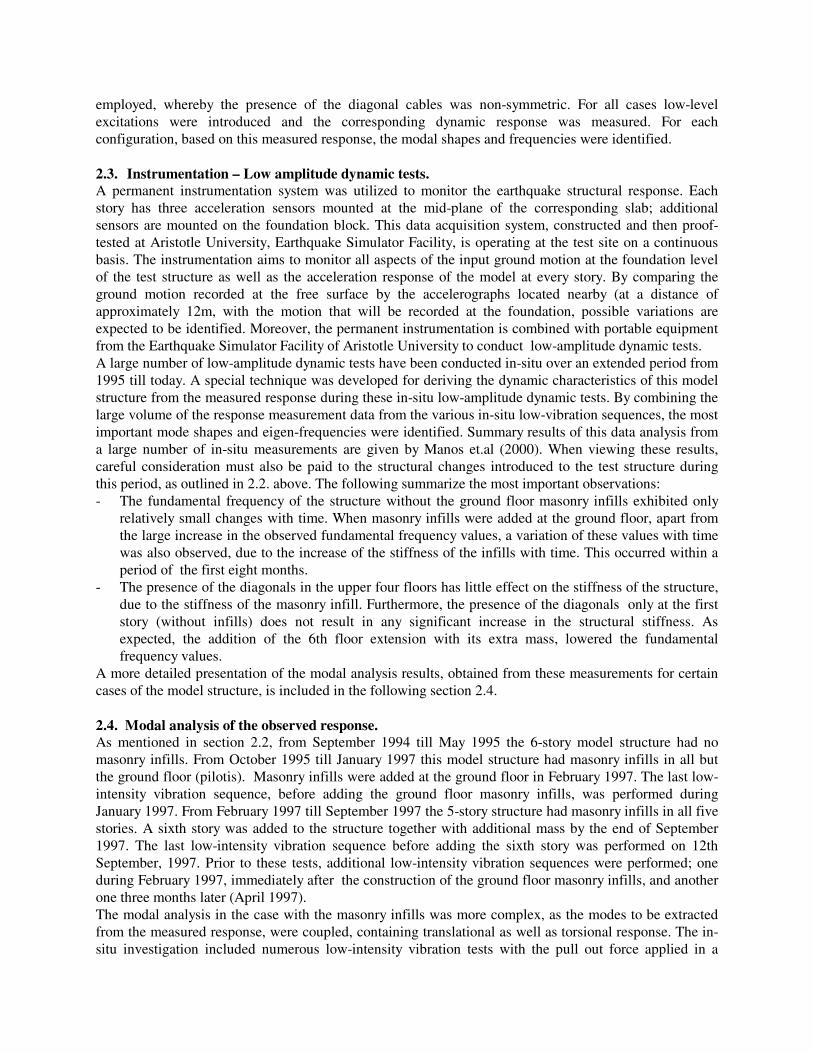
applying the vertical load utilized a two-way hydraulic actuator electronically controlled. This was used in model A2 as well as in all subsequent tests with the repaired piers A1 and A2. Again, a variation of the vertical load could be observed during the cyclic variation of the horizontal displacement at the top of the pier. However, this variation was of relatively smaller amplitude than the corresponding variation observed during the tests with pier A1. The initial level of axial compressive load was equal to 95KN.
Figures 7a, b, c. Observed cyclic behavior of pier A2 tested at the strong reaction frame.
The observed cyclic behavior of pier A2 is depicted in figures 7a, b, c. The top left plot (7a) is the observed behavior in terms of the variation of the applied top horizontal cyclic displacement versus the horizontal load sustained by the pier. The bottom left plot (7b) is the variation of the bending moment that develops at the bottom cross-section of the pier versus the rotations at this cross-section. Finally, the figure on the right (7c) depicts the flexural damage that developed at the bottom cross-section of the pier A2. Both the measured load-deformation cyclic response together with the observed damage for pier A2 demonstrate that the non-linear flexural response at the bottom of the pier is the predominant mode of response for this structure. This was one of the objectives that aimed at the preliminary and final design stage, which was successfully fulfilled.
4. NUMERICAL SIMULATION OF THE OBSERVED 6-STORY STRUCTURE RESPONSE These numerical simulations extended in the linear range only and included a 3-D simulation of the foundation slab of all the concrete parts, of the diagonal cables, of the masonry infills, and finally of the 6th story extension of the Volvi structure. Provisions were made within certain of these numerical simulations to incorporate the flexibility of the foundation-soil interface. This numerical study employed shell elements for the R.C. slabs and the foundation block and 3-D beam elements for the R.C. columns and beams at each story level. The diagonal cables and the masonry infills were numerically simulated with diagonal “bar” elements having only axial stiffness with values derived from the experimental sequence of the 6-story structure as well as from similar single-story infilled frames

tested at the laboratory. The following provide a brief description of certain additional aspects utilized in this numerical study. - The columns were assumed to be axially very stiff and without mass. - The mass of all structural parts as well as the extra mass was assumed to be concentrated at the level
of the slabs. - Gross cross-sections were employed for the stiffness properties of the R.C. columns and beams. The
value of the modulus of elasticity was found from laboratory tests with samples taken during the construction stage.
4.1. “Bare” Volvi structure. Predicted dynamic response with added masses and diagonal cables. Measured and predicted response during the earthquake of 4th May, 1995. The “Bare” Volvi structure with added masses and without infills, but with the diagonal cables considered to be effective after a small amount of pre-stressing, was numerically simulated, in the way previously described. The material properties for the R.C. cross-sections were the ones found from correlation studies with the structure in the ”bare” configuration without diagonals. The cross-sectional properties of the diagonal cables were adjusted so as to have the first three eigen-frequencies, e.g. 1st translational x-x, 1st translational y-y, and first torsional, with values equal to the ones measured in-situ (see Table 2). The axial stiffness of the diagonal cables was kept the same for all stories. The above adjustments were made based on the measured response during the symmetric cases with all diagonals. Two earthquakes occurred on the 4th April, and 4th May 1995, with an epicentral distance from the Volvi test site approximately 40km. Despite the fact that these earthquakes generated relatively low-intensity ground motion at the test-site, the “Bare” Volvi structure was excited from those two ground motions and the response was recorded and stored by the permanent instrumentation scheme. During this earthquake sequence, the structure at Volvi had the following configuration: the added weights were in place, no masonry infill had been built as yet, and all diagonals were pre-stressed in all floors. The recorded acceleration response in the x-x and y-y directions at the 5th floor are depicted in figures 19a and 19b, respectively. The assumptions mentioned before were also employed in order to predict the earthquake response of this structure. From the frequency domain study of the response, measured during this earthquake, an adjustment was introduced in the stiffness properties in such a way as to result in the following fundamental frequency values: translational x-x direction 2.496Hz (instead of 2.603Hz of Table 1); translational y-y direction 2.512Hz (instead of 2.62Hz) and torsional 2.50Hz (instead of 2.53Hz). From a parametric numerical study conducted for this purpose, better agreement between numerical and measured response could be obtained by employing this new set of stiffness. The time history of the earthquake record that was used as input in this numerical simulation was the one recorded by the 16bit accuracy accelerograph operated by the Institute of Engineering Seismology and Earthquake Engineering at the utility room at a distance of 12m from the foundation block of the 5-story structure. Initially, in this simulation, a value was assigned to damping ratio equal to 2.2%, based on the study of the results obtained during the free vibration tests. However, from the numerical parametric study a better agreement could be obtained between the observed maximum earthquake response at the top slab of the 5-story structure and the corresponding results obtained from this numerical simulation when this damping ratio value was taken equal to 3.5%. This increase in the damping ratio value is well justified from the fact that the structure, during the free vibration tests, was excited at lower acceleration levels than during the earthquake sequence of 5th May, 1995. During this sequence the peak horizontal acceleration at the top slab exceeded the level of 0.1g. The predicted 5th story acceleration response demonstrated good agreement with the corresponding measured values. 4.2. Volvi structure with masonry infills. The simulation of the influence of the masonry infills on the dynamic response of the 3-D “Infilled” Volvi structure was achieved by introducing two diagonal spring elements for each infill (Smith 1966). At the same time, the mass of each slab was increased in order to account for the mass of the masonry infills

in all 5 stories. This simulation was valid only for linear-range behavior of the masonry infills. In simulating the masonry influence, the used value for the axial stiffness of the employed two diagonals was based on the observed behavior of the 2-D “bare” and masonry infilled one-bay single-story frames at the laboratory, as mentioned before. In order to simulate numerically the observed 2-D single-story behavior at the laboratory, two diagonals were used again to introduce the stiffness of the masonry infill. Based on a range of values, derived from simulating the observed single-story infill frame behavior, various approximations were tried for the 3-D “Infilled” Volvi structure. No attempt was made at this stage to approximate the stiffness of the masonry infills with values based on empirical formulae suggested by various researchers (e.g. Smith 1966). This will be the objective of a future parametric study. In the current investigation, the significance of the various influences arising from the presence of the masonry infills is clearly demonstrated, based on the response that was measured experimentally at distinct stages of the whole sequence, both in-situ as well as at the laboratory. Reasonably good agreement between the measured eigen-frequency values for the various structural configurations and the corresponding numerically predicted values can be seen in Table 2. Table 2. Numerical simulation of the dynamic response of the 3-D model structure at Volvi
EIGEN-FREQUENCIES (HZ) PREDICTED OBSERVED
Numer. Simulation/ Structural
Configuration Mode
1 Mode
2 Mode
3 Mode
x-x Mode
y-y Mode φ-φ
TotalMass
(t)
Remarks on aspects of the adopted numerical
simulation
5stry5d. / Conf. b
2.438 φ-φ
2.473 y-y
2.478 x-x
2.375 2.375 2.500 17.85 Higher Young’s Modulus
5str5da. / Conf. b
2.434 φ-φ
2.496 x-x
2.501 y-y
2.375 2.375 2.500 17.85 Columns axially stiff
5str5ea. / Conf. b+Diag
2.640 y-y
2.640 x-x
2.711 φ-φ
2.625 2.625 2.500 17.85 Diagonal Steel Cables
5str5eb. / Conf. b+Diag
2.507 φ-x
2.57 x-y
2.638 φ-y
2.441 2.441 2.563 17.85 Asymmetric Diagonals
5str5fa. / Conf. b+Diag
2.588 y-y
2.590 x-x
2.692 φ-φ
2.625 2.625 2.500 17.85 Flexible Foundation
5str5ga. / Conf. c+Diag
4.102 y-y
4.127 x-x
4.258 φ-φ
4.150 4.270 4.520 19.53 Infills in all but ground floor where diagonals. Flexible Foundation
5str5gb. / Conf. c
4.027 y-y
4.047 x-x
4.168 φ-φ
4.030 4.030 4.270 19.53 Infills in all but ground floor Without diagonals
5str5ia. / Conf. d
5.453 y-y
5.537 x-x
6.098 φ-φ
5.737 - 6.226 19.53 Infills in all 5 stories Flexible Foundation
5str5ib. / Conf. d
6.174 φ
6.345 y
6.447 x
5.737 - 6.226 19.53 As 5str5ia but with base fixity
5str5ic. / Conf. d
5.570 y-φ
5.666 x-φ
6.355 φ-φ
5.737 - 6.226 19.53 Asymmetric masonry stiffness Flexible Foundation
5str5ja. / Conf. e
4.673 y-y
4.745 x-x
5.121 φ-φ
5.005 4.761 - 22.90 6th Story extension with extra mass. Flexible Foundation
x-x , y-y translational and φ-φ torsional modes, x-φ , y-φ complex modes

4.3. Influence of the foundation flexibility. The simulation of the flexibility of the foundation was attempted by introducing vertical springs as supports at the nodes of the shell elements representing the foundation block. When these springs were introduced to the relatively stiff 5-story structure with the masonry infills it resulted in significant variations of the numerically predicted eigen-frequency values. This can be seen in Table 3, when comparing the outcome of the simulation encoded “5str5ia” (5-story structure with masonry infills and flexible foundation) with that of the simulation encoded “5str5ib” (identical structural formation but with base fixity). Such axial stiffness was assigned to the vertical springs, employed in simulation “5str5ia”, that reasonably good agreement could be achieved between predicted and observed eigen-frequency values (Tables 2 and 3). The same vertical springs were introduced to the numerical simulation of the relatively flexible structural formation of the 5-story structure without the masonry infills (with diagonal cables “5str5fa”). In this case, the influence of the foundation flexibility introduced in this way was only a small decrease in the predicted eigen-frequency values, as can be seen in Table 3, when the “5str5fa” predictions are compared with those of simulation “5str5ea” (with base fixity). The same vertical spring supports were retained for the simulations encoded “5str5ic” and “5str5ja” (representing, with the addition of an extra floor, the 6-story structure). The agreement between predicted and observed eigen-frequency values for the simulation of the 6-story structural formation is also reasonably good (see Tables 2 and 3). Further studies are currently under way in the framework of an extended research program, supported by the European Union, to study the influences introduced on the dynamic response of structures by the soil-foundation flexibility.
Figure 8. 3rd SSI mode ( 3.57Hz, modal mass 32% of total) 4.4. Preliminary numerical study for SSI effects at the Volvi European Test Site. A preliminary numerical study was also performed in order to establish certain frequency ranges whereby soil-structure interaction (SSI) may develop. For this purpose a soil formation with dimensions 104m length, 4m width and 30m depth was numerically modeled with finite elements (as depicted in figure 8). Whereas the boundary at the bottom was considered as absolute fixity, the boundary conditions at the two sides were varied in a parametric numerical study to be either fixed, free, restrained only in the vertical direction, or, finally, supported by horizontal and vertical springs. The final case was selected as more realistic, although the resulting fundamental frequency values for the various support conditions did not differ significantly. The properties of the simulated elastic medium were based on certain dynamic soil parameters as were measured in-situ by Pitilakis et.al (1995). Moreover, the model structure was also simulated with its superstructure and foundation supported on the underlying soil by a set of vertical springs. Based on the results of the detailed numerical simulation of the superstructure, described previously, care was taken to ensure that the relatively simple simulation of the superstructure employed in this SSI investigation had fundamental frequencies, when considered with base fixity, as close as possible to the values measured in-situ (with masonry infills and diagonals in all stories). An additional numerical study also established that the width of the soil formation does not influence the resulting fundamental frequency values. The resulting frequency values of this SSI system, especially that of the third mode with frequency value equal to 3.57Hz (figure 8), is within the frequency range of the measured first fundamental x-x and y-y modes of the model structure (with masonry infills 5.005Hz and

without masonry infills 2.44Hz), which were measured as described in section 3. Consequently, cracking of the masonry and the concrete elements during a future strong earthquake sequence will bring the superstructure fundamental translational response frequency closer to that of the SSI system.
5. DISCUSSION OF THE TEST RESULTS – CONCLUSIONS 1. Structural configuration employing masonry infills can mobilize relatively little increase in stiffness from these masonry infills during low vibrations when they are added in relatively loose construction after the introduction of all the dead weight in the structure. This has been indicated for the 6-story Volvi structure. The presence of a soft story, such as the ground floor without masonry infills and the upper floors all with infills, introduces increased deformation demands at this story during the dynamic and earthquake response of the building. 2. Significant variations were observed in the stiffness of the Volvi structure during the various stages of including the masonry infills. The fundamental frequency of the Volvi structure without the ground floor masonry infills exhibited only relatively small changes with time. When masonry infills were added at the ground floor, apart from the large increase in the observed fundamental frequency values a variation of these values with time was also observed, due to the increase of the stiffness of the infills with time. This was observed within a period of the first eight months. The presence of the diagonal cables in the upper four floors has little effect on the stiffness of the structure, due to the stiffness of the masonry infill. Furthermore, the presence of these diagonal cables only at the first story (without infills) does not result in any significant increase of the structural stiffness. As expected, the addition of the 6th floor extension with its extra mass lowered the fundamental frequency values. 3. The numerical simulation of the dynamic characteristics of the model Volvi building with and without masonry infills was successful. This fact must be attributed to the very effective control of micro cracking in this structure as well as to the almost exact estimation of the dimensions of the various structural elements and the accurate estimation of the mass of the system. Moreover, a special laboratory investigation was performed to verify the properties of the used masonry infills. However, it must be borne in mind that the measurements used and the assumptions employed in the simulations are based on linear-elastic response. The success of the subsequent numerical simulation of the 4th of May, 1995 recorded earthquake response must also be seen in the light of the validity of the linear-elastic response assumptions. Despite this, a small adjustment was necessary in the stiffness and damping derived during the free-vibration in-situ test sequences. Further research is needed so that non-linear response numerical approximations can yield realistic damage predictions. 4. The influence of the masonry infill in the stiffness and the horizontal load capacity of the examined “unit” frame becomes obvious by comparing the obtained responses and, in terms of stiffness increase, it is in agreement with what was expected from the measurements of the response of the model structure at Volvi. 5. The simulation of the foundation flexibility, which was approximated by linear springs at the foundation-soil interface, was successful in yielding good agreement between observed and predicted dynamic response. However, it must be borne in mind that the measurements used and the assumptions employed in the simulations are based on linear-elastic response. Moreover, the observed response was used as a reference level as an aid to adjusting the numerical predictions. Further studies are needed in order to achieve comprehensive predictions of such influences. 6. The preliminary numerical study of possible soil-structure interaction resulted in a mode shape with frequency value equal to 3.57Hz, which is within the frequency range of the measured first fundamental x-x and y-y modes of the 5-story structure with masonry infills (5.005Hz) and without masonry infills (2.44Hz). Consequently, cracking of the masonry and the concrete elements during a future strong earthquake sequence will bring the superstructure fundamental translational response frequency closer to that of the SSI system.
7. Recently, the Test Site at Volvi was extended to include a network of numerous strong motion accelerographs as well as a crane, a store house and a power generated hydraulic system. This facility is being utilized for tests with a single bridge pier model, focusing on the influence that the soil-foundation interaction will have on the response of this pier. The non-linear behavior of this model pier has already been observed on replica models, which were built for this purpose and tested at the laboratory. It was found that the predominantly flexural mode of response and the corresponding flexural type of damage, which was concentrated at the bottom of the model pier, was in agreement with the predicted behavior aimed at, according to the design of this model structure.
REFERENCES
1. G.C. Manos, M. Triamataki, D. Mpoufudis, (1995a), “Numerical Study of the influence of Masonry Infills on the Response of a damaged 5-story RC prototype building during the Pyrgos-Greece 1993 Earthquake, considering old and new Seismic Code Provisions” Proc. 3rd Intern. Symposium on computer methods in Structural Masonry, April 1995, Lisbon.
2. G.C. Manos, et.al., (1995b), “Experimental and Numerical Simulation of the Influence of Masonry Infills on the Seismic Response of R.C. Framed Structures”, 4th Intern. Masonry Conf., Vol. 2, pp. 495-502, London, England.
3. G.C. Manos, B. Yasin, J. Thaumpta, M. Triamataki, P. Skalkos, , M. Demosthenous, (1997), “ The Dynamic Response of a 5-Story R.C. Structure in-situ at the Euoropean test site at Volvi”, 14th SMIRT, Volume H, pp 283-290, Lyon, France.
4. G.C. Manos, M. Triamataki, J. Thaumpta, B. Yasin, P. Skalkos, M. Demosthenous, (1998) “The Dynamic Response of a 5-story Structure at the European Test site at Volvi-Greece”, 6th U.S. National Earthquake Engineering Conference.
5. G.C. Manos, J. Thaumpta, M. Yasin , (2000), “Influence of Masonry Infills on the Earthquake Response of Multi-story Reinforced Concrete Structures” presented at the 12th WCEE, Auckland, New Zealand.
6. Okada T., and Tamura R., (1992) “Observation of Earthquake Response of R.C. Weak Model Structures”, Bull. Inst. of Industrial Science, Univ. of Tokyo, No. 18, 1985, and Personal Communications.
7. Pinto A. V., editor, “Pseudodynamic and Shaking Table Tests on R.C. Bridges”, ECOEST PREC*8 Report No. 8, November 1996.
8. Pitilakis K. et.al., (1995), “ Euroseistest Volvi - Thessaloniki, A European Test-Site for Engineering Seismology, Earthqauke Engineering and Seismology”, Final Report to the Commission of the European Communities, Task 4, Geophysical and Geotechnical Survey, November 1995.
Acknowledgements. This work has been partially supported by the European Union, Projects ENV.5V-CT93-0281, ENV.4-CT.96-0255 and currently by EVG1-CT-2001-00040. The partial financial assistance of the Directorate XII of the European Commission, is here gratefully acknowledged. The advice of Ray W. Clough, Professor Emeritus of the University of California at Berkeley and the discussions with Hiroshi Akiyama, Professor of the University of Tokyo are noted with thanks. The relevant information that helped in the preliminary design of the model structure at Volvi, was kindly provided by Professor Tsuneo Okada and his research group at the Institute of Industrial Science of the University of Tokyo. Moreover, the useful comments and support of a number of outstanding researchers of the international research community, namely R. Brincker, S. Cherry, A.K. Chopra, A. Elnashai, P. Fajfar, M. Fischinger, A. Ghobarah, A. Kiremidjian, R. Mayes, A. Martelli, K. Ohi, V. Renda, F. Sakai, H. Shibata, P. Spanos, M Tomazevic, A.S. Veletsos, and R. Zarnic for the continuation of the project is acknowledged with thanks.