dynamic arm study: quantitative description of upper
TRANSCRIPT

RESEARCH Open Access
Dynamic arm study: quantitativedescription of upper extremity functionand activity of boys and men withduchenne muscular dystrophyMariska M. H. P. Janssen1*, Jaap Harlaar2, Bart Koopman3 and Imelda J. M. de Groot1
Abstract
Background: Therapeutic management of upper extremity (UE) function of boys and men with DuchenneMuscular Dystrophy (DMD) requires sensitive and objective assessment. Therefore, we aimed to measurephysiologic UE function of healthy subjects and DMD patients in different disease stages, and to evaluate therelation between these physiologic measures and functional UE scales.
Methods: Twenty-three DMD patients and twenty healthy controls (7–23 years) participated in this explorativecase–control study. Maximal muscle torque, maximal and normalized surface electromyography (sEMG) amplitudes,muscle thickness, echogenicity and maximal passive and active joint angles were measured. At activity level, Brookeupper extremity rating scale and the Performance of Upper Limb (PUL) scale were used.
Results: Outcome measures related to proximal UE function could discriminate between disease stages. Increasednormalized sEMG amplitudes were found in patients, even in early disease stages. Maximal active joint anglesshowed the strongest relation to Brooke scale (R2 = 0.88) and PUL scale (R2 = 0.85).
Conclusions: The decline of muscle functions precedes the decline in performance of UE activities, and thereforemay play a role in early detection of UE limitations. Increased sEMG levels demonstrate that DMD patients use moreof their muscle capacity compared to healthy subjects, to perform daily activities. This might result in increasedfatigability. Active maximal joint angles are highly related to functional scales, so preserving the ability to use thefull range of motion is important for the performance of daily activities. Close monitoring of active joint anglescould therefore help in starting interventions that minimize functional UE decline in DMD patients timely.
Keywords: Duchenne muscular dystrophy, Upper limb, 3D motion analysis, Surface electromyography,Muscle ultrasound, Muscle torque
BackgroundDuchenne Muscular Dystrophy (DMD) is a x-linkedneuromuscular disorder with an incidence of 1:5,000male newborns [1]. The disorder is characterized by aprogressive loss of muscle strength, starting in the pelvicgirdle, however, in later stages all muscles becomeaffected. Boys with DMD become non-ambulant around
the age of 10 years when untreated, and around the ageof 13 years when treated with corticosteroids [2]. Armfunction is already affected at this age [3, 4]. Althoughthere is no curative treatment for DMD, life expectancyis rapidly increasing due to medical interventions [5, 6].This means that boys and men with DMD have to livelonger with their functional limitations and thus main-taining upper extremity (UE) function and measuringchanges in UE function are increasingly important.Loss of UE function can be delayed by several years by
using corticosteroid treatment [7–10]. Physical exerciseprograms have also been found to be beneficial for
* Correspondence: [email protected] of Rehabilitation, Radboud University Medical Center, DondersCentre for Neuroscience, Reinier Postlaan 4, 6525 GC Nijmegen, TheNetherlandsFull list of author information is available at the end of the article
© The Author(s). 2017 Open Access This article is distributed under the terms of the Creative Commons Attribution 4.0International License (http://creativecommons.org/licenses/by/4.0/), which permits unrestricted use, distribution, andreproduction in any medium, provided you give appropriate credit to the original author(s) and the source, provide a link tothe Creative Commons license, and indicate if changes were made. The Creative Commons Public Domain Dedication waiver(http://creativecommons.org/publicdomain/zero/1.0/) applies to the data made available in this article, unless otherwise stated.
Janssen et al. Journal of NeuroEngineering and Rehabilitation (2017) 14:45 DOI 10.1186/s12984-017-0259-5

retaining UE function [11–13]. However, in the longterm, interventions that compensate for loss of UE func-tion are still needed, for example arm supports, whichreduce the effort that is needed to perform activities. Todevelop and evaluate such interventions, more insightin the upper extremity is needed. Insights on bothInternational Classification of Functioning, Disability andHealth (ICF) [14] function and structure level, and ICFactivity level are necessary in order to unravel the mecha-nisms of UE decline.The primary aim of this study is to give a quantitative
description of UE functioning during a variety of mean-ingful UE task in boys and men with DMD in differentstages of the disease, in comparison to their healthypeers. The secondary aim is to evaluate the relationbetween physiologic and structural UE functions andfunctional UE scales.
MethodsPopulationThe study population consisted of 23 boys and men withDMD and 20 healthy boys and men. DMD patients wereincluded if they were older than 6 years, had a DNAestablished DMD diagnosis, and had a Brooke scale [15]of 1–5, meaning that they were able to use their handsfunctionally. Patients were recruited through the RadboudUniversity Medical Center (Radboudumc) outpatientclinic and by an advertisement on the website of theDutch DMD patient organization (“Duchenne ParentProject”). Healthy subjects over 6 years, without UEmobility limitations, were included from schools in theneighborhood of the Radboudumc in the city of Nijmegen.This study was approved by the medical ethical com-mittee Arnhem–Nijmegen, the Netherlands (Registrationnumber 2012/135, NL nr.: 39126.091.12). Informed con-sent was obtained from all participants and from their par-ents when the subjects were under 18 years of age.
Outcome measuresParticipant characteristicsThe following participant characteristics were collectedbased on self-reports: age, arm preference, weight,height, year of diagnosis, wheelchair confinement and, ifapplicable the age of wheelchair confinement, and theoccurrence of scoliosis.
Functional UE scalesFunctional UE scales used in this study were: “Brookeupper extremity rating scale [15]” and the “Performanceof Upper Limb (PUL) scale [16]”. These functional scalesmeasured participants’ activity level. PUL items wereperformed once. Based on the score of the entry item,some subjects only performed a specific subset of thePUL. Sum scores of the 3 dimensions (high level
shoulder, mid level elbow, distal wrist and hand) and thetotal sum score were calculated.
Muscle torques and surface electromyographyMuscle torques and surface electromyography (sEMG)signals were recorded of 7 different upper extremitymuscles (Trapezius (descending part), Biceps Brachii(long head), Triceps Brachii (long head), Deltoid (lateralpart), Pectoralis Major (clavicular head), wrist flexorsand wrist extensors). Muscle torques were measuredusing a static frame myometer, consisting of a KAP-EForce Transducer, measurement range 0.2–2000 N(Angewandte System Technik, Dresden, Germany), anda height and position adjustable frame (designed andcustom made by mechanical engineers from the VU med-ical centre, Amsterdam, the Netherlands). Wireless sEMGsignals (Zerowire EMG, Aurion, Italy) were recorded witha sample frequency of 1000 Hz. Disk-shaped Ag–AgCLARBO ECG electrodes (Tyco Healthcare, Neustadt,Germany) were placed at an inter electrode distance of24 mm. Testing and electrode positions were based on lit-erature [17, 18]. To make the measurement protocol moresuitable for DMD patients, as they were often in a wheel-chair or had joint contractures, we slightly adapted someof the testing positions. sEMG data were filtered using a4th order band pass filter between 20 and 450 Hz, whereafter the signal was rectified and low pass filtered (3 Hz)to obtain the linear envelope [19, 20]. Torque data werefiltered using a 3 Hz low pass filter of the 4th order.All subjects performed two maximal voluntary isometric
contractions (MVICs) to determine the maximal muscletorque and corresponding sEMG amplitude. If the exam-iner was not confident that a maximal effort was made,the measurement was repeated. The maximal value out ofthe two correct attempts was used for further data ana-lysis. Normalized sEMG amplitudes were calculated forthe performance of single joint movements and PULitems. Normalized sEMG amplitude was defined as themaximum sEMG amplitude that was reached during amovement as a percentage of the maximal amplitude ofthe same muscle during MVIC.Data was processed with custom-written Matlab (Matlab®
version R2014b, Mathworks, Natick, USA) routines.
Quantitative muscle ultrasoundUltrasounds images of 6 upper extremity muscles(Trapezius, Biceps Brachii, Triceps, Deltoid, wrist flexorsand wrist extensors) were recorded using a Z.One PROUltrasound System (Zonare Medical Systems, MountainView, California, USA), with a L10-5 transducer. Threeultrasound recordings were made, at a depth of 4 cm, tocalculate echogenicity (greyscale) and one recording,with no predefined depth, was made to determine themuscle thickness. Echogenicity is the extent to which a
Janssen et al. Journal of NeuroEngineering and Rehabilitation (2017) 14:45 Page 2 of 14
structure reflects ultrasound of a surface with high echo-genicity indicating that more ultrasound is reflected, forexample when high levels of fatty and connective tissueare present in a muscle. Ultrasound images wereanalyzed with computer-assisted greyscale histogram ana-lysis, using custom software developed at Radboudumc(QUMIA). Echogenicity was determined by calculatingthe grayscale in the upper 1/3rd of the region of interest(the region that included as much muscle mass as possiblewithout bone and fascia) in each muscle [21]. The averageechogenicity out of 3 measurements was used for furtheranalysis. Muscle thickness was determined by calculatingthe distance between two electronic calipers at standard-ized positions. Thickness of the Trapezius was measuredbetween the deep and superficial fascia of the upper partof the Trapezius muscle. Thickness of the Deltoid, Biceps(combined with Brachialis) and Triceps muscles weremeasured between the humerus and the superficial fascia.Forearm flexor (Flexor Carpi Radialis) thickness was mea-sured between a horizontal reference line at the height ofthe radius and the superficial fascia. Forearm extensorsthickness was measured between the middle end of the ra-dius and the superficial fascia.Ultrasound results were compared to muscle specific
reference values and expressed as Z-scores (representingthe number of standard deviations from the mean) [22].Reference values for calculation of the Z-scores wereobtained from 60 healthy subjects using the same meas-urement protocol and ultrasound device (manuscript inpreparation). Echogenicity and muscle thickness werecorrected for age, weight and height if necessary usingthe method described by Scholten et al. [23].
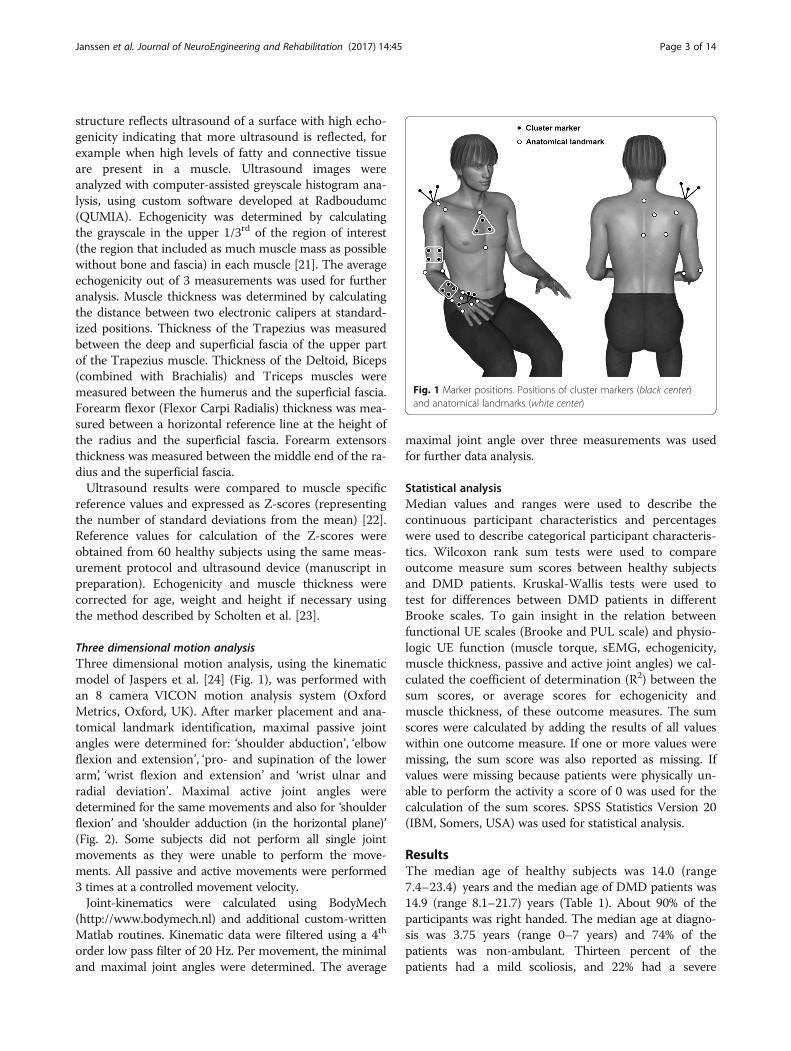
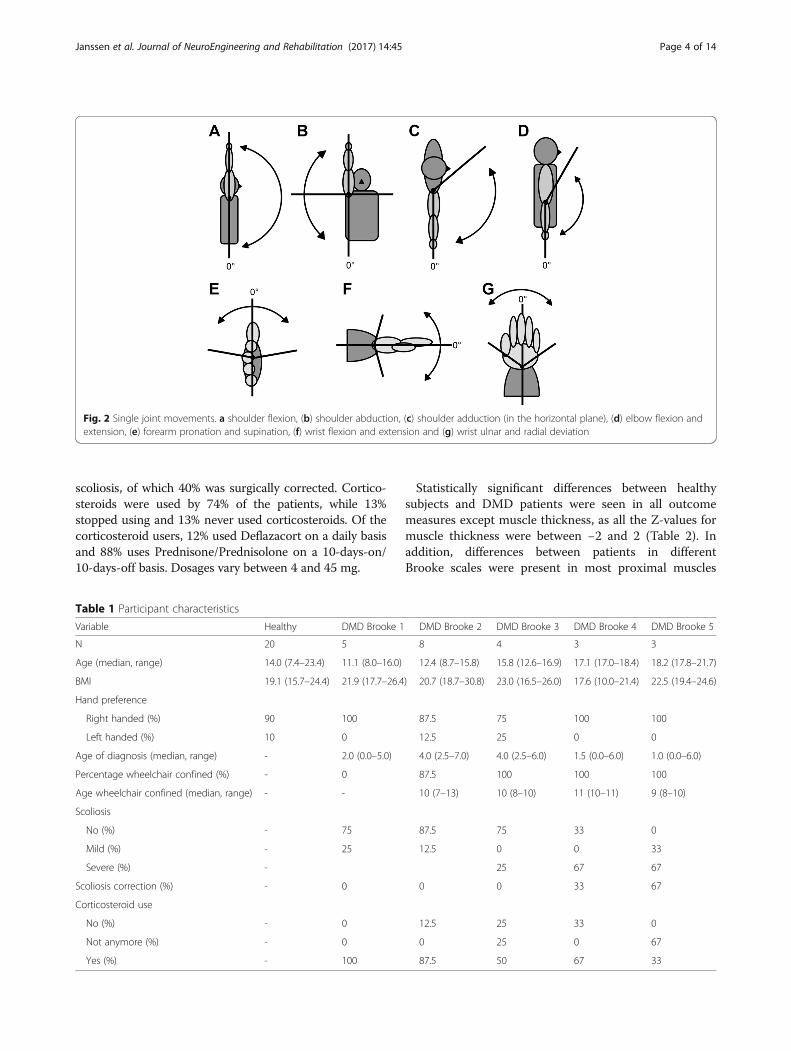
Three dimensional motion analysisThree dimensional motion analysis, using the kinematicmodel of Jaspers et al. [24] (Fig. 1), was performed withan 8 camera VICON motion analysis system (OxfordMetrics, Oxford, UK). After marker placement and ana-tomical landmark identification, maximal passive jointangles were determined for: ‘shoulder abduction’, ‘elbowflexion and extension’, ‘pro- and supination of the lowerarm’, ‘wrist flexion and extension’ and ‘wrist ulnar andradial deviation’. Maximal active joint angles weredetermined for the same movements and also for ‘shoulderflexion’ and ‘shoulder adduction (in the horizontal plane)’(Fig. 2). Some subjects did not perform all single jointmovements as they were unable to perform the move-ments. All passive and active movements were performed3 times at a controlled movement velocity.Joint-kinematics were calculated using BodyMech
(http://www.bodymech.nl) and additional custom-writtenMatlab routines. Kinematic data were filtered using a 4th
order low pass filter of 20 Hz. Per movement, the minimaland maximal joint angles were determined. The average
maximal joint angle over three measurements was usedfor further data analysis.
Statistical analysisMedian values and ranges were used to describe thecontinuous participant characteristics and percentageswere used to describe categorical participant characteris-tics. Wilcoxon rank sum tests were used to compareoutcome measure sum scores between healthy subjectsand DMD patients. Kruskal-Wallis tests were used totest for differences between DMD patients in differentBrooke scales. To gain insight in the relation betweenfunctional UE scales (Brooke and PUL scale) and physio-logic UE function (muscle torque, sEMG, echogenicity,muscle thickness, passive and active joint angles) we cal-culated the coefficient of determination (R2) between thesum scores, or average scores for echogenicity andmuscle thickness, of these outcome measures. The sumscores were calculated by adding the results of all valueswithin one outcome measure. If one or more values weremissing, the sum score was also reported as missing. Ifvalues were missing because patients were physically un-able to perform the activity a score of 0 was used for thecalculation of the sum scores. SPSS Statistics Version 20(IBM, Somers, USA) was used for statistical analysis.
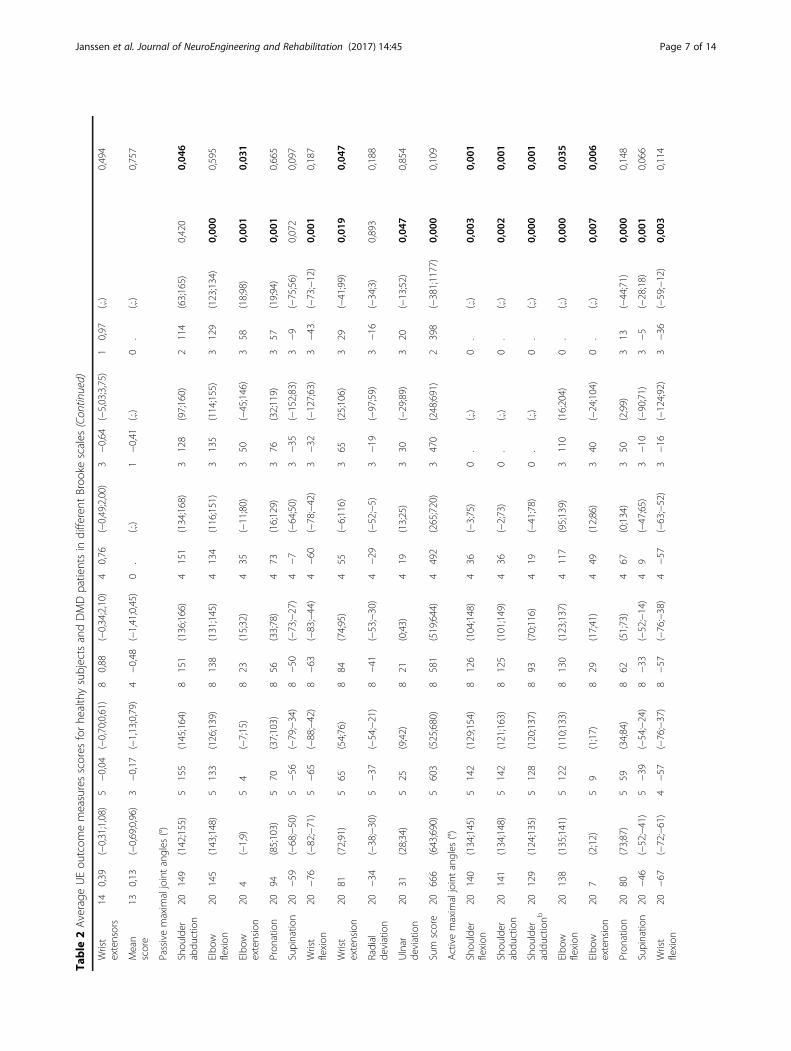
ResultsThe median age of healthy subjects was 14.0 (range7.4–23.4) years and the median age of DMD patients was14.9 (range 8.1–21.7) years (Table 1). About 90% of theparticipants was right handed. The median age at diagno-sis was 3.75 years (range 0–7 years) and 74% of thepatients was non-ambulant. Thirteen percent of thepatients had a mild scoliosis, and 22% had a severe
Fig. 1 Marker positions. Positions of cluster markers (black center)and anatomical landmarks (white center)
Janssen et al. Journal of NeuroEngineering and Rehabilitation (2017) 14:45 Page 3 of 14
scoliosis, of which 40% was surgically corrected. Cortico-steroids were used by 74% of the patients, while 13%stopped using and 13% never used corticosteroids. Of thecorticosteroid users, 12% used Deflazacort on a daily basisand 88% uses Prednisone/Prednisolone on a 10-days-on/10-days-off basis. Dosages vary between 4 and 45 mg.
Statistically significant differences between healthysubjects and DMD patients were seen in all outcomemeasures except muscle thickness, as all the Z-values formuscle thickness were between −2 and 2 (Table 2). Inaddition, differences between patients in differentBrooke scales were present in most proximal muscles
Fig. 2 Single joint movements. a shoulder flexion, (b) shoulder abduction, (c) shoulder adduction (in the horizontal plane), (d) elbow flexion andextension, (e) forearm pronation and supination, (f) wrist flexion and extension and (g) wrist ulnar and radial deviation
Table 1 Participant characteristics
Variable Healthy DMD Brooke 1 DMD Brooke 2 DMD Brooke 3 DMD Brooke 4 DMD Brooke 5
N 20 5 8 4 3 3
Age (median, range) 14.0 (7.4–23.4) 11.1 (8.0–16.0) 12.4 (8.7–15.8) 15.8 (12.6–16.9) 17.1 (17.0–18.4) 18.2 (17.8–21.7)
BMI 19.1 (15.7–24.4) 21.9 (17.7–26.4) 20.7 (18.7–30.8) 23.0 (16.5–26.0) 17.6 (10.0–21.4) 22.5 (19.4–24.6)
Hand preference
Right handed (%) 90 100 87.5 75 100 100
Left handed (%) 10 0 12.5 25 0 0
Age of diagnosis (median, range) - 2.0 (0.0–5.0) 4.0 (2.5–7.0) 4.0 (2.5–6.0) 1.5 (0.0–6.0) 1.0 (0.0–6.0)
Percentage wheelchair confined (%) - 0 87.5 100 100 100
Age wheelchair confined (median, range) - - 10 (7–13) 10 (8–10) 11 (10–11) 9 (8–10)
Scoliosis
No (%) - 75 87.5 75 33 0
Mild (%) - 25 12.5 0 0 33
Severe (%) - 25 67 67
Scoliosis correction (%) - 0 0 0 33 67
Corticosteroid use
No (%) - 0 12.5 25 33 0
Not anymore (%) - 0 0 25 0 67
Yes (%) - 100 87.5 50 67 33
Janssen et al. Journal of NeuroEngineering and Rehabilitation (2017) 14:45 Page 4 of 14

Table
2Average
UEou
tcom
emeasuresscores
forhe
althysubjectsandDMDpatientsin
different
Broo
kescales
Health
yDMDBroo
ke1
DMDBroo
ke2
DMDBroo
ke3
DMDBroo
ke4
DMDBroo
ke5
NMean
(95%
CI)
NMean
(95%
CI)
NMean
(95%
CI)
NMean
(95%
CI)
NMean
(95%
CI)
NMean
(95%
CI)
P-value
healthy/patient
P-value
Broo
kescale
Functio
nalU
Escales
Perfo
rmance
ofUpp
erLimbScale
PUL
shou
lder
2016
(.;.)
513
(10;15)
86
(3;10)
40
(.;.)
30
(.;.)
20
(.;.)
0,00
00,00
2
PULelbo
w20
32(.;.)
532
(31;32)
827
(22;32)
415
(6;24)
310
(4;15)
25
(−15;24)
0,00
00,00
2
PULwrist
2024
(.;.)
524
(23;24)
822
(21;23)
422
(21;23)
320
(15;26)
220
(.;.)
0,00
00,01
4
Sum
scorea
2078
(.;.)
574
(71;76)
860
(52;68)
441
(31;50)
332
(21;43)
226
(6;45)
0,00
00,00
1
PhysiologicUEou
tcom
emeasures
Maxim
almuscleforce(N)
Trapezius
20476
(344;609)
5147
(62;233)
8109
(85;134)
3138
(−4;280)
359
(29;90)
340
(−6;85)
0,00
00,01
2
Biceps
20178
(139;217)
537
(27;47)
827
(19;34)
321
(17;24)
37
(−3;17)
35
(−2;12)
0,00
00,00
3
Tricep
s20
152
(121;182)
527
(21;33)
817
(11;23)
313
(4;21)
38
(2;14)
27
(−40;53)
0,00
00,01
1
Deltoid
2083
(64;102)
532
(24;40)
821
(14;27)
321
(17;26)
215
(3;26)
27
(−21;35)
0,00
00,02
0
Pectoralis
major
20199
(156;242)
569
(49;89)
845
(30;60)
340
(21;58)
314
(−6;34)
315
(7;23)
0,00
00,00
3
Wrist
flexors
20127
(102;152)
529
(14;44)
727
(11;42)
326
(−38;90)
319
(−9;47)
214
(−32;61)
0,00
00,386
Wrist
extensors
20120
(94;146)
532
(13;51)
730
(14;45)
330
(−20;80)
38
(−8;24)
214
(−19;47)
0,00
00,061
Sum
score
201334
(1038;1631)
5373
(271;474)
7278
(212;344)
3288
(16;561)
2147
(−81;374)
2110
(−192;412)
0,00
00,02
4
Maxim
almuscletorque
(Nm)
Trapezius
2086,4
(57,3;115,5)
524,6
(11,5;37,7)
816,2
(11,9;20,5)
324,8
(−6,0;55,5)
38,5
(2,4;14,6)
37,2
(−2,6;16,9)
0,00
00.01
6
Biceps
2045,8
(33,8;57,7)
57,2
(4,8;9,6)
85,9
(4,1;7,6)
35,0
(2,8;7,2)
31,7
(−1,2;4,5)
31,3
(−0,7;3,3)
0,00
00.01
0
Tricep
s20
38,2
(28,9;47,5)
55,4
(4,0;6,8)
83,8
(2,3;5,4)
33,2
(1,2;5,2)
31,8
(−0,4;4,0)
21,6
(−11,1;14,3)
0,00
00.02
4
Deltoid
2041,4
(29,8;52,9)
511,1
(8,4;13,7)
88,6
(5,5;11,6)
39,5
(7,9;11,2)
25,6
(4,9;6,2)
22,7
(−10,0;15,4)
0,00
00.071
Pectoralis
major
2055,2
(41,2;69,3)
513,6
(9,4;17,7)
810,2
(6,9;13,6)
310,3
(7,0;13,5)
33,4
(−3,0;9,8)
33,8
(1,4;6,2)
0,00
00.01
0
Wrist
flexors
208,4
(6,4;10,4)
52,9
(−0,5;6,2)
72,0
(0,5;3,4)
31,5
(−1,9;4,9)
31,1
(−0,9;3,1)
20,8
(−1,2;2,7)
0,00
00.311
Wrist
extensors
207,9
(5,8;10,0)
53,2
(−0,8;7,2)
72,1
(0,7;3,6)
31,8
(−0,7;4,3)
30,4
(−0,3;1,1)
20,8
(−1,2;2,7)
0,00
00.02
7
Janssen et al. Journal of NeuroEngineering and Rehabilitation (2017) 14:45 Page 5 of 14

Table
2Average
UEou
tcom
emeasuresscores
forhe
althysubjectsandDMDpatientsin
different
Broo
kescales
(Con
tinued)
Sum
score
20283,2
(207,5;358,9)
568,0
(48,1;87,8)
748,1
(34,0;62,2)
356,1
(19,0;93,2)
225,5
(−35,5;86,5)
219,5
(−65,0;103,9)
0,00
00.02
6
Maxim
alsEMGam
plitu
de(m
V)
Trapezius
200,38
(0,27;0,50)
50,19
(0,03;0,35)
80,16
(0,09;0,24)
40,09
(0,05;0,13)
30,07
(−0,04;0,19)
30,02
(0,00;0,03)
0,00
00,03
2
Biceps
200,89
(0,73;1,05)
50,19
(0,01;0,37)
80,15
(0,09;0,21)
40,11
(−0,06;0,28)
30,07
(−0,01;0,15)
20,02
(−0,18;0,21)
0,00
00,096
Tricep
s20
0,61
(0,48;0,74)
50,10
(0,03;0,16)
80,07
(0,05;0,09)
40,03
(0,02;0,03)
30,04
(−0,02;0,09)
30,02
(−0,02;0,05)
0,00
00,00
4
Deltoid
200,61
(0,50;0,72)
50,17
(0,12;0,22)
80,20
(0,10;0,30)
30,07
(.;.)
20,06
(−0,14;0,25)
30,06
(−0,06;0,19)
0,00
00,02
3
Pectoralis
major
200,57
(0,42;0,73)
50,12
(0,04;0,20)
80,08
(0,04;0,11)
40,03
(0,00;0,05)
30,05
(−0,04;0,14)
30,01
(0,00;0,03)
0,00
00,00
7
Wrist
flexors
200,26
(0,19;0,32)
50,06
(0,04;0,09)
80,07
(0,04;0,11)
40,05
(0,02;0,07)
30,03
(0,01;0,05)
30,04
(0,02;0,06)
0,00
00,056
Wrist
extensors
200,47
(0,38;0,56)
50,13
(0,06;0,20)
80,18
(0,08;0,28)
40,10
(0,05;0,15)
30,12
(−0,10;0,34)
30,05
(−0,03;0,12)
0,00
00,090
Sum
score
203,79
(3,28;4,30)
50,96
(0,57;1,34)
80,92
(0,71;1,13)
30,39
(0,32;0,46)
20,51
(−1,08;2,09)
20,21
(−0,62;1,03)
0,00
00,01
1
Z-scores
Echo
genicity
(1/3
ROI)
Trapezius
160,37
(−0,27;1,02)
53,24
(0,89;5,59)
83,23
(1,35;5,11)
42,90
(−0,60;6,40)
36,47
(5,02;7,91)
23,19
(2,61;3,76)
0,093
Deltoid
160,36
(−0,21;0,94)
55,07
(4,17;5,96)
85,48
(4,03;6,92)
44,53
(0,39;8,67)
39,30
(8,39;10,21)
37,64
(5,18;10,10)
0,01
6
Biceps
160,14
(−0,30;0,59)
55,73
(3,39;8,06)
85,74
(4,44;7,04)
46,35
(3,91;8,78)
37,38
(5,88;8,88)
36,96
(3,08;10,84)
0,418
Tricep
s16
0,23
(−0,43;0,88)
54,92
(3,47;6,37)
87,20
(5,58;8,82)
47,51
(5,19;9,83)
36,73
(4,44;9,03)
37,39
(4,61;10,17)
0,114
Wrist
flexors
200,47
(−0,04;0,97)
53,21
(2,57;3,84)
83,63
(2,48;4,78)
44,32
(3,20;5,44)
35,19
(2,77;7,60)
25,02
(0,12;9,91)
0,065
Wrist
extensors
140,24
(−0,07;0,55)
52,91
(1,31;4,52)
83,03
(1,56;4,50)
42,97
(1,59;4,36)
34,57
(4,12;5,03)
24,68
(3,79;5,57)
0,372
Mean
score
140,34
(0,01;0,68)
54,18
(3,08;5,28)
84,72
(3,66;5,77)
44,77
(2,83;6,70)
36,61
(5,79;7,43)
25,79
(2,61;8,97)
0,053
Health
yDMDBroo
ke1
DMDBroo
ke2
DMDBroo
ke3
DMDBroo
ke4
DMDBroo
ke5
NMean
(95%
CI)
NMean
(95%
CI)
NMean
(95%
CI)
NMean
(95%
CI)
NMean
(95%
CI)
NMean
(95%
CI)
P-value
healthy/
patient
P-value
Broo
kescale
Z-scores
MuscleThickness
Trapezius
15−0,04
(−0,83;0,74)
40,54
(−1,15;2,23)
71,08
( −0,50;2,65)
21,53
(−17,15;20,21)
2−1,40
(−14,49;11,69)
20,29
(−8,67;9,24)
0,401
Deltoid
160,02
(−0,77;0,80)
40,82
(−1,05;2,70)
40,88
(−0,96;2,71)
10,02
(.;.)
3−1,86
(−5,64;1,91)
31,47
(−5,05;7,99)
0,289
Biceps
160,73
(−0,67;2,14)
5−0,80
(−2,75;1,14)
7−1,64
(−3,06;−0,22)
2−1,61
(−35,98;32,77)
1−0,26
(.;.)
21,14
(−26,69;28,97)
0,684
Tricep
s16
−0,22
(−0,85;0,41)
50,28
(−1,40;1,96)
5−1,01
(−2,27;0,25)
0.
(.;.)
2−1,72
(−5,08;1,65)
0.
(.;.)
0,087
Wrist
flexors
16−0,31
(−0,96;0,33)
5−1,08
(−1,94;−0,23)
7−1,10
(−1,87;−0,33)
2−1,86
(−11,70;7,99)
2−1,46
(−9,97;7,05)
10,83
(.;.)
0,466
Janssen et al. Journal of NeuroEngineering and Rehabilitation (2017) 14:45 Page 6 of 14
Table
2Average
UEou
tcom
emeasuresscores
forhe
althysubjectsandDMDpatientsin
different
Broo
kescales
(Con
tinued)
Wrist
extensors
140,39
(−0,31;1,08)
5−0,04
(−0,70;0,61)
80,88
(−0,34;2,10)
40,76
(−0,49;2,00)
3−0,64
(−5,03;3,75)
10,97
(.;.)
0,494
Mean
score
130,13
(−0,69;0,96)
3−0,17
(−1,13;0,79)
4−0,48
(−1,41;0,45)
0.
(.;.)
1−0,41
(.;.)
0.
(.;.)
0,757
Passivemaxim
aljointangles
(°)
Shou
lder
abdu
ction
20149
(142;155)
5155
(145;164)
8151
(136;166)
4151
(134;168)
3128
(97;160)
2114
(63;165)
0,420
0,04
6
Elbo
wflexion
20145
(143;148)
5133
(126;139)
8138
(131;145)
4134
(116;151)
3135
(114;155)
3129
(123;134)
0,00
00,595
Elbo
wextension
204
(−1;9)
54
(−7;15)
823
(15;32)
435
(−11;80)
350
(−45;146)
358
(18;98)
0,00
10,03
1
Pron
ation
2094
(85;103)
570
(37;103)
856
(33;78)
473
(16;129)
376
(32;119)
357
(19;94)
0,00
10,665
Supinatio
n20
−59
(−68;−50)
5−56
(−79;−34)
8−50
(−73;−27)
4−7
(−64;50)
3−35
(−152;83)
3−9
(−75;56)
0,072
0,097
Wrist
flexion
20−76
(−82;−71)
5−65
(−88; −42)
8−63
(−83;−44)
4−60
(−78;−42)
3−32
(−127;63)
3−43
(−73;−12)
0,00
10,187
Wrist
extension
2081
(72;91)
565
(54;76)
884
(74;95)
455
(−6;116)
365
(25;106)
329
(−41;99)
0,01
90,04
7
Radial
deviation
20−34
(−38;−30)
5−37
(−54;−21)
8−41
(−53;−30)
4−29
(−52;−5)
3−19
(−97;59)
3−16
(−34;3)
0,893
0,188
Ulnar
deviation
2031
(28;34)
525
(9;42)
821
(0;43)
419
(13;25)
330
(−29;89)
320
(−13;52)
0,04
70,854
Sum
score
20666
(643;690)
5603
(525;680)
8581
(519;644)
4492
(265;720)
3470
(248;691)
2398
(−381;1177)
0,00
00,109
Activemaxim
aljointangles
(°)
Shou
lder
flexion
20140
(134;145)
5142
(129;154)
8126
(104;148)
436
(−3;75)
0.
(.;.)
0.
(.;.)
0,00
30,00
1
Shou
lder
abdu
ction
20141
(134;148)
5142
(121;163)
8125
(101;149)
436
(−2;73)
0.
(.;.)
0.
(.;.)
0,00
20,00
1
Shou
lder
addu
ctionb
20129
(124;135)
5128
(120;137)
893
(70;116)
419
(−41;78)
0.
(.;.)
0.
(.;.)
0,00
00,00
1
Elbo
wflexion
20138
(135;141)
5122
(110;133)
8130
(123;137)
4117
(95;139)
3110
(16;204)
0.
(.;.)
0,00
00,03
5
Elbo
wextension
207
(2;12)
59
(1;17)
829
(17;41)
449
(12;86)
340
(−24;104)
0.
(.;.)
0,00
70,00
6
Pron
ation
2080
(73;87)
559
(34;84)
862
(51;73)
467
(0;134)
350
(2;99)
313
(−44;71)
0,00
00,148
Supinatio
n20
−46
(−52;−41)
5−39
(−54;−24)
8−33
(−52;−14)
49
(−47;65)
3−10
(−90;71)
3−5
(−28;18)
0,00
10,066
Wrist
flexion
20−67
(−72;−61)
4−57
(−76;−37)
8−57
(−76;−38)
4−57
(−63;−52)
3−16
(−124;92)
3−36
(−59;−12)
0,00
30,114
Janssen et al. Journal of NeuroEngineering and Rehabilitation (2017) 14:45 Page 7 of 14

Table
2Average
UEou
tcom
emeasuresscores
forhe
althysubjectsandDMDpatientsin
different
Broo
kescales
(Con
tinued)
Wrist
extension
2080
(73;86)
478
(48;108)
877
(67;86)
446
(−28;119)
366
(35;96)
320
(−49;90)
0,02
70,063
Radial
deviation
20−30
(−35;−24)
4−39
(−53;−25)
8−36
(−48;−24)
4−29
(−43;−14)
3−25
(−97;47)
3−14
(−23;−6)
0,365
0,177
Ulnar
deviation
2031
(29;33)
429
(8;50)
826
(19;34)
419
(9;30)
323
(−15;61)
314
(−6;33)
0,00
70,334
Sum
score
20875
(846;903)
4838
(782;894)
8736
(658;814)
4367
(176;557)
3260
(151;369)
3102
(−60;265)
0,00
00,00
1a PULsum
scores
iscalculated
includ
ingthescoreof
theen
tryite
m(m
axim
alscore=78
)bSh
oulder
addu
ctionin
theho
rizon
talp
lane
(Fig.2
.C.)
P-values
healthy/pa
tient
show
thedifferen
cesbe
tweenhe
althysubjects
andpa
tients.P-values
Broo
kescaleshow
thedifferen
cesbe
tweenDMDpa
tientsin
differen
tBroo
kescales.P
-value
s>0.05
indicate
astatistical
sign
ificant
differen
cean
daredisplayedbo
ld.P
-value
she
althy/pa
tient
areno
tshow
nforecho
genicity
andmusclethickn
essz-scores,asthez-scores
alread
yindicate
thedifferen
cewith
ahe
althyreferencepo
pulatio
n
Janssen et al. Journal of NeuroEngineering and Rehabilitation (2017) 14:45 Page 8 of 14
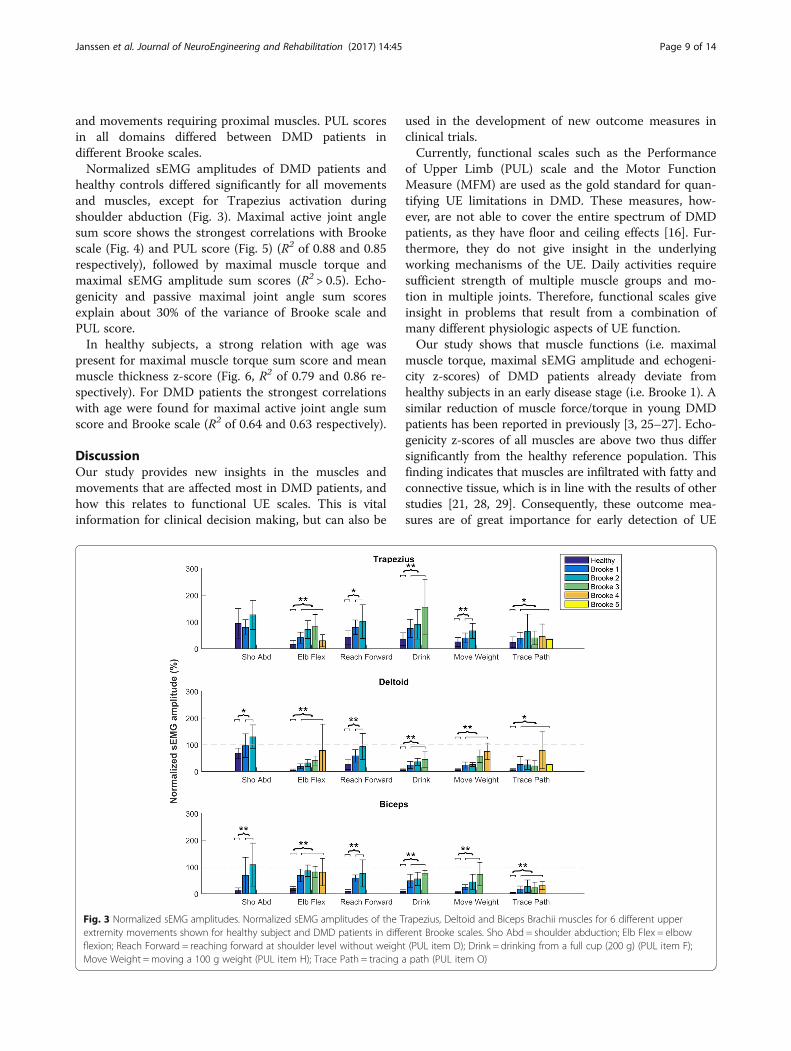
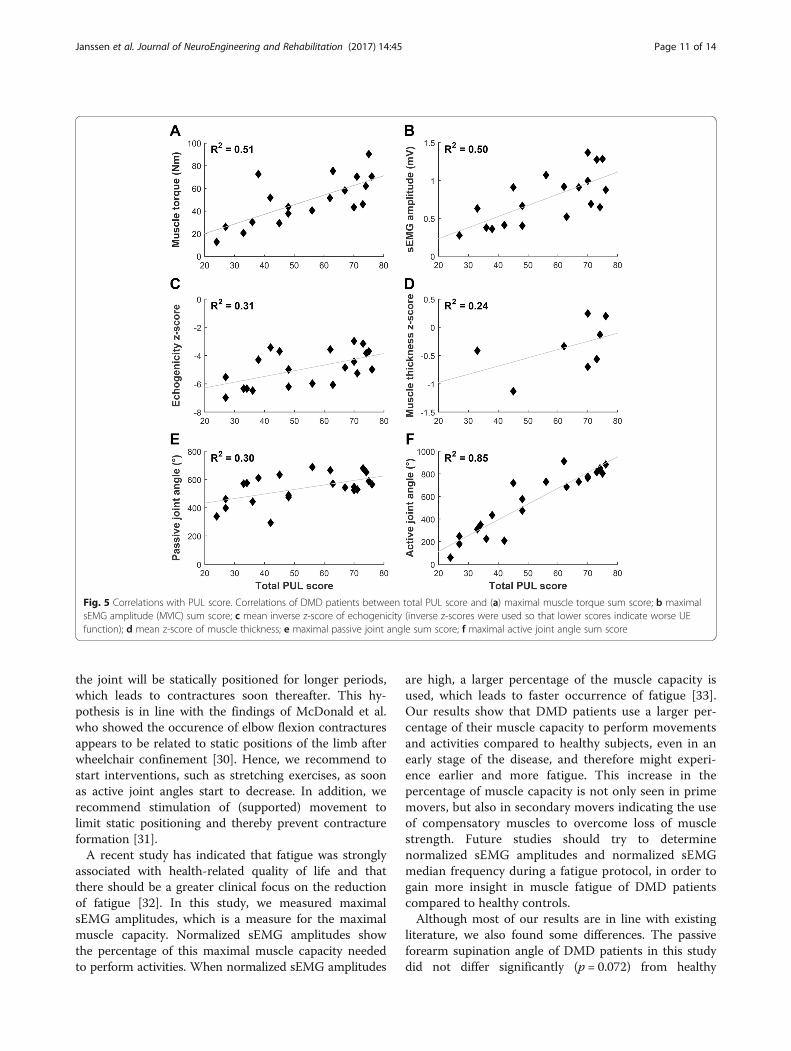
and movements requiring proximal muscles. PUL scoresin all domains differed between DMD patients indifferent Brooke scales.Normalized sEMG amplitudes of DMD patients and
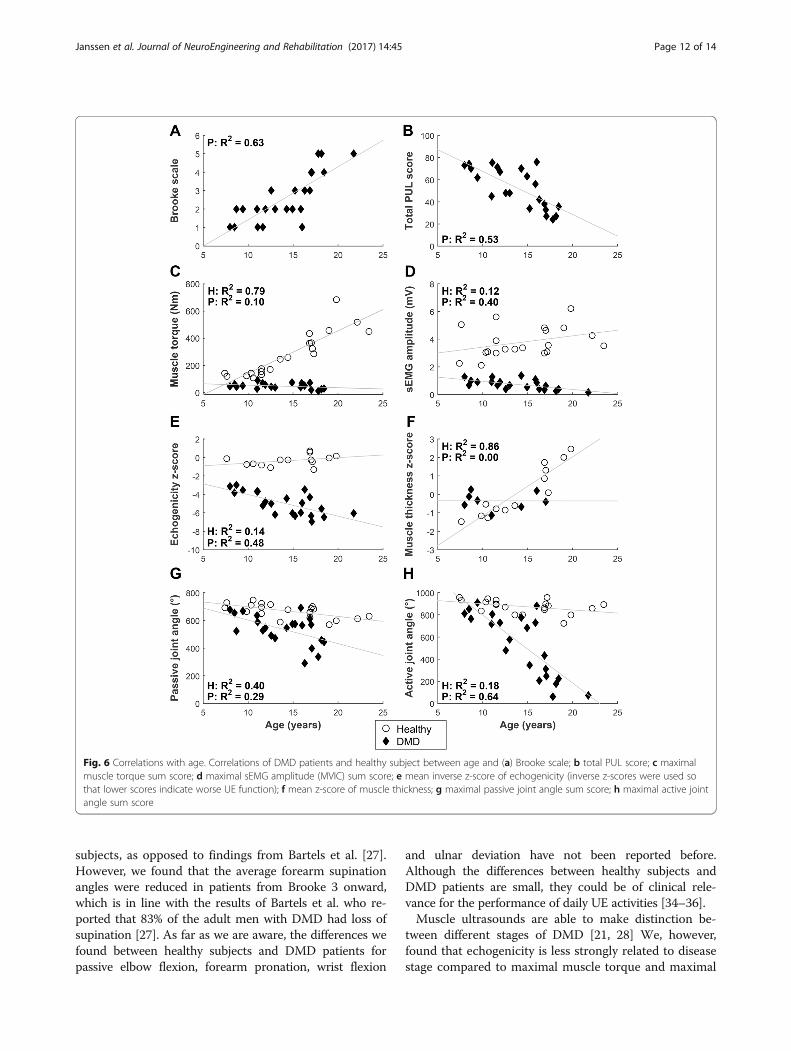
healthy controls differed significantly for all movementsand muscles, except for Trapezius activation duringshoulder abduction (Fig. 3). Maximal active joint anglesum score shows the strongest correlations with Brookescale (Fig. 4) and PUL score (Fig. 5) (R2 of 0.88 and 0.85respectively), followed by maximal muscle torque andmaximal sEMG amplitude sum scores (R2 > 0.5). Echo-genicity and passive maximal joint angle sum scoresexplain about 30% of the variance of Brooke scale andPUL score.In healthy subjects, a strong relation with age was
present for maximal muscle torque sum score and meanmuscle thickness z-score (Fig. 6, R2 of 0.79 and 0.86 re-spectively). For DMD patients the strongest correlationswith age were found for maximal active joint angle sumscore and Brooke scale (R2 of 0.64 and 0.63 respectively).
DiscussionOur study provides new insights in the muscles andmovements that are affected most in DMD patients, andhow this relates to functional UE scales. This is vitalinformation for clinical decision making, but can also be
used in the development of new outcome measures inclinical trials.Currently, functional scales such as the Performance
of Upper Limb (PUL) scale and the Motor FunctionMeasure (MFM) are used as the gold standard for quan-tifying UE limitations in DMD. These measures, how-ever, are not able to cover the entire spectrum of DMDpatients, as they have floor and ceiling effects [16]. Fur-thermore, they do not give insight in the underlyingworking mechanisms of the UE. Daily activities requiresufficient strength of multiple muscle groups and mo-tion in multiple joints. Therefore, functional scales giveinsight in problems that result from a combination ofmany different physiologic aspects of UE function.Our study shows that muscle functions (i.e. maximal
muscle torque, maximal sEMG amplitude and echogeni-city z-scores) of DMD patients already deviate fromhealthy subjects in an early disease stage (i.e. Brooke 1). Asimilar reduction of muscle force/torque in young DMDpatients has been reported in previously [3, 25–27]. Echo-genicity z-scores of all muscles are above two thus differsignificantly from the healthy reference population. Thisfinding indicates that muscles are infiltrated with fatty andconnective tissue, which is in line with the results of otherstudies [21, 28, 29]. Consequently, these outcome mea-sures are of great importance for early detection of UE
Fig. 3 Normalized sEMG amplitudes. Normalized sEMG amplitudes of the Trapezius, Deltoid and Biceps Brachii muscles for 6 different upperextremity movements shown for healthy subject and DMD patients in different Brooke scales. Sho Abd = shoulder abduction; Elb Flex = elbowflexion; Reach Forward = reaching forward at shoulder level without weight (PUL item D); Drink = drinking from a full cup (200 g) (PUL item F);Move Weight =moving a 100 g weight (PUL item H); Trace Path = tracing a path (PUL item O)
Janssen et al. Journal of NeuroEngineering and Rehabilitation (2017) 14:45 Page 9 of 14
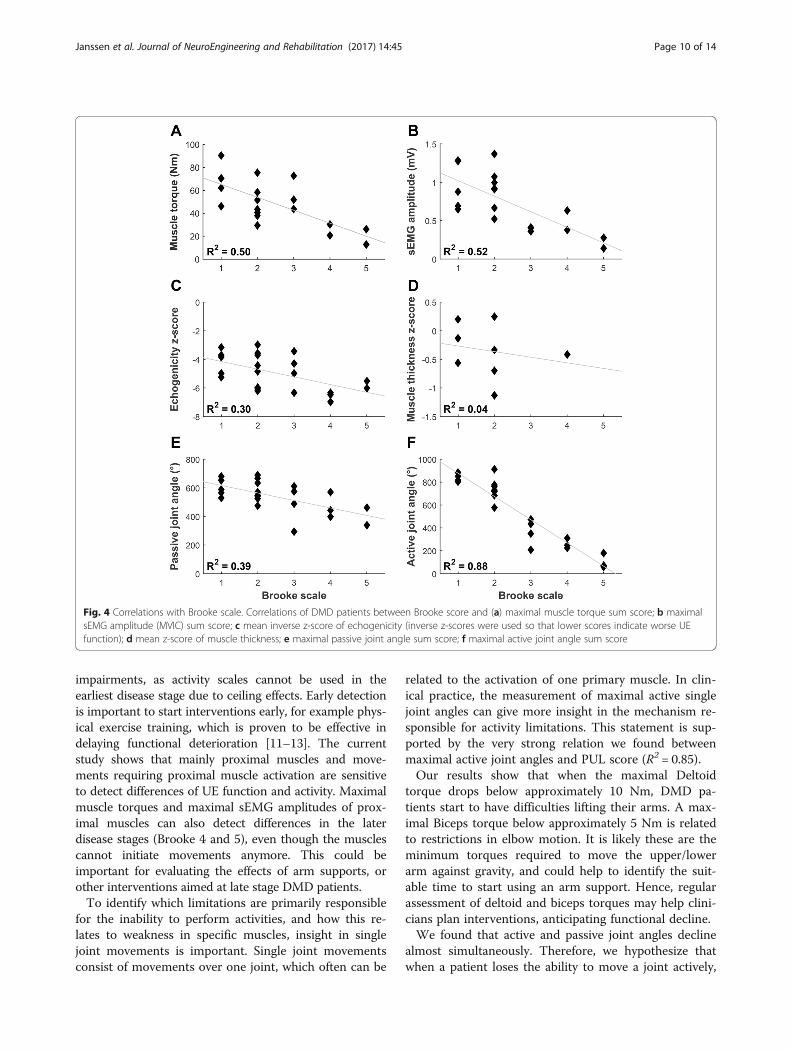
impairments, as activity scales cannot be used in theearliest disease stage due to ceiling effects. Early detectionis important to start interventions early, for example phys-ical exercise training, which is proven to be effective indelaying functional deterioration [11–13]. The currentstudy shows that mainly proximal muscles and move-ments requiring proximal muscle activation are sensitiveto detect differences of UE function and activity. Maximalmuscle torques and maximal sEMG amplitudes of prox-imal muscles can also detect differences in the laterdisease stages (Brooke 4 and 5), even though the musclescannot initiate movements anymore. This could beimportant for evaluating the effects of arm supports, orother interventions aimed at late stage DMD patients.To identify which limitations are primarily responsible
for the inability to perform activities, and how this re-lates to weakness in specific muscles, insight in singlejoint movements is important. Single joint movementsconsist of movements over one joint, which often can be
related to the activation of one primary muscle. In clin-ical practice, the measurement of maximal active singlejoint angles can give more insight in the mechanism re-sponsible for activity limitations. This statement is sup-ported by the very strong relation we found betweenmaximal active joint angles and PUL score (R2 = 0.85).Our results show that when the maximal Deltoid
torque drops below approximately 10 Nm, DMD pa-tients start to have difficulties lifting their arms. A max-imal Biceps torque below approximately 5 Nm is relatedto restrictions in elbow motion. It is likely these are theminimum torques required to move the upper/lowerarm against gravity, and could help to identify the suit-able time to start using an arm support. Hence, regularassessment of deltoid and biceps torques may help clini-cians plan interventions, anticipating functional decline.We found that active and passive joint angles decline
almost simultaneously. Therefore, we hypothesize thatwhen a patient loses the ability to move a joint actively,
Fig. 4 Correlations with Brooke scale. Correlations of DMD patients between Brooke score and (a) maximal muscle torque sum score; b maximalsEMG amplitude (MVIC) sum score; c mean inverse z-score of echogenicity (inverse z-scores were used so that lower scores indicate worse UEfunction); d mean z-score of muscle thickness; e maximal passive joint angle sum score; f maximal active joint angle sum score
Janssen et al. Journal of NeuroEngineering and Rehabilitation (2017) 14:45 Page 10 of 14
the joint will be statically positioned for longer periods,which leads to contractures soon thereafter. This hy-pothesis is in line with the findings of McDonald et al.who showed the occurence of elbow flexion contracturesappears to be related to static positions of the limb afterwheelchair confinement [30]. Hence, we recommend tostart interventions, such as stretching exercises, as soonas active joint angles start to decrease. In addition, werecommend stimulation of (supported) movement tolimit static positioning and thereby prevent contractureformation [31].A recent study has indicated that fatigue was strongly
associated with health-related quality of life and thatthere should be a greater clinical focus on the reductionof fatigue [32]. In this study, we measured maximalsEMG amplitudes, which is a measure for the maximalmuscle capacity. Normalized sEMG amplitudes showthe percentage of this maximal muscle capacity neededto perform activities. When normalized sEMG amplitudes
are high, a larger percentage of the muscle capacity isused, which leads to faster occurrence of fatigue [33].Our results show that DMD patients use a larger per-centage of their muscle capacity to perform movementsand activities compared to healthy subjects, even in anearly stage of the disease, and therefore might experi-ence earlier and more fatigue. This increase in thepercentage of muscle capacity is not only seen in primemovers, but also in secondary movers indicating the useof compensatory muscles to overcome loss of musclestrength. Future studies should try to determinenormalized sEMG amplitudes and normalized sEMGmedian frequency during a fatigue protocol, in order togain more insight in muscle fatigue of DMD patientscompared to healthy controls.Although most of our results are in line with existing
literature, we also found some differences. The passiveforearm supination angle of DMD patients in this studydid not differ significantly (p = 0.072) from healthy
Fig. 5 Correlations with PUL score. Correlations of DMD patients between total PUL score and (a) maximal muscle torque sum score; b maximalsEMG amplitude (MVIC) sum score; c mean inverse z-score of echogenicity (inverse z-scores were used so that lower scores indicate worse UEfunction); d mean z-score of muscle thickness; e maximal passive joint angle sum score; f maximal active joint angle sum score
Janssen et al. Journal of NeuroEngineering and Rehabilitation (2017) 14:45 Page 11 of 14
subjects, as opposed to findings from Bartels et al. [27].However, we found that the average forearm supinationangles were reduced in patients from Brooke 3 onward,which is in line with the results of Bartels et al. who re-ported that 83% of the adult men with DMD had loss ofsupination [27]. As far as we are aware, the differences wefound between healthy subjects and DMD patients forpassive elbow flexion, forearm pronation, wrist flexion
and ulnar deviation have not been reported before.Although the differences between healthy subjects andDMD patients are small, they could be of clinical rele-vance for the performance of daily UE activities [34–36].Muscle ultrasounds are able to make distinction be-
tween different stages of DMD [21, 28] We, however,found that echogenicity is less strongly related to diseasestage compared to maximal muscle torque and maximal
Fig. 6 Correlations with age. Correlations of DMD patients and healthy subject between age and (a) Brooke scale; b total PUL score; c maximalmuscle torque sum score; d maximal sEMG amplitude (MVIC) sum score; e mean inverse z-score of echogenicity (inverse z-scores were used sothat lower scores indicate worse UE function); f mean z-score of muscle thickness; g maximal passive joint angle sum score; h maximal active jointangle sum score
Janssen et al. Journal of NeuroEngineering and Rehabilitation (2017) 14:45 Page 12 of 14
sEMG amplitude. We expect that echogenicity, which isa measure for muscle degeneration, is less discriminativein the explored muscles because the ultrasound imagesare heavily affected by attenuation. This is especially truefor the later disease stages, as an increased amount of fatand connective tissue in the muscles prevents the ultra-sound from penetrating deeper layers of the muscle,which results in a darker picture and therefore lowers Z-scores. For the same reason muscle thickness could notbe measured accurately in older patients.
Study limitationsA limitation of this study is the relatively small number ofpatients in each group, especially in the latest diseasestages. For this reason, post hoc comparisons betweendifferent disease stages were not performed. Furthermore,stratification of possible confounders, such as corticoster-oid use and scoliosis, was not possible due to the smallsample size. In addition, as this study is cross-sectional,we were unable to determine longitudinal changes of UEfunction. Therefore we recommend future UE studies tomonitor changes of physiologic UE function over time ina cohort of patients. Nevertheless, our population is repre-sentative of the general DMD population, as the partici-pant characteristics are comparable to literature.A second limitation relates to our measurements of
individual muscle strength. External muscle torquemeasurements, as we performed with the static framemyometer are unable to measure the maximal torque ofisolated muscles. We attempted to mimic the activationof individual muscles as close as possible by choosingmeasurement positions that primarily required the acti-vation of one muscle, the prime mover. We reportedmuscles torques as our primary outcome rather thanmuscle forces, which are more commonly used in litera-ture. Muscle forces, however, do not account for theeffect of lever arm, which we believe is more relevant inour study as we measured subjects in a wide age/heightrange [37]. For comparability we also reported maximalmuscle forces in Table 2.Finally, the use of normalized sEMG amplitudes has
some limitations as well . The maximal sEMG amplitude(in MVIC) can be influenced by pain, fear of pain, restric-tions in the range of motion and/or motivation [18]. As aresult normalized sEMG amplitudes over 100% MVICwere sometimes seen. This underperformance duringMVIC measurements could affect both healthy subjectand patients. However, in patients, pain might be ofgreater influence due to joint contractures. The obtainedresults, however, show large differences between healthyboys and DMD patients, which cannot be attributed solelyto underperformance.Despite these limitations, we think this study gives
valuable and objective insights in UE function and
activity level of boys and men with DMD, which are ofgreat clinical importance for the selection and evaluationof suitable interventions.
ConclusionsThe decline of muscle functions precedes the decline inperformance of UE activities, and therefore may play arole in early detection of UE limitations. Early detectioncan have important clinical implications as it allows forstarting interventions, such as contracture preventionand physical exercise training, timely and minimizefunctional decline. Increased sEMG levels demonstratethat DMD patients use more of their muscle capacitycompared to healthy subjects to perform daily activities.This might result in increased fatigability, which shouldreceive attention in clinical practice as this is an import-ant determinant of quality of life. Active maximal jointangles are highly related to functional scales, thereforepreserving the full range of motion is important in dailylife. Monitoring active joint angles can help to selectappropriate interventions timely, to minimize UE decline.Finally, the results of this study can be used for the devel-opment of new composite outcome measures for clinicaltrials, that not only aim at the ICF activity level, but alsoon the ICF level of body functions and structures.
AbbreviationsDMD: Duchenne Muscular Dystrophy; ICF: International Classification ofFunctioning, Disability and Health; MVIC: Maximal voluntary isometriccontraction; PUL: Performance of Upper Limb; sEMG: Surfaceelectromyography; UE: Upper extremity
AcknowledgmentsThe authors would like to thank all participants in this study. We also would liketo acknowledge the VU Medical Centre for designing and making the staticframe myometer. This research was supported by the Dutch TechnologyFoundation STW (which is part of the Netherlands Organization for ScientificResearch (NWO), and which is partly funded by the Ministry of EconomicAffairs), United Parent Projects Muscular Dystrophy, Prinses Beatrix Spierfonds,Spieren voor Spieren, Johanna Kinderfonds, KinderrevalidatiefondsAdriaanstichting, Focal Meditech, OIM Orthopedie, Ambroise, and Flextension.
FundingThis work was supported by the Dutch Technology Foundation STW undergrant number 11832.
Availability of data and materialsNot applicable.
Authors’ contributionsMJ, JH, BK and IdG conceived and designed the experiment. MJ was themain author of the manuscript and JH, BK and IdG contributed to thewriting and editing of the manuscript. MJ performed the experiment,analyzed the data and obtained ethical approval. All authors read andapproved the manuscript.
Competing interestsThe authors declare that they have no competing interest.
Consent for publicationNot applicable.
Janssen et al. Journal of NeuroEngineering and Rehabilitation (2017) 14:45 Page 13 of 14

Ethics approval and consent to participateThis study was approved by the medical ethical committee Arnhem–Nijmegen,the Netherlands (Registration number 2012/135, NL nr.: 39126.091.12). Informedconsent was obtained from all participants and from their parents when thesubjects were under 18 years of age.
Publisher’s NoteSpringer Nature remains neutral with regard to jurisdictional claims inpublished maps and institutional affiliations.
Author details1Department of Rehabilitation, Radboud University Medical Center, DondersCentre for Neuroscience, Reinier Postlaan 4, 6525 GC Nijmegen, TheNetherlands. 2Department of Rehabilitation Medicine, VU University MedicalCenter, MOVE Research Institute, Amsterdam, The Netherlands. 3DepartmentBiomechanical Engineering, University of Twente, Enschede, The Netherlands.
Received: 5 December 2016 Accepted: 16 May 2017
References1. Mendell JR, Lloyd-Puryear M. Report of MDA muscle disease symposium on
newborn screening for Duchenne muscular dystrophy. Muscle Nerve.2013;48:21–6.
2. Bello L, Gordish-Dressman H, Morgenroth LP, Henricson EK, Duong T,Hoffman EP, Cnaan A, McDonald CM, Investigators C. Prednisone/prednisolone and deflazacort regimens in the CINRG Duchenne NaturalHistory Study. Neurology. 2015;85:1048–55.
3. Mattar FL, Sobreira C. Hand weakness in Duchenne muscular dystrophy andits relation to physical disability. Neuromuscul Disord. 2008;18:193–8.
4. Janssen MM, Bergsma A, Geurts AC, de Groot IJ. Patterns of decline inupper limb function of boys and men with DMD: an international survey.J Neurol. 2014;261:1269–88.
5. Eagle M, Baudouin SV, Chandler C, Giddings DR, Bullock R, Bushby K.Survival in Duchenne muscular dystrophy: improvements in life expectancysince 1967 and the impact of home nocturnal ventilation. NeuromusculDisord. 2002;12:926–9.
6. Eagle M, Bourke J, Bullock R, Gibson M, Mehta J, Giddings D, Straub V,Bushby K. Managing Duchenne muscular dystrophy–the additive effect ofspinal surgery and home nocturnal ventilation in improving survival.Neuromuscul Disord. 2007;17:470–5.
7. Balaban B, Matthews DJ, Clayton GH, Carry T. Corticosteroid treatment andfunctional improvement in Duchenne muscular dystrophy: long-term effect.Am J Phys Med Rehabil. 2005;84:843–50.
8. Connolly AM, Schierbecker J, Renna R, Florence J. High dose weekly oralprednisone improves strength in boys with Duchenne muscular dystrophy.Neuromuscul Disord. 2002;12:917–25.
9. Henricson EK, Abresch RT, Cnaan A, Hu F, Duong T, Arrieta A, Han J, EscolarDM, Florence JM, Clemens PR, et al. The cooperative internationalneuromuscular research group Duchenne natural history study:glucocorticoid treatment preserves clinically meaningful functionalmilestones and reduces rate of disease progression as measured by manualmuscle testing and other commonly used clinical trial outcome measures.Muscle Nerve. 2013;48:55–67.
10. Pane M, Fanelli L, Mazzone ES, Olivieri G, D’Amico A, Messina S, Scutifero M,Battini R, Petillo R, Frosini S, et al. Benefits of glucocorticoids in non-ambulantboys/men with Duchenne muscular dystrophy: A multicentric longitudinalstudy using the Performance of Upper Limb test. Neuromuscul Disord.2015;25:749–53.
11. Jansen M, van Alfen N, Geurts AC, de Groot IJ. Assisted bicycle trainingdelays functional deterioration in boys with Duchenne muscular dystrophy:the randomized controlled trial “no use is disuse”. Neurorehabil NeuralRepair. 2013;27:816–27.
12. Alemdaroglu I, Karaduman A, Yilmaz OT, Topaloglu H. Different types ofupper extremity exercise training in Duchenne muscular dystrophy: effectson functional performance, strength, endurance, and ambulation. MuscleNerve. 2015;51:697–705.
13. Jansen M, Burgers J, Jannink M, Alfen N, Groot IJM: Upper Limb Trainingwith Dynamic Arm Support in Boys with Duchenne Muscular Dystrophy: AFeasibility Study. Int J Phys Med Rehabil. 2015;3:256.
14. World Health O: ICF : International classification of functioning, disabilityand health / World Health Organization. Geneva: World HealthOrganization; 2001.
15. Brooke MH, Griggs RC, Mendell JR, Fenichel GM, Shumate JB, Pellegrino RJ.Clinical trial in Duchenne dystrophy. I. The design of the protocol. MuscleNerve. 1981;4:186–97.
16. Mayhew A, Mazzone ES, Eagle M, Duong T, Ash M, Decostre V,Vandenhauwe M, Klingels K, Florence J, Main M, et al. Development of thePerformance of the Upper Limb module for Duchenne muscular dystrophy.Dev Med Child Neurol. 2013;55:1038–45.
17. Hermens HJ. Freriks B, sselhorst-Klug C, Rau G: Development ofrecommendations for SEMG sensors and sensor placement procedures.J Electromyogr Kinesiol. 2000;10:361–74.
18. Cram JR, Criswell E: Cram's introduction to Surface Electromyography. 2nded. Burlington: Jones and Bartlett Publishers; 2011.
19. De Luca CJ, Gilmore LD, Kuznetsov M, Roy SH. Filtering the surface EMGsignal: Movement artifact and baseline noise contamination. J Biomech.2010;43:1573–9.
20. Winter DA, Yack HJ. EMG profiles during normal human walking: stride-to-strideand inter-subject variability. Electroencephalogr Clin Neurophysiol. 1987;67:402–11.
21. Jansen M, van Alfen N. Nijhuis van der Sanden MW, van Dijk JP, Pillen S,de Groot IJ: Quantitative muscle ultrasound is a promising longitudinalfollow-up tool in Duchenne muscular dystrophy. Neuromuscul Disord.2012;22:306–17.
22. Duffy M, Munro B, Jacobsen B. Key principles of statistical inference. In:Munro BLEA, editor. Statistical methods for health care research. 5th ed.Philadelphia: Lippincott Williams & Wilkins; 2005. p. 73–107.
23. Scholten RR, Pillen S, Verrips A, Zwarts MJ. Quantitative ultrasonography ofskeletal muscles in children: normal values. Muscle Nerve. 2003;27:693–8.
24. Jaspers E, Feys H, Bruyninckx H, Harlaar J, Molenaers G, Desloovere K. Upperlimb kinematics: development and reliability of a clinical protocol forchildren. Gait Posture. 2011;33:279–85.
25. James WV, Orr JF. Upper limb weakness in children with Duchennemuscular dystrophy–a neglected problem. Prosthet Orthot Int. 1984;8:111–3.
26. Lord JP, Portwood MM, Lieberman JS, Fowler Jr WM, Berck P. Upperextremity functional rating for patients with Duchenne muscular dystrophy.Arch Phys Med Rehabil. 1987;68:151–4.
27. Bartels B, Pangalila RF, Bergen MP, Cobben NA, Stam HJ, Roebroeck ME.Upper limb function in adults with Duchenne muscular dystrophy.J Rehabil Med. 2011;43:770–5.
28. Zaidman CM, Connolly AM, Malkus EC, Florence JM, Pestronk A. Quantitativeultrasound using backscatter analysis in Duchenne and Becker musculardystrophy. Neuromuscul Disord. 2010;20:805–9.
29. Rutkove SB, Geisbush TR, Mijailovic A, Shklyar I, Pasternak A, Visyak N, Wu JS,Zaidman C, Darras BT. Cross-sectional evaluation of electrical impedancemyography and quantitative ultrasound for the assessment of Duchennemuscular dystrophy in a clinical trial setting. Pediatr Neurol. 2014;51:88–92.
30. McDonald CM, Abresch RT, Carter GT, Fowler Jr WM, Johnson ER, Kilmer DD,Sigford BJ. Profiles of neuromuscular diseases. Duchenne musculardystrophy. Am J Phys Med Rehabil. 1995;74:S70–92.
31. Skalsky AJ, McDonald CM. Prevention and management of limb contracturesin neuromuscular diseases. Phys Med Rehabil Clin N Am. 2012;23:675–87.
32. Wei Y, Speechley KN, Zou G, Campbell C: Factors Associated With Health-Related Quality of Life in Children With Duchenne Muscular Dystrophy. JChild Neurol. 2016;31:879-86.
33. Nordlund MM, Thorstensson A, Cresswell AG. Central and peripheralcontributions to fatigue in relation to level of activation during repeated maximalvoluntary isometric plantar flexions. J Appl Physiol (1985). 2004;96:218–25.
34. Aizawa J, Masuda T, Koyama T, Nakamaru K, Isozaki K, Okawa A, Morita S.Three-dimensional motion of the upper extremity joints during variousactivities of daily living. J Biomech. 2010;43:2915–22.
35. Romilly D, Anglin C, Gosine R, Hershler C, Raschke S. A Functional TaskAnalysis and Motion Simulation for the Development of a PoweredUpper-Limb Orthosis. IEEE trans rehabil eng. 1994;2:119–29.
36. van Andel CJ, Wolterbeek N, Doorenbosch CA, Veeger DH, Harlaar J.Complete 3D kinematics of upper extremity functional tasks. Gait Posture.2008;27:120–7.
37. Hebert LJ, Maltais DB, Lepage C, Saulnier J, Crete M. Hand-HeldDynamometry Isometric Torque Reference Values for Children andAdolescents. Pediatr Phys Ther. 2015;27:414–23.
Janssen et al. Journal of NeuroEngineering and Rehabilitation (2017) 14:45 Page 14 of 14