dynamic factors influencing future domestic waste flows in
TRANSCRIPT

Dynamic factors influencing future domestic waste
flows in the City of Cape Town
by
Therese Luyt
March 2018
Thesis presented in partial fulfilment of the requirements for the degree
of Master of Philosophy in Sustainable Development in the Faculty of
Economic and Management Sciences at Stellenbosch University
Supervisor: Prof. Josephine Kaviti Musango

i | P a g e
Declaration
By submitting this thesis electronically, I declare that the entirety of the work contained
therein is my own, original work, that I am the sole author thereof (save to the extent
explicitly otherwise stated), that reproduction and publication thereof by Stellenbosch
University will not infringe any third party rights and that I have not previously in its
entirety or in part submitted it for obtaining any qualification.
Date: March 2018
Copyright © 2018 Stellenbosch University
All rights reserved
Stellenbosch University https://scholar.sun.ac.za

ii | P a g e
Abstract
The production of waste in cities is one of the largest challenges to urban sustainability.
Waste generation continue to grow with increasing population. Waste management has
become challenging for urban and city managers. This study therefore explored the
dynamic factors influencing future domestic waste flows in the City of Cape Town.
This was achieved by first undertaking a literature analysis to examine the drivers of
waste flows and exploration of municipal waste management as a complex system. A
qualitative system dynamics approach mainly using causal loop diagrams was then
utilised, and three feedback loops essential for managing waste were identified, namely:
public health feedback loop, waste resource management feedback loop, and
environmental protection feedback loop. The public health feedback loop revealed that
residents’ behavioural problems in combatting illegal dumping is a major concern that
impedes advancement in the municipality. With informal dwellings on the rise, illegal
dumping has consequently increased, impacting people’s health. The waste resource
management feedback loop shows that waste generation reduces available landfill
capacity and undermines environmental protection efforts. However, recycling efforts,
such as source separation in selected suburbs, diverts waste and home composting
further increases the diverted waste, thus, saving on landfill airspace. Alternative
technologies can also be utilised to increase the landfill airspace, as illustrated in the
environmental protection feedback loop. To assist the City of Cape Town in combatting
illegal dumping, case specific studies and particularly, understanding household waste
flows and behaviours would be useful. In addition, extending to quantitative system
dynamics modelling would support policy design and implementation of intervention
projects.
Stellenbosch University https://scholar.sun.ac.za

iii | P a g e
Opsomming
Afvalproduksie in stede bied een van die grootste uitdagings wat stedelike
volhoubaarheid betref. Namate die bevolking groei, word al hoe meer afval gegenereer.
Afvalbestuur het ’n groot uitdaging vir stedelike en stadsbestuurders geword. Hierdie
studie ondersoek die dinamiese faktore wat toekomstige huishoudelike
afvalvloeipatrone in die Stad Kaapstad beïnvloed. Dit word gedoen eerstens deur ’n
literatuurontleding ten einde die drywers vir afvalvloei te bepaal en deur munisipale
afvalbestuur as ’n ingewikkelde sisteem te verken. ’n Benadering wat op kwalitatiewe
sisteemdinamika berus en hoofsaaklik kousale lusdiagramme gebruik, is vervolgens
ingespan, waarna drie terugvoerlusse wat noodsaaklik vir afvalbestuur is, uitgewys is,
te wete: die terugvoerlus vir openbare gesondheid; die terugvoerlus vir
afvalhulpbronbestuur; en die terugvoerlus vir omgewingsbeskerming. In die
terugvoerlus vir openbare gesondheid is daar bevind dat inwoners se gedragsprobleme
rakende die bekamping van onwettige storting ’n ernstige bron tot kommer is en
vordering in die munisipaliteit strem. Namate informele nedersettings uitbrei, neem
onwettige storting toe, wat ’n impak op mense se gesondheid het. Die terugvoerlus vir
afvalhulpbronbestuur toon aan dat afvalgenerering die beskikbare
terreinvullingskapasiteit verminder en pogings tot omgewingsbeskerming belemmer.
Herwinningspogings soos die skeiding van afvalbronne in gekose voorstede herlei wel
die afval, terwyl tuiskomposproduksie die hoeveelheid herleide afval verhoog en
gevolglik terreinopvullingsruimte bespaar. Alternatiewe tegnologieë kan ook gebruik
word om terreinopvullingsruimte te verhoog, soos daar in die terugvoerlus vir
omgewingsbeskerming bevind is. Ondersteuning aan die Stad Kaapstad met die
bekamping van onwettige storting aan die hand van spesifieke gevallestudies en
ondersoeke na huishoudelikeafvalvloei en -gedrag kan van groot waarde wees. Verder
kan beleidsontwerp en intervensieprojekte aangehelp word deur die modellering van
die kwantitatiewe sisteemdinamika uit te brei.
Stellenbosch University https://scholar.sun.ac.za

iv | P a g e
Acknowledgements
I wish to express my appreciation to the following people:
My supervisor, Professor Josephine Kaviti Musango, for your patience,
feedback and endless support – I could not have asked for a better supervisor
Paul Currie, for peer reviewing my work at a very critical stage
My friends and family, especially my dearest mother, sisters and brother, for
your unwavering support, constant prayers and encouragement – it’s always
been a scaffold to me
Peter, thank you for all your support throughout the years
My phenomenal daughter, Hannah. You have sacrificed as much as I did to get
the work completed, constantly asking “Mommy, when are you done?” Thank
you, sweetheart, for your patience and understanding. I love you!
All glory to God the Father, Son and Holy Spirit for giving me the strength and wisdom
to complete this work.
This study was made possible with the financial assistance of the National Research
Foundation Grant Number CSUR14080385401.
Stellenbosch University https://scholar.sun.ac.za

v | P a g e
Table of Contents
Declaration ...................................................................................................................... i Abstract .......................................................................................................................... ii Opsomming .................................................................................................................. iii
Acknowledgements ....................................................................................................... iv Table of Contents ........................................................................................................... v List of figures ............................................................................................................... vii List of photographs .................................................................................................... viii List of tables .................................................................................................................. ix
Chapter 1: Introduction .................................................................................................. 1 1.1 Background .................................................................................................. 1
1.2 Research problem ........................................................................................ 4 1.3 Research objectives ..................................................................................... 5 1.4 Significance of the study ............................................................................. 5 1.5 Limitations and assumptions of the study ................................................... 5 1.6 Research strategy ......................................................................................... 5
1.7 Outline of the thesis ..................................................................................... 6 Chapter 2: Literature review .......................................................................................... 7
2.1 Introduction ................................................................................................. 7 2.2 Defining waste................................................................................................. 8
2.3 Urban waste flows ......................................................................................... 10 2.3.1 Defining municipal solid waste ............................................................. 12
2.3.2 Municipal solid waste generation .......................................................... 16
2.4 Waste management ....................................................................................... 19
2.4.1 Traditional municipal solid waste management ............................................. 20 2.4.2 Integrated sustainable waste management ...................................................... 23
2.4.3 The waste management hierarchy ................................................................... 24 2.4.4 Municipal waste management as a complex system....................................... 25 2.4.5 Municipal solid waste: Recovery of recyclables ............................................ 28
2.5 Drivers of waste flows ....................................................................................... 30 2.6 Consequences of poor waste management on human and environmental health
.................................................................................................................................. 33
2.7 Modelling urban waste .................................................................................. 34 2.8 Summary ....................................................................................................... 41
Chapter 3: Research design and methodology ............................................................. 43
3.1 Introduction ........................................................................................................ 43
3.2 Research design ................................................................................................. 43 3.3 Research methodology ....................................................................................... 44
3.4 Research method ............................................................................................ 45
3.4.1 Research objective 1: Examine the drivers of waste flows in the City of Cape
Town ........................................................................................................................ 45
3.4.2 Research objective 2: Examine existing solid waste management practices in
the City of Cape Town ............................................................................................. 46 3.4.3 Research objective 3: Explore dynamic factors influencing future domestic
waste flows in the City of Cape Town ..................................................................... 49 3.5 Summary ........................................................................................................ 49
Chapter 4: Results ........................................................................................................ 50
4.1 Introduction .................................................................................................... 50 4.2 Drivers of waste flows in the City of Cape Town ......................................... 51
Stellenbosch University https://scholar.sun.ac.za

vi | P a g e
4.3 Solid waste management practices in the City of Cape Town....................... 56 4.4 Factors influencing future domestic waste flows in the City of Cape Town . 64
Chapter 5: Conclusions and recommendations ............................................................ 71 5.1 Introduction .................................................................................................... 71 5.2 Key findings from literature review ............................................................... 71
5.3 Key findings from causal loop diagrams ....................................................... 72 5.4 Recommendations .......................................................................................... 75
References .................................................................................................................... 76
Stellenbosch University https://scholar.sun.ac.za

vii | P a g e
List of figures
Figure 1.1: Research strategy 6
Figure 2.1: The linear metabolism of cities 10
Figure 2.2: The circular metabolism of cities 11
Figure 2.3: Composition of municipal solid waste (%) in relation to income per country
category 14
Figure 2.4: Waste management hierarchy 25
Figure 2.5: Elements of an integrated sustainable waste system 27
Figure 2.6: Drivers of municipal solid waste flows 32
Figure 2.7: Two triangles representation 33
Figure 2.8: Example of a population causal loop diagram 41
Figure 3.1: Research strategy 44
Figure 4.1: City of Cape Town metropolitan municipality 50
Figure 4.2: GDP and real GDP – South Africa and Cape Town for 2004–2014 52
Figure 4.3: Indigent households for 2003 to 2015 53
Figure 4.4: Composition of municipal solid waste in the City of Cape Town 59
Figure 4.5: Composition of domestic waste streams 59
Figure 4.6: Waste characterisation survey: Western Cape municipalities 60
Figure 4.7: Public health feedback loops 65
Figure 4.8: Waste resource management feedback loops 67
Figure 4.9: Environmental protection feedback loop 68
Figure 4.10: Overall feedback loops of the factors affecting future domestic waste flows
69
Stellenbosch University https://scholar.sun.ac.za

viii | P a g e
List of photographs
Photograph 1: Municipal waste from residential collections 9
Stellenbosch University https://scholar.sun.ac.za

ix | P a g e
List of tables
Table 2.1: Composition of municipal solid waste 13
Table 2.2: Waste compositions for various income cities 15
Table 2.3: Waste generation for various income cities 18
Table 2.4: Different uses of the term sustainable waste management 23
Table 2.5: Municipal solid waste: Recyclables recovered in 13 developing countries
29
Table 2.6: System dynamics modelling process across the typical literature 36
Table 2.7: Various applications of system dynamics modelling in waste management
39
Table 3.1: Overview of indicators 47
Table 4.1: Key benchmark numbers 64
Stellenbosch University https://scholar.sun.ac.za

1 | P a g e
Chapter 1: Introduction
1.1 Background
The global urban population in 2014 was more than 50% of the total global population
and with continuous population growth and urbanisation, the population is expected to
reach 6.4 billion by 2050 (United Nations, 2014), equating to three-quarters of the
world’s population (Mesjasz-Lech, 2014). It is estimated that 90% of the increase in
urban population will be concentrated in Asia and Africa (United Nations, 2014), which
will become 64% and 56% urban by 2050, respectively. Cities are the drivers of a
nation’s economy and the centres of innovation, where the highest skills are focused
(UN-Habitat, 2008). However, for cities to be productive, especially in light of expected
urbanisation, a certain level of socio-economic stock such as infrastructure is needed
(Hyman, 2011). Rapid urbanisation also presents new challenges for innovation and
opportunities to improve the way in which human habitats are shaped (UN-Habitat,
2012). Cities depend on various resource flows to function. Significant resource flows
through a city’s urban system are water, sewage, solid waste, oil, electricity and
building materials for construction (Swilling & Annecke, 2012). Without these
interconnected resource flows, cities would grind to a halt (Swilling & Annecke, 2012),
as living conditions of people are influenced by these services.
One such challenge is municipal solid waste management, which is claimed as one of
the biggest challenges of the urban world (Achankeng, 2003; Dyson & Chang, 2005).
The production of waste from inflow of materials into cities is a challenge to urban
sustainability. The management of waste as a material output has therefore become
difficult for urban and city managers responsible for waste management (UNEP, 2005).
Waste generation will continue to grow due to increasing urbanisation and increase in
affluence (Phiri, Godfrey & Snyman, 2012).
Several authors have contended that the 20th century saw an increase in urban waste
due to factors such as global population increase, a rise in living standards, rapid
urbanisation and unprecedented levels of economic activities (Agbesola, 2013;
Gutberlet, 2015; Leao, Bishop & Evans, 2001; Mesjasz-Lech, 2014; UN-Habitat,
2010). Addressing this challenge has become a priority for the global environmental
Stellenbosch University https://scholar.sun.ac.za

2 | P a g e
agenda in the 21st century due to inadequate infrastructure and service provision in both
African and Asian cities (UN-Habitat, 2010). A move towards accelerating sustainable
urban transitions is necessary to cater for the increase in urban populations (UN-
Habitat, 2014) and the rising generation of urban waste, which presents public health
and environmental threats (Gutberlet, 2015; Mesjasz-Lech, 2014; Pai, Rodrigues,
Mathew, Hebbar, 2014; Wilson, Velis & Rodic, 2013).
Traditionally, municipal waste management consists of waste generation, collection,
transport, transfer, processing and finally disposal. This represents a complex system
that is dynamic and multi-faceted and depends on available technology as well as social
and economic factors (Ahmad, 2012). Landfill sites result in leachate (contaminated
water) from landfilled waste, loss of habitat and consumption of natural resources (Pai,
Rodrigues, Mathew, Hebbar, 2014) and have no beneficial use upon closure (Leao,
Bishop & Evans, 2004). Despite the need for a move towards sustainable urban
transitions, with land as a limited and scarce resource (Leao, Bishop & Evans, 2004),
landfill sites are still seen as the preferred method for disposal. This is mainly due to
governance issues, high capital investment and operating costs, which normally seek
international development aid funding (Wilson et al., 2013).
The development of new landfills proves difficult, as there is increasing competition
for land development, thereby putting pressure on land resources in areas surrounding
cities (Lea, Bishop & Evans, 2004). What is required is sustainable and integrated waste
management (IWM) disposal practices such as thermal processing, energy recovery and
variations of mechanical biological treatment facilities to mitigate detrimental
environmental impacts and harm to public health and return waste materials as a
resource for beneficial use (Wilson et al., 2013).
In South Africa, waste is a significant and growing environmental issue. The volumes
of waste have grown steadily and gave rise to nearly 67 million m3 of waste from 2001
to 2011, with an annual average growth rate of approximately 5% (DEA, 2012). Despite
the increase in waste, there is still a backlog in waste service provision with almost
900 000 of households not receiving a basic collection service by 2011 (DEA, 2012).
There is still a heavy reliance on landfills, with over 90% of all waste ending up at
landfills (DEA, 2012). There are 1 203 general waste landfill sites in South Africa, of
Stellenbosch University https://scholar.sun.ac.za

3 | P a g e
which 56.4% are unlicensed (DEA, 2012). There are many licenced sites that are non-
compliant with their waste management licence conditions, resulting in negative
environmental impacts and pressure on available land resources (DEA, 2012). The
national government has set targets for the reduction of waste to landfill in its Medium
Term Strategic Framework (2014–2019) (DEA, 2014). This framework aims to protect
and enhance our environmental assets and natural resources and to improve waste
management by investing in recycling infrastructure and implementing the
internationally adopted waste management hierarchy (DEA, 2014). The framework
states that the percentage of waste diverted from landfill for reuse, recycling and
recovery must be 20% by 2019. The limited capacity for landfill along with the national
government’s targets for the reduction of waste disposed of at landfill implies that
alternatives are needed as a means to deal with municipal solid waste.
The growing environmental issue can be attributed to rapid urbanisation in major cities
in South Africa, such as Cape Town in the Western Cape province (City of Cape Town,
2016b; 2017). The City of Cape Town is no exception to the global environmental
challenges, including municipal waste management. The main method currently used
to manage municipal waste is disposal at landfills with limited recycling activities (City
of Cape Town, 2016b; 2017). The recycling activities entail separation at source at
almost a third of formal households in the City of Cape Town and public drop-off
facilities – residents are encouraged to take their recyclables to such drop-off facilities.
Recently a home composting pilot project has been launched as well (City of Cape
Town, 2016b; 2017).
The City of Cape Town’s environment faces historical challenges such as rapid
urbanisation, with a growing number of households requiring municipal services amid
increased natural resource constraints (City of Cape Town, 2014; Swilling, 2014). The
limited recycling efforts, excluding the home composting pilot project, currently divert
12% of the municipal waste stream from landfill to increase available airspace.
However, the total available airspace at the operating facilities is estimated at less than
10 years, below the international benchmark for airspace provision of 15 years (City of
Cape Town, 2016b; 2017).
Stellenbosch University https://scholar.sun.ac.za

4 | P a g e
The City of Cape Town Metropolitan Municipality has planned a new regional landfill
site, outside Atlantis (City of Cape Town, 2014), and is awaiting licence approval for
this facility. The new regional landfill site will assist in carrying out the municipality’s
constitutional mandate to provide basic services to all its communities (City of Cape
Town, 2014). The construction of new landfill sites is a complex and expensive process,
but remains an essential service that the City of Cape Town is mandated to deliver. On
the one hand, locating new landfill sites too far out of the city would result in increased
transport costs for the municipality; on the other hand, there is insufficient land to locate
them closer to waste generation areas. Sites must be engineered, with costly
containment barriers, and properly operated to prevent the pollution of groundwater or
other forms of pollution from occurring.
1.2 Research problem
Solid waste is one significant resource flow in the City of Cape Town and requires
urgent attention to cater for the influx of people, as the three operating landfill sites are
fast approaching full capacity. In order to properly manage municipal solid waste in the
growing city, it is essential to understand the trends in growth and urbanisation in Cape
Town. This can assist in estimating waste generation and future needs for disposal
facilities in order to promote sustainable waste management for an inclusive urban Cape
Town (City of Cape Town, 2014).
Cape Town currently has several significant environmental challenges, including
climate change, waste and pollution, resource depletion and biodiversity loss. Urban
environmental problems should be understood as a threat to present and future human
well-being, resulting from human-induced damage to the physical environment that
originates or is experienced in urban areas. (City of Cape Town, 2014:25)
This study explored the dynamic factors influencing domestic waste flows in the City
of Cape Town in providing additional landfill airspace to the already dwindling
available landfill capacity in a developing world context of urban growth.
Stellenbosch University https://scholar.sun.ac.za

5 | P a g e
1.3 Research objectives
The objectives of this study were:
1) To examine the drivers of waste flows in the City of Cape Town;
2) To examine existing solid waste management practices in the City of Cape
Town; and
3) To explore the dynamic factors influencing future domestic waste flows in the
City of Cape Town using causal loop diagrams.
1.4 Significance of the study
The significance of this study is its contribution to the academic field of sustainable
development in growing cities through the demonstration of the importance of and need
for integrated sustainable waste management (ISWM) planning and practices.
Reducing the negative impacts of Cape Town’s current waste challenges, such as
groundwater contamination, land degradation and methane emissions, will have
positive impacts for the residents of Cape Town as well as the natural environment. The
City of Cape Town can use this study to inform its waste management system.
1.5 Limitations and assumptions of the study
The research only focused on domestic waste flows in the City of Cape Town. When
searching for literature on waste management practices in the City of Cape Town, the
majority of reports and documents were available on the municipality’s website and the
only waste stream on which considerable emphasis was placed was domestic waste.
The other waste streams, namely commerce and industry, are blurred in the available
literature, and therefore an account of the total waste stream could not be undertaken.
This resulted in the research being heavy reliant on grey literature, which is generally
not published in the public or peer reviewed journals.
1.6 Research strategy
The research strategy for this study is depicted in Figure 3.1. A literature review (Step
1) was conducted to review the issues of population growth, urbanisation, the drivers
of waste flows and sustainable waste management. Further, the literature review
substantiated the choice of qualitative system dynamics using causal loop diagrams as
a useful way to understand dynamic factors influencing future domestic waste flows in
Stellenbosch University https://scholar.sun.ac.za

6 | P a g e
the City of Cape Town. The study investigated current waste management practices in
the City of Cape Town (Step 2) to inform the causal loop diagrams (Step 3).
Figure 3.1: Research strategy
Source: Researcher
1.7 Outline of the thesis
Chapter 1 introduced the background to the study, the research problem, the objectives,
significance and study scope and the research strategy. Chapter 2 presents the literature
review, which includes drivers of waste flows, sustainable waste management and the
need for qualitative system dynamics using causal loop diagrams. Chapter 3 presents
the methodology conducted and the research methods used for the study. Chapter 4
outlines and presents the results and outcomes of this study. Chapter 5 concludes the
study and provides recommendations for further research.
Step 1: Literature
review
Step 2: Qualitative
analysis
Step 3: Causal loop
diagrams
Stellenbosch University https://scholar.sun.ac.za

7 | P a g e
Chapter 2: Literature review
2.1 Introduction
Our future depends on how waste is managed (UNEP, 2015). The generation of waste
and its associated problems are found wherever there is a human activity (Ogola,
Chimuka & Tshivhase, 2011). This is certainly true in cities that provide opportunity
for economic development, a process that inevitably produces waste. The types of
problems associated with waste are often varied, based on time and the development of
societies of various sizes, and are problems faced in many countries today (Agbesola,
2013). Various documents state that the magnitude of waste-associated problems, as
well as the quantities and composition of waste, differs significantly between developed
and developing countries (Engledow, 2005; UNEP, 2002), and it is notable that
problems are manifested in different ways across different urban settings.
There is no readymade solution for dealing with waste management challenges, as cities
are unique, with different types of landscapes and context-specific needs. Developed
countries generate almost half of the global waste, while Asian and African countries
generate the least waste (European Commission, 2010). Countries in North America
and Europe have experienced growth in waste generation of 25% and 14%,
respectively, between the years 1995 and 2007. Developing countries in Central and
South America saw an increase of 12% between 1998 and 2005, while countries in Asia
are expected to experience a staggering growth in waste production of 137% between
1998 and 2025 (European Commission, 2010). This high growth expected is due to the
fact that 90% of the increase in urban population will be concentrated in both Asia and
Africa.
This chapter investigated the problem of waste at a global and local scale to
contextualise the urban waste problem in both developed and developing countries, and
to demonstrate the importance of addressing the challenges faced by waste
management. The chapter presents a literature review on undesirable consequences of
conventional waste management practices that fail to tap into the resource value of
waste, as well as examples of countries that have made a paradigm shift towards ISWM
practices. It argues that waste must be dealt with in a sustainable manner to safeguard
the environment for future generations. The practices to move towards ISWM was also
Stellenbosch University https://scholar.sun.ac.za

8 | P a g e
reviewed. The chapter concludes with a discussion of qualitative system dynamics
modelling and how causal loop diagrams can contribute to understanding the dynamic
drivers essential for planning waste management systems.
2.2 Defining waste
The term ‘waste’ has many interpretations. The Basel Convention defines waste as
“substances or objects which are disposed of or are intended to be disposed of or are
required to be disposed of by the provisions of national law” (UNEP, 2000:6). The
European Union (2008:n.p.) defines waste as “any substance or object which the holder
discards or intends or is required to discard”. These ‘substances’ or ‘objects’ are
generally classified by their source or origin, their constituent, regulations or material
types. The above definitions label waste as something unwanted by the ‘holder’,
therefore assuming a negative connotation to it (Marshall & Farahbakhsh, 2013).
However, in the context of integrated solid waste management, such as in the South
African context, waste only bears a negative connotation if it cannot be used as a
resource. The South African definition of waste has elements of the internationally
adopted waste management hierarchy and is expressed by the ‘3Rs’: reduce, reuse and
recycle (Marshall & Farahbakhsh, 2013; Wilson et al., 2013).
The South African Department of Environmental Affairs (RSA, 2014:4) defines waste
as follows:
(a) any substance, material or object, that is unwanted, rejected, abandoned,
discarded or disposed of, or that is intended or required to be discarded or
disposed of, by the holder of that substance, material or object, whether or not
such substance, material or object can be re-used, recycled or recovered and
includes all wastes as defined in Schedule 3 to this Act; or
(b) any other substance, material or object that is not included in Schedule 3 that may
be defined as a waste by the Minister by notice in the Gazette, but any waste or
portion of waste, referred to in (a) and (b), ceases to be a waste-
i. once an application for its re-use, recycling or recovery has been
approved or, after such approval, once it is, or has been re-used, recycled
or recovered;
ii. where approval is not required, once a waste is, or has been re-used,
Stellenbosch University https://scholar.sun.ac.za

9 | P a g e
recycled or recovered;
iii. where the Minister has, in terms of section 74, exempted any waste or a
portion of waste generated by a particular process from the definition of
waste; or
where the Minister has, in the prescribed manner, excluded any waste
stream or a portion of a waste stream from the definition of waste.
Waste is classified into various categories. Typical classifications are municipal waste,
hazardous waste and nuclear waste. Photograph 2 depicts the different material types
from municipal waste collections. Plastic and paper are the most notable waste
materials and offer the potential to be recycled.
Photograph 2: Municipal waste from residential collections
Source: Researcher
The next section describes the flows of urban waste and introduces the notion of linear
waste flows versus circular waste flows through cities. The flow of urban waste is
normally from residential or industrial sources through to the recovery, recycling or, as
a last resort, final disposal of waste and is normally conveyed by infrastructure systems,
which are different in different world contexts.
Stellenbosch University https://scholar.sun.ac.za

10 | P a g e
2.3 Urban waste flows
Globalisation and urban growth are seen as the two main drivers of increased waste
volumes in cities (Achankeng, 2003). The increased volumes are notably due to
increased flows of goods and services needed in growing cities. This is further
compounded by a change in lifestyle: As people earn more money, their consumption
increases and their consumption patterns change, resulting in increased production of
waste and more variety of waste flows (Achankeng, 2003; Swilling & Annecke, 2012).
As globalisation increases, it has become necessary to re-imagine sustainable urban
transitions in cities and to capture the most effective interventions (UN-Habitat, 2014).
Figure 2.1 depicts the current unsustainable linear flow of material inputs and outputs
with both consumption and pollution at high rates. Linear flows can be seen as
unsustainable because of the limited resources available; waste is still not being
recycled and reused and therefore produces leachate from landfills, which contributes
to climate change and the waste of valuable land.
Figure 2.1: The linear metabolism of cities
Source: Doughty and Hammond (2004)
In the past, many cities have been built on this linear metabolism structure. Now, with
the ‘second urbanisation wave’ in developing countries and limited landfill airspace
available, it is impossible to continue with this unsustainable linear flow trajectory.
Interventions are required to reduce the output of waste materials, as shown in
Figure 2.2. Such interventions would make use of circular flows to recycle and reuse
waste as early as possible.
Stellenbosch University https://scholar.sun.ac.za

11 | P a g e
Figure 2.2: The circular metabolism of cities
Source: Doughty and Hammond (2004)
Figure 2.2 depicts a circular metabolism of material flows with a reduction of new
inputs with the use of renewable energy as opposed to the use of conventional coal, oil
and nuclear in the linear metabolism, and maximisation of recycling of organic and
inorganic waste, ultimately leading to fewer outputs. This model is the ultimate
sustainable waste management approach, as it ‘closes the loop’ by returning both
organic and inorganic waste to beneficial use through recycling (Wilson, 2007). This
ensures landfill sites having extended lifespans and a cleaner environment, and as a
result achieves sustainable development in cities. Girardet (1996) argues that linear
inputs and outputs of cities are unsustainable. Doughty and Hammond (2004) point out
that circular metabolism is more desirable than the linear approach, as inputs are
efficiently harnessed and waste products are reduced, reused or recycled. However,
Troschinetz and Mihelcic (2009) are of a different opinion and state that recycling as
one form of achieving sustainable municipal solid waste management depends greatly
on where one lives.
Developed countries have recycling activities that are part of people’s daily lives, in
which source separation and drop-off facilities are in close proximity to residential
areas (Troschinetz & Mihelcic, 2009). This is heavy loaded with technical applications,
policies and economic incentives. In contrast, developing countries struggle with
behaviour problems such as a lack of interest in recycling (Troschinetz & Mihelcic,
2009). In most developing countries the informal sector, which consists of waste
Stellenbosch University https://scholar.sun.ac.za

12 | P a g e
pickers among others, collect recyclables at landfill sites and kerbside collection bins
and sell the recyclables to buy-back facilities if they have transport or to middlemen
who transport the waste to recyclers (Troschinetz & Mihelcic, 2009). In this way, these
waste pickers rely on recyclables to enable their livelihood.
2.3.1 Defining municipal solid waste
The definition of municipal solid waste varies between countries (UN-Habitat, 2010)
and the variation is evident in most international literature reviewed for this study. The
definition is often used when referring to sources of waste from households, commerce,
industry and agriculture and construction activities (Intharathirat et al., 2015; Karak,
Bhagat & Bhattacharyya, 2012; Ogola et al., 2011; Sufian & Bala, 2007; UNEP, 2005).
The definition also evolves over time due to its heterogeneous (i.e. household waste)
and homogenous (i.e. industrial and agricultural waste) nature and can therefore be
termed a ‘working definition’. Further context is given in the UN-Habitat’s report
(2010:6), which defines municipal solid waste as follows:
[W]astes generated by households, and wastes of a similar nature generated by
commercial and industrial premises, by institutions such as schools, hospitals, care
homes and prisons, and from public spaces such as streets, markets, slaughter
houses, public toilets, bus stops, parks, and gardens.
Apart from the definition, it is important to understand the composition of municipal
solid waste, as it provides an indication of the rate of recycling, per material type, in
both developed and developing countries. Vesiland and Worrell (2002) refer to
municipal solid waste as solid waste produced by communities and explain that it is
made up of mixed household waste, recyclables, household hazardous waste,
commercial waste, bulky waste, construction and demolition waste and garden green
waste, shown in detail in Table 2.1.
Stellenbosch University https://scholar.sun.ac.za

13 | P a g e
Table 2.1: Composition of municipal solid waste
Composition Types of material
Mixed household waste Kitchen waste, fabric and packaging
Recyclables Newspaper, cans (aluminium and metal),
plastic, cardboard, glass
Household hazardous waste Paints, chemicals
Commercial waste Businesses, industry
Bulky waste Refrigerators, rugs
Construction and demolition waste Bricks, sand, concrete
Garden green waste Leaves, tree cuttings
Source: Adapted from Vesiland and Worrell (2002) and Engledow (2007)
For the purpose of this study, municipal solid waste refers to mixed household waste
(including recyclables and household hazardous waste), commercial, and construction
and demolition waste. Household waste refers to mixed household waste, recyclables,
household hazardous waste and garden green waste.
Figure 2.3 indicates the composition of municipal solid waste for various income cities,
adapted from the UN-Habitat report, Solid waste management in the world’s cities:
Water and sanitation in the world’s cities (2010). Figure 2.3 shows that organic waste
dominates the composition of municipal solid waste in both low-income and middle-
income countries, while recyclables (paper and cardboard, plastic, metals, glass)
dominate in the high-income countries. As countries get richer, their consumption
patterns increase. Low-income countries are predominantly reliant on organic waste
and middle-income countries on paper and cardboard. Because middle- and high-
income groups make use of higher proportions of materials that can be recycled, this is
where recycling initiatives could be focused.
Stellenbosch University https://scholar.sun.ac.za

14 | P a g e
Figure 2.3: Composition of municipal solid waste (%) in relation to income per
country category
Source: United Nations (2011)
City-level waste compositions are shown in Table .2. The proportion of organic wastes
produced in each city is as follows: Delhi 81%, Nairobi 65%, San Francisco 34% and
Rotterdam 26%. The cities of Delhi and Nairobi are both low-income cities, therefore
organic waste dominates the waste stream. This trend is confirmed at country level by
recent waste characterisation surveys conducted in developing countries showing high
organic waste generation rates, such as in Ghana with 61% (Miezah, Obiri-Danso,
Kádár, Fei-Baffoe, Mensah 2015) and Lagos, Nigeria with 55% (Agbesola, 2013).
Stellenbosch University https://scholar.sun.ac.za

15 | P a g e
Table 2.2: Waste compositions for various income cities
Income
category
City Paper (%) Glass (%) Metal (%) Plastic (%) Organics
(%)
Other (%) Hazardous
waste (%)
Residual
(%)
Total
(%)
High Adelaide,
Australia
7 5 5 5 26 52 0 0 100
Low Nairobi, Kenya 6 2 1 12 65 15 0 0 100
High Rotterdam,
Netherlands
27 8 3 1 26 19 0 0 100
High San Francisco,
USA
24 3 4 11 34 21 3 0 100
High Tompkins County,
USA
36 6 8 11 29 11 0 0 100
Low Delhi, India 7 1 0 10 81 0 0 0 100
High Varna, Bulgaria 13 15 10 15 24 23 0 1 100
Low Moshi, Tanzania 9 3 2 9 65 5 0 7 100
Source: UN-Habitat (2010)
Stellenbosch University https://scholar.sun.ac.za
Stellenbosch University https://scholar.sun.ac.za

16 | P a g e
The UN-Habitat (2010) indicates that many cities’ waste production data are unreliable,
as data are seldom captured due to inconsistencies in recording or because not all waste
are being accounted for, particularly that produced through informal activities or lost in
the system. However, there are cities with sound government systems with reliable data
through regular monitoring and capturing of weighbridge data at waste management
facilities. Low- and middle-income countries do not always have the necessary
measuring equipment and therefore waste is estimated based on the size of collection
vehicles (UN-Habitat, 2010).
It is evident that the types of municipal solid waste produced are similar throughout the
world. However, generation rates and proportions of waste materials generated vary
between countries and cities, typically based on the level of economic development
(Sufian & Bala, 2007). It is generally accepted that consumption patterns rise with
affluence. The dynamics that connect affluence and consumption patterns are discussed
in the next section.
2.3.2 Municipal solid waste generation
Resource management strategies start by strengthening awareness of natural limits of
materials and energy sources. This awareness was present in ancient times, but has
gradually been lost as communities became affluent and raw material and energy
become more affordable (UNEP, 2002). It is unlikely that the situation will change
unless better care of global resources is acquired. Resource management strategies
extend far beyond waste management, as municipal solid waste is a by-product of the
extraction of raw materials and energy. If manufacturing processes continue with the
current trajectory of ‘just extraction’ as opposed to changing the design of products,
resource conservation goals will never be met.
Gutberlet (2015) argues that local governments have limited power over consumptions
patterns, and that the concentration is mostly on deciding which are the most
appropriate waste management technologies and strategies to be implemented. It is with
this in mind that an understanding of waste generation patterns across the globe can be
gained. In general, there is a direct relationship between population and the amount of
domestic waste generated. As the population grows, so does waste; however,
Stellenbosch University https://scholar.sun.ac.za

17 | P a g e
consumption patterns also increase with a rise in living standards. Various studies have
suggested this relationship (Ahmad, 2012; Buenrostro, Bocco & Vence, 2001;
European Commission, 2010; Grazhdani, 2016; Suthar & Singh, 2015) and the
importance in determining the type of waste management system for an urban place.
Population and waste generation rates for the same cities discussed in Section 2.3.1 are
depicted in Table 2.3. It is notable that the high-income cities have higher generation
rates (kilograms per capita per day [kg/capita/day]) than middle- and low-income
countries.
Stellenbosch University https://scholar.sun.ac.za

18 | P a g e
Table 2.3: Waste generation for various income cities
Income category City Population Kilograms per capita Kilograms per household
Year Day Year Day
High Adelaide, Australia 1 089 728 490 1.3 1176 3.2
Low Nairobi, Kenya 4 000 000 219 0.6 1314 3.6
High Rotterdam, Netherlands 582 949 528 1.4 1030 2.8
High San Francisco, USA 835 364 609 1.7 1400 3.8
High Tompkins County, USA 101 136 577 1.6 1340 3.7
Low Delhi, India 13 850 507 184 0.5 938 2.6
High Varna, Bulgaria 313 983 435 1.2 1131 3.1
Low Moshi, Tanzania 183 520 338 0.9 1386 3.8
Source: Adapted from UN-Habitat (2010)
Stellenbosch University https://scholar.sun.ac.za
Stellenbosch University https://scholar.sun.ac.za

19 | P a g e
As developing countries develop, their generation rates also increase. These are
influenced by a change in consumption patterns fuelled by globalisation (Achankeng,
2003). Seasonal changes also have an effect on organic waste, as this changes over
seasons and different climatic conditions (Troschinetz & Mihelcic, 2009; UNEP, 2002).
2.4 Waste management
Many governments in developing countries are faced with deteriorating environmental
problems and health hazards, such as illegally dumped or uncollected waste
(Achankeng, 2003). Many of them are unable to deal with increasing amounts of waste
generated, as they are still vested in traditional approaches.
Wilson et al. (2013) allude that solutions for solid waste management in developing
countries need to be designed for the specific local circumstances and conditions. They
argue that ‘local solutions can work’, referring to a remote municipality in southwestern
Nepal, called Ghorahi, which has limited human and financial resources, but has a
strong vision and commitment with active participation of stakeholders (Wilson et al.,
2013). The municipality managed to develop a modern waste management facility
without foreign financial aid (Wilson et al., 2013). The facility includes a waste sorting
and recycling area, sanitary waste disposal with on-site leachate detection, collection
and treatment and a buffer zone. Geological studies were undertaken to identify the
most suitable site. The municipality convinced the Ministry of Local Development to
assist with funding for the construction of the waste processing and disposal facility
(Wilson et al., 2013). The facility has been in operation since 2005 and has a landfill
committee, which includes residents and key stakeholders, to monitor and ensure that
the facility is properly managed.
Phiri et al. (2012) describe the major constraints to waste management in developing
countries. Developing countries struggle with lack of funds and knowledge, which
places constraints on dealing with waste, while in developed countries such as Europe
and North America, the major constraint is the availability of land. In order to
implement effective interventions to manage waste better, the first step is to collect vital
data about the type of waste streams and generation rates in the city (Phiri et al., 2012).
Stellenbosch University https://scholar.sun.ac.za

20 | P a g e
The following sections explore traditional solid waste practices as well as ISWM
practices in both developing and developed countries.
2.4.1 Traditional municipal solid waste management
Historically, municipal solid waste has been viewed as an undesirable product to be
disposed of in open and uncontrolled dumps and landfills (Engledow, 2007; Inghels &
Dullaert, 2010; UNEP, 2002). The practice of open dumping is cheap and requires no
planning (Sufian & Bala, 2007), but degrades the environment, undermines people’s
health and quality of life, and is a breeding ground for vectors of disease. Traditional
waste management, also regarded as a reductionist approach, only considers waste
generation, collection and disposal (Hyman, 2011). It limits its understanding of the
waste system to a set of networked infrastructures that convey waste (Hyman, 2011).
However, while there is a move towards the recovery of waste, open dumps and burning
of waste are still the most preferred methods of waste disposal in many countries (UN-
Habitat, 2010).
The recovery of waste varies between developed and developing countries. Developed
countries tend to rely on expensive incineration and waste-to-energy technologies to
recover their waste, while developing countries have active informal sectors with
recycling rates that are comparable to that of developed countries, but at no cost to
municipalities, thereby offering huge savings in terms of the provision of waste
management services (UN-Habitat, 2010).
Informal recycling provides a livelihood to many people living in poverty in cities. The
promotion of the informal waste recycling sector is important in reducing the amount
of waste collected and disposed of by municipalities (Engledow, 2007). Promoting this
important well-being strategy for waste pickers assists them to make an income from
collecting and selling recyclables. Global initiatives, such as in the city of Curitiba in
Brazil, with a rewards-based disposal system to overcome social and environmental
challenges in the city, have received many accolades. Gratz (2013) describes this
initiative as follows:
The operator is undoubtedly poor but rather than dependent on sheer charity, this
hard worker is one of approximately 10,000 Curitibanos who collect trash, deposit
Stellenbosch University https://scholar.sun.ac.za
21 | P a g e
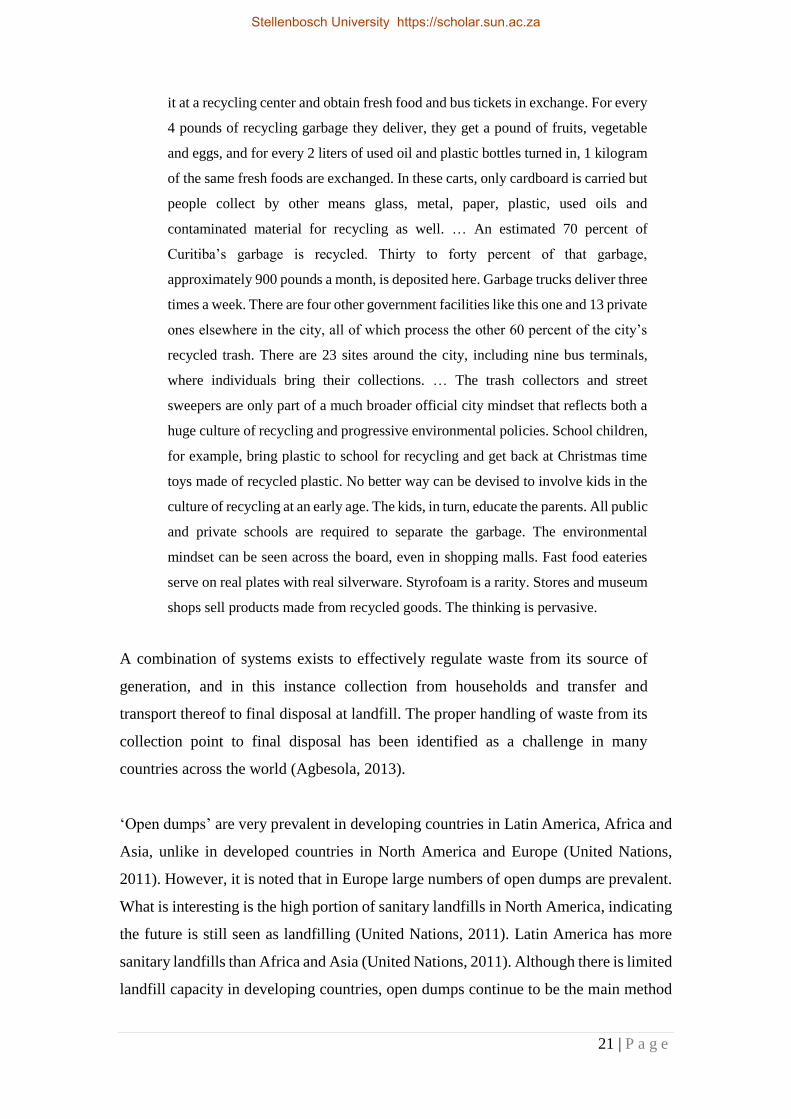
it at a recycling center and obtain fresh food and bus tickets in exchange. For every
4 pounds of recycling garbage they deliver, they get a pound of fruits, vegetable
and eggs, and for every 2 liters of used oil and plastic bottles turned in, 1 kilogram
of the same fresh foods are exchanged. In these carts, only cardboard is carried but
people collect by other means glass, metal, paper, plastic, used oils and
contaminated material for recycling as well. … An estimated 70 percent of
Curitiba’s garbage is recycled. Thirty to forty percent of that garbage,
approximately 900 pounds a month, is deposited here. Garbage trucks deliver three
times a week. There are four other government facilities like this one and 13 private
ones elsewhere in the city, all of which process the other 60 percent of the city’s
recycled trash. There are 23 sites around the city, including nine bus terminals,
where individuals bring their collections. … The trash collectors and street
sweepers are only part of a much broader official city mindset that reflects both a
huge culture of recycling and progressive environmental policies. School children,
for example, bring plastic to school for recycling and get back at Christmas time
toys made of recycled plastic. No better way can be devised to involve kids in the
culture of recycling at an early age. The kids, in turn, educate the parents. All public
and private schools are required to separate the garbage. The environmental
mindset can be seen across the board, even in shopping malls. Fast food eateries
serve on real plates with real silverware. Styrofoam is a rarity. Stores and museum
shops sell products made from recycled goods. The thinking is pervasive.
A combination of systems exists to effectively regulate waste from its source of
generation, and in this instance collection from households and transfer and
transport thereof to final disposal at landfill. The proper handling of waste from its
collection point to final disposal has been identified as a challenge in many
countries across the world (Agbesola, 2013).
‘Open dumps’ are very prevalent in developing countries in Latin America, Africa and
Asia, unlike in developed countries in North America and Europe (United Nations,
2011). However, it is noted that in Europe large numbers of open dumps are prevalent.
What is interesting is the high portion of sanitary landfills in North America, indicating
the future is still seen as landfilling (United Nations, 2011). Latin America has more
sanitary landfills than Africa and Asia (United Nations, 2011). Although there is limited
landfill capacity in developing countries, open dumps continue to be the main method
Stellenbosch University https://scholar.sun.ac.za

22 | P a g e
of waste disposal, as collection of waste alone takes up 80 to 90% of solid waste
management budgets (United Nations, 2011). Also, in developing countries, despite at
least 20 to 50% of the recurring municipal budgets being spent on solid waste
management in municipal jurisdictions, only approximately 50% of the urban
population is covered under these services (United Nations, 2011).
Seadon (2010) provides a few examples of traditional practices in Auckland, New
Zealand, which are also common in other countries, as follows:
More effort spent on conducting annual waste characterisation surveys when
waste management practices do not change
An increase of waste generation, resulting in undervaluing the side effects of
interventions (e.g. upgrading from 40-litre to 240-litre collection containers)
Short-term goals instead of long-term sustainability thinking (waste information
on quantities of waste recycled rather than focusing on change in packaging
design)
Underestimation of time lags between intervention and effects (waste strategy
was reviewed for progress in 2004, a year after institution, and again in 2006)
Reliance on linear extrapolation of waste data over the short term and long term.
Seadon (2010) maintains that as waste management is a complex system, the above are
common shortfalls and should not be ignored.
Waste management forms an integral part within the element of environmental order,
one of the three pillars of sustainable development (Mesjasz-Lech, 2014). A paradigm
shift is necessary to achieve ISWM to effectively manage waste. However, there is a
general agreement on best practices (Leao et al., 2001) and developed countries’
increased recognition that waste is a resource with economic value (Inghels & Dullaert,
2010).
Stellenbosch University https://scholar.sun.ac.za

23 | P a g e
2.4.2 Integrated sustainable waste management
The first decade of the 21st century saw the concept of sustainable waste management
becoming the norm in developed countries. Wilson et al. (2013) studied the term
‘sustainable waste management’ in a variety of contexts and Table 2.4 indicates two
thematic uses of this term.
Table 2.4: Different uses of the term sustainable waste management
Thematic use Description Selected references
Integrated (solid)
waste management
(using the waste
management
hierarchy)
Integrating solid waste management according
to principles of the waste hierarchy, combining
waste prevention or reduction, reuse,
recycling/composting, energy recovery and
disposal, or discussing the role of particular
technological solutions
Smith (1990); Johnke
(1992), USEPA (2002);
Heimlich et al. (2005)
Memon (2010); Consonni
et al. (2011)
Integrated sustainable
waste management
(ISWM)
Integrating across three dimensions, all the
elements of the waste management hierarchy,
all the stakeholders involved and all the
‘aspects’ of the ‘enabling environment’
(political, institutional, social, financial,
economic and technical). Used particularly in
developing countries
Schübeler et al. (1996);
Van de Klundert and
Anschütz (2001);
Anschütz et al. (2004);
Scheinberg et al. (201b)
Source: Wilson et al. (2013)
The term ‘integrated’ found its origin during the 1970s (Murray et al., 1971; Tobin &
Myers, 1974, as cited in Wilson et al., 2013) and has since been broadly accepted until
it became standard in the mid-2000s. Wilson et al. (2013) note that the terms
‘integrated’ ‘waste’ and ‘management’ have been used in at least 244 published journal
papers by March 2012. This implies addressing all of the levels of the waste
management hierarchy, recognising that waste is not a homogeneous mass but rather a
mix of different material that should be treated differently, that is, some materials
should not be produced at all, while others should be reduced, reused and recycled
(Gertsakis & Lewis, 2003). Such a system involves a systems approach, discussed later
in Section 2.7.
IWM follows the principles of the waste management hierarchy, whereas ISWM
integrates across three dimensions, namely the scope in the economic context, the actors
in the political context and how the socio-cultural context is being incorporated. ISWM
is essential to the effective management of waste (Marshall & Farahbakhsh, 2013).
However, it is a complex task for governments and institutions in developing countries,
Stellenbosch University https://scholar.sun.ac.za

24 | P a g e
especially those with the absence of strong political drivers, causing political instability
compounded by non-functioning policies due to weak institutional structures that are
already overburdened with increasing demands for services due to population explosion
(Marshall & Farahbakhsh, 2013).
As an illustration, the World Bank, which supports international funding to many
developing countries had a few unsuccessful projects in the 1990s. To mention a few
are projects in the Philippines, Mexico and Sri Lanka, which received financial aid for
various projects. Due to weak institutions, governance issues and a lack of financial
capacity to sustain implemented projects, when funding was expended, many projects
came to a halt to due to continuous capital and operational expenditure required
(Marshall & Farahbakhsh, 2013). The traditional waste management approach is not
designed to handle complexity (discussed in Section 2.4.1). The generation of waste
and the collection and disposal thereof are considered to operate independently, even
though they are interconnected and influenced by one another (Marshall &
Farahbakhsh, 2013).
2.4.3 The waste management hierarchy
All the principles of the waste management hierarchy are addressed in IWM and ISWM
practices, as stated in Section 2.4.2 Waste management practices in the waste
management hierarchy are arranged in descending order of priority and are prioritised,
with waste avoidance and reduction receiving the highest priority and treatment and
disposal seen as the least desired process in the hierarchy (see Figure 2.4).
Stellenbosch University https://scholar.sun.ac.za

25 | P a g e
Figure 2.4: Waste management hierarchy
Source: Adapted from DEA (2011)
The most desired practice is waste avoidance and reduction, focusing on changing the
packaging design, resulting in fewer inputs of materials, as opposed to heavy reliance
on quantities of waste recycled. The next stage is the reuse of waste by removing the
material from the waste stream and using it as a secondary material in a new process.
Recycling follows next, which is also the stage in which most municipalities are
actively involved. Here items are separated from the waste stream such as kerbside
collection of recyclables and are further sent for processing. Recovery involves
reclaiming components of an item or using the waste as fuel. The least desired option
is disposal of waste that cannot be reused, recycled or recovered (DEA, 2011). The
ultimate goal is to shift away from landfilling and to use waste as a resource.
2.4.4 Municipal waste management as a complex system
A broad definition for a system is “any object which has some action to perform and is
dependent on a number of objects called entities” (Singh, 2009:1). Waste is complex
and dynamic by nature, as it is dependent on available technology for safe removal and
disposal, as well as social and economic factors, and is therefore seen as a complex
system. Waste collection, treatment and disposal can be seen as entities of the waste
management system. Each entity has its own properties or attributes, for example the
safe collection and removal of waste ensure that waste is collected timeously and
therefore does not impact negatively on the environment and the health of people. The
collection, treatment and disposal of waste in itself is a complete system; however, if
Treatment & disposal
Recovery
Recycling
Reuse
Waste avoidance & reduction
Stellenbosch University https://scholar.sun.ac.za

26 | P a g e
the two are combined, joined in some interdependence, then the three systems become
a large system. An example of these various elements is shown in Figure 2.5.
Stellenbosch University https://scholar.sun.ac.za

27 | P a g e
Figure 2.5: Elements of an integrated sustainable waste system
Source: UN-Habitat (2010)
NGOs = non-governmental
organisations
CBOs = community-based
organisations
Stellenbosch University https://scholar.sun.ac.za
Stellenbosch University https://scholar.sun.ac.za

28 | P a g e
According to Marshall and Farahbakhsh (2013), developing countries have applied
various analysis tools to analyse existing solid waste management systems since the
1960s. However, these systems were particular and only focused on the economic and
environmental aspects of solid waste management (Marshall & Farahbakhsh, 2013).
Pires, Martinho and Chang (2011) state that integrated sustainable solid waste
management practices at stages from planning, design, operation and decommissioning
are necessary. This would allow government and industry to meet “common needs of
waste management” by recycling and encouraging renewable energy in order to
preserve the natural ecosystem (Pires et al., 2011:1034). This can be achieved by
analysing the system as a whole, as the phases are interrelated and a development in
one area affects activities in another area (Pires et al., 2011; UNEP, 2005).
Sustainable management of municipal solid waste has increasingly become a necessity
in all phases of the system, from planning to design, collection services, transfer and
transportation, to the operation and decommissioning of landfills (Seadon, 2010). This
is necessary in order to meet the sustainability goals in the future. In order to achieve
these goals, the technical and non-technical components of a sustainable waste
management system should be analysed as a whole, as traditional approaches lack long-
term thinking and flexibility (Seadon, 2010).
2.4.5 Municipal solid waste: Recovery of recyclables
As stated earlier, recycling is one form of ISWM and also ranked high in the waste
management hierarchy (Figure 2.5). This section explores recovery rates in various
developing countries as well as the factors influencing recycling as one element of
ISWM.
Troschinetz and Mihelcic (2009) identified various recovery rates from 13 developing
countries, as shown in Table 2.5. Troschinetz and Mihelcic (2009) note that there are
at least 12 factors that influence recycling as one element in achieving sustainable waste
management in developing countries: (i) presence of policies, (ii) financial
sustainability, (iii) understanding of the composition of waste, (iv) efficient waste
collection services, (v) awareness and education, (vi) socio-economic profiles of
households that link human behaviour to handling of waste, (vii) effective public–
private partnerships, (viii) trained personnel, (ix) long term integrated waste
Stellenbosch University https://scholar.sun.ac.za

29 | P a g e
management plan, (x) understanding of the local recycling market, (xi) technology and
labour force and (xii) availability of land (Troschinetz & Mihelcic, 2009). All of the
above factors are equally important to sustain recycling over the long term.
Table 2.5: Municipal solid waste: Recyclables recovered in 13 developing
countries
Country Municipal solid waste recovery (%)
Overall Paper Plastic Glass Metal
Botswana x 90 65
Brazil 41 30 20a 20b 49c
China 7–10 x x
Guyana x xb x
India x
Indonesia x x x x x
Iran x x x
Mongolia x
Nepal 5
Philippines 13 x x x x
Sri Lanka x x x x x
Thailand 15 28 14 18 39
Turkey x 36 30 25 30
Vietnam 13–20 x x x x
Percentage numeric values provide quantitative recovery rates.
X symbol (x) qualitatively signifies recycling activity occurs
either overall or for a particular material. a Recovery of plastic beverage bottles only b Recovery of containers only c Recovery of aluminium cans only
Source: Troschinetz and Mihelcic (2009)
In Table 2.5 the “x” refers to the existence of recyclable material recovery in a country
and the numbers presented are the percentage material recovery rates (Troschinetz &
Mihelcic, 2009). It is clear from Table 2.5 that the markets for various recyclables are
not the same in all the developing countries listed. For example, paper and glass are not
being recovered for recycling in Botswana, whereas paper and glass recycling is very
prevalent in countries such as Brazil, Turkey and Thailand (Troschinetz & Mihelcic,
2009).
Stellenbosch University https://scholar.sun.ac.za

30 | P a g e
2.5 Drivers of waste flows
The term ‘driver’ or ‘driving force’ is a “human activity that is generated to satisfy a
need” (UNEP, 2009:57). ‘Drivers’ are activities that fulfil the needs for shelter, food
and water, but also activities to satisfy the need for mobility, entertainment and culture
(UNEP, 2009). The term ‘driver’ or ‘driving force’ in the context of municipal solid
waste management refers to macroeconomic development that causes or drives changes
in waste generation. The UNEP (2009) states that typical drivers in waste generation
are population growth, industrialisation (resource extraction and processing),
urbanisation and lack of adequate infrastructure, whereas intermittent driving forces are
activities such as events and tourism (UNEP, 2009).
Various authors attribute the changes or trends in waste generation to numerous factors.
A concise overview, to the best of the researcher’s knowledge, of the use of the term
‘trends in waste generation’ or ‘changes in waste generation’, in a variety of contexts,
is outlined below:
There seems to be a strong relationship between contributing factors of waste
generation such as economic activities, population growth, household income
and number of people per household. Therefore, population growth affects
household income and household income impacts waste generation per person,
and a higher-income household tends to produce higher amounts of waste.
Conversely, higher-income households also tend to achieve higher recycling
participation rates (Dyson & Chang, 2005).
Socio-economic drivers of waste generation are gross domestic product (GDP),
population size, average household size, degree of urbanisation, private
consumption, government consumption, population consumption and
employment (OECD, 2002).
Urban population, GDP and consumption levels seem to have a strong
correlation with waste generation. The consumption levels of a population have
a close relationship with waste generation. Higher consumption levels of
residents generate more municipal solid waste, therefore the consumption levels
Stellenbosch University https://scholar.sun.ac.za

31 | P a g e
of high-income residents affect generation quantity (Wei, Xue, Yin & Ni ,
2013).
Population growth and rapid changes in lifestyle change the composition of
waste and increase waste quantities (Oyoo, Leemand & Mol, 2011).
Population density is likely to positively impact on waste generation (Mazzanti
& Zoboli, 2008).
Population growth gives rise to an increase in waste production (Lea et al.,
2004).
The improvement of the living standards of residents leads to large municipal
waste outputs (Lin & Ying, 2013).
Changes in lifestyle mean that municipal waste increases rapidly, and the
composition of waste also changes (Ahmad, 2012).
From the above literature it is evident that there are varying views on household
consumption as a driver of municipal waste generation, for example population density
gives rise to an increase in waste production and generation, whereas affluence leads to
large waste outputs. Furthermore, Mazzanti and Zoboli (2008) categorised three drivers
of waste, namely economic, socio-economic and political drivers.
Typical economic drivers are consumption per capita and share research and
development spending in GDP. Socio-economic drivers are population density, urban
population degree and household size. Political drivers include legislation that
promotes waste prevention such as the waste management hierarchy, where waste
prevention is the most desired option; however, source separation and landfill diversion
policies have dominated the field (Mazzanti & Zoboli, 2008). Figure 2.6 summarises
the various drivers discussed above.
Stellenbosch University https://scholar.sun.ac.za

32 | P a g e
Figure 2.6: Drivers of municipal solid waste flows
Source: Compiled by researcher
As a result of the various drivers of waste generation, constant pressure is placed on
municipalities to provide additional services as cities expand. Although various
countries and municipalities have made significant strides to improve waste
management practices, improvement is still needed to provide a waste collection
service to communities. The United Nations Environment Programme (UNEP)
developed a framework to analyse and identify gaps in the current system in order for
the system to work sustainably over the long term (Wilson et al., 2013), represented in
Figure 2.7.
This first triangle in Figure 2.7 comprises three key physical components of a waste
management system, linked to key drivers. The physical components are:
waste collection services that are driven by public health;
environmentally sound disposal through protection of the environment during
treatment and disposal; and
the 3Rs of the waste management hierarchy, closing the loop and returning
organic and inorganic waste to beneficial use (Wilson et al., 2013).
The second triangle focuses on three governance aspects that need to be addressed to
deliver a well-functioning system. The system as a whole is required to:
be inclusive by extending to stakeholders to contribute as users and providers;
rest on a base of sound institutions and proactive policies; and
be financially sustainable, cost-effective and affordable (Wilson et al., 2013).
Economic drivers
• Private consumption
• Government consumption
• Economic activity
• Household income
• Improve in living standards
• Employment
• Changing lifestyle
Socio-economic drivers
• Urban population
• Population growth
• People per household
Political drivers
• Waste management hierarchy
Stellenbosch University https://scholar.sun.ac.za

33 | P a g e
Figure 2.7: Two triangles representation
Source: Adapted from Wilson et al. (2013)
The physical element discusses the three primary driving forces for the development of
an ISWM system, namely waste collection, waste disposal and the reduction, reuse and
recycling of waste (UN-Habitat, 2010). This element provides the physical basis for the
governance aspects to be addressed for the system to work sustainably over the long
term.
2.6 Consequences of poor waste management on human and
environmental health
The undesirable consequences of poor waste management practices that fail to tap into
the resource value of waste affect air, soil and water quality (Alam & Ahmade, 2013).
Uncontrolled disposal and burning of waste contribute significantly to air pollution
(Alam & Ahmade, 2013; Karija & Lukaw, 2013; UN-Habitat, 2010).
The disposal of biodegradable waste to landfill leads to anthropogenic greenhouse gas
emissions from the anaerobic decomposition of organic waste (Intharathirat et al., 2015;
Karija & Lukaw, 2013; UN-Habitat, 2010) and forms leachate, which in turn
contaminates surface and groundwater. Public health is affected by uncollected waste
in dense informal settlements where waste is illegally dumped, causes offensive smells,
clogs up drains and causes flooding, which attracts vectors and rodents and leads to the
Physical Governance
Public health
Collection
Environment
Disposal
Sound institutions
& proactive policies
Financial
sustainability
Inclusivity
User and Provider
Economic value/
Resource depletion
3Rs (Reduce, Reuse,
Recycle)
Stellenbosch University https://scholar.sun.ac.za

34 | P a g e
spreading of waterborne diseases, which may lead to child diseases and mortality
(Intharathirat et al., 2015; Karija & Lukaw, 2013; UN-Habitat, 2010).
Sound waste management contributes towards the well-being of people and those
working in the waste sector (UN-Habitat, 2010). Controlled disposal by means of
sanitary landfills, well-established collection areas and increased collection coverage,
where disposal is still open dumping, needs to be adopted to suit the local conditions of
the city and improve overall sanitation and public health.
2.7 Modelling urban waste
Forecasting waste generation trends with accuracy over time is key to successful waste
management planning (Kaushal, Varghese & Chabukdhara, 2015). However, Dyson
and Chang (2005) argue that this is a challenge in fast-growing cities as a result of
population growth, economic development and changes in employment and household
sizes and the impact of waste recycling.
Reliable models are needed to predict the impacts growing cities have on waste
management (Dyson & Chang, 2005). Intharathirat et al. (2015) noted that failure to
obtain reliable historical waste generation data may lead to difficulties in developing
accurate forecasting models, some of which are increased environmental impacts, over-
and under-capacity estimations of waste treatment facilities and irrelevant policies
(Intharathirat et al., 2015).
Rimaityte et al. (2012) noted that the process of forecasting waste is often problematic,
as it is usually aggravated by rapidly changing parameters of waste management
systems, especially in areas of rapid economic development, relating to affluence and
seasonal impacts. Factors affecting forecasting of waste are the following:
Availability and quality of data, including waste data and socio-economic and
demographic indicators
Type of data, whether random or continuous
Relationships of various parameters of waste generation
Changes to be expected in the waste management field.
Stellenbosch University https://scholar.sun.ac.za

35 | P a g e
Dyson and Chang (2005) argue that trends in the economy, production of waste, growth
in population and recycling in terms of municipal solid waste generation are useful
advances to practise solid waste management and therefore different relation tendencies
exist. In order to identify the most appropriate methodology for this study, by
understanding the various influencing factors that affect waste flows, various modelling
methodologies were examined. Regression methods have been widely used to forecast
waste generation due to their simple algorithms; however, this type of analysis cannot
learn from new data or adapt to changing situations (Intharathirat et al., 2015).
Escalante (2012) points out that the lack of adequate data and computational tools to
assist decision makers has previously limited the potential for forward planning. As a
result, attention has been drawn to different ways of analysing data, such as linear
spreadsheet analysis, process engineering models, material flow analysis and lifecycle
assessments, and in recent years the application of system dynamics modelling
(Escalante, 2012). Linear spreadsheet analysis is a time-series method that uses only
waste generation quantities and their corresponding time; however, this method is not
convincing as to why future quantities will follow the same pattern as historical
quantities (Wei, Xue, Yin & Ni , 2013).
Another method is the factor model, which uses factors such as total population, GDP,
consumer price index and household size (Dyson & Chang, 2005; Wei, Xue, Yin & Ni
, 2013). This method is more reliable and more common than the time-serious method,
especially for long-term forecasts. However, with this model it is difficult to establish
which factor has an absolute correlation with the generation quantities as well as the
exact mathematical correlation. Furthermore, the selected factors need to be known
before forecasting of waste generation can be done (Wei, Xue, Yin & Ni , 2013). With
these limitations, system dynamics modelling was the preferred method for this study
because it allows to capture the dynamic behaviour that relates to waste management.
System dynamics provides a set of conceptual tools concerned with the behaviour and
structure of complex systems and is aimed at solving important and dynamic real world
problems over time (Sterman, 2000). System dynamics modelling has been successfully
applied in strategic and operational decision making in businesses (Maani & Cavana,
Stellenbosch University https://scholar.sun.ac.za

36 | P a g e
2007) and addressing major problems associated with assessing future scenarios
(Kollikkathara, Feng & Yu, 2010), which the linear and static methods lack.
System dynamics can be used in two ways (Coyle, 1996). It can be used qualitatively
to portray conceptual models as an aid to thinking and understanding. The conceptual
models can then be turned into a mathematical model for quantitative simulation and
optimisation to support policy design (Coyle, 1996). Various authors have indicated
various phases to be followed in system dynamics, ranging from three (e.g.
Wolstenholme, 1990) to eight (e.g. Richardson and Pugh, 1981) phases, as shown in
Table 2.6.
Table 2.6: System dynamics modelling process across the typical literature
Randers (1980) Richardson and
Pugh (1981)
Roberts et al.
(1983)
Wolstenholme
(1990)
Sterman
(2000)
Conceptualisation Problem
definition
Problem
definition
Diagram
construction and
analysis
Problem
articulation
System
conceptualisation
System
conceptualisation
Dynamic
hypothesis
Formulation Model
formulation
Model
representation
Simulation phase
(Stage 1)
Formulation
Testing Analysis of model
behaviour
Model behaviour Testing
Model evaluation Model evaluation
Implementation Policy analysis Policy analysis
and model use
Simulation phase
(Stage 2)
Policy
formulation and
evaluation
Model use
Source: Luna-Reyes and Andersen (2003)
Following Sterman's (2000) modelling phases, Step 1 recognises the problem to be
addressed and asks the question ‘Who cares and why?’; Step 2 formulates a dynamic
hypothesis about the cause of the problem, often using ‘causal loop diagrams’ or a
‘stock and flow’ map; Step 3 entails quantitative analysis and formulates a simulation
model to test the dynamic hypothesis and is ultimately the most important stage in
understanding the problem better; Step 4 involves testing the model until satisfied with
its suitability for the purpose; and Step 5 formulates and evaluates policies for
Stellenbosch University https://scholar.sun.ac.za

37 | P a g e
improvement based on the quantitative analysis. The different steps entail feedback
processes and go through continuous iteration of questioning, testing and revision
(Sterman, 2000).
According to Coyle (1996), it is sometimes practical to achieve desired understanding
during qualitative analysis (steps 1 and 2) and therefore there is no need to continue
with steps 3, 4 and 5. However, Coyle (1996) suggests that if qualitative analysis does
not produce enough insight into the problem at hand, it is essential to proceed with a
simulation model. Sterman (2000:37) is however of a different view and states that
simulation is essential, arguing that …
… most problem structuring methods yield qualitative models showing causal
relationships but omitting the parameters, functional forms, external inputs, and
initial conditions needed to fully specify and test the model. Regardless of the form
of the model or technique used, the result of the elicitation and mapping process is
never more than a set of causal attributions, initial hypotheses about the structure
of a system, which must then be tested.
Davies, Musango and Brent (2016) are of a similar view to that of Sterman (2000), but
argue for the use of qualitative analysis in situations where it is difficult and sometimes
unattainable to quantify large numbers of soft variables.
System dynamics modelling is a powerful method to address the structural and dynamic
complexity associated with waste management, as it accounts for feedbacks,
accumulations, delays and non-linearities within a system (Escalante, 2012). Especially
because system dynamics enables the representation of human agency and decision
making in complex systems, its use in waste management planning can allow making
the jump from the evaluation of normative statements (i.e. optimal strategies) to the
testing of the viability and likelihood of policy implementation (Escalante, 2012).
Waste management systems over a long period, as was the case in this study, could shift
due to a possible change in collection methods. System dynamics therefore offers
interesting modelling approaches, as it can model the dynamic behaviour of waste and
its various processes and actors over time (Inghels & Dullaert, 2010). System dynamics
Stellenbosch University https://scholar.sun.ac.za

38 | P a g e
has been used widely in the waste management field. Table 2.7 provides a synopsis of
various studies that have utilised system dynamics and the key aspects addressed in
each study.
Stellenbosch University https://scholar.sun.ac.za

39 | P a g e
Table 2.7: Various applications of system dynamics modelling in waste management
Description Key aspects Reference
System dynamics modelling of urban solid waste
management system
Developed a theoretical framework to examine urban solid waste generation and its
management system in Dhaka city
Sufian and Bala (2007)
Evaluation of municipal solid waste generation,
landfill capacity and related cost management
issues
Developed a system dynamics model for municipal solid waste management, which
consisted of a landfill module, a separate collection sector and the cost of policy
options
Kollikkathara et al. (2010)
Application of system dynamics and fuzzy logic to
forecasting of municipal solid waste
Examined factors such as environmental behaviour, recycling, treatment price,
collected waste and regulation
Karavezyris, Timpe and
Marzi (2002)
Forecasting of municipal solid waste generation in
a fast-growing urban region with system dynamics
modelling
Examined the driving factors in a generation/service centre, which include total
income per service area, people per household, historical amounts of waste
generated and population
Dyson and Chang (2005)
A system dynamics modelling of municipal solid
waste management systems in Delhi
A system dynamics model for the existing municipal solid waste management
system and for the proposed solid waste management system
Ahmad (2012)
Systems approaches to integrated solid waste
management in developing countries
A review that demonstrates the importance of founding new solid waste
management approaches for developing country contexts in post-normal science
and complex adaptive system thinking.
Marshall and Farahbakhsh
(2013)
Stellenbosch University https://scholar.sun.ac.za
Stellenbosch University https://scholar.sun.ac.za

40 | P a g e
Description Key aspects Reference
Application of system dynamics for municipal
waste management in China: a case study of
Beijing
System analysis that included a waste discharge system, waste administration
system and waste disposal system
Lin and Ying (2013)
Sustainable waste management systems Highlights the following: waste management as a complex system, the complexity
of waste management, elements of a sustainable waste management system,
implementing a systems approach to waste management, an integrated approach to
waste management systems and sustainable societies
Seadon (2010)
Source: Compiled by researcher
Stellenbosch University https://scholar.sun.ac.za
Stellenbosch University https://scholar.sun.ac.za

41 | P a g e
Causal loop diagrams are the most commonly utilised tool for qualitative system
dynamics analysis and represents the feedback structure in a system. The building
blocks of causal loop diagrams are variables and arrows. The variables are often a
condition, situation, decision or action that can influence and be influenced by other
variables (Maani & Cavana, 2007). The arrows indicate the causal relationship between
two variables and are shown with either a positive polarity, growth generating, or a
negative polarity, goal seeking, and is shown as “+” or “-”, respectively (Coyle, 1996;
Maani & Cavana, 2007). Figure 2.8 illustrates a basic causal loop diagram of population
dynamics.
Figure 2.8: Example of a population causal loop diagram
Source: Adapted from Maani and Cavana (2007)
The causal loop diagram also shows the polarity link. If an increase (decrease) in one
variable causes an increase (decrease) in the other variable, the polarity link is “+”
because they move in the same direction of change, as illustrated by the polarity link
between population and births in Figure 2.8. If an increase (decrease) in one variable
results in a decrease (increase) in another variable, then the polarity link is “-” because
they move in the opposite direction of change, as illustrated by the polarity link between
deaths and population in Figure 2.8. Further, the two types of feedback loops, either a
reinforcing loop, symbolised by “R” or “+”, or a balancing loop, symbolised by “B” or
“-”, are also indicated in a causal loop diagram, as illustrated in Figure 2.8.
2.8 Summary
This chapter discussed the importance of recognising the problem of waste at both a
global and a local scale, contextualised in both developed and developing countries.
The undesirable consequences of traditional waste management practices fail to tap into
the resource value of waste. Instead, ISWM practices are necessary. The waste
Population DeathsBirths
++
+R B
-
Stellenbosch University https://scholar.sun.ac.za

42 | P a g e
management hierarchy was described as part of this approach. Some countries have
made significant strides towards achieving ISWM practices by ‘closing the loop’ and
using waste as a resource in order to safeguard the environment for future generations.
A review of various methods in modelling future waste flows was undertaken and the
utilisation of system dynamics, by means of a causal loop diagram, was argued for as
an essential step in planning a waste management system.
The next chapter explains the research methodology utilised in this study.
Stellenbosch University https://scholar.sun.ac.za

43 | P a g e
Chapter 3: Research design and methodology
3.1 Introduction
The key objective of this study was to explore the dynamic factors influencing future
domestic flows in the City of Cape Town. By understanding these factors, drivers of
waste flows and solid waste management practices in developed and developing
countries were examined. This chapter describes the research design, methodology and
methods applied to answer the research problem and objectives.
3.2 Research design
According to Mahammad and Jalil (2013:6), research design refers to the “logical
structure of inquiry. It articulates what data is required, from whom, and how it is going
to answer the research question”. Furthermore, Bryman and Bell (2014:80) state that a
research design “provides a framework for the collection and analysis of data” and
further state that “a choice of research design reflects decisions about the priority being
given to a range of dimensions of the research process”.
Bryman and Bell (2014) outline five different research designs, namely i) experimental
design, ii) cross-sectional design, iii) longitudinal design, iv) case study design and v)
comparative design. This leads to the question of what information needs to be collected
to answer the research problem, which ultimately leads to the choice of methods and
may include whether qualitative or quantitative data are required, or a mix of the two
methods.
The choice of research design and methods was guided by the specific research
objectives. This study utilised a case study design and qualitative research strategies.
Case study design is an in-depth study of one or more cases and is concerned with the
complexity and particular nature of the case (Bryman & Bell, 2014). Therefore, case
study design was deemed suitable to this study, as it focused on solid waste
management practices in the City of Cape Town. Qualitative research strategies, which
ask ‘why’ and ‘for what reason’ something occurs, were employed to obtain quality
data (cf. Bryman & Bell, 2014).
Stellenbosch University https://scholar.sun.ac.za

44 | P a g e
Figure 3.1 depicts the research design followed to consider the research problem and
the research objectives.
The objectives of this study were to:
RESEARCH PROBLEM
1. Increase in waste generated in the City of Cape Town.
2. Additional landfill airspace is needed to the already dwindling available landfill capacity
RESEARCH OBJECTIVE 1
Examine the drivers of waste flows in the City of Cape Town
RESEARCH OBJECTIVE 2
Examine existing solid waste management practices in the City of Cape Town
RESEARCH OBJECTIVE 3
Explore dynamic factors influencing future domestic waste flows in the City of
Cape Town
Figure 3.1: Research strategy
Source: Compiled by researcher
Stellenbosch University https://scholar.sun.ac.za

45 | P a g e
3.3 Research methodology
Research methods are techniques for collecting data (Bryman & Bell, 2014). Different
data-collection methods exist, such as i) sampling, ii) surveys and questionnaires, iii)
interviews and focus group discussions, iv) fieldwork, v) data gathering for secondary
analysis, vi) internet research and vii) content analysis (Bryman & Bell, 2014).
Secondary analysis, using documents as sources of data, was chosen as the preferred
method to collect data, as it not only saves cost and time, but also provides high-quality
data and more time for analysing data, such as public documents published by the
organisation in question (Bryman & Bell, 2014). The City of Cape Town, a local
government institution, provided a great deal of information for this study. All relevant
information, such as annual reports, external consultancy reports, theses and policy
statements, was obtained either via internet research or from the City of Cape Town’s
website (www.capetown.gov.za).
3.4 Research method
This section discusses the research methods and techniques applied in order to answer
the three research objectives. Various information techniques and tools were specific
to each research objective.
3.4.1 Research objective 1: Examine the drivers of waste flows in the City of Cape
Town
In order to achieve this objective, it was necessary to conduct a comprehensive
literature review, which provided insight into current key trends of waste flows in a
global context. As informed by the literature in Section 2.5, waste generation is
generally categorised into three groups, namely i) economic drivers, ii) socio-economic
drivers and iii) political drivers. These were therefore examined with reference to the
City of Cape Town. Secondary information was mainly utilised in examining these
three categories of waste generation in the context of the City of Cape Town due to the
limited information available on the City of Cape Town in peer-reviewed literature
Having established the three key waste flows drivers for the City of Cape Town, it was
deemed important to understand the state of solid waste management through the
Stellenbosch University https://scholar.sun.ac.za

46 | P a g e
ISWM framework of three physical systems and three governance aspects. This was
achieved in the second research objective.
3.4.2 Research objective 2: Examine existing solid waste management practices in
the City of Cape Town
The literature review conducted provided insight into historical and current waste
management practices in a global context. It was evident from the literature that
significant strides have been made globally to move from traditional waste management
practices towards ISWM that includes all the elements of the internationally adopted
waste management hierarchy. These were discussed in Section 2.4.3.
The ‘two triangles’ analytical framework for solid waste management in the world’s
cities (Wilson et al., 2013), shown in Figure 2.9, was used to examine the existing
trends and realities in the City of Cape Town. This framework has been used widely
and shows good work being done on solid waste by cities around the world, including
large and small, rich and poor cities. It examines what drives change in solid waste
management, how cities find local solutions and what seems to work best under
different circumstances (Wilson et al., 2013).
The physical elements of a solid waste management system are linked to public health,
waste resource management and environmental protection in order to address waste
management for an ISWM system to work sustainably in the long term. The governance
aspects entail inclusivity, sound institutions and proactive policies, and financial
sustainability, to be addressed to deliver a well-functioning system (Wilson et al.,
2013).
A basic instrument by means of a set of indicators, in relation to the drivers, was adopted
and used, as drawn from the City of Cape Town’s grey literature. A profile of the City
of Cape Town’s solid waste was examined against indicators, as outlined in Table 3.1.
An indicator shows how the City of Cape Town has addressed one of the drivers. It
should be noted that integrated solid waste management is a process and that the
indicators only reflect a snapshot in time (Wilson et al., 2013).
Stellenbosch University https://scholar.sun.ac.za

47 | P a g e
Table 3.1: Overview of indicators
Physical elements
Indicator name Indicator Driver
Collection
The percentage of households that have access to
waste collection services
Public health
Involves keeping waste and associated vectors from waste
accumulating in the city
Controlled disposal
The percentage of waste that is being landfilled with
basic controls or any treatment system
Public health in combination with environmental protection
Involves the controlled disposal of waste that ends up at landfill. Where
waste is managed through modernisation, the protection of site staff and
the prevention of water, soil and air pollution is well managed
Environmental protection
Proportion of waste that enters the waste system and is further
processed
Illegal dumping of waste in open spaces and watercourses
Resource management
The percentage of waste collected by the formal and
informal sector or disposed of by households at drop-
off facilities
The percentage of waste that is prevented and
recovered before disposal due to valorisation
Recovery percentage or recycling rate
Stellenbosch University https://scholar.sun.ac.za
Stellenbosch University https://scholar.sun.ac.za

48 | P a g e
Governance aspects
Indicator name Indicator Driver
Inclusivity
The degree of user and provider inclusivity in policy
formation, planning, implementation and evaluation
of these services
User inclusivity: The degree to which stakeholders are included in the
planning, policy formation and implementation process System
performance and the extent to which it serves all users equitably and
according to their needs and preferences
Provider inclusivity: The extent to which the economic niches and
service delivery and valorisation are open and accessible to non-state
actors, the private and informal sectors and community based-
organisations
The degree to which the authority allows and enables non-state
providers to be integrated within the overall solid waste collection,
transfer, materials recovery and disposal strategy
Financial sustainability
The percentage of households that use and pay for
waste collection services
Population using and paying for collection as percentage of total
population and subsidised systems
Institutional coherence
The ability of the local governing entity to control
the overall budget for solid waste management
The extent to which the institution rests on sound institutions and
proactive policies
Source: Adapted from UN-Habitat (2010)
Stellenbosch University https://scholar.sun.ac.za
Stellenbosch University https://scholar.sun.ac.za

49 | P a g e
3.4.3 Research objective 3: Explore dynamic factors influencing future domestic
waste flows in the City of Cape Town
An analysis of system dynamics was conducted, as described in Section 2.7, with a
specific focus on qualitative analysis using causal loop diagrams. The third research
objective entailed developing a causal loop diagram to explore the dynamic factors
influencing future domestic waste flows in the City of Cape Town. The different factors
were identified in objectives 1 and 2. The causal loop diagrams were drawn using
Vensim® software.
3.5 Summary
This chapter presented the research methodology utilised in the study. The literature
review was utilised to achieve objectives 1 and 2. Objective 3 was achieved using
qualitative system dynamics, mainly causal loop diagrams, to provide insights into the
dynamic factors influencing waste flows in Cape Town. Chapter 4 presents the results
of the study.
Stellenbosch University https://scholar.sun.ac.za

50 | P a g e
Chapter 4: Results
4.1 Introduction
This chapter presents the results of this study. The first section discusses the drivers of
waste flows in the City of Cape Town. The second section discusses solid waste
management practices in the City of Cape Town, while the third section discusses
factors influencing future domestic waste flows in the City of Cape Town.
The City of Cape Town, a metropolitan municipality, is situated in the southern
peninsula of the Western Cape province of South Africa (Figure 4.1) and covers an area
of approximately 2,445 km2. It is the economic hub and capital of the province as well
as the legislative capital of South Africa.
Figure 4.1: City of Cape Town metropolitan municipality
Source: www.capetown.gov.za
The City of Cape Town is divided into four solid waste management districts, namely
Impuma (615 km2), Tierberg (654 km2), Atlantic (726 km2) and Two Oceans (479 km2)
(Engledow, 2007). Each of these management districts are representative of a mix of
income suburbs (affluent communities to informal settlements) (Engledow, 2007).
Stellenbosch University https://scholar.sun.ac.za

51 | P a g e
4.2 Drivers of waste flows in the City of Cape Town
The identified three drivers of waste generation were broadly categorised into economic
drivers, socio-economic drivers and political drivers. From this, indicators were
identified that relate to each driver that are specifically relevant to the City of Cape
Town. The indicators for economic drivers were income (GDP) and employment, the
indicators for socio-economic drivers were population and household size, and the
indicators for political drivers were various legislation, ranging from national policies
to local government policies and by-laws. Each of these broad drivers with reference to
the City of Cape Town is discussed in the sections that follows.
4.2.1 Economic drivers of waste flows in the City of Cape Town
The literature review indicated a strong relationship between contributing factors of
waste generation such as GDP, private consumption, economic activity, household
income, improved living standards, employment and changing lifestyle (Dyson &
Chang, 2005; OECD, 2002; Wei et al., 2013). The indicators that relate to economic
drivers and relevant to the City of Cape Town are discussed below.
i. GDP
Cape Town is a fast-growing, emerging city and is one of the largest receivers of South
African and international migrants. It is estimated that 40% of the population growth in
Cape Town between 2001 and 2011 was from new arrivals from outside the Western
Cape. The GDP per capita and GDP per capita growth rates for Cape Town and South
Africa (2004–2014) are shown in Figure 4.2.
Stellenbosch University https://scholar.sun.ac.za

52 | P a g e
Figure 4.2: GDP and real GDP – South Africa and Cape Town for 2004–
2014
Source: City of Cape Town (2016b)
The positive growth in Cape Town’s GDP is that of population growth and also
increased productivity due to economies of scale and specialisation in the production
of goods and services. The services economy (finance and insurance) dominates in
Cape Town (City of Cape Town, 2016b).
ii. Employment
The majority of households (47%) fall in the low-income group (no income to R50 613
per annum), whereas a substantial amount of households (39%) fall in the middle-
income group (R50 614 to R404 901 per annum), with only 14% of households falling
in the high-income group (R404 902 to R3 239 207 or more per annum). These figures
indicate that Cape Town is a middle-income municipality.
The unemployment rate in Cape Town increased from 19,2% to 22,1% between 2008
and 2015 and was attributed to the 2008 economic downturn. The unemployment rate
decreased from 24,9% in 2012 to 22,1 in 2015 (City of Cape Town, 2016b). The
indigent households (people who are not in a position to pay for basic services such as
waste collection) in the City of Cape Town are shown in Figure 4.3. The figure indicates
that poverty is still widespread in the City of Cape Town. The annual household
numbers show decreases and increases from the 2003 historical baseline figure, hence
there is no real trend.
Stellenbosch University https://scholar.sun.ac.za

53 | P a g e
Figure 4.3: Indigent households for 2003 to 2015
Source: City of Cape Town (2016b)
As economic development and population dynamics have a major impact on municipal
waste generation in the City of Cape Town, an assessment of socio-economic drivers
of waste generation indicated that for every 1% of GDP growth/annum, the amount of
waste that is being landfilled increases by 0,6% and the amount of waste collected
increases by 0,42%, and a 1% growth in population has led to a 0,9% change in waste
being disposed of at landfill (City of Cape Town, 2016a).
4.2.2 Socio-economic drivers of waste flows in the City of Cape Town
The literature reviewed indicated a strong relationship between contributing factors of
waste generation such as urban population, population growth and people per
household (Dyson & Chang, 2005; Lea et al., 2004; Mazzanti & Zoboli, 2008; Oyoo et
al., 2011). The following indicators relate to socio-economic drivers and are relevant to
the City of Cape Town:
i. Population
Cape Town is still growing, with 2014 population figures estimated at 3 882 662
people. Cape Town is ranked the 10th most populous city in Africa and in 2016 the
population was estimated at 4 004 793 (City of Cape Town, 2016b). Between 1996 and
2011, the population grew from 2 563 095 to 3 740 026, resulting in a positive growth
of 45,9% (City of Cape Town, 2016b; 2017). A 10-year trend migration analysis (2001–
Stellenbosch University https://scholar.sun.ac.za

54 | P a g e
2011) indicated that the majority of in-migration came from outside the Western Cape
(City of Cape Town, 2014).
Statistical figures on demographic trends in the City of Cape Town indicate that the
population will increase over the next 20 years and is expected to grow to 4,2 million
and 4,46 million by 2022 and 2032, respectively (City of Cape Town, 2016b), with a
continuous influx of people from neighbouring provinces and countries. This positive
growth in population results in an increase in waste generation, which is associated with
an increased demand for waste collection services and landfill airspace.
ii. Household size
The number of households in Cape Town increased from 653 085 in 1996 to 777 389
in 2001. In 2011, the households increased to 1 068 572. This represents an increase in
households of 63,6% since 2001 and indicates a positive growth in households for the
respective periods. Apart from the growth in households, there seems to be a trend
towards smaller household units across all population groups with an estimated 0,6
million more households between 2011 and 2035 (1,7 million – average of three
members).
The average household members is less than in developing countries (five members)
and is moving closer to that of developed countries (two to three members). This means
an average household size of three members. This results in an increasing demand for
housing supply (City of Cape Town, 2016b), which relates to a greater demand for
waste collection infrastructure, as smaller households mean more dwellings over
greater waste collection areas, additional collection infrastructure and additional
landfill airspace.
Waste generation in 2007 reached a high of approximately 730 kg/person/annum. This
figure includes domestic and the majority of waste from commerce and industry (City
of Cape Town, 2016b). For the period 2007–2015, the waste generation showed a
gradual increase with an estimated growth of 2,6%, which accounted for migration as
well. The average waste generation rate per person was estimated to be
580 kg/person/annum (City of Cape Town, 2017). This showed a decline from the 2007
waste generation figures.
Stellenbosch University https://scholar.sun.ac.za

55 | P a g e
4.2.3 Political drivers of waste flows in the City of Cape Town
The literature review indicated that political drivers are specific legislation that
promotes waste prevention, source separation and landfill diversion policies, with the
latter being most dominant in the waste management field (Mazzanti & Zoboli, 2008).
The following indicators relate to political drivers and are relevant to the City of Cape
Town:
Waste management in South Africa, a developing country, is also underpinned
by the internationally accepted waste management hierarchy, which illustrates
that waste avoidance and reduction is the most desired state for a sustainable
waste management system, with the least desired being waste treatment and
disposal to landfill. This waste management hierarchy is the primary building
block of an ISWM framework to deliver services for residents and businesses
in a municipality.
South African municipalities are required by the National Environmental
Management: Waste Act, No. 59 of 2008 to adopt an integrated waste
management approach when dealing with waste. Incremental changes to how
waste has been handled in the past have been implemented by some
municipalities. The most obvious is where municipalities start with recycling
initiatives with the aim to reduce the negative impacts of waste disposal on the
environment and people’s health.
The National Waste Management Strategy of 2011 is a legislative requirement
of the National Environmental Management: Waste Act, No. 59 of 2008 and is
structured around a framework of eight goals, which were to be met by 2016
(DEA, 2011). Of relevance for this study is Goal 1: Promote waste minimisation
and the reuse, recycling and recovery of waste. Goal 1 stated that at least 25%
of recyclables needs to be diverted from landfill sites for reuse, recycling or
recovery by 2015 and that all metropolitan municipalities initiate source
separation programmes by 2015 (DEA, 2011).
The City of Cape Town has adopted the objects of the National Waste Management
Strategy of 2011 in The City of Cape Town Integrated Waste Management (IWM)
Stellenbosch University https://scholar.sun.ac.za

56 | P a g e
Policy (2009). The city became the first municipality in South Africa to introduce a by-
law that regulates and enforces integrated waste management in its area of jurisdiction
(City of Cape Town, 2014). This policy is aligned with national legislation and was
adopted by Council and promulgated on 21 August 2009 (City of Cape Town, 2013).
The policy contains principles, levels of service for various socio-income groups, based
on the municipality’s geography and accessibility, and standards for waste
management. The overarching objectives of the policy is to provide waste management
services to all communities, reduce the amount of waste to landfill facilities and prevent
the degradation of the environment and the impact on human health (City of Cape
Town, 2013).
The City of Cape Town has an Integrated Waste Management By-law that was
promulgated in June 2010. The by-law enforces the objectives of the Integrated Waste
Management Policy (City of Cape Town, 2013) and aims at regulating and controlling
solid waste management in the municipality to ensure a uniform approach to waste
management.
Before the passing of the Waste Act, the City of Cape Town started addressing the
challenges of sustainable waste management practices by enforcing reduction measures
due to the pressing need for available landfill airspace (Swilling & Annecke, 2012).
The City of Cape Town’s Solid Waste Management Department is one of the very few
municipalities in South Africa, from a sustainability perspective, with the commitment
to include a green urbanism agenda to create more sustainable places and lifestyles and
where consumption of the world’s resources are less (Swilling & Annecke, 2012).
4.3 Solid waste management practices in the City of Cape Town
The ‘two triangles’ analytical framework for solid waste management in the world’s
cities was used to examine the existing management practices and realities in the City
of Cape Town. The framework is divided into two system elements, namely i) a
physical component, which is linked to three drivers (public health, waste resource
management and environmental protection) to enable an ISWM system to work
sustainably over the long term, and ii) governance aspects (inclusivity, sound
Stellenbosch University https://scholar.sun.ac.za

57 | P a g e
institutions and proactive policies, financial sustainability) that need to be addressed to
deliver a well-functioning solid waste management system (Wilson et al., 2013).
Information on governance aspects in the City of Cape Town is included throughout
the results and not under a separate heading, as governance is considered in collection
type and systems, disposal and resource management.
4.3.1 Main driver for municipal solid waste management in the City of Cape Town
Municipal solid waste management poses pressures to municipalities and cities and
there is no single solution, as drivers behind municipal solid waste management vary
significantly from city to city. In the context of the City of Cape Town, resource
management was the main driver since 2006, when recycling was considered as a
strategic means of diverting waste from landfill (City of Cape Town, 2014) in order to
increase the existing landfill capacity. It is also during this period that reporting on
waste information began and was made available.
During the financial years 2013/2014, 2014/2015 and 2015/2016, at least 7,61%, 9,15%
and 20,58%, respectively, of waste by mass was diverted from landfill sites (City of
Cape Town, 2016b; 2017). This indicates a positive trend in waste minimisation efforts
by the City of Cape Town (City of Cape Town, 2016b; 2017), but excludes private
sector waste minimisation initiatives, as reporting from this sector is poor, with few
companies having waste management plans in place.
Oelofse and Godfrey (2009) state that waste generation rates differ noticeably across
income groups. Dating back to 1998, domestic waste in the City of Cape Town
constituted 895 000 tons with at least 492 967 tons generated from high-income areas.
This is broken down into 1,3 kg/capita/day in high-income areas, 0,7 kg/capita/day in
middle-income areas and 0,35 kg/capita/day in low-income areas (Swilling, 2006).
According to Swilling and Annecke (2012), the 2007/08 average per capita rate
(kg/capita/day) in the City of Cape Town was 2 kg. At a national level, in South Africa,
low-, middle- and high-income areas generated 0,41, 0,71 and 1,29 kg/capita/day,
respectively (Oelofse & Godfrey, 2009).
Cape Town’s waste generation, which is higher than the national high-income areas is
possibly because Cape Town is a middle income city and approximately 50% of
Stellenbosch University https://scholar.sun.ac.za

58 | P a g e
household’s waste is generated by the high income households (Swilling & Annecke,
2012).
In the City of Cape Town, during the period 1998–2009, changes in the waste
generation rates were minuscule; however, the total waste quantities increased as the
population increased. This can be translated that people had not changed their
consumption patterns during this time.
4.3.2 Waste collection practices in the City of Cape Town
The regulator and authority of municipal waste management services in the City of
Cape Town is the Solid Waste Management Department. This department consists of
various branches, namely Waste Minimisation; Research and Development; Planning;
Collections and Waste Disposal Activities.
In 2011, approximately 94% of the 1 068 572 households in the city received weekly
domestic waste collection services (Western Cape Government Provincial Treasury,
2014). The households were divided into formal households (837 533), informal
dwellings (shack in backyard) (74 958) and shacks (not in backyards) (14%). With the
increase in population (3 740 025 in 2011 to 3 882 662 in 2014), the service levels
remained at least constant (PwC, 2014). In 2016, the majority of households, at least
92,3%, received a weekly refuse collection service (City of Cape Town, 2016b).
The City of Cape Town, with private sector participation, renders a refuse collection
service to formal and informal households as well as backyard dwellers residing on
Council rental stock land and on formal private properties operated by the municipality
and service providers. In 2017, 100% of formal households are provided with a weekly
kerbside wheelie bin refuse collection service. Informal households in informal
settlements are provided with a weekly door-to-door plastic bag refuse collection
service or ongoing litter picking.
The municipality also collects illegal dumping in informal areas. The plastic bags are
taken to shipping containers, where they are stored and later transported to the nearest
landfill site. The shipping containers are serviced twice a week. Backyard dwellers
residing on Council rental stock land receive a formal weekly wheelie bin kerbside
Stellenbosch University https://scholar.sun.ac.za

59 | P a g e
refuse collection service, whereas a pilot project to roll out wheelie bins to backyard
dwellers living on formal private properties are underway (City of Cape Town, 2016b;
2017).
The waste composition in the City of Cape Town is depicted in Figure 4.4. It is noted
that domestic waste is the largest single municipal waste stream in the City of Cape
Town. A breakdown of domestic waste, surveyed in 2011, is shown in
Figure 4.5. The major fractions of waste in the domestic waste stream are paper
(15,50%), followed by garden waste (15.20%), with e-waste at 5.50% (City of Cape
Town, 2013).
47%
27%
26%
Domestic waste
Commercial waste
Industry waste
Figure 4.4: Composition of municipal solid waste in the City of Cape Town
Source: City of Cape Town (2013)
0%
5%
10%
15%
20%
25%
30%
Waste fractions
Stellenbosch University https://scholar.sun.ac.za

60 | P a g e
Figure 4.5: Composition of domestic waste streams
Source: City of Cape Town (2013)
Furthermore, a waste characterisation survey conducted by the Western Cape
Government in 2007 (Figure 4.6) revealed that the dominant waste stream is greens and
organics (39%) followed by paper. It is uncertain whether this study wholly focused on
the domestic waste stream, as there is a notable difference in the composition between
this study and the domestic waste stream survey of 2011 in
Figure 4.5. The researcher believes
Figure 4.5 to be more reliable, as the figure is captioned “Composition of domestic
waste streams”.
Figure 4.6: Waste characterisation survey: Western Cape municipalities
Source: Western Cape Government (2013)
The City of Cape Town’s ability to generate income and recover costs is directly
influenced by its stakeholders’ ability and willingness to pay for rates and tariffs (City
of Cape Town, 2017). The municipality has an indigent fund that caters for indigent
households unable to pay for waste collection fees. The municipality has a prerogative
regarding choice of service mechanisms and service provision as well as tariff setting
to its residents. There are different rates for residential collections depending on the
value of the residential property.
Paper Plastic Metals Glass
Greens/
organic
s
Builder
s rubble
Miscell
a-
neous
City of Cape Town 20% 18% 7% 11% 39% 5% 0%
Cape Winelands 26% 18% 6% 8% 29% 0% 13%
Eden 13% 33% 10% 10% 21% 0% 2%
West Coast 19% 27% 7% 6% 18% 23% 0%
Overberg 22% 10% 6% 5% 24% 33% 0%
Central Karoo 28% 28% 11% 13% 14% 16% 0%
0%5%
10%15%20%25%30%35%40%45%
Per
cen
tag
e
Stellenbosch University https://scholar.sun.ac.za

61 | P a g e
4.3.3 Waste disposal practices in the City of Cape Town
Waste disposal data are available from 2006, when consolidated reporting began. The
City of Cape Town reached a maximum disposal rate of 2 500 000 tons of waste in
2007. This waste includes household, commercial and industry waste. There has been
a sharp decline between 2008 and 2009, which could be attributed to the global
economic downturn, and the figure has increased significantly since.
During the years 2013/2014, 2014/2015 and 2015/2016 at least 2,39 million, 2,51
million and 2,44 million tonnes of waste, respectively, was disposed of at the landfill
sites (City of Cape Town, 2017). There is no real trend during the three years given the
high waste minimisation achieved in 2015 (reported earlier in Section 4.3.1).
The main method currently used to manage solid waste is disposal at landfills. There
are only three operating landfills in the City. These are Bellville South, Coastal Park
and Vissershok, owned by the City of Cape Town, and one privately owned hazardous
landfill site next to Vissershok (Engledow, 2007). The remaining lifespans of the three
landfill sites owned by the city are all very limited, with 10 years’ remaining airspace.
The operating landfill sites cover an area of approximately 300 hectares of land.
The city owns two refuse transfer stations, the Athlone Refuse Transfer Station and the
Swartklip Refuse Transfer Station. The Athlone Station includes a rudimentary ‘dirty’
Materials Recovery Facility. Waste from Athlone Station is compacted and sent via
rail, whereas waste from the Swartklip Station is compacted and sent via refuse trucks
to the Vissershok landfill site. A third refuse transfer station, Bellville Waste
Management Facility, was constructed in 2015 and is not operational yet. This facility
will replace the Bellville landfill site once closed.
The city also owns an IWM facility in Kraaifontein. The Bellville landfill site is due to
close in September 2018. The Coastal Park landfill site has limited landfill airspace and
will close in 2022. The Vissershok landfill site has 10 years of remaining airspace left.
This site also receives low hazardous waste. Next to the Vissershok landfill site is the
privately owned Vissershok Waste Management Facility, which receives high-rated
hazardous waste.
Stellenbosch University https://scholar.sun.ac.za
62 | P a g e
An application to increase the capacity at the Vissershok landfill site commenced and
is awaiting approval from the competent authority. The Visserhok North landfill site,
which has not been developed yet, will assist in relieving pressure on existing landfill
infrastructure. In 2000, the City of Cape Town commenced with the identification of a
new regional landfill site to serve the municipality for another 30 years. A record of
decisions was issued in 2013 in favour of a site near Kalbaskraal, north of Cape Town.
However, an appeal from adjacent owners has been lodged against this site and is being
addressed through a legal process (City of Cape Town, 2016b; 2017).
4.3.4 Waste resource management practices in the City of Cape Town
The City of Cape Town has a number of ongoing recycling activities to divert waste
from landfill, such as a split bag pilot household recycling programme in Marina da
Gama, which started in 2002 (Engledow, 2007) and was followed by the Think Twice
separation at source initiative in 2006 in selected income areas across Cape Town.
The Think Twice separation at source initiative is outsourced on a three-year cycle to
an external contractor who processes the dry recyclables at the Kraaifontein IWM
facility, owned by the City of Cape Town. This project has been rolled out to 200 086
households. However, the project is constraint by budget to further roll-out to more
households. Other waste minimisation measures are 24 public drop-off facilities,
situated within a 7-km radius between one another, to which residents are encouraged
to bring their recyclables, electronic waste, building rubble and garden waste. Not all
residents own vehicles and this is only practical for households that own vehicles and
live in close proximity to the facilities.
In 2016, a home composting project was initiated in which 5 500 bins were distributed
to home owners across the municipality in an attempt to divert organic waste from
landfill. The results from the separate green waste feasibility study in the 2012–2014
financial year indicated the potential of approximately 17 kg per household per month
of organic waste being diverted from low- and middle-income areas in the City of Cape
Town.
As the composting project is spread across the municipality, it is not possible to obtain
the impact the diversion of organic waste may have on the collection costs for waste
Stellenbosch University https://scholar.sun.ac.za

63 | P a g e
management. The organic waste diversion project is aligned to the national
government’s strategy, titled the National Organic Waste Composting Strategy: Draft
Strategy Report, which aims to ensure, where viable, that organic waste is diverted from
landfill sites as an alternative treatment through integrated and sustainable waste
management planning (DEA, 2013).
4.3.5 Environmental protection in waste management practices in the City of Cape
Town
The City of Cape Town landfill operating permits allow for biogas to be vented in a
controlled manner. The municipality is exploring the feasibility of a landfill gas-to-
electricity project in partnership with the Central Energy Fund at two of its operating
landfill sites. This is an attempt to reduce greenhouse gases emitted into the atmosphere
and to protect human health and the environment. This process will allow the
municipality to be compliant with the Clean Development Mechanism projects that are
registered in terms of the Kyoto Protocol and could generate additional income.
A project funded by the German Development Bank is examining the type of disposal
and treatment technology that can be implemented in the municipality to reduce the
amount of waste going to landfills. A transaction advisor was appointed to assess
alternative service delivery mechanisms that are focused on the City of Cape Town’s
solid waste management system to incorporate large-scale waste minimisation. The
feasibility assessment of all new projects may result in private sector involvement to
develop these projects as part of the goal to build a green economy (City of Cape Town,
2016b; 2017).
Table 4.1 provides key benchmark numbers that are quantitative information provided
by the City of Cape Town in the various secondary documents examined.
Stellenbosch University https://scholar.sun.ac.za

64 | P a g e
Table 4.1: Key benchmark numbers
Description Benchmark Description Benchmark
Total tons of waste
generated per annum
2,44 million in
2015/20160
Percentage waste
volarised of the total
waste generated
20,58% in
2015/2016
Generation per capita in
kilograms per year
580 kg/capita/day Percentage waste
volarised by private
sector of total municipal
solid waste generated
No information
available
Percentage waste
collection coverage
92,3% Waste collection goals
as percentage of
population
100%
Percentage disposal in
controlled disposal sites
of total waste generated
79,42% Goals for
environmentally safe
disposal
Moratorium on
regional landfill
site
Percentage municipal
waste incinerated/treated
of total waste generated
0% Goals for valorisation
waste materials through
diversion from disposal
Think Twice
separation at
source initiative
is constraint by
budget to further
roll-out
Percentage diverted and
valorised of total waste
generated
Not available Waste prevented,
reused, recycled,
composted
20,58% of
municipal solid
waste (recycled)
Source: Adapted from UN-Habitat (2010)
4.4 Factors influencing future domestic waste flows in the City of Cape
Town
This section provides the results from the causal loop analysis on the key drivers that
influence future waste flows. These were categorised into six main feedback loops that
were identified based on the two triangles analytical framework, which are each
discussed in the sections that follow.
Stellenbosch University https://scholar.sun.ac.za

65 | P a g e
4.4.1 Public health feedback loops: B1, B2 and B3
Issues relating to the public health driver consist of three feedback loops, B1, B2 and
B3, as shown in
Figure 4.7. Population, one of the key drivers identified for waste generation, is the
main variable in the two balancing loops associated with public health feedback in the
City of Cape Town.
Population
Waste generation
Landfill capacity
Illegal dumping
Sanitation &
health-related problems
Demand for
housing
Collection areas
+
-
-
+
-+
+B1
B2
Informal settlements
+
+
+
B3
Stellenbosch University https://scholar.sun.ac.za

66 | P a g e
Figure 4.7: Public health feedback loops
Balancing loop 1 (B1) indicates that Cape Town has a growing population, resulting in
an increase in waste generation, which further adds pressure to the already limited
landfill airspace (City of Cape Town, 2016b; 2017). This results in illegal dumping and
poor sanitation, especially in the low-income, densely populated areas. This impacts on
the health of people, especially infants, and may ultimately lead to death. This leaves
room for improvement in waste collection in informal areas, but also requires a shift in
residents’ behavioural problems, which is a complex challenge.
Balancing loop 2 (B2) also represents a growing population, which results in a demand
for more housing and an increase in informal dwellings. As the City of Cape Town’s
household size is becoming more that of developed countries (from five members to
two to three members) (City of Cape Town, 2016b), this may lead to greater collection
areas over longer distances, but also further impacts landfill capacity.
In addition, Balancing loop 3 (B3) indicates that an increase in informal dwellings will
enhance illegal dumping even more, thereby further impacting on people’s health and
sanitation. This will perpetuate the already existing illegal dumping problem identified
in Balancing loop 1 (B2). The effects of poor management on human and environmental
health, expounded in Section 2.6, cause offensive smells, blocks drains and causes
Population
Waste generation
Landfill capacity
Illegal dumping
Sanitation &
health-related problems
Demand for
housing
Collection areas
+
-
-
+
-+
+B1
B2
Informal settlements
+
+
+
B3
Stellenbosch University https://scholar.sun.ac.za

67 | P a g e
flooding, which attracts vectors and rodents and subsequently leads to the spreading of
waterborne diseases, which may lead to child diseases and mortality (City of Cape
Town, 2016b).
In terms of the governance aspect regarding the degree of user and provider inclusivity
in policy formation, planning, implementation and evaluation of these services and
financial sustainability, the municipality has a by-law relating to illegal dumping and
spends millions on clean-up efforts on illegally dumped waste despite remedial
measures of continuous campaigns against illegal dumping, namely on social media,
billboards, waste collection vehicles, etc. (City of Cape Town, 2016b; 2017). This is an
indication that the municipality is self-supporting; however, these high costs could be
spent elsewhere, for instance more houses and infrastructure could be established for
those living in informal settlements (City of Cape Town, 2016b; 2017). A novel
approach is necessary and the City of Cape Town can learn from the Curitiba case study
mentioned in Section 2.4.1. The city of Curitiba was rewarded with a United Nations
award on trash collection and separation (Vaz, n.d.).
4.4.2 Waste resource management feedback loops: B4 and B5
Issues relating to the waste resource management driver consist of two feedback loops,
B4 and B5, as shown in Figure 4.8.
Waste generationLandfill capacity
B4
Recycling &
composting
Investment in landfill
capacity
Ratio between requiredlandfill vs. available landfill
capacityHousehold waste demand
management measures
+
+
B5
+
- -
-
Landfill
requirement+
+
Stellenbosch University https://scholar.sun.ac.za

68 | P a g e
Figure 4.8: Waste resource management feedback loops
The gap between the demand for additional and available landfill capacity is the main
variable in the two balancing loops influencing action to waste resource management
of domestic waste flows in the City of Cape Town. The need to save landfill capacity
was initiated in 2006 with the introduction of the source separation programmes (B4).
Identified suburbs were informed and educated to separate recyclables from the
remainder of waste generated in households. This resulted in less waste generated and
more waste diverted from landfills.
As more recycling efforts are being implemented (B5), such as the new home
composting project, a greater increase in available landfill capacity can be expected;
however, this is heavily dependent on thousands of households to voluntarily partake
in this initiative. The increase in landfill capacity reduces the gap between a demand
for more landfill airspace and capacity. It may take longer than expected to meet this
demand due to delayed implementation measures by the municipality to increase
landfill capacity, as is the case with the pending regional landfill site.
In terms of governance aspect regarding the degree of user and provider inclusivity in
policy formation, planning, implementation and evaluation of these services, the waste
minimisation initiative through recycling supports the current waste management
hierarchy, but is limited to selected high-income suburbs only. There is still room for
improvement and roll-outs to other areas. However, the city appoints a contractor to
collect the source-separated waste in the selected suburbs and recognises that this is an
expensive intervention and should not be seen as the only means to divert waste
disposal to landfill.
4.4.3 Environmental protection feedback loop: R1
Issues relating to the environmental protection driver consist of one feedback loop (R1)
as shown in Figure 4.9.
Stellenbosch University https://scholar.sun.ac.za

69 | P a g e
Figure 4.9: Environmental protection feedback loop
Public health in combination with environmental protection is the main variable in this
Reinforcing loop (R1) associated with domestic waste flows in the City of Cape Town.
The City of Cape Town realised this need in its Integrated Waste Management Plan,
2017–2022, and is looking at alternatives to divert waste from landfills. This will bolster
recycling activities, which diverted at least 20% of the total waste in 2015, and will
further extend available landfill capacity. This diversion can still be improved
substantially through efforts on in terms of the 3Rs throughout the relevant industrial
and commercial sectors. This is in line with reaching the long-term goal of
sustainability to ‘close the loop’ by focusing on changing packaging designs, resulting
in fewer inputs of materials, as opposed to heavy reliance on quantities of waste
recycled. This may be a national government imperative.
The above initiative responds to the governance aspect regarding institutional
coherence. The municipality has a materials recovery plan, but this may not prove to
be financially sustainable in terms of the governance aspect, as it is an expensive
intervention.
4.4.4 Overall feedback loops on dynamic factors affecting future domestic waste
flows
Figure 4.10 illustrates the dynamic factors affecting future domestic waste flows in the
City of Cape Town and illustrates how different key variables interact. It shows only
Landfill capacity
Alternative
technologies
Need for
investment
Public health &
environmental protection+
R1 +
+
Stellenbosch University https://scholar.sun.ac.za

70 | P a g e
one Reinforcing loop (R1), which amplifies change by introducing alternative
technologies. The rest of the causal loops are all balancing loops that seek equilibrium.
Figure 4.10: Overall feedback loops of the factors affecting future domestic waste
flows
4.5 Summary
This chapter presented the results of the study according to the objectives it aimed to
achieve. Domestic waste is one output of municipal solid waste disposed of in the City
of Cape Town. This study was limited to only examine domestic waste flows in the
City of Cape Town. In order to understand the dynamic factors of these flows, a causal
loop diagram illustration was used to address the research problem.
Three causal feedback loops were identified, namely i) public health, ii) waste resource
management and iii) environmental protection. The main variables in each feedback
loop were population, the gap between the demand for additional and available landfill
capacity and public health in combination with environmental protection. In summary,
an increase in population, as is the case in the City of Cape Town, results in an increase
in waste generation, which in turn impacts on available landfill capacity, public health
and environmental protection. A combination of current and proposed interventions
was identified, such as a change in behavioural problems by residents to combat illegal
dumping, the new home composting project, increased recycling initiatives and a
Population
Waste generation
Landfill capacity
Illegal dumping
Sanitation &
health-related problems
Demand for
housing
Collection areas
+
-+
+
-+
B1
B2
B4
Recycling &
composting
Investment in landfill
capacity
Ratio between requiredlandfill vs. available landfill
capacity
Household waste demand
management measures
+
+
B5
Alternative
technologies
Need for
investment
Cascade resource
utilisation
+
R6
Informal settlements
+
+
+
B3
+
-
-
+
++
landfill requirement
+
+
Stellenbosch University https://scholar.sun.ac.za

71 | P a g e
pending regional landfill site to carry out the municipality’s constitutional mandate to
provide basic services to its citizens.
The next chapter discusses the key findings and makes recommendations for future
work.
Stellenbosch University https://scholar.sun.ac.za

72 | P a g e
Chapter 5: Conclusions and recommendations
5.1 Introduction
This study presented insights into dynamic factors influencing domestic waste flows in
the City of Cape Town in providing additional landfill airspace to the already dwindling
available landfill capacity in a developing world context of urban growth.
The objectives of this study were:
1) To examine the drivers of waste flows in the City of Cape Town;
2) To examine existing solid waste management practices in the City of Cape
Town; and
3) To explore the dynamic factors influencing future domestic waste flows in the
City of Cape Town using causal loop diagrams.
The above objectives were met within the scope of the study by using different methods
such as a comprehensive literature review, the use of grey literature and qualitative
system dynamics, in particular, causal loop diagrams. Key findings are presented and
areas of improvement and recommendations for future work are discussed.
5.2 Key findings from literature review
The literature review revealed that waste generation is inevitable in cities that provide
opportunity for economic development and that the types of waste problems are often
varied, based on time and the development of societies of various sizes. The magnitude
of associated problems, quantities and composition of waste also differs significantly
between developed and developing countries and there is no readymade solution for
dealing with waste management challenges, as cities have unique landscapes and
demonstrate unique needs.
The literature states that waste must be dealt with in a sustainable manner to safeguard
the environment for future generations and that a move towards ISWM practices is
necessary by ‘closing the loop’ by returning both organic and inorganic waste to
beneficial use through recycling. The literature revealed that local governments have
little power over consumption patterns by their residents and that focus is mostly on
deciding upon the most appropriate waste management technologies and strategies to
Stellenbosch University https://scholar.sun.ac.za

73 | P a g e
be implemented. Consumption patterns and waste generation rates vary between
developed and developing countries and notably between various income groups.
Municipalities are faced with highly significant health and environmental problems and
are unable to deal with increasing amounts of waste generated due to lack of funds and
knowledge, which places constraints on how to deal with waste effectively.
Three key categories of drivers of waste flows through cities were identified. Economic
drivers are consumption patterns, employment and GDP, whereas socio-economic
drivers are population and household size. Political drivers were identified as legislation
that promotes waste prevention such as the international adopted waste management
strategy, which promotes the 3Rs (reduce, reuse, recycle). A well-functioning waste
management system needs to respond to these drivers in order for the system to work
sustainably over the long term. A framework of three physical systems and three
governance aspects to analyse and identify gaps in the system was developed by UNEP
to address all aspects of a waste management system. This was discussed in detail in
Section 3.4.2 and in Chapter 3.
5.3 Key findings from causal loop diagrams
Key findings from secondary information and causal loops diagrams revealed that there
is a positive growth in the population and that it will continue to grow in the future.
This study utilised qualitative system dynamics, mainly causal loop diagrams, to
provide insight into the dynamic factors influencing future domestic waste flows in the
City of Cape Town.
The feedback loops were used qualitatively to portray conceptual models as an aid to
think and understand and was based on the ‘two triangles’ analytical framework for
solid waste management in the world’s cities, developed for UN-Habitat. It was used
to examine the existing trends and realities in the City of Cape Town. This framework
has been used widely and shows good work being done on solid waste by cities around
the world, including large and small, rich and poor cities. It examined what drives
change in solid waste management, how cities find local solutions and what seems to
work best under different circumstances (Wilson et al., 2013). The main causal
Stellenbosch University https://scholar.sun.ac.za

74 | P a g e
feedback loops were i) public health, ii) waste resource management and iii)
environmental protection.
5.3.1 Public health feedback loops
Population growth, increased informal settlements and illegal dumping are the key
variables in this feedback loop. Apart from natural births, the population growth is
attributed to an influx of people from neighbouring provinces and countries. This
implies a demand for more housing and may lead to greater refuse collection areas over
longer distances, which impacts on landfill capacity.
The majority of households (47%) fall within the low-income group. Public health is at
risk, as illegal dumping remains prevalent in the municipality, despite ongoing remedial
measures and stringent by-laws. Illegal dumping costs the City of Cape Town R350
million every year to clean up the waste. Informal dwellings are on the rise, thereby
enhancing illegal dumping and impacting on people’s health and sanitation. The
increase in waste generation reduces available landfill capacity, which has
consequences for environmental protection, particularly in terms of solid waste
management, air quality and water quality.
5.3.2 Waste resource management feedback loops
Public health in combination with environmental protection is the key variable in this
feedback loop. The City of Cape Town has moved towards ISWM with the introduction
of the Think Twice separation at source initiative in 2006. It is noted that the number
of households participating in the Think Twice separation at source initiative is very
low, at 200 086, compared to 1 068 572 households in 2011. However, the municipality
does note that funding remains a difficulty to expand this initiative.
Although the city undertook extensive waste characterisation surveys in 2011, further
surveys are recommended to assess the changes in the characteristics of the waste where
the separation at source waste minimisation scheme has been implemented. The
percentage diversion rates through the recycling programmes over the years show time
lags between intervention and effects, i.e. the recycling rates significantly improved in
2015/2016 with at least 20,58% of waste by mass diverted from landfill. As this waste
minimisation initiative began in 2006, it is only in 2015/16 that the municipality nearly
Stellenbosch University https://scholar.sun.ac.za

75 | P a g e
reached Goal 1 of the National Waste Management Strategy of 2011, namely “to divert
25% of recyclables from landfill sites for reuse, recycling or recovery by 2015” and
that all metropolitan municipalities have initiated source separation programmes by
2015 (DEA, 2011:23).
It is likely that vehicles collecting the residual waste from the selected Think Twice
areas carry less waste than those vehicles collecting normal mixed waste. This should
mean huge savings in terms of vehicles and collection costs for the municipality. It has
been shown in the literature review (Section 2.3.2) that waste generation rates and
recyclable fractions are directly linked to income levels. The higher the income level,
the higher the proportion of recyclables in the waste stream. Therefore, the correct
recycling initiatives need to be found based on the various income levels across the
municipality. The municipality’s mandate is to deliver a refuse collection service to its
communities and to meet the objects of the waste management hierarchy.
5.3.3 Environmental protection feedback loop
Public health in combination with environmental protection is the key variable in this
feedback loop. The main outcome from this feedback loop is the introduction of
alternative technologies to suit the unique environment.
The City of Cape Town realised a need for alternative technologies in its Integrated
Waste Management Plan, 2017–2022, and is in the process of investigating alternatives
to divert waste from landfills. This will bolster the existing recycling activities, which
diverted at least 20% of the total waste in 2015, and will further extend available landfill
capacity. Of note is that the municipality does not have control over the consumption
patterns of its residents, therefore relevant industrial and commercial sectors are key in
‘closing the loop’ by focusing on changing the packaging designs of goods, which will
result in fewer inputs and outputs of materials.
The following section describes the recommendations made based on this study and
areas for future research.
Stellenbosch University https://scholar.sun.ac.za

76 | P a g e
5.4 Recommendations
Based on the evaluation, assessment and conclusions of this thesis, further steps are
important in managing the waste system in Cape Town.
The City of Cape Town reviews its current waste management system through the
ISWM framework. This framework is used globally and provides comprehensive
information on physical and governance aspects of current modernisation and sound
practices of the municipality through a set of indicators and drivers in relation to each
indicator. The current system is presented by guidelines for developing IWM plans,
which were set up by the national government in the early 2000s. These guidelines are
not as comprehensive as the international framework and, as such, should be extended.
Obtaining detailed information regarding the City of Cape Town was challenging and
grey literature was obtained to assist with this study. Recommendation 5.3.1 would
greatly assist in achieving this information.
Illegal dumping remains a challenge in the City of Cape Town despite the many efforts
in cleaning up the waste to protect public health and the environment. Illegal dumping
characterises the ‘personality’ of an area. It would be useful to undertake a study into
these hotspot areas in order to understand the dynamics of the settlements, space
limitations and needs, collection frequency and the behaviour of residents. Results from
such a study may introduce new methods in managing waste to be applied, which may
have national significance for municipalities in South Africa.
Further research identified is to turn the feedback loops into a mathematical model for
quantitative simulation and optimisation to support policy design, which would fulfil
all modelling phases as explained in Section 2.7.
Stellenbosch University https://scholar.sun.ac.za

77 | P a g e
References
Achankeng, E. 2003. Globalization, urbanization and municipal solid waste
management in Africa. In Proceedings of the African Studies Association of
Australasia and the Pacific 26th Annual Conference. 1–22.
Agbesola, Y. 2013. Sustainability of municipal solid waste management in Nigeria: A
case study of Lagos. Unpublished master’s thesis. Linköping: Linköping
University.
Ahmad, K. 2012. A system dynamics modeling of municipal solid waste management
systems in Delhi. International Journal of Research in Engineering and
Technology, 1(4):628–641. Retrieved from
http://esatjournals.net/ijret/2012v01/i04/IJRET20120104014.pdf [Accessed 18
August 2016].
Alam, P. & Ahmade, K. 2013. Impact of solid waste on health and the environment.
Special Issue of International Journal of Sustainable Development and Green
Economics, 2(1):165–168.
Bryman, A. & Bell, E. 2014. Research methodology: Business and management
contexts. Third edition. Cape Town: Oxford University Press.
Buenrostro, O., Bocco, G. & Vence, J. 2001. Forecasting generation of urban solid
waste in developing countries: A case study in Mexico. Journal of the Air & Waste
Management Association, 51(1):86–93.
Cavana, R., 2003. Modeling the environment: an introduction to system dynamics
models of environmental systems. System Dynamics Review, 19(2): 83-173.
City of Cape Town. 2009. City of Cape Town Integrated Waste Management (IWM)
Policy. Cape Town.
City of Cape Town. 2013. Solid Waste Management Sector Plan for the City of Cape
Town (Incorporating Integrated Waste Management Plan): Draft Sector Plan
2013/14. Cape Town.
City of Cape Town. 2014. State of Cape Town Report 2014. Cape Town.
City of Cape Town. 2016a. Five Year Integrated Development Plan 2012–2017:
2016/17 review and amendments. Cape Town.
City of Cape Town. 2016b. State of Cape Town Report 2016. Cape Town.
City of Cape Town. 2017. Draft Integrated Waste Management Plan 2017–2022. Cape
Town.
Coyle, R.G. 1996. System dynamics modelling. London: Chapman and Hall.
Davies, M., Musango, J.K. & Brent, A.C. 2016. A systems approach to understanding
the effect of Facebook use on the quality of interpersonal communication.
Technology in Society, 44:55–65.
DEA (Department of Environmental Affairs). 2011. National Waste Management
Strategy. Pretoria.
DEA (Department of Environmental Affairs). 2012. 2nd South Africa Environment
Outlook: A report on the state of the environment. Executive summary. Pretoria.
DEA (Department of Environmental Affairs). 2013. The National Organic Waste
Composting Strategy: Draft Strategy Report. Pretoria.
DEA (Department of Environmental Affairs). 2014. Draft Outcome 10 MTSF 2014–
2019. Pretoria.
Doughty, M.R.C. & Hammond, G.P. 2004. Sustainability and the built environment at
and beyond the city scale. Building and Environment, 39(10):1223–1233.
Dyson, B. & Chang, N. 2005. Forecasting municipal solid waste generation in a fast-
Stellenbosch University https://scholar.sun.ac.za

78 | P a g e
growing urban region with system dynamics modeling. Waste Management,
25(7):669–679. Retrieved from
http://www.sciencedirect.com/science/article/pii/S0956053X04001850
[Accessed 29 July 2015].
Engledow, S. 2005. The strategic assessment of a curbside recycling initiative in Cape
Town as a tool for integrated waste management. Unpublished master’s thesis.
Cape Town: University of Cape Town.
Engledow, S. 2007. Integrated analysis solid waste baseline report. Stellenbosch:
Sustainability Institute
Escalante, N. 2012. Model conceptualization for sustainable waste and resource
management policy design in low and middle-income countries. In Proceedings
of the 30th International Conference of the System Dynamics Society. 1–19.
European Commission. 2010. Waste generation. Eurostat. Retrieved from
http://epp.eurostat.ec.europa.eu/portal/page/portal/waste/data/database [Accessed
29 January 2017].
European Union. 2008. Directive 2008/98/EC of the European Parliament and of the
Council. Retrieved from http://eur-lex.europa.eu/eli/dir/2008/98/oj [Accessed 20
January 2017]
Gertsakis, J. & Lewis, H. 2003. Sustainability and the waste management hierarchy.
Retrieved from http://www.ecorecycle.vic.gov.au/resources/documents/TZW_-
_Sustainability_and_the_Waste_Hierarchy_(2003).pdf [Accessed 8 October
2017].
Girardet, H. 1996. The Gaia Atlas of Cities: New directions for sustainable urban
living. London: Gaia Books Limited
Gratz, R. 2013. Curitiba: An environmental showcase. Retrieved from
http://www.huffingtonpost.com/roberta-brandes-gratz/curitiba_b_3713953.html
[Accessed 5 September 2017].
Grazhdani, D. 2016. Assessing the variables affecting on the rate of solid waste
generation and recycling: An empirical analysis in Prespa Park. Waste
Management, 48:3–13.
Gutberlet, J. 2015. More inclusive and cleaner cities with waste management co-
production: Insights from participatory epistemologies and methods. Habitat
International, 46:234–243. Retrieved from
http://linkinghub.elsevier.com/retrieve/pii/S0197397514001428 [Accessed 29
January 2017].
Hyman, K. 2011. Economic development, decoupling and urban infrastructure: The
role of innovation for an urban transition in Cape Town. Unpublished master’s
thesis. Cape Town: University of Cape Town.
Inghels, D. & Dullaert, W. 2010. An analysis of household waste management policy
using system dynamics modelling. Waste Management & Research, 29(4):351–
370.
Intharathirat, R. Salam, P. & Untong, A. 2015. Forecasting of municipal solid waste
quantity in a developing country using multivariate grey models. Waste
Management, 39:3–14. doi: 10.1016/j.wasman.2015.01.026
Maani, K. & Cavani, R. 2007. Systems thinking, system dynamics: Managing change
and complexity (N. Lampon & T. Media, eds.). Auckland: Pearson.
Karak, T., Bhagat, R.M. & Bhattacharyya, P. 2012. Municipal solid waste generation,
composition, and management: The world scenario. Critical Reviews in
Environmental Science and Technology, 42(15):1509–1630.
Karavezyris, V., Timpe, K.P. & Marzi, R. 2002. Application of system dynamics and
Stellenbosch University https://scholar.sun.ac.za

79 | P a g e
fuzzy logic to forecasting of municipal solid waste. Mathematics and Computers
in Simulation, 60(3–5):149–158.
Karija, M.K. & Lukaw, Y.S. 2013. The impact of poor municipal solid waste
management practices and sanitation status on water quality and public health in
cities of the least developed countries: The case of Juba, South Sudan.
International Journal of Applied Science and Technology, 3(4):87–99.
Kaushal, R.K., Varghese, G.K. & Chabukdhara, M. 2015. Municipal solid waste
management in India: Current state and future challenges: A review. International
Journal of Engineering Science and Technology, 4(4): 1473-1489.
Kollikkathara, N., Feng, H. & Yu, D. 2010. A system dynamic modeling approach for
evaluating municipal solid waste generation, landfill capacity and related cost
management issues. Waste Management, 30(11):2194–2203. Retrieved from
http://www.sciencedirect.com/science/article/pii/S0956053X10002977
[Accessed 29 July 2015].
Lea0, S., Bishop, I. & Evans, D. 2004. Spatial–temporal model for demand and
allocation of waste landfills in growing urban regions. Computers, Environment
and Urban Systems, 28:353–385.
Leao, S., Bishop, I. & Evans, D. 2001. Assessing the demand of solid waste disposal in
urban region by urban dynamics modelling in a GIS environment. Resources,
Conservation and Recycling, 33(4):289–313. Retrieved from
http://www.sciencedirect.com/science/article/B6VDX-4475S7P-
3/2/bdda11d76f48ea8214ac93591b78ab8c [Accessed 15 April 2017].
Lin, C. & Ying, L. 2013. Application of system dynamics for municipal waste
management in China: A case study of Beijing. Retrieved from
http://nswaienvis.nic.in/Waste_Portal/Case_Studies/Application%20of%20Syste
m%20Dynamics%20for%20Municipal%20Waste%20Mangement%20in%20Chi
na-%20A%20case%20study,%20Beijing.pdf [Accessed 29 January 2017]
Luna-Reyes, L.F. & Andersen, D.L. 2003. Collecting and analyzing qualitative data for
system dynamics: Methods and models. System Dynamics Review, 19(4):271–296.
Luyt, T. 2015. Implications of urbanisation on future domestic waste flows in the City
of Cape Town. Stellenbosch: Stellenbosch University.
Marshall, R.E. & Farahbakhsh, K. 2013. Systems approaches to integrated solid waste
management in developing countries. Waste Management, 33(4):988–1003. doi:
10.1016/j.wasman.2012.12.023
Mazzanti, M. & Zoboli, R. 2008. Waste generation, incineration and landfill diversion:
de-coupling trends, socio-economic drivers and policy effectiveness in the EU.
Working paper. Retrieved from
http://ideas.repec.org/p/fem/femwpa/2008.94.html [Accessed 9 April 2017].
Mesjasz-Lech, A. 2014. Municipal waste management in context of sustainable urban
development. Procedia - Social and Behavioral Sciences, 151:244–256. Retrieved
from http://linkinghub.elsevier.com/retrieve/pii/S1877042814054652 [Accessed
29 January 2017].
Miezah, K., Obiri-Danso, K., Kádár, Z., Fei-Baffoe, B. & Mensah, M. 2015. Municipal
solid waste characterization and quantification as a measure towards effective
waste management in Ghana. Waste Management, 46:15–27. doi:
10.1016/j.wasman.2015.09.009
Mohammad, B. & Jalil, M. 2013. Practical guidelines for conducting research:
summarising good research practice in line with DCED Standard.
OECD (Organisation for Economic Co-operation and Development). 2002. Waste
prevention: Toward performance indicators. Retrieved from
Stellenbosch University https://scholar.sun.ac.za

80 | P a g e
http://www.oecd.org/officialdocuments/publicdisplaydocumentpdf/?doclanguage
=en&cote=env/epoc/wgwpr/se(2002)1/FINAL [Accessed 8 April 2017].
Oelofse, S. & Godfrey, L. 2009. The state of domestic waste management in South
Africa. CSIR. Retrieved from
http://www.csir.co.za/nre/docs/BriefingNote2009_1_waste_FINAL_Des_09.pdf
[Accessed 29 January 2017].
Ogola, J., Chimuka, L. & Tshivhase, S. 2011. Management of municipal solid wastes:
A case study in Limpopo province, South Africa. Integrated Waste Management.
Retrieved from
http://scholar.google.com/scholar?hl=en&btnG=Search&q=intitle:Management+
of+Municipal+Solid+Wastes+:+A+Case+Study+in+Limpopo+Province+,+South
+Africa#1%5Cnhttp://scholar.google.com/scholar?hl=en&btnG=Search&q=intitl
e:Management+of+municipal+solid+wastes:+A [Accessed 29 July 2017].
Oyoo, R., Leemans, R. & Mol, A.P.J. 2011. Future projections of urban waste flows
and their impacts in African metropolises cities. International Journal of
Environmental Reserach, 5(3):705–724.
Pai, R., Rodrigues, L., Mathew, A. & Hebber, S. 2014. Impact of urbanization on
municipal solid waste management: A system dynamics approach. International
Journal of Renewable Energy and Environmental Engineering, 2(1): 31-37
Phiri, A., Godfrey, L. & Snyman, D. 2012. Modeling the generation of domestic waste
for supporting the planning of municipal waste services. International Journal of
Water Resources and Environmental Engineering, 4(6):171–191.
Pires, A., Martinho, G. & Chang, N.-B. 2011. Solid waste management in European
countries: A review of systems analysis techniques. Journal of Environmental
Management, 92(4):1033–1050. doi: 10.1016/j.jenvman.2010.11.024
PwC. 2014. Western Cape population projections: 2011–2040. Cape Town.
RSA (Republic of South Africa). 2014. National Environmental Management: Waste
Amendment Act. Government Gazette, 588(37714). Pretoria: Government
Printers.
Rimaityte, I., Ruzgas, T., Denafas, G., Racys, V. & Martuzevicius, D. 2012.
Application and evaluation of forecasting methods for municipal solid waste
generation in an Eastern-European city. Waste Management & Research, 30(1):
89-98.
Seadon, J.K. 2010. Sustainable waste management systems. Journal of Cleaner
Production, 18(16/17):1639–1651. doi: 10.1016/j.jclepro.2010.07.009
Singh, V. 2009. System modeling and simulation. New Delhi: New Age International.
Sterman, J. 2000. Systems thinking and modeling for a complex world. Boston, MA:
Jeffrey J. Shelstad.
Sufian, M.A. & Bala, B.K. 2007. Modeling of urban solid waste management system:
The case of Dhaka city. Waste Management, 27(7):858–868.
Suthar, S. & Singh, P. 2015. Household solid waste generation and composition in
different family size and socio-economic groups: A case study. Sustainable Cities
and Society, 14(1):56–63. doi:10.1016/j.scs.2014.07.004
Swilling, M. 2014. Contesting inclusive urbanism in a divided city: The limits to the
neoliberalisation of Cape Town’s energy system. Urban Studies, 51(15):3180–
3197.
Swilling, M. 2006. Sustainability and infrastructure planning in South Africa: A Cape
Town case study. Environment & Urbanization, 18(1):23–50.
Swilling, M. & Annecke, E. 2012. Cape Town’s contested urbanisms. In Just
transitions: Explorations of sustainability in an unfair world. Cape Town:
Stellenbosch University https://scholar.sun.ac.za

81 | P a g e
University of Cape Town Press, 246-279.
Troschinetz, A.M. & Mihelcic, J.R. 2009. Sustainable recycling of municipal solid
waste in developing countries. Waste Management, 29(2):915–923.
doi:10.1016/j.wasman.2008.04.016
UNEP (United Nations Environment Programme). 2000. Basel Convention on the
Control of Transboundary Movements of Hazardous Waste and their Disposal.
Retrieved from http://www.basel.int/Portals/4/Basel Convention/docs/text/con-e-
rev.pdf [Accessed 29 January 2017].
UNEP (United Nations Environment Programme). 2002. Waste management planning:
An environmentally sound approach for sustainable urban waste management.
Retrieved from http://www.gdrc.org/uem/waste/waste-planning.html [Accessed
29 January 2017].
UNEP (United Nations Environment Programme). 2005. Solid waste management.
Retrieved from http://www.unep.org/ietc/Portals/136/SWM-Vol1-Part1-
Chapters1to3.pdf [Accessed 29 January 2017].
UNEP (United Nations Environment Programme). 2009. Developing integrated solid
waste management plan. Retrieved from
http://www.unep.or.jp/ietc/Publications/spc/ISWMPlan_Vol4.pdf [Accessed 19
March 2017].
UNEP (United Nations Environment Programme). 2015. Waste crime – waste risks.
Retrieved from http://www.unep.org/delc/Portals/119/publications/rra-
wastecrime.pdf [Accessed 29 January 2017].
UN-Habitat (United Nations Human Settlements Programme). 2008. The state of
African cities 2008: A framework for addressing urban challenges in Africa.
Nairobi.
UN-Habitat (United Nations Human Settlements Programme). 2010. Solid waste
management in the world’s cities: Water and sanitation in the world’s cities.
London.
UN-Habitat (United Nations Human Settlements Programme). 2012. Urban patterns
for a green economy: Leveraging density. Nairobi.
UN-Habitat (United Nations Human Settlements Programme). 2014. The state of
African cities 2014: Re-imagining sustainable urban transitions. Nairobi.
United Nations. 2011. Shanghai manual: A guide for sustainable urban development in
the 21st century. Shanghai.
United Nations. 2014. World urbanization prospects: The 2014 revision, highlights
(ST/ESA/SER.A/352). New York, NY.
Vaz, M. N.d. Curitiba recycling. Retrieved from
http://mariavazphoto.com/curitiba_pages/curitiba_recycling.html [Accessed 5
September 2017].
Vesiland, P. & Worrell, W. 2012. Solid waste engineering. Stamford: Cengage
Learning.
Wei, Y. Xue, Y., Yin, J. & Ni, W. 2013. Prediction of municipal solid waste generation
in China by multiple linear regression method. International Journal of Computers
and Applications, 35(3):136–140. doi: 10.2316/Journal.202.2013.3.202-3898
Western Cape Government. 2013. State of Environment Outlook Report for the Western
Cape Province: Waste Management Chapter. Cape Town.
Western Cape Government Provincial Treasury. 2014. Socio-economic profile City of
Cape Town. Cape Town.
Wilson, D.C. 2007. Development drivers for waste management. Waste Management
& Research, 25(3):198–207. doi: 10.1177/0734242X07079149
Stellenbosch University https://scholar.sun.ac.za

82 | P a g e
Wilson, D.C., Velis, C.A. & Rodic, L. 2013. Integrated sustainable waste management
in developing countries. Proceedings of the Institute of Civil Engineers: Waste and
Resource Management, 166(2):52–68. Retrieved from
http://www.icevirtuallibrary.com/content/article/10.1680/warm.12.00005
[Accessed 29 January 2016].
Stellenbosch University https://scholar.sun.ac.za