dynamic - folk.uio.nofolk.uio.no/rnymoen/econ3410_v04_dynamic.pdf · target variable. the following...
TRANSCRIPT

Dynamic models
Ragnar NymoenFirst version: August 14. 2003This version: January 12. 2004
This is note is written for the course ECON 3410 /4410 International macro-economics and finance. The note reviews the key concepts and models needed tostart addressing economic dynamics in a systematic way. The level of mathematicsused does not go beyond simple algebra. References to the textbooks by Burda andWyplosz (B&W hereafter) and Rødseths Open Economy Macroeconomics (OEMhereafter) are integrated several places in the text.
Section 8 applies the models and concepts to wage and price dynamics. After youhave worked through the note, you should have a good understanding of conceptsand models with a wide range of applications in macroeconomics, as well as anunderstanding of wage and price dynamics of small open economies that goes beyondCh. 12 in B&W.
1 Introduction
In many areas of economics, time plays an important role: firms and households donot react instantly to changes in for example taxes, wages and business prospects buttake time to adjust their decisions and habits. Moreover, because of information andprocessing lags, time goes by before changes in circumstances are even recognized.There are also institutional arrangements,social and legal agreements and norms thathinder continuous adjustments of economic variables. Annual (or even biannual)wage bargaining rounds is one important example. The manufacturing of goods isusually not instantaneous but takes time, often several years in the case of projectswith huge capital investments. Dynamic behaviour is also induced by the fact thatmany economic decisions are heavily influenced by what firms, households and thegovernment anticipate. Often expectation formation will attribute a large weight topast developments, since anticipations usually have to build on past experience.
Because dynamics is a fundamental feature of the macroeconomy, all seriouspolicy analysis is based on a dynamic approach. Hence those responsible for fiscaland monetary policy use dynamic models as an aid in their decision process. Inrecent years, monetary policy had taken a more prominent and important role inactivity regulation, and as we will explain later in the course, central banks in manycountries have defined the rate of inflation as the target variable of economic policy.The instrument of monetary policy nowadays is the central banks sight deposit rate,i.e., the interest rate on banks’ deposits in the central bank. However, no centralbank hopes for an immediate and strong effect on the rate of inflation after a changein the interest rate. Rather, because of the many dynamic effects triggered by achange in the interest rate, central bank governors prepare themselves to wait a
1

substantial amount of time before the full effect of the interest rate change hits thetarget variable. The following statement from the web pages of Norges Bank [TheNorwegian Central Bank] is typical of many central banks’ view:
A substantial share of the effects on inflation of an interest rate changewill occur within two years. Two years is therefore a reasonable timehorizon for achieving the inflation target of 21
2per cent1
One important aim of this course is to learn enough about dynamic modeling tobe able to understand the economic meaning of a statement like this, and to startforming an opinion about its realism (or lack thereof).
As students of economics you are well acquainted to model based analysis,graphical or algebraic. Presumably, most of the models you have used have beenstatic, since time has played no essential part in the model formulation or in theanalysis. This note therefore starts, in section 2, by contrasting static models withmodels which have a dynamic formulation. Typically, dynamic models give a betterdescription of macroeconomic time series data than static models. A variable yt iscalled a time series if we observe it over a sequence of time periods represented bythe subscript t., i.e., {yT , yT−1, ..., y1} if we have observations from period 1 to T .Usually, we use the simpler notation yt, t = 1, ...., T , and if the observation periodis of no substantive interest, that too is omitted. The interpretation of the timesubscript varies from case to case, it can represent a year, a quarter or a month.In macroeconomics other periods are also considered, such as 5-year or 10 yearaverages of historical data, and daily or even hourly data at the other extreme (e.g.,exchange rates, stock prices, money market interest rates). In section 2 we discuss insome detail an example where yt is (the logarithm) of private consumption, and weconsider both static and dynamic models of consumption (consumption functions).
The Norges Bank quotation above is interesting because it is a clear statementabout the time lag between a policy change and the effect on the target variable.Formally, response lags correspond to the concept of the dynamic multiplier whichis introduced in section 3. The dynamic multiplier is a key concept in this course,and once you get a good grip on it, you also have a powerful tool which allows youto calculate the dynamic effects of policy changes (and of other exogenous shocksfor that matter) on important variables like consumption, unemployment, inflationor other variables of your interest.
After having emphasized the difference between static and dynamic models,in section 2 and 3, the next two sections (4 and 5) shows that there is a way ofreconciling the two approaches (section 4), and that for some purposes we can becomfortable with using a static model formulation as long as we are aware of itslimitations (section 5).
Section 6 shows briefly that underlying both dynamic policy analysis and thecorrespondence between dynamic and static formulations, is the nature of the so-lution of dynamic models. Section 7 sketches how the analysis can be extended tosystems of equations with a dynamic specification. Finally, section 8 applies theanalysis to wage and price dynamics.
1http://www.norges-bank.no/english/monetary_policy/in_norway.html.Similar statements can be found on the web pages of the central banks in e.g., Autralia, New-
Zealand, The United Kingdom and Sweden.
2

2 Static and dynamic models
When we consider economic models to be used in an analysis of real world macrodata, care must be taken to distinguish between static and dynamic models. Thewell known textbook consumption function, i.e., the relationship between privateconsumption expenditure (C) and households’ disposable income (Y ) is an exampleof a static equation
(2.1) Ct = f(INCt), f 0 > 0.
Consumption in any period t is strictly increasing in income, hence the positivesigned first order derivative f 0–the marginal propensity to consume. To be able toapply the theory to observations of the real economy we have to specify the functionf(INCt). Two of the most popular functional forms are the so called linear andlog-linear specifications:
Ct = β0 + β1INCt + et, (linear)
lnCt = β0 + β1 ln INCt + et, (log-linear)(2.2)
For simplicity, we use the same symbols for the coefficients in the two equationsbut it is important to note that the slope coefficient β1 has a different economicinterpretation in the two cases. In (2.2), β1 it is the marginal propensity to consume(MPC for short), and is assumed to be a constant parameter. In the log linear model(2.2) β1 is the elasticity of consumption in period t with respect to income, thus β1measures the percentage increase in Ct following a 1% increase in INC. Hence thelog-linear specification in (2.2) implies that the marginal propensity to consume isitself a function of income. In that sense, the log-linear model is the least restrictiveof the two, and in the rest of this example we use that specification.
Exercise 1 Show that, after setting et = 0 (for convenience),MPC ≡ ∂Ct/∂INCt =
k · β1INCβ1−1t , where k = exp(β0).
Macroeconomic textbooks usually omit the term et in equation (2.2), but forapplications of the theory to actual data it is a necessary to get an intuitive gripon this disturbance term in the static consumption function. So: let us considerreal data corresponding to Ct and Yt, and assume that we have really good wayof quantifying the intercept β0 and the marginal propensity to consume β1. Youwill learn about so called least-squares estimation in courses in econometrics, butintuitively, least-squares estimation is a way of finding the numbers for β0 and β1that give the on average best prediction of Ct for a given value of Yt. Using quarterlydata for Norway, for the period 1967(1)-2002(4)–the number in brackets denotesthe quarter–we obtain by using the least squares method in PcGive:
(2.3) ln Ct = 0.02 + 0.99 ln INCt
where the “hat” in Ct is used to symbolize the fitted value of consumption given theincome level INCt. Next, use (2.2) and (2.3) to define the residual et:
(2.4) et = lnCt − ln Ct,
3

which is the empirical counterpart to et.
11.0 11.1 11.2 11.3 11.4 11.5 11.6 11.7 11.8 11.9 12.0
11.0
11.2
11.4
11.6
11.8
12.0
ln C
t
ln INCt
Figure 1: The estimated model in (2.3), see text for explanation.
In figure 1 we show a cross-plot of the 140 observations of consumption andincome (in logarithmic scale), each observation is marked by a +. The straight linerepresents the linear function in equation (2.3), and for each observation we have alsodrawn the distance up (or down) to the line. These “projections” are the graphicalrepresentation of the residuals et.
Clearly, if we are right in our arguments about how pervasive dynamic behav-iour is in economics, (2.2) is a very restrictive formulation. All adjustments to achange in income are assumed to be completed in a single period, and if incomesuddenly changes next period, consumer’s expenditure changes suddenly too. A dy-namic model is obtained if we allow for the possibility that also period t− 1 incomeaffects consumption, and that e.g., habit formation induces a positive relationshipbetween period t− 1 and period t consumption:
(2.5) lnCt = β0 + β1 ln INCt + β2 ln INCt−1 + α lnCt−1 + εt
The literature refers to this type of model as an autoregressive distributed lag model,ADL model for short. “Autoregressive” is due to the presence of lnCt−1 on theright hand side of the equation, so that consumption today depends on its own past.“Distributed lag” refers to the presence of lagged as well as current income in themodel.
How can we investigate whether equation (2.5) is indeed a better descriptionof the data than the static model? The answer to that question brings us in thedirection of econometrics, but intuitively, one indication would be if the empirical
4

counterpart to the disturbance of (2.5) are smaller and less systematic than theerrors of equation (2.2). To test this, we obtain the residual εt, again using themethod of least squares to find the best fit of lnCt according to the dynamic model:
(2.6) ln Ct = 0.04 + 0.13 ln INCt + 0.08 ln INCt−1 + 0.79 lnCt−1
Figure 2 shows the two residual series et and εt, and it is immediately clear thatthe dynamic model in (2.6) is a much better description of the behaviour of privateconsumption than the static model (2.3). As already stated, this is a typical findingwith macroeconomic data.
1965 1970 1975 1980 1985 1990 1995 2000
−0.25
−0.20
−0.15
−0.10
−0.05
0.00
0.05
0.10
0.15
Residuals of (2.7) Residuals of (2.4)
Figure 2: Residuals of the two estimated consumptions functions (2.3), and (2.6).
Judging from the estimated coefficients in (2.6), one main reason for the im-proved fit of the dynamic model is the lag of consumption itself. That the laggedvalue of the endogenous variable is an important explanatory variable is also a typ-ical finding, and just goes to show that dynamic models represent essential tools forempirical macroeconomics. The rather low values of the income elasticities (0.130and 0.08) may reflect that households find that a single quarterly change in incomeis “too little to build on” in their expenditure decisions. As we will see below, theresults in (2.6) imply a much higher impact of a permanent change in income.
3 Dynamic multipliers
The quotation from Norges Bank’s web pages on monetary policy shows that theCentral Bank has formulated a view about the dynamic effects of a change in theinterest rate on inflation. In the quotation, the Central Bank states that the effect
5

will take place within two years, i.e., 8 quarters in a quarterly model of the relation-ship between the rate of inflation and the rate of interest. That statement may betaken to mean that the effect is building up gradually over 8 quarters and then diesaway quite quickly, but other interpretations are also possible. In order to informthe public more fully about its view on the monetary policy transmission mecha-nism (see topic 5 in our course), the Bank would have to report a set of dynamicmultipliers. Similar issues arise in almost all areas of applied macroeconomic, it isof vital interest to form an opinion on how fast an exogenous shock or policy changeaffects a variable of interest. The key concept needed to make progress on this isthe dynamic multiplier.
In order to explain the derivation and interpretation of dynamic multipliers,we first show what our estimated consumption function implies about the dynamiceffect of a change in income, see section 3.1. We then derive dynamic multipliersusing a general notation for autoregressive distributed lag models, see 3.2.
3.1 Dynamic effects of increased income on consumptionWe want to consider what the estimated model in (2.6) implies about the dynamicrelationship between income and consumption. For this purpose there is no pointto distinguish between fitted and actual values of consumption, so we drop the ˆabove Ct.
Assume that income rises by 1% in period t, so instead of INCt we haveINC 0
t = INCt(1 + 0.01). Since income increases, consumption also has to rise.Using (2.6) we have
ln(Ct(1 + δc,0)) = 0.04 + 0.13 ln(INCt(1 + 0.01)) + 0.08 ln INCt−1 + 0.79 lnCt−1
where δc,0 denotes the relative increase in consumption in period t, the first period ofthe income increase. Using the approximation ln(1+δc,0) = δc,0 when −1 < δc,0 < 1,and noting that
lnCt − 0.04− 0.13 ln INCt − 0.08 ln INCt−1 − 0.79 lnCt−1 = 0,
we obtain δc,0 = 0.0013 as the relative increase in Ct. In other words, the immediateeffect of a one percent increase in INC is a 0.13% rise in consumption.
The effect on consumption in the second period depends on whether the risein income is permanent or only temporary. It is convenient to first consider thedynamic effects of a permanent shock to income. Note first that equation (2.6)holds also for period t+ 1, i.e.,
lnCt+1 = 0.04 + 0.13 ln INCt+1 + 0.08 ln INCt + 0.79 lnCt
before the shock, and
ln(Ct+1(1 + δc,1)) = 0.04 + 0.13 ln(INCt+1(1 + 0.01))
+0.08(ln INCt(1 + 0.01)) + 0.79 ln(Ct(1 + δc,0)),
after the shock. Remember that in period t+1 not only INCt+1 have changed, butalso INCt and period t consumption (by δc,0). From this, the relative increase inCt in period t+ 1 is
δc,1 = 0.0013 + 0.0008 + 0.79× 0.0013 = 0.003125,
6

or 0.3%. By following the same way of reasoning, we find that the percentageincrease in consumption in period t+ 2 is 0.46% (formally δc,2 × 100).
Since δc,0 measures the direct effect of a change in INC, it is usually calledthe impact multiplier, and can be defined directly by taking the partial derivative∂ lnCt/∂ ln INCt in equation (2.6) (more on the relationship between derivativeand multipliers in section 3.2 below). The dynamic multipliers δc,1, δc,2, ...δc,∞ arein their turn linked by exactly the same dynamics as in equation (2.6), namely
(3.7) δc,j = 0.13δinc,j + 0.08δinc,j−1 + 0.79δc,j−1, for j = 1, 2, ....∞.
For example, for j = 3, and setting δinc,3 = δinc,2 = 0.01 since we consider apermanent rise in income, we obtain
δc,3 = 0.0013 + 0.0008 + 0.79× 0.0046 = 0.005734or 0.57% in percentage terms. Clearly, the multipliers increase from period to period,but the increase is slowing down since in (3.7) the last multiplier is always multipliedby the coefficient of the autoregressive term, which is less than 1. Eventually, thesequence of multipliers are converge to what we refer to as the long-run multiplier.Hence, in (3.7) if we set δc,j = δc,j−1 = δc,long−run we obtain
δc,long−run =0.0013 + 0.0008
1− 0.79 = 0.01,
meaning that according to the estimated model in (2.6), a 1% permanent increasein income has a 1% long-run effect on consumption.
Remember that the set of multipliers we have considered so far represent thedynamic effects of a permanent rise in income, and they are shown for conveniencein the first column of table 2. In contrast, a temporary rise in income (by 0.01) inequation (2.6) gives rise to another sequence of multipliers: The impact multiplier isagain 0.0013, but the second multiplier becomes 0.13×0+0.08×0.01+0.79×0.0013= 0.0018, and the third is found to be 0.79× 0.0018 = 0.0014, so these multipliersare rapidly approaching zero, which is also the long-run multiplier in this case.
Table 1: Dynamic multipliers of the estimated consumption function in (2.6), per-centage change in consumption after a 1 percent rise in income.
Permanent 1% change Temporary 1% changeImpact period 0.13 0.13
1. period after shock 0.31 0.182. period after shock 0.46 0.14
... ... ...long-run multiplier 1.00 0.00
Table 2: Dynamic multipliers of the estimated consumption function in (2.6), per-centage change in consumption after a 1 percent rise in income.
If you supplement the multipliers in the column to the right with a few more periodsand then sum the whole sequence you find that the sum is close to 1, which is thelong-run multiplier of the permanent change. A relationship like this always holds,
7

no matter what the long-run effect of the permanent change is estimated to be.Heuristically, another way to think about the effect of a permanent change in anexplanatory variable, is as the sum of the changes triggered by a temporary change.In this sense, the dynamic multipliers of a temporary change is the more fundamentalof the two, since the dynamic effects of permanent shock can be calculated in asecond step. Also, perhaps for this reason, many authors reserve the term dynamicmultiplier for the effects of a temporary change and use a different term–cumulatedmultipliers–for the dynamic effects of a permanent change. However, as long as oneis clear about which kind of shock we have in mind, no misunderstandings shouldoccur by the term dynamic multipliers in both cases.
0 20 40 60
0.05
0.10
Dynamic consumtion multipliers (temporary change in income)
Perc
enta
ge c
hang
e
Period
0 20 40 60
0.25
0.50
0.75
1.00Temporary change in income
Perc
enta
ge c
hang
e
Period
0 20 40 60
0.25
0.50
0.75
1.00
Dynamic consumption multipliers (permanent change in income)
Perc
enta
ge c
hang
e
Period
0 20 40 60
0.95
1.00
1.05
1.10Permanent change in income
Perc
enta
ge c
hang
e
Period
Figure 3: Temporary and permanent 1 percent changes in income with associateddynamic multipliers of the consumption function in (2.6).
Figure 3 shows graphically the two classes of dynamic multipliers, again for ourconsumption function example. First, we have the temporary change in income, andbelow that the consumption multipliers. Correspondingly, to the right we show thegraphs with permanent shift in income and the (cumulated) dynamic multipliers.2
3.2 General notationAs noted in the consumption function example, the impact multiplier is (after con-venient scaling by 100) identical to the (partial) derivative of Ct with respect to
2These graphs were constructed using PcGive and GiveWin, but it is of course possible to useExcel or other programs.
8

INCt. We now establish more formally that also the second, third and higher ordermultipliers can be interpreted as derivatives. At this stage it is also convenient tointroduce the general notation for the autoregressive distributed lag model. In (3.8),yt is the endogenous variable while the xt and xt−1 make up the distributed lag partof the model:
(3.8) yt = β0 + β1xt + β2xt−1 + αyt−1 + εt.
In the same way as before, εt symbolizes a small and random part of yt which isunexplained by xt and xt−1 and the lagged endogenous variable yt−1.
In many applications, as in the consumption function example, y and x are inlogarithmic scale, due to the specification of a log-linear functional form. However,in other applications, different units of measurement are the natural ones to use.Thus, frequently, y and x are measured in million kroner, in thousand persons orin percentage points. Mixtures of measurement are also frequently used in practice:for example in studies of labour demand, yt may denote the number of hours workedin the economy (or by an individual) while xt denotes real wage costs per hour. Themeasurement scale does not affect the derivation of the multipliers, but care mustbe taken when interpreting and presenting the results. Specifically, only when bothy and x are in logs, are the multipliers directly interpretable as percentage changesin y following a 1% increase in x, i.e., they are (dynamic) elasticities.
To establish the connection between dynamic multipliers and the derivativesof yt, yt+1, yt+2, ...., it is convenient to define xt, xt+1, xt+2, , .... as functions of acontinuous variable h. When h changes permanently, starting in period t,we have∂xt/∂h > 0, but no change in xt−1 or in yt−1 since those variables are predetermined,in the period of the shock. Since xt is a function of h, so is yt, and the effect of ytof the change in h is founds as
∂yt∂h
= β1∂xt∂h
.
It is customary to consider “unit changes” in the explanatory variable (correspondingto the 1% change in income in the consumption function example), which meansthat we let ∂xt/∂h = 1. Hence the first multiplier is
(3.9)∂yt∂h
= β1.
The second multiplier is found by considering the equation for period t+ 1, i.e.,
yt+1 = β0 + β1xt+1 + β2xt + αyt + εt+1.
and calculating the derivative ∂yt+1/∂h. Note that, due to the change in h occurringalready in period t, both xt+1 and xt have changed , i.e., ∂xt+1/∂h > 0 and ∂xt/∂h >0. Finally, we need to keep in mind that also yt is a function of h, hence:
(3.10)∂yt+1∂h
= β1∂xt+1∂h
+ β2∂xt∂h
+ α∂yt∂h
Again, considering a unit change, and using (3.9), the second multiplier can bewritten as
(3.11)∂yt+1∂h
= β1 + β2 + αβ1 = β1(1 + α) + β2
9

To find the third derivative, consider
yt+2 = β0 + β1xt+2 + β2xt+2 + αyt+1 + εt+2.
Using the same logic as above, we obtain
∂yt+2∂h
= β1∂xt+2∂h
+ β2∂xt+1∂h
+ α∂yt+1∂h
(3.12)
= β1 + β2 + α∂yt+1∂h
= β1(1 + α+ α2) + β2(1 + α)
where the unit-change, ∂xt/∂h = ∂xt+1/∂h = 1, is used in the second line, andthe third line is the result of substituting ∂yt+1/∂h out with the right hand side of(3.11).
Comparing, equation (3.10) and the first line of (3.12) there is a clear pattern:The third and second multipliers are linked by exactly the same form of dynamicsthat the govern the y variable itself. This also holds for higher order multipliers,and means that the multipliers can be computed recursively: Once we have foundthe second multiplier, the third can be found easily using the second line of (3.12).
Table 3 shows summary of the results. In the table, we use the notation δj(j = 0, 1, 2, ...) for the multipliers. For, example δ0 is identical to ∂yt/∂h, and δ2 isidentical to the third multiplier, ∂yt+2/∂h above. In general, because the multipliersare linked recursively, multiplier number j + 1 is given as
(3.13) δj = β1 + β2 + αδj−1, for j = 1, 2, 3, . . .
In the consumption function example, we saw that as long as the autoregressiveparameter is less than one, the sequence of multipliers is converging towards a longrun multiplier. In this more general case, the condition needed for the existence of along run multiplier is that α is less than one in absolute value, formally −1 < α < 1.In the next section, this condition is explained in more detailed. section. For thepresent purpose we simply assume that the condition holds, and define the long runmultiplier as δj = δj−1 = δlong−run. Using (3.13), the expression for δlong−run isfound to be
(3.14) δlong−run =β1 + β21− α
, if − 1 < α < 1.
Clearly, if α = 1, the expression does not make sense mathematically, since thedenominator is zero. Economically, it doesn’t make sense either since the longrun effect of a permanent unit change in x is an infinitely large increase in y (ifβ1+β2 > 0). The case of α = −1, may at first sight seem to be acceptable since thedenominator is 2, not zero. However, as explained below, the dynamics is essentiallyunstable also in this case meaning that the long run multiplier is not well definedfor the case of α = −1.
10

Table 3: Dynamic multipliers of the general autoregressive distributed lag model.
ADL model: yt = β0 + β1xt + β2xt−1 + αyt−1 + εt.
Permanent unit change in x(1) Temporary unit change in x(2)
1. multiplier: δ0 = β1 δ0 = β12. multiplier: δ1 = β1 + β2 + αδ0 δ1 = β2 + αδ03. multiplier: δ2 = β1 + β2 + αδ1 δ2 = αδ1
......
...j+1 multiplier δj = β1 + β2 + αδj−1 δj = αδj−1
long-run δlong−run =β1+β21−α 0
notes: (1) As explained in the text, ∂xt+j/∂h = 1, j = 0, 1, 2, ...(2) ∂xt/∂h = 1, ∂xt+j/∂h = 0, j = 1, 2, 3, ...If y and x are in logs, the multipliers are in percent.
Exercise 2 Use the numbers from the estimated consumption function and checkthat by using the formulae of Table 3, you obtain the same numerical results as insection 3.1.
Exercise 3 Check that you understand, and are able to derive the results in thecolumn for a temporary change in xt in Table 3.
3.3 Multipliers in the text books to this courseAs already noted in the introduction, the distinction between short and long-runmultipliers permeates modern macroeconomics, and so is not special to the con-sumption function example above! The reader is invited to be on the look-out forexpressions like short and long-run effects/multipliers/elasticities in the textbook byBurda andWyplosz (2001). One early example in the book is found in Chapter 8, onmoney demand, Table 8.4. Note the striking difference between the short-run andlong-run multipliers for all countries, a direct parallel to the consumption functionexample we have worked through in this section. Hence, the precise interpretationof (log) linearized money demand function in B&W’s Box 8.4 is as a so called steadystate relationship, thus the parameter µ is a long-run elasticity with respect to in-come. In the next section of this note, the relationship between long-run multipliersand steady state relationships in explained. The money demand function also playsan important role in Chapter 9 and 10, and in later chapters in B&W.
In the book by B&W , the distinction between short and long-run is a mainissue in Chapter 12, where short and long-run supply curves are derived. For ex-ample, the slope of the short-run curves in figure 12.6 correspond to the impactmultipliers of the respective models, while the vertical long-run curve suggest thatthe long-run multipliers are infinite. In section 8 below, we go even deeper intowage-price dynamics, using the concepts that we have introduced here.
11

Later on in the course we will encounter models of the joint determination ofinflation, output and the exchange rates which are also dynamic in nature, so a goodunderstanding the logic of dynamic multipliers will prove very useful. Interest ratesetting with the aim of controlling inflation is one specific example. However, we willnot always need (or be able to) give a full account of the multipliers of these morecomplex model. Often we will concentrate on the impact and long-run multipliers.
4 Reconciling dynamic and static models
If we compare the long-run multiplier of a permanent shock to the estimated regres-sion coefficient (or elasticity) of a static model, there is often a close correspondence.This is indeed the case in our consumption function example where the multiplieris 1.00 and the estimated coefficient in equation (2.3) is 0.99. This is not a coinci-dence, since the dynamic formulation in fact accommodates a so called steady-staterelationship which is similar to the static model.
To show this, consider again the ADL model:
(4.15) yt = β0 + β1xt + β2xt−1 + αyt−1 + εt.
In the last section we introduced two quite general properties of this model. First itusually explains the behaviour of the dependent variable much better than a simplestatic relationship, which imposes on the data that all adjustments of y to changesin x takes place without delay. Second, it allows us to calculate the very usefuldynamic multipliers. But what does (4.15) imply about the long-run relationshipbetween y and x, the sort of relationship that we expect to hold when both yt andxt are growing with constant rates, a so called steady state situation? To answerthis question it is useful to re-write equation (4.15), so that the relationship betweenlevels and growth becomes clear.
As a first step, we subtract yt−1 from either side of the equation, and thensubtract and add β1xt−1 on the right hand side, we obtain
∆yt = β0 + β1xt + β2xt−1 + (α− 1)yt−1 + εt(4.16)
= β0 + β1∆xt + (β1 + β2)xt−1 + (α− 1)yt−1 + εt
where ∆ is known as the difference operator, defined as ∆zt = zt − zt−1 for a timeseries variable zt. If yt and xt are measured in logarithms (like consumption andincome in our consumption function example) ∆yt and ∆xt are their respectivegrowth rates. Hence, for example, in the previous section
∆ lnCt = ln(Ct/Ct−1) = ln(1 +Ct − Ct−1
Ct−1) ≈ Ct − Ct−1
Ct−1.
The model in (4.16) is therefore explaining the growth rate of consumption by, first,the income growth rate and, second, the past levels of income and consumption.Since the disturbance term is the same in (4.15) and in (4.16), the transformation isoften referred to as an 1-1 transformation. In practice this means that if we insteadof (2.5) above, estimated a relationship with ∆ lnCt on the left hand side, and
12

∆ ln INCt, ln INCt−1 and lnCt−1 on the right hand side, we would obtain exactlythe same residuals εt as before.
For economic interpretation, is useful to collect the level terms yt−1 and xt−1inside a bracket:
(4.17) ∆yt = β0 + β1∆xt − (1− α)
½y − β1 + β2
1− αx
¾t−1+ εt,
and let us assume that we have the following economic theory about the long-runaverage relationship between y and x
(4.18) y∗ = k + γx
Comparison with (4.17) shows that we can identify the parameter γ in the followingway
(4.19) γ ≡ β1 + β21− α
, − 1 < α < 1
meaning that the theoretical slope coefficient γ is identical to the long-run multiplierof the dynamic model.
Consider now a theoretical steady state situation in which growth rates areconstant, ∆xt = gx, ∆yt = gy, and the disturbance term is equal to its mean, εt = 0.Imposing this in (4.17), and using (4.19) gives
gy = β0 + β1gx − (1− α) {y∗ − γx}t−1 .
The term in curly brackets is constant since we consider a steady state, so the timesubscript can be dropped. Re-arranging with y∗ on the left hand side gives
(4.20) y∗ =−gy + β0 + β1gx
1− α+ γx,
which is valid if −1 < α < 1. Comparing the two expressions for y∗ in (4.18) and(4.20) shows that for consistency, the parameter k in (4.18) must be taken to dependon the steady state growth rates which are however parameters just as α, β0 andβ1. Often we only consider a static steady states, with no growth, in that case k issimply β0/(1− α).
In sum, there is an important correspondence between the dynamic model anda static relationship like (4.18) motivated by economic theory:
1. A theoretical linear relationship y∗ = k + γx can be retrieved as the steadystate solution of the dynamic model (4.15). This generalizes to theory modelswith more than one explanatory variable (e.g., y∗ = k + γ1x1 + γ2x2) as longas both x1t and x2t (and/or their lags) are included in the dynamic model. Insection 8 we will discuss some details of this extension in the context of modelsof wage and price setting (inflation).
2. The theoretical slope coefficient γ are identical to the corresponding long-runmultiplier (of a permanent increase in the respective explanatory variables).
13

3. Conversely, if we are only interested in quantifying a long-runmultiplier (ratherthan the whole sequence of dynamic multipliers), it can be found by using theidentity in (4.19).
A reasonable objection to # 3 is that, if we are only interested in the theoreticallong-run slope coefficient, why don’t we simply estimate γ from a static model, ratherthan bother with a dynamic model? After all, in the consumption function example,the direct estimate (2.3) is practically identical to the long-run multiplier which wederived from the estimated dynamic model? The short answer is that, as a rule,static models yields poor estimates of long-run multipliers. To understand why takesus into time series econometrics, but intuitively the direct estimate (from the staticmodel) is only reliable when the theoretical relationship has a really strong presencein the data. This seems to be the case in our consumption function example, but ina majority of applications, the theoretical relationship, though valid, is obscured byslow adjustment and influences from other factors. Therefore, it generally pays offto follow the procedure in of first formulating (and estimating) the dynamic model.
Returning to the beginning of this section, we note that the transformation ofthe ADL model into level and differences is known as the error correction transfor-mation. The name reflects that according to the model, ∆yt corrects past deviationfrom the long run equilibrium relationships.3 The error correction model, ECM,not only helps clarify the link between dynamics and the theoretical steady state, italso plays an essential role in econometric modelling of non-stationary time series.In 2003, when Clive Granger and Rob Engle were awarded the Noble Price in eco-nomics, part of the motivation was their finding that so called cointegration betweentwo or more non-stationary variables implies error correction, and vice versa.
In common usage, the term error correction model is not only used about equa-tion (4.17), where the long run relationship is explicit, but also about (the secondline) of (4.16). One reason is that the long run multipliers (the coefficients of thelong run relationship) can be easily established by estimating the linear relationshipin (4.17) by OLS, and then calculating the ratio γ in (4.19). Direct estimation of γrequires a non-linear estimation method.
5 Role of static models
After all we have said in favour of dynamic models, why don’t we give up staticequations altogether in macroeconomics? The reason, for not taking this extremeview is that after all static models remain the main workhorses of economic analysis, but we need to be clear about their interpretation and limitation. As we haveargued, static models may have two (valid) interpretations in macroeconomics:
1. As (approximate) descriptions of dynamics
2. As corresponding to long-run, steady state, relationships.
3Error correction models became poular in econometrics in the early 1980s. Since ∆yt is ac-tally bringing the level of y towards the long run relationship, a better name may be equilibriumcorrection model. However the term error correction model has stuck.
14

The first rationale may sound like a contradiction of terms, but what we mean isthat it sometimes realistic to assume that the dynamic adjustment process is so fastthat the adjustment to a change in an exogenous variable is completed within theperiod that we have in mind for our analysis. Hence, as a first approximation, wecan do without formulating the dynamic adjustment process in full. An example ofthis rationale “in operation” is the usual IS-LM model (with sticky prices). Whenwe use that model we typically focus on the short-run effects of for example arise in government expenditure. In the longer term, prices will be affected by achange in activity, but that dynamic process is not specified in the IS-LM model.Another, very carefully argued case for a static model, is the model of the market forforeign exchange in the textbook Open Economy Macroeconomics (OEM for short)by Asbjørn Rødseth (2000), see chapter 1 and chapter 3.1. In those models the ideathat the agents in the market adjust so fast that the full effect of a change in apolicy instrument emerges within short time period.
The second rationale for (interpretation of) static models is, of course, theinterpretation that we have highlighted most in this note. Ideally, the two interpre-tations should not be mixed! Nevertheless authors do exactly that, perhaps becausethey need to make short-cuts in order to complete their models and to be able to“tell a story”. Consider for example Ch 12.3 in B&W where equations which rea-sonably can be interpreted as long-run tendencies (interpretation 2 above), namelyequation (12.6) and (12.7) are turned into a seemingly dynamic model by using aalgebraic trick (see section 12.3.4 in B&W) and an ad hoc theory of dynamics inthe mark-up. In section 8 we present two other models of wage-and-price formationwhere the short-run is reconciled with the long-run in a consistent manner.
6 Solution and stability
The reader will probably have noted that the existence of a finite long-run multiplier,and thereby the validity of the correspondence between the ADLmodel and long-runrelationships, depends on the autoregressive parameter α in (4.15) being differentfrom unity. Not surprisingly, α is also all important for the nature and type ofsolution of (4.15).
Mathematically speaking, as long as we have a known initial condition whichis given from history, y0, a solution exists to (4.15).4 The solution can however bestable, unstable or explosive, and in this section discuss the nature of the differentsolutions.
The condition
(6.21) −1 < α < 1
is the necessary and sufficient condition for the existence of a (globally asymptoti-cally) stable solution. The stable solution has the characteristic that asymptoticallythere is no trace left of the initial condition y0. This is easy to see by solving (4.15)forward, starting with period 1 (treating y0 as known). For simplicity, and without
4If we open up for the possibility that the inital condition is not determined by history, butthat it may “jump” due to market forces, expectations etc, there are other solutions to consider.Such solutions play a large role in macroeconomics, but they belong to more advanced courses.
15

loss of generality set β2 = 0 and assume that the exogenous variable xt (sometimescalled the “forcing variable”) takes a constant value mx for the whole length of thesolution period. We also set εt = 0. For the three first periods we obtain
y1 = β0 + β1mx + αy0
y2 = β0 + β1mx + αy1
= β0(1 + α) + β1mx(1 + α) + α2y0
= (β0 + β1mx)(1 + α) + α2y0
y3 = β0 + β1mx + αy2= (β0 + β1mx)(1 + α+ α2) + α3y0
and thus, by induction, for period t
(6.22) yt = (β0 + β1mx)t−1Xs=0
αs + αty0, t = 1, 2, ...
which is the general solution of (4.15) (given the simplifying assumptions just statedβ2 = 0, xt = mx, εt = 0). Next, we consider the stable solution and two unstablesolutions:
Stable solution In this case, condition (6.21) holds. Clearly, as the distance intime between yt and the initial condition increases, y0 exerts less and lessinfluence on the solution. When t becomes large (approaches infinity), the
influence of the initial condition becomes negligible. Sincet−1Xs=0
αs → 11−α as
t→∞, we have asymptotically:
(6.23) y∗ =(β0 + β1mx)
1− α
where y∗ denotes the equilibrium of yt. As stated, y∗ is independent of y0. Notethat ∂y/∂mx = β1/(1−α), the long-run multiplier with respect to x. Finally,note also that (4.20) above, although derived under different assumption aboutthe exogenous variable (namely a constant growth rate), is perfectly consistentwith (6.23).
The stable solution can be written in an alternative and very instructive way.Note first that by using the formula for the sum of the t − 1 first terms in ageometric progression,
t−1Xs=0
αs can be written as
t−1Xs=0
αs =1− αt
(1− α).
Using this result in (6.22), and next adding and subtracting (β0+β1mx)αt/(1−
α) on the right hand side of (6.22), we obtain
yt =(β0 + β1mx)
1− α+ αt(y0 − β0 + β1mx
1− α)(6.24)
= y∗ + αt(y0 − y∗), when − 1 < α < 1.
16

Thus, in the stable case, the dynamic process is essentially correcting theinitial discrepancy (disequilibrium) between the initial level of y and its long-run level.
Unstable solution (hysteresis) When α = 1, we obtain from equation (6.22):
(6.25) yt = (β0 + β1mx)t+ y0, t = 1, 2, ...
showing that the solution contains a linear trend and that the initial conditionexerts full influence over yt even over infinitely long distances. There is ofcourse no well defined equilibrium of yt, and neither is there a finite long-run multiplier. Nevertheless, the solution is perfectly valid mathematicallyspeaking: given an initial condition, there is one and only one sequence ofnumbers y1, y2, ...yT which satisfy the model.
The instability is however apparent when we consider a sequence of solutions.Assume that we first find a solution conditional on y0, and denote the solution{y01, y02, ...y0T}. After one period, we usually want to recalculated the solutionbecause something unexpected has happened in period 1. The updated solu-tion is
©y12, y
13, ...y
1T+1
ªsince we now condition on y1. From (6.25) we see that
as long as y01 6= y1 (the same as saying that ε1 6= 0) we will have y02 − y12 6= 0,y03 − y13 6= 0, ..., y0T − y1T 6= 0. Moreover, when the time arrives to conditionon y3, the same phenomenon is going to be observed again. The solution isindeed unstable in the sense that any (small) change in initial conditions havea permanent effect on the solution. Economists like to refer to this phenom-enon as hysteresis, see Burda and Wyplosz (2001, p 538). In the literature onwage-price setting, the point has been made that failure of wages to respondproperly to shocks to unemployment (in fact the long-run multiplier of wageswith respect to is zero) may lead to hysteresis in the rate of unemployment
The case of α = −1 is more curious, but it is nevertheless useful to check thesolution and dynamics implied by (6.22) also in this case.
Explosive solution When α is greater than unity in absolute value the solution iscalled explosive, for reasons that should be obvious when you consult (6.22).
17

t0
y
y
0
*
time
t 0
y 0
y1
t 1 time
Figure 4: Two stable solutions of 4.15 (corresponding to two values of α, and twounstable solutions (corresponding to two different initial conditions, see text)
Exercise 4 Explain why the two stable solutions in 4 behave so differently!
Exercise 5 Indicate, in the graph for the unstable case, the predicted value for y1given the initial condition y0. What about ε1?
Exercise 6 Sketch a solution path for the explosive solution in a diagram like 4.
7 Dynamic systems
In macroeconomics, the effect of a shock or policy change is usually dependenton system properties. As a rule it is not enough to consider only one (struc-tural/behavioural equation) in order to obtain the correct dynamic multipliers. Con-sider for example the consumption function of section 2 and 3, where we (perhapsimplicitly) assumed that income (INC) was an exogenous variable. This exogene-ity assumption is only tenable given some further assumptions about the rest ofthe economy: for example if there is a general equilibrium with flexible prices (seeBurda and Wyplosz (2001, ch 10.5)) and the supply of labour is fixed, then outputand income may be regarded as independent of Ct. However, with sticky prices and
18

idle resources, i.e., the Keynesian case, INC must be treated as endogenous, and touse the multipliers that we derived in section 3 are in fact misleading.
Does this mean that all that we have said so far about multipliers and stabilityof a dynamic equation is useless (apart from a few special cases)? Fortunately thingsare not that bad. First, it is often quite easy to bring the system on a form with tworeduced form dynamic equations that are of the same form that we have consideredabove. After this step, we can derive the full solution of each endogenous variableof the system (if we so want). Second, there are ways of discussing stability and thedynamic properties of systems, without first deriving the full solution. One suchprocedure is the so called phase-diagram which however goes beyond the scope ofthis course. Third, in many cases the dynamic system is after all rather intuitive andtransparent, so it is possible to give a good account of the dynamic behaviour, simplybased on our understanding of the economics of the problem under consideration.
In this section, we give a simple example of the first approach (finding thesolution) based on the consumption function again. However, it is convenient to usea linear specification:
(7.26) Ct = β0 + β1INCt + αCt−1 + εt
together with the stylized product market equilibrium condition
(7.27) INCt = Ct + Jt
where Jt denotes autonomous expenditure, and INC is now interpreted as the grossdomestic product, GDP. We assume that there are idle resources (unemployment)and that prices are sticky. The 2-equation dynamic system has two endogenousvariables Ct and INCt, while Jt and εt are exogenous.
To find the solution for consumption, simply substitute INC from (7.27), andobtain
(7.28) Ct = β0 + αCt−1 + β2Jt + εt
where β0 and α are the original coefficients divided by (1−β1), and β2 = β1/(1−β1),(what about εt?).
Equation (7.28) is yet another example of a ADL model, so the theory ofthe previous sections applies. For a given initial condition C0 and known valuesfor the two exogenous variables (e.g, {J1, J2, ..., JT}) there is a unique solution. If−1 < α < 1 the solution is asymptotically stable. Moreover, if there is a stablesolution for Ct, there is also a stable solution for INCt, so we don’t have to derivea separate equation for INCt in order to check stability of income.
The impact multiplier of consumption with respect to autonomous expenditureis β2, while in the stable case, the long-run multiplier is β2/(1− α).
Equation (7.28) is called the final equation for Ct. The defining characteristicof a final equation is that (apart from exogenous variables) the right hand side onlycontains lagged values of the left hand side variable. It is often feasible to derivea final equation for more complex system than the one we have studied here. Theconditions for stability is then expressed in terms of the so called characteristic rootsof the final equation. The relationship between α1 and α2 and the characteristicroots goes beyond the scope of this course, but a sufficient condition for stability ofa second order difference equation is that both α1 and α2 are less than one.
19

Exercise 7 In a dynamic system with two endogenous variables, explain why weonly need to derive one final equation in order to check the stability of the system
Exercise 8 In our example, derive the final equation for INCt. What is the re-lationship between the demand multipliers that you are familiar with from simpleKeynesian models, and the impact and long-run multipliers of INC with respect toa one unit change in autonomous expenditure?
20

8 Wage-price dynamics
Inflation denotes the rates of change of the general price level, and is thus a dynamicphenomenon almost by definition. From an empirical point of view we seldom seethat prices and wages make big jumps form one period to the next. Thus inflationrates are typically finite, and in economies with public trust in the monetary andfiscal system, it is even quite moderate for long periods of time. Nevertheless, infla-tion can be highly persistent, and towards the end of last century, the governmentsof the “Western world” invested heavily in curbing inflation. Institutional changestook place (crushing of labour unions in the UK, revitalization of incomes policiesin Norway, a new orientation of monetary policy, the EUs stability pact, etc.), andgovernments even allowed unemployment to rise to level not seen since the 2WW.
Models of wage-price dynamics is therefore of the greatest interest in a courselike ours, as they also represent substantive usage of several of the concepts reviewedabove. In this section we present two very important models of inflation in smallopen economies: the Norwegian model and the Phillips curve. The Norwegianmodel is an extremely interesting example of macroeconomic theory which is basedon realistic assumptions of behavioural regularities. In Norway, it has been a veryimportant framework for analysis and policy. The Phillips curve is of course coveredin every textbook in macroeconomics, and in B&W it is derived in Ch. 12. Below,we attempt to give a fresh lick to the Phillips curve by contrasting it with theNorwegian model of inflation. In fact we show that the Phillips curve can be seenas a special case of the richer dynamics implied by the Norwegian model. We endthe section by a brief look at the evidence, for the Norwegian economy.
8.1 The Norwegian main-course modelThe Scandinavian model of inflation was formulated in the 1960s5. It became theframework for both medium term forecasting and normative judgements about “sus-tainable” centrally negotiated wage growth in Norway.6 In this section we show thatAukrust’s (1977) version of the model can be reconstructed as a set of propositionsabout long-run relationships and causal mechanisms.7 The reconstructed Norwegianmodel serves as a reference point for, and in some respects also as a corrective to,the modern models of wage formation and inflation in open economies.
5In fact there were two models, a short-term multisector model, and the long-term two sectormodel that we re-construct using modern terminology in this chapter. The models were formulatedin 1966 in two reports by a group of economists who were called upon by the Norwegian governmentto provide background material for that year’s round of negotiations on wages and agriculturalprices. The group (Aukrust, Holte and Stolzt) produced two reports. The second (dated October20 1966, see Aukrust (1977)) contained the long-term model that we refer to as the main-coursemodel. Later, there was similar development in e.g., Sweden, see Edgren et al. (1969) and theNetherlands, see Driehuis and de Wolf (1976).In later usage the distinction between the short and long-term models seems to have become
blurred, in what is often referred to as the Scandinavian model of inflation. We acknowledgeAukrust’s clear exposition and distinction in his 1977 paper, and use the name Norwegian main-course model for the long-term version of his theoretical framework.
6On the role of the main-course model in Norwegian economic planning, see Bjerkholt (1998).7For an exposition and appraisal of the Scandinavian model in terms of current macroeconomic
theory, see Rødseth (2000, Chapter 7.6).
21

8.1.1 A model of long-run wage and price setting
Central to the model is the distinction between a tradables sector where firms act asprice takers, either because they sell most of their produce on the world market, orbecause they encounter strong foreign competition on their domestic sales markets,and a non-tradables sector where firms set prices as mark-ups on wage costs.8
Let Ye denote output (measured as value added) in the tradeable or exposed(e), and let Qe represent the corresponding price (index). Moreover, let Le denotelabour input (total number of hours worked), and use We to represent the hourlywage. The wage share is then WeLe/QeYe or equivalently We/QeAe. Thus, usinglower case letters to denote natural logarithms (i.e., we = log(We) for the wage rate),the first equation in the system (8.29)-(8.32) below says that the log of the wage sharewe−ae− qe is a constant denoted me. ws, qs and as are the corresponding variablesof the non-tradables or sheltered (s) sector, so the second and third equations implya constant relative wage (mes) between the two sectors, and a constant wage share(ms) in the sheltered sector also. Finally, p is the overall domestic price level and(8.32) gives p as a weighted sum of qe and qs. φ is a coefficient that reflects theweight of non-traded goods in private consumption.9
we − qe − ae = me(8.29)
we − ws = mes(8.30)
ws − qs − as = ms(8.31)
p = φqs + (1− φ)qe, 0 < φ < 1.(8.32)
The exogenous variables in the model are qe, ae, and as, while we, ws, qs and p areendogenous.
Equation (8.29) has a very important implication for actual data of wagesprices and productivity in the e−sector: Since both qe and ae are variables thatshow trendlike growth over time, the data for the nominal wage we should show aclear positive trend, more os less in line with price and productivity. Hence, the sumof the technology trend and the foreign price plays an important role in the theorysince it traces out a central tendency or long-run sustainable scope for wage growth.Aukrust (1977) aptly refers to this as the main-course for wage determination in theexposed industries.10 Thus, for later use we define the main-course variable:
(8.33) mc = ae + qe
Aukrust clearly meant equation (8.29) as a long-run relationship between thee-sector wage level and the main-course made up of product prices and productivity.
The relationship between the “profitability of E industries” and the“wage level of E industries” that the model postulates, therefore, is a
8In France, the distinction between sheltered and exposed industries became a feature of modelsof economic planning in the 1960s, and quite independently of the development in Norway. In fact,in Courbis (1974), the main-course theory is formulated in detail and illustrated with data fromFrench post war experience (we are grateful to Odd Aukrust for pointing this out to us).
9Due to the log-form, φ = xs/(1−xs) where xs is the share of non-traded good in consumption.10The essence of the statistical interpretation of the theory is captured by the hypothesis of so
called cointegration between we and mc see Nymoen (1989) and Rødseth and Holden (1990)).
22

certainly not a relation that holds on a year-to-year basis”. At best it isvalid as a long-term tendency and even so only with considerable slack.It is equally obvious, however, that the wage level in the E industries isnot completely free to assume any value irrespective of what happens toprofits in these industries. Indeed, if the actual profits in the E industriesdeviate much from normal profits, it must be expected that sooner orlater forces will be set in motion that will close the gap. (Aukrust, 1977,p 114-115).
Aukrust goes on to specify “three corrective mechanisms”, namely wage negotia-tions, market forces (wage drift, demand pressure) and economic policy. For exam-ple
The profitability of the E industries is a key factor in determining thewage level of the E industries: mechanism are assumed to exist whichensure that the higher the profitability of the E industries, the highertheir wage level; there will be a tendency of wages in the E industries toadjust so as to leave actual profits within the E industries close to a “nor-mal” level (for which however, there is no formal definition). (Aukrust,1977, p 113).
log wage level
time
Main course
"Upper boundary"
"Lower boundary"
0
Figure 5: The ‘Wage Corridor’ in the Norwegian model of inflation.
Aukrust coined the term ‘wage corridor’ to represent the development of wagesthrough time and used a graph similar to figure 5 to illustrate his ideas. The
23

main-course defined by equation (8.33) is drawn as a straight line since the wage ismeasured in logarithmic scale. The two dotted lines represent what Aukrust calledthe “elastic borders of the wage corridor”.
Equation (8.30) incorporates two other substantive hypotheses of the Norwe-gian model of inflation: A constant relative wage between the two sectors (normal-ized to unity), and wage leadership of the exposed sector. Thus, the sheltered sectoris a wage follower and wage setting is recursive, with exposed sector wage deter-minants also causing sheltered sector wage formation. Equation (8.31) contains ahypothesis saying that also the sheltered sector wage share has a constant mean.Given the nature of wage setting and the exogenous technology trend, equation(8.31) implies that sheltered sector price setters mark-up their prices on averagevariable costs. Thus sheltered sector price formation adheres to so called normalcost pricing.
Just as the main-course was meant to define a long-term tendency for e-sectorwages, also the two other hypotheses apply to the long-run, or alternatively, toa hypothetical steady state. In order to make the long-term nature of the theoryexplicit we can summarize Aukrust’s model in three propositions about the long-runbeahviour of wages and prices
H1mc w∗e − qe − ae = me,H2mc w∗e − w∗s = mes,H3mc w∗s − q∗s − as = ms
where the ∗ indicates a long-run or steady state level. Actual data may show con-siderable deviations from the long run tendencies, and, as we have seen, Aukrustexpected that (e-sector) wages followed a corridor with the main course as the cen-tral tendency. We may translate this into a proposition saying that the observedwage share in the e-sector is not exactly constant, but the average wage share overa relatively long period of time should be constant and equal to me. Hence, ac-cording to the theory, me in H1mc is the long-run mean of the observed wage sharewe,t − qe,t − ae,t. 11
The set of institutional arrangements surrounding wage and price setting changeover time, and for that reason me may itself change–not in a trendlike manner likewages and prices, but in smaller “steps” up- or downwards. For example, bargainingpower and unemployment insurance systems are not constant factors but evolve overtime, sometimes abruptly too. Aukrust himself, in his summary of the evidence forthe theory, noted that the assumption of a completely constant mean wage shareover long time spans was probably not tenable. However, no internal inconsistencyis caused by replacing the assumption of unconditionally stable wage shares withthe weaker assumption of conditional stability. Thus, we consider in the following
11Hence, if we estimate me by the mean of the T observations of the wage share;
me = 1/TTXi=1
(we,t − ae,t − qe,t),
me should be an unbiased estimate of me, and the standard deviation of me −me should declicewith the size of the sample (i.e., with how large a number T is).
24

an extended main-course model, namely the following generalization of H1mc
H1gmc w∗e = me,0 +mc+ γe,1u,
where ut is the log of the rate of unemployment, thus, in H1gmc, me,0 denotes themean of the extended relationship, rather than of the wage share itself. Graphically,the main course in figure 5 is no longer necessarily a straight unbroken line, unlessthe rate of unemployment stays constant for the whole time period considered.
Other candidate variables for inclusion in an extended main-course hypothesisinclude the ratio between unemployment insurance payments and earnings (the socalled replacement ratio, see for example Burda and Wyplosz (2001, p 89-90, andTable 4.8)), and variables that represent unemployment composition effects (unem-ployment duration, the share of labour market programmes in total unemployment),see Nickell (1987), Calmfors and Forslund (1991).
Following the influence of trade union and bargaining theory, it has also be-come popular to also include a so called wedge between real wages and the consumerreal wage, i.e., p− qe. However, inclusion of a wedge variable in the long-run wageequation of an exposed sector is inconsistent with the main-course hypothesis, andfinding such an effect empirically may be regarded as evidence against the frame-work. On the other hand, there is nothing in the main-course theory that rules outsubstantive short-run influences of the consumer price index.
The other two long-run propositions(H2mc and H3mc) in Aukrust’s model havenot received nearly as much attention as H1mc in empirical research, but exceptionsinclude Rødseth and Holden (1990) and Nymoen (1991). In part, this is due tolack of high quality data wage and productivity data and for the private service andretail trade sectors. Another reason is that both economists and policy makers inthe industrialized countries place most emphasis on understanding and evaluatingwage setting in manufacturing, because of its continuing importance for the overalleconomic performance.
8.1.2 Causality
The main-course model specifies the following three hypothesis about causation:
H4mc mc→ w∗e ,H5mc w∗e → w∗s ,H6mc w∗s → q∗s → p∗,
where→ denotes one-way causation. In his 1977 paper, Aukrust sees the causationpart of the theory (H4mc-H6mc) as just as important as the long term relationships(H1mc-H3mc). If anything Aukrust seems to put extra emphasis on the causationpart. For example, he argues that exchange rates must be controlled and not floating,otherwise qe (world price in USDs + the Kroner/USD exchange rate) is not a purecausal factor of the domestic wage level, but may itself reflect deviations from themain course, thus
In a way,...,the basic idea of the Norwegian model is the “purchas-ing power doctrine” in reverse: whereas the purchasing power doctrineassumes floating exchange rates and explains exchange rates in terms of
25

relative price trends at home and abroad, this model assumes controlledexchange rates and international prices to explain trends in the nationalprice level. If exchange rates are floating, the Norwegian model does notapply (Aukrust 1977, p. 114).
From a modern viewpoint this seems to be something of a strait-jacket, in that thesteady state part of the model can be valid even if Aukrust’s one-way causality isuntenable. For example H1mc, the main course proposition for the exposed sector,makes perfect sense also when the nominal exchange rate, together with wage ad-justments are stabilizing the wage share around a long-run mean. In sum, it seemsunduly restrictive to a priori restrict Aukrust’s model to a fixed exchange rateregime. But with a floating exchange rate regime, care must be taken to formulatea relevant equation of the nominal exchange rate.
8.1.3 The Norwegian model and the Battle of the Mark-ups
Chapter 12.3 in the book by B&W contains a general framework for thinking aboutinflation. The basic idea is that in modern economies firms typically attempt tomark-up up their prices on unit labour costs, while workers and unions on their partstrive to make their real wage reflect the profitability of the firms, thus their realwage claim is a mark-up on productivity. Hence there is a conflict between workersand firms, both are interested in controlling the real wage, but they have imperfectcontrol: Workers influence the nominal wage, while the nominal price is determinedby firms.
The Norwegian model of inflation fits nicely into this (modern) framework.Hence, using H1mc−H3mc above we have that
w∗ = me + qe + ae,
q∗s = −ms + w∗ − as
saying that the desired wage level is a mark up on prices and productivity, exactlyas in equation (12.5’) in B&W, albeit in the exposed sector of the economy, whilethe desired (s-sector) price level is a mark-up on unit-labour costs (as in B&W’sequation (12.4’). There are however two notable differences:
First: since causality is one-way in the Norwegian model, we still don’t have thefull “circular process” emphasized by B&W (see p 287). However, if the Norwegianmodel is extended to incorporate also effects of consumer prices (which would be anaverage of qe and qs), in e-sector wage setting, full circularity would result.
Second, B&W present the battle of mark-ups model in a static setting. Theimplication is that (if only workers’ price expectations are correct in each period)actual wages and prices are determined by the static model. This of course runsagainst our main message, namely that actual wage and prices are better describedby a dynamic system. In the last subsection on the Norwegian model, we sketchhow we can make a consistent story about the long-run and the dynamics of wagesetting.
8.1.4 Dynamic adjustment
As we have seen, Aukrust was clear about two things. First, the three main-courserelationships should be interpreted as long-run tendencies. For example. actual
26

observations of e-sector will fluctuate around the theoretical main-course. Second,if e-sector wages deviate too much from the long-run tendency, forces will beginto act on wage setting so that adjustments are made in the direction of the main-course. For example, profitability below the main-course level will tend to lowerwage growth, either directly or after a period of higher unemployment.
This idea fits into the autoregressive distributed lag framework, ADL for short,in section 4 above. To illustrate, assume that we,t is determined by the dynamicmodel
(8.34) we,t = β0 + β11mct + β12mct−1 + β21ut + β22ut−1 + αwe,t−1 + εt.
Compared to the ADL model in equation (4.15) above, there are now two explana-tory variables (“x-es”): the main-course variable mct (= ae,t+ qe,t) and the (log of)the rate of unemployment. To distinguish the effects of the two variables, we haveadded a second subscript to the β coefficients. Equation (4.15) is consistent withworkers forming expectations about future values of mc and u, based on current andhistorical information.
The endogenous variable in (8.34) is clearly we,t. As explained above, mct is anexogenous variable which displays a dominant trend. The rate of unemployment isalso exogenous. Assuming exogenous unemployment is a simplification of Aukrust’smodel, we have already seen that he included unemployment rises/falls as potentialcorrective mechanisms that makes wages return towards the main-course. However,it is interesting to study the simple version with exogenous unemployment first,since we will then see that corrective forces are at work even at any constant rateof unemployment. This is a thought provoking contrast to “natural rate models”which dominates modern macroeconomic policy debate, and which takes it as a giventhing that unemployment has to adjust in order to bring about wage and inflationstabilization, see 8.2 below.
Using the same error-correction transformation as in section 4 gives:
∆we,t = β0 + β11∆mct + β21∆ut(8.35)
+(β11 + β12)mct−1 + (β21 + β22)ut−1 + (α− 1)wet−1 + εt
and
∆we,t = β0 + β11∆mct + β21∆ut(8.36)
−(1− α)
½we,t−1 − β11 + β12
1− αmct−1 − β21 + β22
1− αut−1
¾+ εt
Next, invoking H1gmc, this can be expressed as
∆we,t = β0 + β11∆mct + β21∆ut(8.37)
−(1− α)©we.t−1 −mct−1 − γe,1ut−1
ª+ εt
as long as also the following restriction is imposed in (8.34)
(8.38) β11 + β12 = (1− α)
27

(8.38) embodies that the long-run multiplier implied by (8.34) is unity, meaning thata one percent increase in the main-course (either a permanent increase in outputprices or in labour productivity) result in a long-run rise in hourly wages by onepercent. The short-run multiplier with respect to the main-course is of course β11,which can be considerably smaller than unity without violating the main-coursehypothesis H1gmc.
The formulation in (8.37) is often called an equilibrium correction model, ECMfor short, since the term in brackets captures that wage growth in period t partlycorrects last periods deviation from the long-run equilibrium wage level. In fact,since we have imposed the restriction in (8.38) on the dynamic model, we can write
∆we,t = β00 + β11∆mct + β21∆ut
−(1− α) {we. − w∗}t−1 + εt
where w∗e is given by the left hand side of the extended main-course relationshipH1gmc (simplified by setting γe,2 = 0).
12
Figure 6 illustrates the dynamics: We consider a hypothetical steady state witha constant rate of unemployment (upper panel) and wages growing along the main-course. In period t0 the steady state level of unemployment increases permanently.Wages are now out of equilibrium, since the steady state path (w∗ is shifted down inperiod t0) but because of the corrective dynamics wages adjusts gradually towardsthe new steady state growth path. Two possible paths are indicated by the twothinner line. In each case the wage is affected by β21 < 0 in period t0. Line acorresponds to the case where the short-run multiplier is smaller in absolute valuethan the long-run multiplier, (i.e.,−β21 < −γe,1). A different situation, is shownin adjustment path b, where the short-run effect of an increase in unemployment islarger than the long-run multiplier.
Exercise 9 Is β22 > 0 a necessary and/or sufficient condition for path b to occur?
Exercise 10 What might be the economic interpretation of having β21 < 0 , butβ22 > 0?
Exercise 11 Assume that β21+β22 = 0. Try to sketch the wage dynamics (in otherwords the dynamic multipliers) following a rise in unemployment in this case!
12The interested reader will have noted that, for consistency, the intercept β00 is given as β00 =
β0 + (1− α)me,0.
28

t0
t0
time
rate ofunemployment
wage level
time
a
b
Figure 6: The main course model: A permanent increase in the rate of unemploy-ment, and possible wage responses.
There are at least two additional remarks worth making. First, looking backat the consumption function example, it is clear that the dynamics there also hasan equilibrium correction interpretation. Hence, the ECM is a 1-1 transformationof the autoregressive model is generic and is not confined to the main-course model.Second, below we will show that also the Phillips curve has an ECM interpretation.The main difference is the nature of the corrective mechanism: In Aukrust’s modelthere is enough collective rationality in the system to secure dynamic stability ofwages setting at any rate of unemployment (also very low rates). Wage growth andinflation never gets out of hand or out of control. In the Phillips curve model onthe other hand, unemployment has to adjust to a special level called the “naturalrate” and/or NAIRU for the rate of inflation to stabilize.
8.2 The Phillips curve version of the main-course modelThe Norwegian model of inflation and the Phillips curve are rooted in the same epochof macroeconomics. But while Aukrust’s model dwindled away from the academic
29

scene, the Phillips curve literature “took off” in the 1960s and achieved immenseimpact over the next four decades. In the 1970s, the Phillips curve and Aukrust’smodel were seen as alternative, representing “demand” and “supply” model of infla-tion respectively. However, as pointed at by Aukrust, the difference between viewingthe labour market as the important source of inflation, and the Phillips curve’s fo-cus on product market, is more a matter of emphasis than of principle, since bothmechanism may be operating together.13 In this section we show formally how thetwo approaches can be combined by letting the Phillips curve take the role of ashort-run relationship of nominal wage growth, while the main-course thesis holdsin the long-run.
Although the Phillips curve started out as an empirical regularity, it has sub-sequently been derived by the use of economic theory (see B&W Ch 12). In fact,the Phillips curve can be rationalized in a number of ways. In this section we buildon Calmfors (1977), and reconcile the Phillips curve with the Norwegian model ofinflation.
Without loss of generality we concentrate on the wage Phillips curve, and recallthat according to Aukrust’s theory it is assumed that
1. w∗e = me +mc, i.e., H1mc above.
2. u∗t = mu, i.e., unemployment has a stable long-run mean mu .
3. the causal structure is “one way” as represented by H4mc and H5mc above.
A Phillips curve ECM system is defined by the following two equations
∆wt = βw0 + βw1∆mct + βw2ut + εw,t,(8.39)
βw2 ≤ 0,
∆ut = βu0 + αuut−1 + βu1(w −mc)t−1 + εu,t(8.40)
0 < αu < 1,
where we have simplified the notation somewhat by dropping the “e” sector sub-script.14 Compared to equation (8.35) above, we have simplified by assuming thatonly the current unemployment rate affects wage growth. On the other hand, sincewe are considering a dynamic system, we have added a w in the subscript of thecoefficients. Note that compared to (8.35) the autoregressive coefficient αw is set tounity in (8.39)–this is of course not a simplification but a defining characteristic ofthe Phillips curve.
Equation (8.40) represents the basic idea that low profitability causes unem-ployment. Hence if the wage share is too high relative to the main-course unem-ployment will increase in most situations, i.e., βu1 ≥ 0.
To establish the main-course rate of equilibrium unemployment, rewrite first(8.39) as
(8.41) ∆wt = βw1∆mct + βw2(ut −βw0−βw2
) + εw,t,
13See Aukrust (1977, p. 130).14Alternatively, given H2mc, ∆wt represents the average wage growth of the two sectors.
30
Next, assume a steady state situation where ∆mct = gmc. From assumption 1, wethat ∆w∗ − gmc = 0 where ∆w∗ is the steady state growth rate of wages. Then(8.41) defines the defines the main-course equilibrium rate of unemployment whichwe denote uphil :
0 = βw2[uphil − βw0
−βw2] + (βw1 − 1)gmc.
or
(8.42) uphil = (βw0−βw2
+βw1 − 1−βw2
gmc),
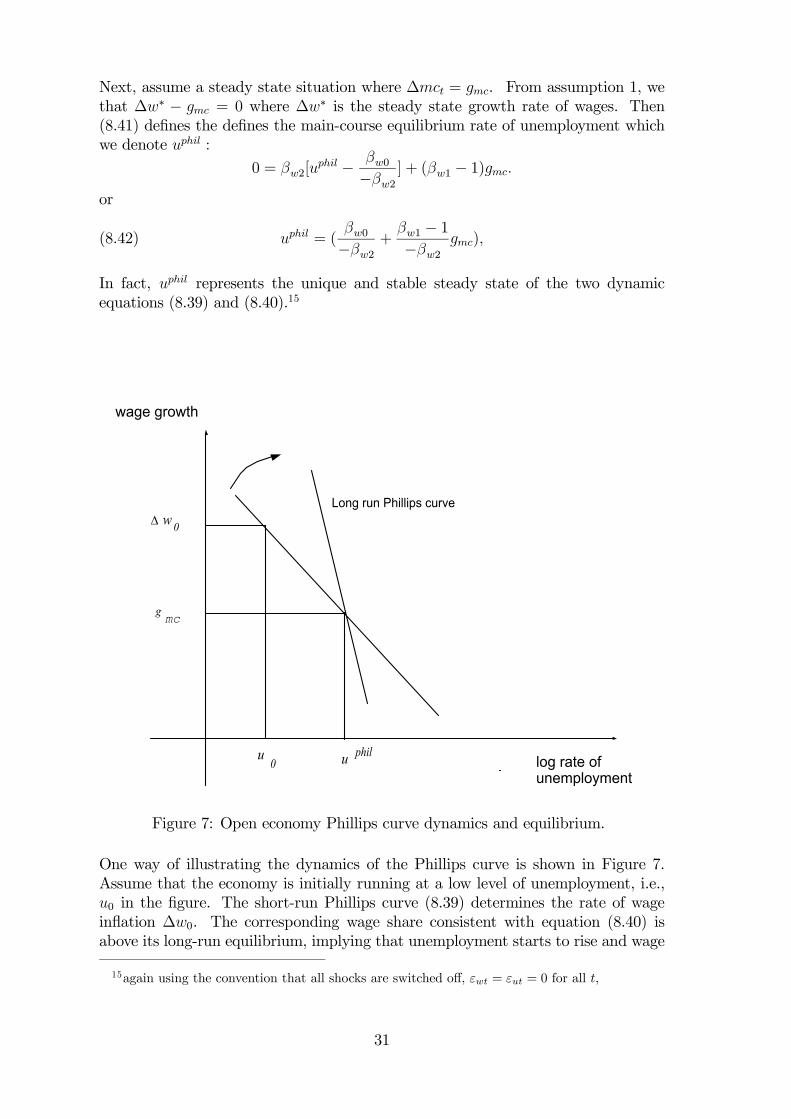
In fact, uphil represents the unique and stable steady state of the two dynamicequations (8.39) and (8.40).15
wage growth
g mc
philuu0 log rate of
unemployment
Long run Phillips curve∆ w 0
Figure 7: Open economy Phillips curve dynamics and equilibrium.
One way of illustrating the dynamics of the Phillips curve is shown in Figure 7.Assume that the economy is initially running at a low level of unemployment, i.e.,u0 in the figure. The short-run Phillips curve (8.39) determines the rate of wageinflation ∆w0. The corresponding wage share consistent with equation (8.40) isabove its long-run equilibrium, implying that unemployment starts to rise and wage
15again using the convention that all shocks are switched off, εwt = εut = 0 for all t,
31

growth is reduced. During this process, the slope of the Phillips curve becomessteeper, illustrated in the figure by the rightward rotation of the short-run Phillipscurve. The steep Phillips curve in the figure has slope βw2/(1−βw1) and is called thelong-run Phillips curve.16 The stable equilibrium is attained when wage growth isequal to the steady state growth of the main-course, i.e., gmc and the correspondinglevel of unemployment is given by uphil. The issue about the slope of the long-runPhillips curve is seen to hinge on the coefficient βw1, the elasticity of wage growthwith respect to the main-course. In the figure, the long-run curve is downwardsloping, corresponding to βw1 < 1 which is conventionally referred to as dynamicinhomogeneity in wage setting. The converse, dynamic homogeneity, implies βw1 = 1and a vertical Phillips curve. Subject to dynamic homogeneity, the equilibrium rateuphil is independent of world inflation gmc.
The slope of the long-run Phillips curve represented one of the most debatedissues in macroeconomics in the 1970 and 1980s (this is not reflected in B&W Ch12, though). One arguments in favour of a vertical long-run Phillips curve is thatworkers are able to obtain full compensation for CPI inflation. Hence βw1 = 1 isa reasonable restriction on the Phillips curve, at least if ∆qt is interpreted as anexpectations variable. The downward sloping long-run Phillips curve has also beendenounced on the grounds that it gives a too optimistic picture of the powers ofeconomic policy: namely that the government can permanently reduce the level ofunemployment below the natural rate by “fixing” a suitably high level of inflation,see e.g., Romer (1996, Ch 5.5). In the context of an open economy this discussionappears as somewhat exaggerated, since a long-run trade-off between inflation andunemployment in any case does not follow from the premise of a downward-slopinglong-run curve. Instead, as shown in figure 7, the steady state level of unemploymentis determined by the rate of imported inflation mmc and exogenous productivitygrowth. Neither of these are normally considered as instruments (or intermediatetargets) of economic policy.17
In the real economy, cost-of-living considerations play an significant role inwage setting, see e.g., Carruth and Oswald (1989, Ch. 3) for a review of industrialrelations evidence. Thus, in applied econometric work, one usually includes currentand lagged CPI-inflation, reflecting the weight put on cost-of-living considerationsin actual wage bargaining situations. The above framework can easily be extendedto accommodate this, but with the expense of additional notation and is omittedhere.
In sum, the open economy wage Phillips curve represents one possible speci-fication of the dynamics of the Norwegian model of inflation. Clearly, the dynamicfeatures of our Phillips curve model apply to other versions of the Phillips curve,in that it implies the natural rate (or a NAIRU) rate of unemployment as a stablestationary solution. It is important to note that the Phillips curve needs to be sup-plemented by an equilibrating mechanism in the form of an equation for the rate ofunemployment. Without such an equation in place, the system is incomplete and wehave a missing equation. The question about the dynamic stability of the naturalrate (or NAIRU) cannot be addressed in the incomplete Phillips curve system.
16By definition, ∆wt = ∆qt +∆at along this curve.17To affect uphil, policy needs to incur a higher or lower permanent rate of currency depreciation.
32

8.3 Estimated wage dynamics for NorwayIn this section we first show an open economy Phillips curve for the Norwegianmanufacturing sector. We then show an estimated extended main-course model.
8.3.1 A Phillips curve system
We use an annual data set for the period 1965-1998. In the choice of explanatoryvariables and of data transformations, we build on existing studies of the Phillipscurve in Norway, cf. Stølen (1990,1993). The variables are in log scale (unlessotherwise stated) and are defined as follows:
wct = hourly wage cost in manufacturing;
qt = index of producer prices (value added deflator);
pt = the official consumer price index (CPI index);
at = average labour productivity;
tut = rate of total unemployment (i.e., unemployment includes participants inactive labour market programmes);
rprt = the replacement ratio;
h = the length of the “normal" working day in manufacturing;
t1 = the manufacturing industry payroll tax-rate (not log).
The estimated Phillips curve is shown in (8.43). Beside effects of product pricechanges and the rate of unemployment, it contain a strong effect of last years risein CPI and a catch-all variable for incomes policies (IPt). The number in bracketsbelow the coefficients are the estimated standard errors, which is helpful in judgingstatistical significance, but we will leave that for econometrics courses. 18
(8.43)d∆wct = − 0.0683(0.0139)
+ 0.26(0.105)
∆pt−1 + 0.20(0.0851)
∆qt + 0.29(0.0851)
∆qt−1
− 0.0316(0.00431)
tut − 0.07(0.0103)
IPt
As discussed above, a key parameter of interest in the Phillips curve modelis the equilibrium rate of unemployment, i.e., uphil in (8.42). Using the coefficientestimates in (8.43), and setting the growth rate of prices (δf) and productivitygrowth equal to their sample means of 0.06 and 0.027, we obtain uphil = 0.0305,which is as nearly identical to the sample mean of the rate of unemployment (0.0313).
Figure 8 shows the sequence of uphil estimates for over the last part of thesample– together with ±2 estimated standard errors and with the actual unem-ployment rate for comparison. The figure shows that the estimated equilibrium
18Batch file: aar_NmcPhil_gets.fl
33

rate of unemployment is relatively stable, and that it is appears to be quite welldetermined. 1990 and 1991 are exceptions, where uphil increases from to 0.033 and0.040 from a level 0.028 in 1989. However, compared to confidence interval for 1989,the estimated NAIRU has increased significantly in 1991, which represents an inter-nal inconsistency since one of the assumptions of this model is that uphil is a timeinvariant parameter.
1985 1990 1995 2000
0.02
0.03
0.04
0.05
0.06
0.07
0.08
u phil
+2 se
−2 se
Actual rate of unemployment
Figure 8: Sequence of estimated wage Phillips curve NAIRUs (with ±2 estimatedstandard errors), and the actual rate of unemployment. Wald-type confidence re-gions.
Another point of interest in figure 8 is how few times the actual rate of un-employment crosses the line for the estimated equilibrium rate. This suggest verysluggish adjustment of actual unemployment to the purportedly constant equilib-rium rate. In order to investigate the dynamics formally, we graft the Phillips curveequation (8.43) into a system that also contains the rate of unemployment as anendogenous variable, i.e., an empirical counterpart to equation (8.40) in the the-ory of the main-course Phillips curve. As noted, the endogeneity of the rate ofunemployment is just an integral part of the Phillips curve framework as the wagePhillips curve itself, since without the “unemployment equation” in place one cannotshow that the equilibrium rate of unemployment obtained from the Phillips curvecorresponds to a steady state of the system.
Next we therefore turn to the properties of an estimated version of the dynamicPhillips curve system (8.39)-(8.40) above. Figure 9 offers visual inspection of someof the empirical properties of such a model. The first four graphs shows the actualvalues of ∆pt, tut, ∆wct and the wage share wct − qt − at together with the results
34

from dynamic simulation. As could expected, the fits for the two growth rates arequite acceptable. However, the “near instability” property of the system manifestsitself in the graphs for the level of the unemployment rate and for the wage share.In both cases there are several consecutive year of under- or overprediction. Thelast two displays contain the cumulated dynamic multipliers (of u and and to thewage share) resulting from a 0.01 point increase in the unemployment rate. As onemight expect from the characteristic roots, the stability property is hard to gaugefrom the two responses. For practical purposes, it is as if the level of unemploymentand the wage share are “never” return to their initial values. Thus, in the Phillipscurve system equilibrium correction is found to be extremely weak.
1970 1980 1990 2000
0.05
0.10
∆pt
1970 1980 1990 2000
−4
−3
tut
1970 1980 1990 2000
0.05
0.10
0.15
0.20 ∆wct
1970 1980 1990 2000
−0.4
−0.3
−0.2 wct−at−qt
0 10 20 30
−0.025
0.000
0.025
0.050 tut : Cumulated multiplier
0 10 20 30
−0.015
−0.010
−0.005
0.000 wct−at−qt : Cumulated multiplier
Figure 9: Dynamic simulation of the Phillips curve model. Panel a)-d) Actual andsimulated values (dotted line). Panel e)-f): multipliers of a one point increase in therate of unemployment
As already mentioned, the belief in the empirical basis a the Phillips curvenatural rate of unemployment was damaged by the remorseless rise in Europeanunemployment in the 1980s, and the ensuing discovery of great instability of theestimated natural rates. In that perspective, the variations in the Norwegian naturalrate estimates in figure 8 are quite modest, and may pass as relatively acceptable asa first order approximation of the attainable level of unemployment. However, theestimated model showed that equilibrium correction is very weak. After a shock tothe system, the rate of unemployment is predicted to drift away from the naturalrate for a very long period of time. Hence, the natural rate thesis of asymptoticallystability is not validated.
There are several responses to this result. First, one might try to patch-upthe estimated unemployment equation, and try to find ways to recover a stronger
35

relationship between the real wage and the unemployment rate. In the followingwe focus instead on the other end of the problem, namely the Phillips curve itself.In fact, it emerges that when the Phillips curve framework is replaced with a wagemodel that allows equilibrium correction to any given rate of unemployment ratherthan to only the “natural rate”, all the inconsistencies are resolved.
8.3.2 A main-course system
Equation (8.44) shows an empirical version of an equilibrium correction model forwages, similar to equation (8.37) above(8.44)d∆wt = − 0.197
(0.0143)− 0.478(0.0293)
ecmw,t−1 + 0.413(0.0535)
∆pt−1 + 0.333(0.0449)
∆qt
− 0.835(0.129)
∆ht − 0.0582(0.00561)
IPt
ecmw,t−1 corresponds to we,t − w∗e in the notation of section 8.1.4. The estimatedw∗e is a function of mc, with restriction (8.38) imposed. The estimated value ofγe,1 is −0.01. The variable ∆ht represent institutional changes in the length of theworking week, and the estimated coefficient captures that the pay-losses that wouldhave followed the reductions in working time have been largely compensated in theshort-run.
It is interesting to compare this model to the Phillips curve system. Firstnote that the coefficient of ecmw,t−1 is relatively large, a result which is in directsupport of Aukrust’s view that there are wage-stabilizing forces at work even ata constant rate of unemployment. To make further comparisons with the Phillipscurve, we have also grafted (8.44) into dynamic system that contains the rate ofunemployment as an endogenous variable (in fact, the estimated equation for tut isalmost identical to its counterpart in the Phillips curve system). Some properties ofthat system is shown in figure 10.
36

1970 1980 1990 2000
0.05
0.10
0.15
0.20 ∆wct
1970 1980 1990 2000
0.05
0.10
∆pt
1970 1980 1990 2000
−4
−3
tut
0 10 20 30 40
0.02
0.03
0.04 tut : Cumulated multiplier
0 10 20 30 40
−0.003
−0.002
−0.001
0.000 wct − at −qt : Cumulated multiplier1970 1980 1990 2000
−0.4
−0.3
−0.2 wct−at−qt
Figure 10: Dynamic simulation of the ECMmodel Panel a)-d) Actual and simulatedvalues (dotted line). Panel e)-f): multipliers of a one point increase in the rate ofunemployment
For each of the four endogenous variables shown in the figure, the model so-lution (“simulated”) is closer to the actual values than in the case in figure for thePhillips curve system. The two last panels in the figure show the cumulated dynamicmultiplier of an exogenous shock to the rate of unemployment. The difference fromfigure 9, where the steady state was not even “in sight” within the 35 years simula-tion period, are striking. In figure 10, 80% of the long-run effect is reached within4 years, and the system is clearly stabilizing in the course of a 10 year simulationperiod. It is clear that this system is more convincingly stable than the Phillipscurve version of the main-course model.
Sometimes macroeconomists give the impression that a Phillips curve with anatural rate is necessary for dynamic stability. However, the evidence here shows notonly that the wage price system is stable when the Phillips curve is substituted by awage equation which incorporates direct adjustment also with respect to profitability(consistent with the Norwegian model and with modern bargaining theory). In fact,the system with the alternative wage equation has much more convincing stabilityproperties than the Phillips curve system.
References
Aukrust, O. (1977). Inflation in the Open Economy. An Norwegian Model. InKlein, L. B. and W. S. Sâlant (eds.), World Wide Inflation. Theory and RecentExperience. Brookings, Washington D.C.
37

Bjerkholt, O. (1998). Interaction Between Model Builders and Policy Makers in theNorwegian Tradition. Economic Modelling, 15 , 317—339.
Burda, M. and C. Wyplosz (2001). Macroeconomics. A European Text.. OxfordUniversity Press, Oxford, 3rd edn.
Calmfors, L. (1977). Inflation in Sweden. In Klein, L. B. and W. S. Salant (eds.),World Wide Inflation. Theory and recent experience. Brookings, Washington D.C.
Calmfors, L. and A. Forslund (1991). Real-Wage Determination and Labour MarketPolicies: The Swedish Experience. The Economic Journal , 101 , 1130—1148.
Carruth, A. A. and A. J. Oswald (1989). Pay Determination and Industrial Pros-perity. Oxford University Press, Oxford.
Courbis, R. (1974). Liason Internationale Des Prix et Inflation Importé. EconomieAppliquée, 27 , 205–220.
Driehuis, W. and P. de Wolf (1976). A Sectoral Wage and Price Model for theNetherlands’ Economy. In Frisch, H. (ed.), Inflation in Small Countries, 283–339. Springer-Verlag, New York.
Edgren, G., K. O. Faxén and C. E. Odher (1969). Wages, Growth and Distributionof Income. Swedish Journal of Economics, 71 , 133—60.
Nickell, S. (1987). Why is Wage Inflation in Britain so High? Oxford Bulletin ofEconomics and Statistics, 49 , 103—128.
Nymoen, R. (1989). Modelling Wages in the Small Open Economy: An Error-Correction Model of Norwegian Manufacturing Wages. Oxford Bulletin of Eco-nomics and Statistics, 51 , 239—258.
Nymoen, R. (1991). A Small Linear Model of Wage- and Price-Inflation in theNorwegian Economy. Journal of Applied Econometrics, 6 , 255—269.
Rødseth, A. (2000). Open Economy Macroeconomics. Cambridge University Press,Cambridge.
Rødseth, A. and S. Holden (1990). Wage formation in Norway. In Calmfors, L. (ed.),Wage Formation and Macroeconomic Policy in the Nordic Countries, chap. 5.Oxford University Press, Oxford. With comments by C. A. Pissarides and P.Vartia.
Romer, D. (1996). Advanced Macroeconomics. McGraw-Hill, New York.
Stølen, N. M. (1990). Is there a Nairu in Norway. Working Paper 56, Central Bureauof Statistics.
Stølen, N. M. (1993). Wage formation and the macroeconometric functioning of theNorwegian labour market . Ph.D. thesis, University of Oslo.
38