dynamic measurements of the nonlinear elastic … measurements of the nonlinear elastic parameter a...
TRANSCRIPT

Dynamic measurements of the nonlinear elastic parameter A
in rock under varying conditions
Paul A. Johnson,1,2 Bernard Zinszner,3 Patrick Rasolofosaon,3
Frederic Cohen-Tenoudji,4 and Koen Van Den Abeele5
Received 18 June 2002; revised 26 August 2003; accepted 3 November 2003; published 4 February 2004.
[1] Since the exhaustive work by Adams and Coker at the Carnegie Institute in the early1900s and the work of F. Birch’s group at Harvard University conducted in the 1940s–1950s, it has been well documented that the quasi-static stress-strain behavior of rock isnonlinear and hysteretic. Over the past 20 years, there has been an increasing body ofevidence suggesting that rocks are highly elastically nonlinear and hysteretic in theirdynamic stress-strain response as well, even at extremely small strain amplitudes that aretypical of laboratory measurements. In this work we present a compendium ofmeasurements of the nonlinear elastic parameter a extracted from longitudinal (Young’smode) and flexural-mode resonance experiments in eight different rock types under avariety of saturation and thermal conditions. The nonlinear modulus a represents ameasure of the dynamic hysteresis in the wave pressure-strain behavior. We believe thathysteresis is the primary cause of nonclassical nonlinear dynamics in rock, just as it isresponsible for elastic nonlinear behavior in quasi-static observations. In dynamics, a isproportional to the wave speed and modulus reduction as a function of wave strainamplitude due to the hysteresis, based on our current model. The rocks tested include purequartz sandstone (Fontainebleau), two sandstones that contain clay and other secondarymineralization (Berea and Meule), marble (Asian White), chalk, and three limestones(St. Pantaleon, Estaillades, and Lavoux). The values of a range from �500 to >100,000,depending on the rock type, damage, and/or water saturation state. Damaged samplesexhibit significantly larger a than intact samples (hysteresis increases with damagequantity), and water saturation has an enormous influence on a from 0 to 15–30% watersaturation. INDEX TERMS: 5102 Physical Properties of Rocks: Acoustic properties; 5112 Physical
Properties of Rocks: Microstructure; 5199 Physical Properties of Rocks: General or miscellaneous; 9810
General or Miscellaneous: New fields (not classifiable under other headings); KEYWORDS: elastic nonlinearity,
nonlinear acoustics, nonlinear elastic parameter a
Citation: Johnson, P. A., B. Zinszner, P. Rasolofosaon, F. Cohen-Tenoudji, and K. Van Den Abeele (2004), Dynamic measurements
of the nonlinear elastic parameter a in rock under varying conditions, J. Geophys. Res., 109, B02202, doi:10.1029/2002JB002038.
1. Introduction
[2] Numerous elastic wave measurements in diversesolids have established that rock, concrete, some metals,and damaged materials exhibit nonclassical, nonlinear be-havior [e.g., Adams and Coker, 1906; Pandit and Savage,1973; Guyer and Johnson, 1999; Johnson, 1999]. Bynonclassical behavior, we mean that a perturbation expan-sion of the stress-strain relation, the classical, atomic-elastic
approach used for anharmonicity by, e.g., Landau andLifschitz [1986], does not quantitatively predict observationsin rock and some other materials (also see the books onclassical nonlinear acoustics by Blackstock and Hamilton[1998] and Naugolnykh and Ostrovsky [1998]). In dynamics,we say these materials exhibit nonclassical nonlinear fastdynamics (NNFD) in that their elastic nonlinearity exhibitsunique ‘‘signatures’’ not present in materials that exhibitclassical nonlinear wave dynamics. These signatures includespecific scaling relations between driving strains anddetected wave harmonics, resonance peak shift and changein specific dissipation [e.g., Ostrovsky and Johnson, 2001].These materials are also known as nonlinear mesoscopicelastic (NME) materials because their elasticity is attribut-able to the ensemble elastic behavior within the ‘‘bondsystem’’ at scales that may be near molecular up to 10�6 m,at least [Guyer and Johnson, 1999; T. W. Darling et al.,Simultaneous neutron scattering and quasi-static stress-strainmeasurements in rocks, submitted to Geophysical Reserch
JOURNAL OF GEOPHYSICAL RESEARCH, VOL. 109, B02202, doi:10.1029/2002JB002038, 2004
1Los Alamos National Laboratory, Los Alamos, New Mexico, USA.2Also at the Laboratoire Environnement et Developpement, Universite
Paris VII, Paris, France.3Institut Francais du Petrole Reuil, Malmaison, France.4Laboratoire Universitaire Applications Physique, Universite Paris VII,
Paris, France.5Interdisciplinary Research Center, Faculty of Science, Catholic
University, Kortrijk, Belgium.
Copyright 2004 by the American Geophysical Union.0148-0227/04/2002JB002038$09.00
B02202 1 of 12

Letters, 2003]. Here we illustrate a compendium of resultsobtained from dynamic resonance experiments for diverserocks that are part of the NME class. Experiments wereconducted in a variety of samples under a variety of con-ditions of water saturations, temperatures, and thermallyinduced ‘‘damage’’ state in order to understand the qualitativerelations between the nonlinear parameter a, rock type, andphysical state; a is the measure of the stress-strain hysteresisin the material, and therefore a fundamental quantifier ofNNFD.[3] In the following, we briefly describe the classical and
nonclassical theory known as the Preisach-Mayergoyz (P-M)space model of nonlinear elasticity [McCall and Guyer,1994] and illustrate predictions from this theory that can becompared with experiment. We then describe the experi-ments, present results and discussion, and conclude.
2. Theory
[4] The traditional theory of elastic wave propagation in anonlinear acoustic or elastic medium is based on expressingthe energy density as a function of the scalar invariants ofthe strain tensor [e.g., Landau and Lifshitz, 1986]. In onedimension, this leads to an equation of motion in thedisplacement field (u) of
@2 u
@ t2¼ d
d xc2
d u
d x
� �; ð1Þ
where
c2 ¼ c20 1þ bd u
d x
� �þ d
d u
d x
� �2
þ . . .
" #; ð2Þ
c is nonlinear elastic wave speed, c0 is the linear elasticwave speed, du/dx is the strain e, and b and d are higher-order contributions to the nonlinear wave speed. Equation(2) tells us that as the stain amplitude increases, the wavespeed (and modulus) will increase or decrease, dependingon the sign and magnitude of b and d. In resonance, theaverage of the strain field over one period is zero, and thuswe can drop the term proportional to b and replace the termproportional to d by its average. Rewriting equation (2) anddropping all terms in powers higher than 2 (we can do thisbecause the strains are small), we have
c2 � c20c20
ffi f 2 � f 20f 20
ffi 2 f � f0ð Þf0
ffi 1
2de2; ð3Þ
where f is the resonance frequency at increased strain level(nonlinear elastic) and f0 is the lowest drive amplituderesonance frequency (presumed to be elastically linear).Equation (3) indicates that the change in wave speed squared(proportional to modulus) is proportional to the square of thestrain amplitude by the nonlinear parameter d. It has beendemonstrated that the strain dependency in equation (3) istoo large in rock by a factor of one in the exponent of thestrain [e.g.,Guyer and Johnson, 1999; Van Den Abeele et al.,2000a, 2000b]. In order to describe the behavior observed inrock, McCall and Guyer [1994] developed the Preisach-Mayergoyz (P-M) Space model of elasticity that incorporates
hysteresis into the stress-strain relationship, correctlypredicting both quasi-static and dynamic nonlinear behaviorin rock over certain strain intervals (order 10�6). The detailsof this model for a Young’s mode resonating bar can befound elsewhere [e.g., Guyer et al., 1995].[5] The fundamental premise underlying the model is that
the macroscopic elastic behavior of rock is due to a largenumber of hysteretic mechanical ‘‘features’’ contained in themechanically soft bonds between the mechanically hardgrains of a rock. The actual physical origin of the hystereticelastic units is not presumed, and in fact, remains a mysteryand a topic of intense research [e.g., Ostrovsky and Johnson,2001]. Many physical mechanisms have been proposed suchas Hertz-Mindlin theory [e.g., Johnson et al., 2000] and graincontact adhesion [Sharma and Tuntuncu, 1994]. No physicalmechanism proposed explains all observations, however.[6] In the model used here, the individual hysteretic
mechanical units have equilibrium lengths that switchhysteretically between two configurations, open and closed.The ensemble behavior of the hysteretic units are tracked inwhat is known as P-M space that has axes of open andclosing pressure. The density of the hysteretic units istracked in P-M space as a function of wave pressure. Theinverse modulus 1/K = �@e/@P can be derived in terms ofthe wave strain and pressure, and the corresponding densityof units in P-M space that are open and closed (here we areeliminating a tremendous amount of detail in the derivationof the P-M space approximation; please see Guyer et al.[1995] for more detail). Following the P-M space approx-imation through, the Young’s modulus in a resonating barcan be written as
K e; _eð Þ ¼ K0 1� a �eþ e tð Þsign _eð Þ½ þ . . .f g; ð4Þ
where K0 is the linear modulus, �e is the peak strainamplitude over a wave period, _e ¼ @e=et is the strain rate,and (sign _eð Þ = 1 for _e > 0) and (sign _eð Þ = �1 for _e < 0)[Guyer et al., 1997; Van Den Abeele et al., 1997]. Thenonlinear coefficient a describes the quantity of hysteresis inthe stress-strain relation, the equation of state (EOS). As aincreases, so does the hysteresis in the EOS. Equation (4)indicates that as the wave strain amplitude increases, themodulus changes as well, this time however in adiscontinuous manner (a butterfly-type behavior). Theaverage modulus is found to always decrease with strainamplitude in rock (a, as introduced in equation (4), ispositive). As a result we have, in the case of hysteresis beingthe dominant cause of nonlinearity, that the elements orfeatures in the material contributing to the nonlinearitycontained in the bond system, some hysteretic (nonclassical)and some not (classical), make a contribution to the motionof the displacement field that depends on the actual strainvalue, the strain derivatives and the strain amplitude in atypically nonanalytic manner. In the case of a strain fieldwith one frequency present as in a resonance bar experiment,the hysteretic nonlinear term leads to a resonance frequencyshift, which is proportional to the peak strain amplitude,
f �eð Þ � f0
f0¼ �f �eð Þ
f0ffi af�e; ð5Þ
where f0 is again the elastically linear resonance frequency(in practice, the resonance frequency of the lowest drive
B02202 JOHNSON ET AL.: NONLINEAR ELASTIC PARAMETER IN ROCK
2 of 12
B02202

amplitude). In terms of the actual resonance bar experiment,one measures the peak resonance frequency as a function ofthe strain at progressively larger driving amplitudes, and fitsthese data to extract a.[7] It can be shown that the change in nonlinear attenu-
ation is proportional to a, meaning the attenuation is strainamplitude dependent as well. This relation, derived, forinstance, by Guyer et al. [1999], is
1
Q eð Þ �1
Q0
ffi aQ�e; ð6Þ
where�e is the magnitude of the strain field again, 1/Q(�e)is the nonlinear attenuation as a function of the strain field,and 1/Q0 is the linear elastic attenuation. Thus the frequencyshift and 1/Q are proportional to the magnitude of the strainfield, with aQ/af = 0.3 for materials where this relation hasbeen calculated (e.g., P. A. Johnson and A. Sutin, Slowdynamics in diverse solids, submitted to Physical Review B,2003). In the data presented in this paper, Q was notmeasured; however based on equation (8), aQ can beestimated.[8] Other models of hysteresis in the EOS exist for rock.
The P-M space model is the only one to our knowledge thatcorrectly predicts both quasi-static and dynamic elasticnonlinear behaviors in rock, and provides one the abilityto predict dynamic from quasi-static behavior. Nonetheless,there are no underlying physics in the P-M space model asthey are currently unknown.
3. Experiment
[9] Figure 1a illustrates a typical Young’s mode reso-nance experiment where a bar of material is excited by asinusoidal oscillation. The signal frequency is sweptthrough the fundamental mode resonance peak while thetime-average amplitude of the output signal is measuredand recorded. The drive amplitude is increased; thefrequency is again swept in the same manner for progres-sively increasing drive levels (for additional details, seeJohnson et al. [1996], Zinszner et al. [1997], and Van
Den Abeele et al. [2000b]). Figure 1b illustrates a typicalresult in an NME material. The difference between theresonance peak frequency w (at a finite amplitude drivelevel) and f0 (at the lowest (linear) drive level) is thendetermined from each successive frequency sweep, normal-ized to the linear resonance peak f0, and plotted against thestrain amplitude. The strain intervals where one can reliablyapply the P-M space model are limited to a range from 10�6
to roughly 10�5 (see Figure A3). Ten rock samples weretested of eight rock types. For comparison and to be certainthe system electrical and contact nonlinearities had noinfluence, three materials known to be elastically linearwere tested: Plexiglas, PVC, and polycarbonate [e.g.,Johnson et al., 1996]. Table 1 displays information regard-ing the sample sizes, provenance, strength, permeability andmineralogy, in addition to sample sizes of the three elasti-cally linear standards used for comparison.[10] Details of each experiment are provided in sections
3.1–3.8.
3.1. Berea Sandstone
[11] During this experiment the sample was taken to 65�Cin a vacuum oven, held there for 120 hours, taken to 100�Cand held for �24 hours, then taken to 120�C where thesource and detector failed. The sample was removed fromthe vacuum and placed in water to be thermally shocked andsaturated (Hirswald saturation [Bourbie et al., 1986]), thendried. Reliable af were measured at 65�C, at 65�C after120 hours, at 100�C twice in succession, immediately afterthermal shock/full saturation, and during drying. A secondgroup of water saturation experiments conducted by VanDen Abeele et al. [2002] were conducted for a parallelepi-ped-shaped sample of Berea sandstone using the fundamen-tal flexural resonance. These results are compiled here aswell. Note that the a obtained in this case is therefore for theflexural mode. Saturation levels were estimated by thechange in weight as compared with the oven dry weight.
3.2. ASI Marble
[12] In this experiment, a marble sample (Asian WhiteMarble, ASI) was measured at ambient conditions, taken to
Figure 1. (a) Experimental configuration and (b) typical Young’s mode resonance curves in a nonlinearmesoscopic elastic material. Time-averaged amplitude is plotted against the resonance frequency. Byplotting the resonance peak versus the associated peak strains, one extracts af.
B02202 JOHNSON ET AL.: NONLINEAR ELASTIC PARAMETER IN ROCK
3 of 12
B02202

200�C in a vacuum oven, submerged in water and therebythermally shocked simultaneous to becoming saturated(Hirswald saturation), removed from the water bath, mon-itored just postshock then dried under room conditions. Theaf were determined before heating, at 200�C, just postsaturation and at two times during drying.
3.3. Estaillades Limestone
[13] Four measurements were taken at ambient conditions.Water saturations at the time of the experiments were <5%.
3.4. Fontainebleau Sandstone
[14] Four measurements were made in a vacuum oven at40�C over a period of days.
3.5. St. Pantaleon Limestone
[15] The sample was oven dried under vacuum conditionsat �40�C, saturated (Hirswald saturation), and then dried.Reliable measurements were obtained at the saturationsindicated. Data were of very poor quality for the midrangesaturation levels and were discarded. Saturation was esti-mated by the change in weight as compared with the ovendry weight.
3.6. Chalk
[16] The sample was oven dried, saturated, and then driedagain. Measurements were made at the water saturations
indicated. Saturation was estimated by the change in weightas compared with the oven dry weight.
3.7. Meule Sandstone
[17] The sample was oven dried under vacuum, saturated,and then dried. Measurements were made at many satura-tions. Saturation was estimated by the change in weight ascompared with the oven dry weight.
3.8. Berea Sandstone and Lavoux Limestone Flexural-Mode Measurements
[18] The parallelepiped samples were oven dried undervacuum, saturated, and then dried. Measurements weremade at many saturations. Saturation was estimated by thechange in weight as compared with the oven dry weight.The measurements were obtained from flexural-mode reso-nance and therefore it is the flexural-mode af that iscalculated. A comprehensive analysis of these data in thecontext of the influence of pore pressure on elastic nonlin-earity was conducted by Van Den Abeele et al. [2002]. Adescription of how the flexural mode af is derived is alsocontained in this work.
4. Results
[19] Figure 2 shows the relation of the change inresonance frequency �f/f0 as a function of strain amplitude
Table 1. General Rock Propertiesa
Rock ProvenanceDimensions,
cm
CompressiveStrength,MPa
AirPermeability,
mdarcy Description
ASI Marble Turkey 38.4 � 2.5 1 rhombohedral,monocrystallinemagnesium calcite
Estaillades Limestone France 116 � 8 300 bioclastic limestoneBerea sandstone (a) United States 48.7 � 5 32 fine-grained sandstone,
85% quartz,8% feldspar,2% smectite,2% mica/illite,1% kaolinite
Berea sandstone (b) United States 25.5 � 2.6 � 0.95rectangular parallelepiped
32 fine-grained sandstone,85% quartz,8% feldspar,2% smectite,2% mica/illite,1% kaolinite
Meule Sandstone France 107.6 � 5 35 180 fine-grained, argillaceous(illite, kaolinite)micaceous sandstone:74% quartz,21% feldspar,2% smectite,2% mica/illite,1% kaolinite
Fontainebleau sandstone France 39 � 4 >70 1200 Pure quartz sandstoneSt. Pantaleon limestone France 115.5 � 8 4000 Bioclastic limestoneLavoux limestone France 115 � 5 25 pelletoidal limestone,
99% calciteLavoux limestone France 25.5 � 2.6 � 0.95
rectangular parallelepiped25 pelletoidal limestone,
99% calciteChalk France 63.8 � 9 4 pure calcitePVC 120 � 10.5 0Plexiglas 34 � 4 0Polycarbonate 101.6 � 4 0
aSample information for the seven rocks and three elastic linear standards described in this paper (circular cylinder except as noted). Information is leftblank where data do not exist.
B02202 JOHNSON ET AL.: NONLINEAR ELASTIC PARAMETER IN ROCK
4 of 12
B02202

�e for the samples of Berea sandstone (Figure 2a), ASImarble (Figure 2b), Estaillades limestone (Figure 2c), andFontainebleau sandstone (Figure 2d). The estimated af areshown in Figure 2 for all conditions and are tabulated inTable 2. Figure 3 shows similar results for the saturationtests conducted on the samples of St. Pantaleon limestone(Figure 3a), chalk (Figure 3b), and Meule sandstone(Figure 3c). Again, af are shown in Figure 3 and latertabulated in Table 2 together with linear properties. Note thehuge variation of af that correspond to different damage/saturation states.[20] Figure 4 shows the results frommeasurements in three
standards up to strains far greater than those in the rocksamples (>10�4 in the case of the polycarbonate), indicatingthat the system nonlinearities are negligible. Figure 5 showsaf as a function of saturation for the Meule sandstone and the
chalk samples. Figures 6a–6f shows the relation betweenvelocity c2, proportional to Young’s modulus, with thechange in af for each rock sample. Figure 6f shows all datatogether. Note that except for the ASImarble, the change inaf
is 2–3 orders of magnitude while the change in modulus isless than an order ofmagnitude for the various physical states.
5. Discussion
[21] The slopes of the change in frequency with strain areuniversally one as the P-M space theory predicts. This isindeed gratifying considering the huge differences in chem-ical and physical makeup of these materials. It is importantto note that the correct selection of the linear resonancefrequency is extremely important and one must be careful indoing so. Appendix A describes why.
Figure 2. Change in frequency j�f/f0j with strain amplitude e = �e in four materials under varyingconditions as noted. The hysteretic nonlinear parameter af is shown for each sample under all conditionsmonitored. For the Berea sample (Figure 2a), the damage took place before the sample reached 100�C. Inthe case of the ASI marble (Figure 2b), the sample was taken out of the oven and placed in a water bath inorder to shock it.
B02202 JOHNSON ET AL.: NONLINEAR ELASTIC PARAMETER IN ROCK
5 of 12
B02202
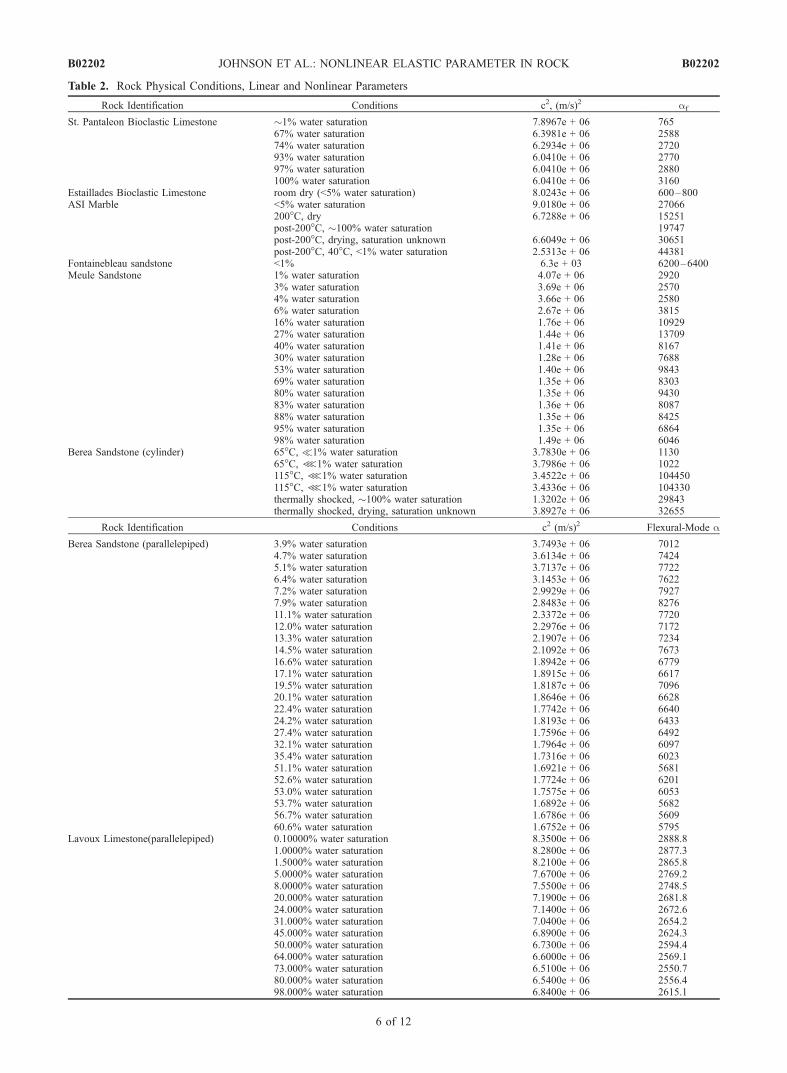
Table 2. Rock Physical Conditions, Linear and Nonlinear Parameters
Rock Identification Conditions c2, (m/s)2 af
St. Pantaleon Bioclastic Limestone �1% water saturation 7.8967e + 06 76567% water saturation 6.3981e + 06 258874% water saturation 6.2934e + 06 272093% water saturation 6.0410e + 06 277097% water saturation 6.0410e + 06 2880100% water saturation 6.0410e + 06 3160
Estaillades Bioclastic Limestone room dry (<5% water saturation) 8.0243e + 06 600–800ASI Marble <5% water saturation 9.0180e + 06 27066
200�C, dry 6.7288e + 06 15251post-200�C, �100% water saturation 19747post-200�C, drying, saturation unknown 6.6049e + 06 30651post-200�C, 40�C, <1% water saturation 2.5313e + 06 44381
Fontainebleau sandstone <1% 6.3e + 03 6200–6400Meule Sandstone 1% water saturation 4.07e + 06 2920
3% water saturation 3.69e + 06 25704% water saturation 3.66e + 06 25806% water saturation 2.67e + 06 381516% water saturation 1.76e + 06 1092927% water saturation 1.44e + 06 1370940% water saturation 1.41e + 06 816730% water saturation 1.28e + 06 768853% water saturation 1.40e + 06 984369% water saturation 1.35e + 06 830380% water saturation 1.35e + 06 943083% water saturation 1.36e + 06 808788% water saturation 1.35e + 06 842595% water saturation 1.35e + 06 686498% water saturation 1.49e + 06 6046
Berea Sandstone (cylinder) 65�C, 1% water saturation 3.7830e + 06 113065�C, z1% water saturation 3.7986e + 06 1022115�C, z1% water saturation 3.4522e + 06 104450115�C, z1% water saturation 3.4336e + 06 104330thermally shocked, �100% water saturation 1.3202e + 06 29843thermally shocked, drying, saturation unknown 3.8927e + 06 32655
Rock Identification Conditions c2 (m/s)2 Flexural-Mode a
Berea Sandstone (parallelepiped) 3.9% water saturation 3.7493e + 06 70124.7% water saturation 3.6134e + 06 74245.1% water saturation 3.7137e + 06 77226.4% water saturation 3.1453e + 06 76227.2% water saturation 2.9929e + 06 79277.9% water saturation 2.8483e + 06 827611.1% water saturation 2.3372e + 06 772012.0% water saturation 2.2976e + 06 717213.3% water saturation 2.1907e + 06 723414.5% water saturation 2.1092e + 06 767316.6% water saturation 1.8942e + 06 677917.1% water saturation 1.8915e + 06 661719.5% water saturation 1.8187e + 06 709620.1% water saturation 1.8646e + 06 662822.4% water saturation 1.7742e + 06 664024.2% water saturation 1.8193e + 06 643327.4% water saturation 1.7596e + 06 649232.1% water saturation 1.7964e + 06 609735.4% water saturation 1.7316e + 06 602351.1% water saturation 1.6921e + 06 568152.6% water saturation 1.7724e + 06 620153.0% water saturation 1.7575e + 06 605353.7% water saturation 1.6892e + 06 568256.7% water saturation 1.6786e + 06 560960.6% water saturation 1.6752e + 06 5795
Lavoux Limestone(parallelepiped) 0.10000% water saturation 8.3500e + 06 2888.81.0000% water saturation 8.2800e + 06 2877.31.5000% water saturation 8.2100e + 06 2865.85.0000% water saturation 7.6700e + 06 2769.28.0000% water saturation 7.5500e + 06 2748.520.000% water saturation 7.1900e + 06 2681.824.000% water saturation 7.1400e + 06 2672.631.000% water saturation 7.0400e + 06 2654.245.000% water saturation 6.8900e + 06 2624.350.000% water saturation 6.7300e + 06 2594.464.000% water saturation 6.6000e + 06 2569.173.000% water saturation 6.5100e + 06 2550.780.000% water saturation 6.5400e + 06 2556.498.000% water saturation 6.8400e + 06 2615.1
B02202 JOHNSON ET AL.: NONLINEAR ELASTIC PARAMETER IN ROCK
6 of 12
B02202

5.1. Thermal Shock-Induced Damage
[22] The results shown in Figure 2 give an idea of therange of the af under mostly dry conditions. The hugechange in af between 65 and 100�C in Berea sandstonecould be due in part to decreasing water saturation (see
below) but more importantly, to damage that occurred whilethe sample was at or above 100�C. The value of af increasesby an order of magnitude with the introduction of thermaldamage. Note that it is well established empirically thathysteresis and therefore af increases with damage quantity[e.g., Johnson, 1999; Van Den Abeele et al., 2000b]. Thesample did not return to its original state after heating asseen in later tests not shown, and we verified that thermaldamage had taken place by qualitative visual inspectionafter the experiment. The ASI marble (Figure 2b) exhibitsdifferent behavior than the sandstone during heating in thatthe ambient af is smaller than that measured at 200�C, andas the sample dries after saturation, af becomes larger. Inaddition, the change in af is comparable to that in the linearmodulus. The ASI marble appears to have an ability to healitself in some manner during the heating and shock proce-dure. Detailed inspections for damage the samples usingsuch techniques as using photomicrographs and other meth-ods were not conducted. This certainly would have been ofsome value, but at the same time, it is known that thedamage scale that induces elastic nonlinear behavior canapparently range from near atomic to 10�3 m at least [e.g.,Ten Cate et al., 2000], and therefore such inspections are oflimited value. In fact, the quantitative relation betweendamage and the nonlinear coefficient remains a centralquestion in this domain of study, and is actively beingpursued by several groups. This is to say, we do not knowwhat the origin of the nonlinear behavior is. We only knowthat a is empirically correlated to damage (whatever thatmeans) at all scales tested to date.
5.2. General Comments on Other Samples
[23] The sample of Estaillades limestone shown inFigure 2c has a relatively low range of af in the dry statecompared with the other rocks. We submit that this isbecause the limestone has a relatively small amount ofinherent microdamage/macrodamage compared to the otherrocks. The result on dry St. Pantaleon limestone is verysimilar so this may be characteristic of limestones ingeneral. Fontainebleau sandstone in particular is highlynonlinear in its natural, dry state, and this is due to thefriability of the bond structure, we believe. Chalk is alsovery nonlinear under all saturation conditions as has beennoted before [Johnson et al., 1996], and we believe this isdue to the Velcro-like nature of the microplanktonic fossilmaterial that comprises the chalk [e.g., Bourbie et al., 1986;Lucet et al., 1991].
5.3. Effects of Water Saturation
[24] Van Den Abeele et al. [2002] conducted quantita-tive studies of the effect of contained moisture in severalrock samples, including the same Meule sandstone andLavoux limestone samples. Their studies show that at lowwater saturations, molecular layers of adsorbed fluids aswell as capillary condensation significantly influence thedynamic and linear nonlinear behavior due to the inducedinternal molecular forces. They observed a significantincrease in the nonlinear response in several rocks inthe saturation range of 1–20% especially in rocks con-taining small pore systems such as limestone. This is aresult of an increased fluid-solid interaction upon wettingcausing the material to expand and soften. Simultaneously,
Figure 3. Change in frequency j�f/foj with strainamplitude e = �e in three materials under varying watersaturation conditions as noted. The hysteretic nonlinearparameter af is shown for each sample under all conditionsmonitored.
B02202 JOHNSON ET AL.: NONLINEAR ELASTIC PARAMETER IN ROCK
7 of 12
B02202

the microscopic and mesoscopic hysteretic entities that are,in ensemble, the origin of nonlinear response, are progres-sively activated at different pressures as a function of lowwater saturation. As a consequence of the moisture-in-duced forces, the number of active hysteretic unitsincreases with saturation. The fact that the nonlinearresponse increases with water saturation especially in thelow saturation range, implies that the presence of moistureplays a major role in the nonlinear mechanism(s), or in theactivation of that (those) mechanism(s).
Figure 4. Change in frequency j�f/foj with strainamplitude e = �e in three ‘‘linear’’ elastic standards usedto compare with results obtained in the rocks. The af = 0 ineach case.
Figure 5. The af as function of water saturation in tworock types.
B02202 JOHNSON ET AL.: NONLINEAR ELASTIC PARAMETER IN ROCK
8 of 12
B02202

Figure 6. (a)–(e) Velocity squared, proportional to Young’s modulus, versus af for each of the rocksamples (excluding Fontainebleau sandstone and Estaillade limestone) under all conditions tested.(f) Combined data. (g)–(h) Flexural data from Van Den Abeele et al. [2002].
B02202 JOHNSON ET AL.: NONLINEAR ELASTIC PARAMETER IN ROCK
9 of 12
B02202

[25] At higher levels of saturation, capillary condensationtakes place. Capillary condensation commences when themolecular adsorbed water layers in the finest pores abruptlyalter to a more stable arrangement, due to surface tension,by forming a meniscus between the liquid water and gasphase. As one may expect, this sudden transition does notoccur uniformly over the entire sample. It is highly depen-dent on the range of pore dimensions inherent to rocks.Since the microscopic capillary pressure in absence ofexternal loads is always positive, it exerts a tensile loading.
The sparse data set available for the St. Pantaleon limestonefits the above interpretation as well.[26] The chalk sample exhibits entirely different behavior
at low water saturations. The nonlinear response isenormous until between 5 and 10% water saturation,where it begins to resemble the behavior of other rocks.We do not know why the sample displays such behaviorbut chalk is well known to display peculiar mechanicalbehavior [e.g., Bourbie et al., 1986; Risnes and Flaageng,1999].
6. Conclusions
[27] In this article we present the longitudinal-modehysteretic nonlinear parameter af for eight different rocktypes and two for the flexural-mode af. Rock typesincluded are sandstones, limestones, marble, and chalkunder a variety of damage and water saturation condi-tions. The range of af is several hundred to tens ofthousand depending on physical state. Unfortunately,some of the work presented here, in particular for thethermal shock measurements is qualitative because com-parisons could not be made to other measures of damage.On the other hand, the experiments conducted undercontrolled saturation conditions are truly quantitative.We hope that this work will spur further work intoexploring and categorizing the nonlinear behavior of rock.We believe a will become a common identificationphysical parameter for rock, just as wave speed, Q, andmodulus are today.
Appendix A: Errors in Calculation of theNonlinear Parameter A
A1. Errors in Estimation of f0[28] Very small errors in the selection of w0 can lead
to significant misfits in the frequency-strain relation.Figure A1 illustrates this effect in the frequency-strainscaling relation for a typical NME material nonlinearparameter af = 104. Errors in f0 can be due to too largedrive frequency sampling in the time-averaged frequencyresponse or broad resonance frequency peaks due to low
Figure A1. Systematic errors in normalized resonanceangular frequency shift j�f/f0j as a result of errors due toincorrect selection of the linear frequency w0. Horizontalaxis is the strain amplitude �e of each resonance peak. Thecorrect f0 for a nonclassical model is shown by the solidline, where the nonlinear parameter a = 104. The percenterror up to ±0.0006 is shown. Clearly, even very smallerrors in f0 lead to significant errors in the j�f/f0j versus �e,particularly at small strain levels.
Figure A2. Selection errors in w0 that lead to errors in the dependence of frequency change j�f/f0j tostrain �e from resonance experiments in Berea sandstone. (a) Selection of f0 slightly low. (b) Selection off0 slightly high.
B02202 JOHNSON ET AL.: NONLINEAR ELASTIC PARAMETER IN ROCK
10 of 12
B02202

values of Q, for instance, but more often to the effect ofslow dynamics [e.g., Ostrovsky and Johnson, 2001; TenCate et al., 2000]. In Figure A1, we create frequency-strain data and then estimate the effect of small errors inthe choice of f0. For instance, a 1 Hz error at a resonancefrequency of 13 kHz is ±0.008% error. This error can easilyappear in digital data where the drive frequency samplingmay exceed 0.008%. The resulting slope fit is 0.84 andlarger than 2, respectively. For an error of ±0.0031%(corresponding to a 4 Hz error in w0 at 13 kHz), the errorin the fits becomes rapidly worse: as small as 0.7 and largerthan 3, respectively, with severe influence on the smallamplitude data. The details of the induced errors will varywith a; however, the general behavior will remain asillustrated in Figure A1.[29] Figure A2a illustrates data taken from an experiment
in Berea sandstone where f0 was unintentionally chosenlower than the actual value. It is clear that a poor choice ofw0 on the low-frequency side is not difficult to discern. Onthe other hand, a poor choice on the high-frequency side ofw0 is more difficult. There is only a slight indication in thelowest amplitudes where an inflection point develops, as theerror becomes larger. For example, Figure A2b illustratesone example. The inflection point occurring at just undere = 10�7 indicates that f0 is too high. On the other hand,choosing f0 too large introduces very little error.
A2. Slow Dynamics and Estimation of f0[30] The effects of slow dynamics on the resonance-
frequency strain scaling relation are several. The mostobvious is that a sample must be in its equilibrium reststate before a resonance experiment begins. That is to say,the sample must remain undisturbed for at least 103 s after a
previous excitation. Otherwise, the modulus and thereforethe linear resonance frequency f0 will always be less thanthe actual equilibrium value, leading to influence on data asdescribed in the previous figures. The effect will depend onthe intensity of the slow dynamical response of a sample,and the equilibration recovery time. Changes of frequencyof order of those shown in Figure A2 are not uncommonwith relaxations of 103 s. On the other hand, this is arelatively easy effect to detect because it decreases reso-nance frequency, just as described earlier. In study ofseveral hundred data sets for a large number of materials,we observe the effect of especially slow dynamics to besignificant.
A3. Higher-Order Nonlinear Regime
[31] Figure A3. shows a result taken on Meule sandstonewhere the normalized frequency changes slope at largerstrain levels. The first-order predictions based on a uniformP-M space model of nonlinear elasticity are not valid atthese higher dynamic strain levels. It is a region in dynamicstrain as yet not well explored. In this paper, data taken atstrains beyond this inflection point were not used in theanalyses.
[32] Acknowledgments. Work was supported by the Office of BasicEnergy Science of the U.S. Department of Energy operated by theUniversity of California, by the Institut Francais du Petrole, and by CNRS,France, and by the Foundation for Scientific Research of Flanders,Belgium.
ReferencesAdams, F. D., and E. G. Coker (1906), An investigation into the elasticconstants of rocks, more especially with reference to cubic compressi-bility, Carnegie Inst., 46.
Blackstock, D., and M. Hamilton (Eds.) (1998), Nonlinear Acoustics,Academic, San Diego, Calif.
Bourbie, T., O. Coussy, and B. Zinszner (1986), Acoustics of Porous Media,Technic, Paris.
Guyer, R. A., and P. A. Johnson (1999), Nonlinear mesoscopic elasticity:Evidence of a new class of materials, Phys. Today, 52, 30–35.
Guyer, R. A., K. R. McCall, P. A. Johnson, P. N. J. Rasolofosaon, andB. Zinszner (1995), Equation of state hysteresis and resonant bar mea-surements in rock, Proc. U.S. Rock Mech. Symp., 35th, 177–185.
Guyer, R. A., K. R. McCall, G. N. Boitnott, L. B. Hilbert Jr., and T. J. Plona(1997), Quantitative implementation of Preisach-Mayergoyz space to findstatic and dynamic elastic moduli in rock, J. Geophys. Res., 102, 5281–5293.
Guyer, R. A., P. A. Johnson, and J. N. TenCate (1999), Hysteresis and thedynamic elasticity of consolidated granular materials, Phys. Rev. Lett., 82,3280–3283.
Johnson, D. L., H. A. Makse, N. Gland, and L. Swartz (2000), Nonlinearelasticity of granular media, Physica B, 279, 134–138.
Johnson, P. A. (1999), The new wave in acoustic testing, Mater. World, 7,544–546.
Johnson, P. A., and P. N. J. Rasolofosaon (1996), Manifestation of non-linear elasticity in rock: Convincing evidence over large frequency andstrain intervals from laboratory studies, Nonlinear Processes Geophys.,3, 77–88.
Johnson, P. A., B. Zinszner, and P. N. J. Rasolofosaon (1996), Resonanceand nonlinear elastic phenomena in rock, J. Geophys. Res., 101, 11,553–11,564.
Landau, L. D., and E. M. Lifschitz (1986), Theory of Elasticity, 3rd rev,Engl. ed., Pergamon, New York.
Lucet, N., P. N. J. Rasolofosaon, and B. Zinszner (1991), Sonic propertiesof rock under confining pressure using the resonant bar technique,J. Acoust. Soc. Am., 89, 980–990.
McCall, K. R., and R. A. Guyer (1994), Equation of state and wave pro-pagation in hysteretic nonlinear elastic material, J. Geophys. Res., 99,23,887–23,897.
Naugolnykh, K., and L. Ostrovsky (1998), Nonlinear Wave Processes inAcoustics, Cambridge Univ. Press, New York.
Ostrovsky, L., and P. A. Johnson (2001), Dynamic nonlinear elasticity ingeomaterials, Riv. Nuovo Cimento Ital. Phys. Soc., 24, 1–46.
Figure A3. Example of higher-order nonlinear regime inMeule sandstone. At strains of approximately 2 � 10�5 thej�f/f0j ��e scaling relation begins to turn over. Strainamplitudes where this behavior is observed are not yet wellunderstood.
B02202 JOHNSON ET AL.: NONLINEAR ELASTIC PARAMETER IN ROCK
11 of 12
B02202

Pandit, B., and J. C. Savage (1973), Experimental test of Lomnitz’s theoryof internal friction in rocks, J. Geophys. Res., 78, 6097–6099.
Risnes, R., and O. Flaageng (1999), Mechanical properties of chalk withemphasis on chalk-fluid interactions and micromechanical aspects, OilGas Sci. Technol., 54, 751–758.
Sharma, M. M., and A. Tuntuncu (1994), Grain contact adhesion hyster-esis—A mechanism for attenuation of seismic waves, Geophys. Res.Lett., 21, 2323–2326.
Ten Cate, J., E. Smith, and R. Guyer (2000), Universal slow dynamics ingranular solids, Phys. Rev. Lett., 85, 1020–1024.
Van Den Abeele, K. E.-A., P. A. Johnson, R. A. Guyer, and K. R. McCall(1997), On the analytical solution of hysteretic nonlinear response inelastic wave propagation, J. Acoust. Soc. Am., 101, 1885–1898.
Van Den Abeele, K. E.-A., J. Carmeliet, J. A. Ten Cate, and P. A. Johnson(2000a), Nonlinear Elastic Wave Spectroscopy (NEWS) techniques todiscern material damage. Part I: Nonlinear Wave Modulation Spectro-scopy (NWMS), Res. NonDestructive Eval., 12, 17–30.
Van Den Abeele, K. E.-A., J. Carmeliet, and P. A. Johnson (2000b), Non-linear Elastic Wave Spectroscopy (NEWS) techniques to discern materialdamage. Part II: Single mode nonlinear resonance acoustic spectroscopy,Res. NonDestructive Eval., 12, 31–43.
Van Den Abeele, K. E.-A., J. Carmeliet, P. A. Johnson, and B. Zinszner(2002), The influence of water saturation on the nonlinear elastic meso-scopic response in earth materials and the implications to the mechanismof nonlinearity, J. Geophys. Res., 107(B6), 2121, doi:10.1029/2001JB000368.
Zinszner, B., P. A. Johnson, and P. N. J. Rasolofosaon (1997), Influence ofchange in physical state on elastic nonlinear response in rock: Effects ofconfining pressure and saturation, J. Geophys. Res., 102, 8105–8120.
�����������������������F. Cohen-Tenoudji, Laboratoire Environnement et Developpement,
Universite Paris VII, 2 Place Jussieu, Paris 75251, France.P. A. Johnson, Geophysics Group, Los Alamos National Laboratory, Mail
Stop D443, Los Alamos, NM 87545, USA. ([email protected])P. Rasolofosaon, Rock Physics, Institut Francais du Petrole, Ave. Bois
Preau, Rueil Malmaison, France. ([email protected])K. Van Den Abeele, Interdisciplinary Research Center, Faculty of
Science, Catholic University Leuven Campus Kortrijk, E. Sabbelaan 53,B-8500 Kortrijk, Belgium. ([email protected])B. Zinszner, Rock Physics, Institut Francais du Petrole, 2-4 Ave. Bois
Preau, Rueil Malmaison, France. ([email protected])
B02202 JOHNSON ET AL.: NONLINEAR ELASTIC PARAMETER IN ROCK
12 of 12
B02202