dynamic mechanical properties of fhort fiber reinforced
TRANSCRIPT
Dynamic Mechanical Properties of Short Fiber Reinforced Polymers
by
Adam Pearson
A thesis submitted in conformity with the requirements for the degree of Masters of Applied Science
Mechanical and Industrial Engineering University of Toronto
© Copyright by Adam Pearson 2017

ii
Dynamic Mechanical Properties of Short Fiber Reinforced
Polymers
Adam Pearson
Masters of Applied Science
Mechanical and Industrial Engineering
University of Toronto
2017
Abstract
Recently there has been a drive to replace traditional engineering materials with polymeric
solutions. Fiber reinforced polymers offer combine the inherent benefits of polymers such as
light weight and anti-corrosion with high strength and stiffness to weight ratios. Polymers are
highly viscoelastic meaning they have both elastic, solid, and viscous, fluid like behavior and
their mechanical properties are time dependent. Dynamic mechanical analysis is a useful tool in
measuring the viscoelastic behavior of materials, and glass transition in response to cyclic
loading cycles. Each chapter in this work studies the dynamic mechanical behavior of a different
class of polymer, from polyurethane thermosetting rubber, to polyester based thermoplastic
elastomer, to high performance polyamide thermoplastic. In each case, novel composite
materials have been developed and characterized by reinforcement with selective fibers which
was found to significantly enhance the mechanical and thermal properties of the pure polymer.

iii
Acknowledgments
I’d like to start by thanking my parents for their continued support allowing me to do the things I
want to do. And to my family, I wouldn’t be here without them.
I would also like to thank my supervisor, Prof. Hani Naguib. I am very grateful for his guidance
and advice offered throughout my thesis. It has been a great pleasure to work with you, and to be
mentored by a leader in the materials field has been invaluable.
Next is to the members of the SAPL lab. It has been a wonderful experience to work with you all
and I’d like to thank you for making these last two years very enjoyable. I’d like to give a special
mention to Shahrzad Ghaffari, and Farooq Al-Jahwari for initially welcoming me to the lab and
whose guidance through the first months of my thesis was very much appreciated.

iv
Table of Contents
Acknowledgments.......................................................................................................................... iii
Table of Contents ........................................................................................................................... iv
List of Tables ............................................................................................................................... viii
List of Figures ..................................................................................................................................x
Chapter 1 Introduction .....................................................................................................................1
1.1 Preamble ..............................................................................................................................1
1.2 Viscoelastic Properties and Behaviour ................................................................................2
1.3 Thesis Objectives and Motivation .......................................................................................3
1.4 Thesis Organization .............................................................................................................4
1.5 Contributions........................................................................................................................5
1.6 References ............................................................................................................................7
Chapter 2 ..........................................................................................................................................8
Novel polyurethane elastomeric composites reinforced with Alumina, Aramid, and
poly(p-phenylene-2,6-benzobisoxazole) short fibers, development and characterization of
the thermal and dynamic mechanical properties .........................................................................8
2.1 Abstract ................................................................................................................................9
2.2 Introduction ........................................................................................................................10
2.3 Experimental ......................................................................................................................11
2.3.1 Materials ................................................................................................................11
2.3.2 Polyurethane Composites Fabrication ...................................................................12
2.3.3 Scanning Electron Microscopy ..............................................................................14
2.3.4 Thermogravimetric Analysis .................................................................................14
2.3.5 Thermomechanical Analysis ..................................................................................14
2.3.6 Dynamic Mechanical Analysis ..............................................................................14
v
2.4 Results and Discussion ......................................................................................................15
2.4.1 Thermogravimetric Analysis .................................................................................15
2.4.2 Thermomechanical Analysis, Coefficient of Linear Thermal Expansion .............16
2.4.3 Dynamic Mechanical Properties – Effect of Strain ...............................................18
2.4.4 Dynamic Mechanical Properties – Effect of Frequency ........................................22
2.4.5 Dynamic Mechanical Properties – Effect of Temperature ....................................26
2.5 Conclusions ........................................................................................................................28
2.6 Acknowledgements ............................................................................................................28
2.7 References ..........................................................................................................................29
Chapter 3 ........................................................................................................................................37
Strong and tough polyester based thermoplastic elastomer composites reinforced with
carbon and poly(p-phenylene-2,6-benzobisoxazole) short fibers .............................................37
3.1 Abstract ..............................................................................................................................38
3.2 Introduction ........................................................................................................................39
3.3 Materials and Methods .......................................................................................................40
3.3.1 Materials ................................................................................................................40
3.3.2 Composites Fabrication Process ............................................................................40
3.3.3 Thermogravimetric Analysis .................................................................................41
3.3.4 Differential Scanning Calorimetry .........................................................................42
3.3.5 Tensile Properties...................................................................................................42
3.3.6 Dynamic Mechanical Analysis ..............................................................................42
3.3.7 Scanning Electron Microscopy ..............................................................................42
3.4 Results and Discussion ......................................................................................................43
3.4.1 Scanning Electron Microscopy ..............................................................................43
3.4.2 Thermogravimetric Analysis .................................................................................45
3.4.3 Differential Scanning Calorimetry .........................................................................47

vi
3.4.4 Tensile Properties...................................................................................................49
3.4.5 Dynamic Mechanical Analysis ..............................................................................53
3.5 Conclusions ........................................................................................................................59
3.6 Acknowledgements ............................................................................................................60
3.7 References ..........................................................................................................................61
Chapter 4 ........................................................................................................................................66
Thermal, mechanical, and viscoelastic properties of Polyamide 6,6 hybrid composites with
rubber particles and glass fiber for high temperature applications ...........................................66
4.1 Abstract ..............................................................................................................................67
4.2 Introduction ........................................................................................................................68
4.3 Materials and Methods .......................................................................................................69
4.3.1 Materials ................................................................................................................69
4.3.2 Sample Fabrication ................................................................................................69
4.3.3 Thermogravimetric Analysis .................................................................................70
4.3.4 Differential Scanning Calorimetry .........................................................................70
4.3.5 Tensile Testing .......................................................................................................71
4.3.6 Dynamic Mechanical Analysis ..............................................................................71
4.3.7 Scanning Electron Microscopy ..............................................................................71
4.4 Results and Discussion ......................................................................................................73
4.4.1 Scanning Electron Microscopy ..............................................................................73
4.4.2 Thermogravimetric Analysis .................................................................................73
4.4.3 Differential Scanning Calorimetry .........................................................................75
4.4.4 Tensile Properties...................................................................................................77
4.4.5 Dynamic Mechanical Analysis ..............................................................................80
4.5 Conclusions ........................................................................................................................86
4.6 Acknowledgements ............................................................................................................87
vii
4.7 References ..........................................................................................................................88
Chapter 5 ........................................................................................................................................92
Conclusions and Future Work ...................................................................................................92
5.1 Concluding Remarks ..........................................................................................................92
5.2 Future Work .......................................................................................................................93
viii
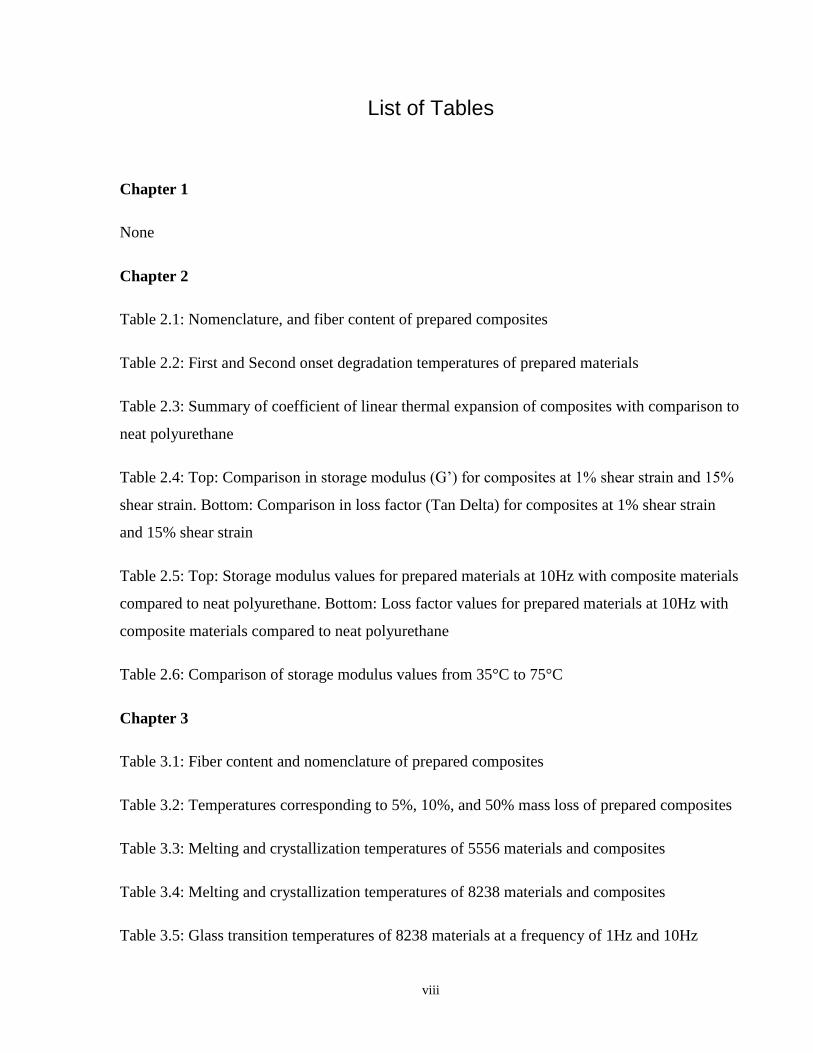
List of Tables
Chapter 1
None
Chapter 2
Table 2.1: Nomenclature, and fiber content of prepared composites
Table 2.2: First and Second onset degradation temperatures of prepared materials
Table 2.3: Summary of coefficient of linear thermal expansion of composites with comparison to
neat polyurethane
Table 2.4: Top: Comparison in storage modulus (G’) for composites at 1% shear strain and 15%
shear strain. Bottom: Comparison in loss factor (Tan Delta) for composites at 1% shear strain
and 15% shear strain
Table 2.5: Top: Storage modulus values for prepared materials at 10Hz with composite materials
compared to neat polyurethane. Bottom: Loss factor values for prepared materials at 10Hz with
composite materials compared to neat polyurethane
Table 2.6: Comparison of storage modulus values from 35°C to 75°C
Chapter 3
Table 3.1: Fiber content and nomenclature of prepared composites
Table 3.2: Temperatures corresponding to 5%, 10%, and 50% mass loss of prepared composites
Table 3.3: Melting and crystallization temperatures of 5556 materials and composites
Table 3.4: Melting and crystallization temperatures of 8238 materials and composites
Table 3.5: Glass transition temperatures of 8238 materials at a frequency of 1Hz and 10Hz

ix
Chapter 4
Table 4.1: Nomenclature of prepared PA66 materials and injection molding temperatures
Table 4.2: Crystallization and melting temperatures, and degree of crystallinity of PA66
materials
Chapter 5
None

x
List of Figures
Chapter 1
None
Chapter 2
Figure 2.1: Diagram of composite fabrication process outlining major processing steps
Figure 2.2: Thermogravimetric thermograms of prepared composites
Figure 2.3: Top: Selected thermal expansion curves for prepared polyurethane materials and
composites. Bottom: Coefficient of linear thermal expansion for polyurethane and prepared
composites
Figure 2.4: Storage modulus (top), loss modulus (middle), tan delta (bottom) for composites with
respect to increasing strain
Figure 2.5: SEM images of selected composites at 190x magnification. Clockwise from top left:
Polyurethane Neat, AL 3%, PBO 1%, KF 1%
Figure 2.6: Storage modulus (top), loss modulus (middle), tan delta (bottom) for composites with
respect to increasing frequency
Figure 2.7: Storage modulus (top), loss modulus (middle), tan delta (bottom) for composites with
respect to increasing temperature
Chapter 3
Figure 3.1: Left column top to bottom: 5556x100, 5556 5CFx350, 5556 10CFx750, 5556
5PBOx750, 5556 10PBOx350. Right column top to bottom: 8238 x100, 8238 5CFx750, 8238
10CFx350, 8238 5PBOx350, 8238 10PBOx750
Figure 3.2: Thermogravimetric thermograms for 5556 and composites
Figure 3.3: Thermogravimetric thermograms for 8238 and composites
xi
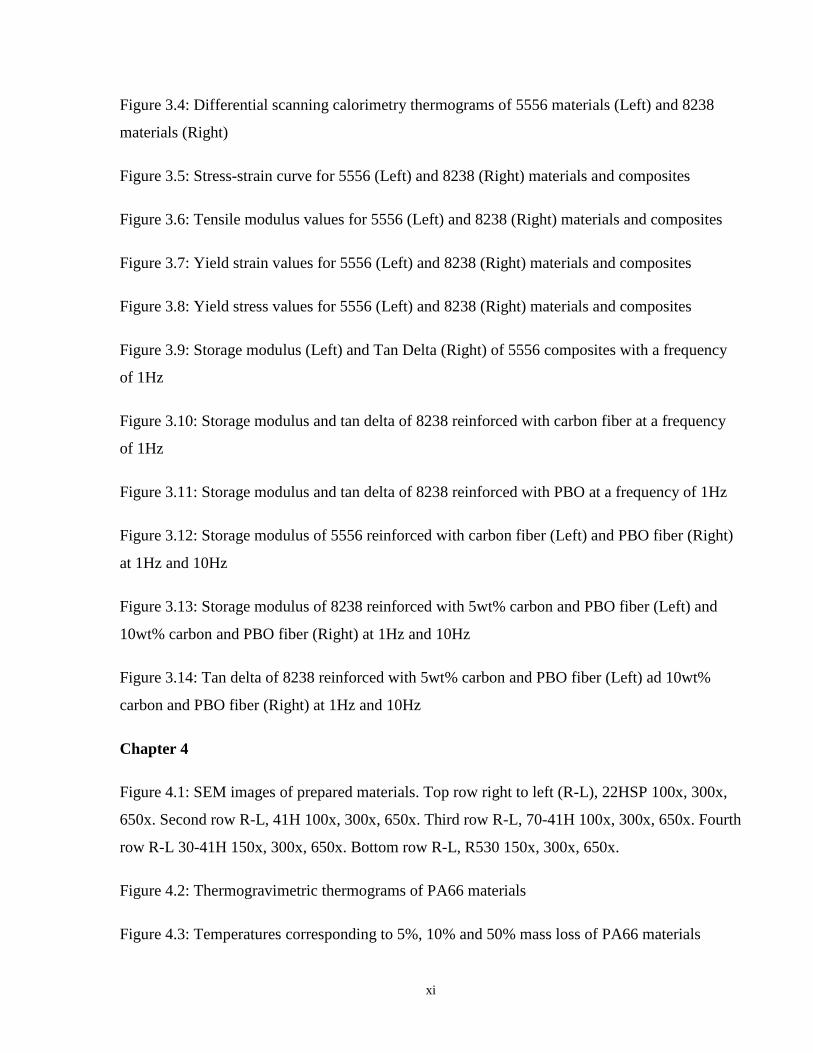
Figure 3.4: Differential scanning calorimetry thermograms of 5556 materials (Left) and 8238
materials (Right)
Figure 3.5: Stress-strain curve for 5556 (Left) and 8238 (Right) materials and composites
Figure 3.6: Tensile modulus values for 5556 (Left) and 8238 (Right) materials and composites
Figure 3.7: Yield strain values for 5556 (Left) and 8238 (Right) materials and composites
Figure 3.8: Yield stress values for 5556 (Left) and 8238 (Right) materials and composites
Figure 3.9: Storage modulus (Left) and Tan Delta (Right) of 5556 composites with a frequency
of 1Hz
Figure 3.10: Storage modulus and tan delta of 8238 reinforced with carbon fiber at a frequency
of 1Hz
Figure 3.11: Storage modulus and tan delta of 8238 reinforced with PBO at a frequency of 1Hz
Figure 3.12: Storage modulus of 5556 reinforced with carbon fiber (Left) and PBO fiber (Right)
at 1Hz and 10Hz
Figure 3.13: Storage modulus of 8238 reinforced with 5wt% carbon and PBO fiber (Left) and
10wt% carbon and PBO fiber (Right) at 1Hz and 10Hz
Figure 3.14: Tan delta of 8238 reinforced with 5wt% carbon and PBO fiber (Left) ad 10wt%
carbon and PBO fiber (Right) at 1Hz and 10Hz
Chapter 4
Figure 4.1: SEM images of prepared materials. Top row right to left (R-L), 22HSP 100x, 300x,
650x. Second row R-L, 41H 100x, 300x, 650x. Third row R-L, 70-41H 100x, 300x, 650x. Fourth
row R-L 30-41H 150x, 300x, 650x. Bottom row R-L, R530 150x, 300x, 650x.
Figure 4.2: Thermogravimetric thermograms of PA66 materials
Figure 4.3: Temperatures corresponding to 5%, 10% and 50% mass loss of PA66 materials
xii
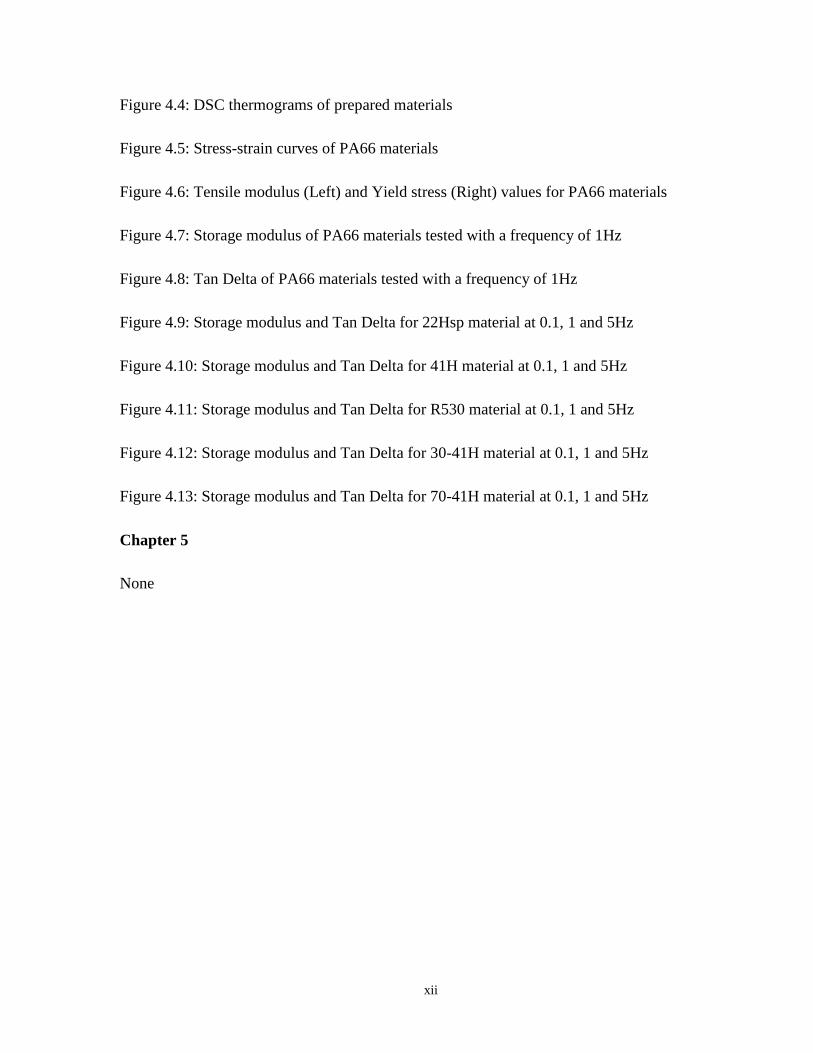
Figure 4.4: DSC thermograms of prepared materials
Figure 4.5: Stress-strain curves of PA66 materials
Figure 4.6: Tensile modulus (Left) and Yield stress (Right) values for PA66 materials
Figure 4.7: Storage modulus of PA66 materials tested with a frequency of 1Hz
Figure 4.8: Tan Delta of PA66 materials tested with a frequency of 1Hz
Figure 4.9: Storage modulus and Tan Delta for 22Hsp material at 0.1, 1 and 5Hz
Figure 4.10: Storage modulus and Tan Delta for 41H material at 0.1, 1 and 5Hz
Figure 4.11: Storage modulus and Tan Delta for R530 material at 0.1, 1 and 5Hz
Figure 4.12: Storage modulus and Tan Delta for 30-41H material at 0.1, 1 and 5Hz
Figure 4.13: Storage modulus and Tan Delta for 70-41H material at 0.1, 1 and 5Hz
Chapter 5
None
1
Chapter 1 Introduction
1.1 Preamble
Recently there has been a growing trend in many industries to replace traditional materials with
polymeric material solutions. One only needs to look as far as the next generation Boeing 787
Dreamliner aircraft where over 50% of the primary structure is made of polymer composite
materials [1]. Polymeric materials offer many inherent benefits over more traditional industrial
solutions, especially metallic structures. The primary benefit of polymer systems is low density
and light weight which strives to reduce costs of the materials system [2]. Additionally,
environmental restrictions in the automotive industry relating to fuel consumption had driven
demand for light weight alternatives to classically metallic structures. Other benefits of polymers
include inherent anti-corrosion and relatively simple manufacturing, such as injection and
compression molding, and extrusion [3], [4]. The drawback with pure polymeric based systems
is their relatively weak mechanical properties which has classically limited their applicability to
low stress and temperature applications. In this sense the development of fiber reinforced
polymers has recently been very important to industry and research to extend the functional base
of polymers [2], [5]. Many polymers also see much use in vibration damping applications due to
their highly viscoelastic nature which makes them ideal to reduce mechanical vibrations in an
engineering system [6], [7]. Therefore, the study of the time dependent properties of polymer
materials, and fiber reinforced polymer materials, in response to a sinusoidal stress or strain
profile is of great importance. Dynamic mechanical analysis is a useful tool to study the
viscoelastic properties of materials, as well important transitions such as glass transition [8], [9].
Chapter one introduces the objectives and motivation for the thesis followed. The organization of
the thesis is then explained with a brief description of each subsequent chapter. The relevant
contributions are then detailed.

2
1.2 Viscoelastic Properties and Behaviour
Polymers exhibit viscoelastic characteristics, meaning they are not perfect elastic solids,
therefore, when considering strains one must not only account for stress but also the rate at
which stress is applied [8]. In contrast to a perfectly elastic-plastic solid the stress-strain response
of a viscoelastic material is non-linear due do the fact that in a constant strain rate experiment
time is increasing as well as stress [10]. The main difference between elastic solids, such as
metals and ceramics, and polymers which account for this behaviour, is that polymers are made
up of long molecular chains [8]. When a mechanical stress is applied to viscoelastic materials it
causes time effects in strain as the molecules flow [8]. The viscoelastic nature of polyers give
rise to two nteresting phenomena creep, and stress relaxation. Creep behaviour in viscoelastic
materials is a response of increasing strain when a constant stress is applied to the material.
Conversely, when a constant strain is applied to a viscoelastic material their response is for stress
to decrease, caled stress relaxation.
If a cyclic loading pattern is applied to a viscoelastic matrial mechanical hysteresis occurs
leading to the dissipation of energy in the material. When a periodic sinusoidal stress is applied
to a viscoelastic material the strain response lags behind with a phase ange of delta [11]. The
storage modulus (G’, E’) is the modulus associated with the component of stress in phase with
the strain. The loss modulus (G”, E”) is associated with the component of stress out of phase
with the strain [9].
In terms of materials behaviour the storage modulus is comparable to Young’s elastic modulus
and it represents the proportion of energy “stored” or transferred through the material. In
contrast, the loss modulus is representative of the material’s viscous nature and serves to
represent the amoung of applied energy that is “lost” or dissipated in the material through the
generation of heat caused by internal friction of the sliding polymer chains. The loss factor, or
tan(δ), is the ratio of the loss modulus to the storage modulus and is representative of the portion
of the applied energy that is absorbed by the material [9].
The viscoelastic behaviour of materials is fundamental to their performance in structural and
engineering applications. For example, creep and stress relaxation may be unwanted material

3
behaviour for many strucural applications, particularly ones involving forces applied over long
periods of time. On the otherside viscoelastic behaviour in respince to dynamic loadings may be
taken advantage of in many vibration damping, impact resistance, and sound absorbtion
applications.
1.3 Thesis Objectives and Motivation
The overall goal of this thesis is the development of novel short fiber reinforced polymeric
materials for use in emerging applications. Primary focus will be spent on the characterization of
the time dependent, viscoelastic, properties of the materials through the use of dynamic
mechanical analysis. The understanding of these properties, storage modulus, loss modulus, and
loss factor, is very important in determining suitability and performance limits of the developed
materials. Specifically, the objectives can be broken down into three main points.
1. Gain a thorough understanding of the viscoelastic properties of a wide variety of
materials including thermosets, thermoplastics, and elastomers. Understand the nature of
the polymer matrix molecular structure and how it influences the dynamic mechanical
properties and important phenomenon such as glass transition. Study the viscoelastic
properties as a function of frequency, temperature, and strain where applicable.
2. Investigate other important mechanical and thermal properties associated with
manufacturing and end use applications. These include the study of thermal stability by
thermogravimetric analysis, and melting and crystallization behaviour, where applicable,
by differential scanning calorimetry. Investigate, through the use of thermomechanical
analysis, the thermal expansion behaviour of selected polymers, where applicable. Study
the constant strain rate mechanical properties and determine the modulus of elasticity,
yield strain, and yield stress.
3. Develop novel polymeric composite materials by incorporating a variety of short
reinforcing fibers in an effort to improve the mechanical, and dynamic mechanical
properties. Understand the influence of adducing fibers relating to the mechanical and
thermal properties described above.

4
1.4 Thesis Organization
The chapters of this thesis each represent a different class of polymeric materials, starting in
chapter two where the focus of research is directed towards soft thermoset elastomers. Chapter
three then follows by encompassing medium hardness thermoplastic elastomers and flexible
thermoplastic. In chapter four the topic of research then becomes the development and
characterization of fiber reinforced thermoplastic materials for high temperature and demanding
applications. A broad range of reinforcing fibers were studied including ceramic based fibers,
alumina, in chapter two, and glass, in chapter four, polymeric based fibers, aramid, in chapter
one, and poly(p-phenylene-2,6-benzobisoxazole) (PBO), in chapters two and three, and carbon
based fibers, in chapter three.
In chapter two composites with a thermoset polyurethane elastomer matrix were developed.
Polyurethane based systems offer many inherent benefits such as low temperature flexibility,
high abrasion resistance, biocompatibility, and resistance to many chemicals. However, the
relatively weak mechanical properties of the base matrix limit its potential range of applications.
In an effort to improve the mechanical behaviour composite materials of polyurethane elastomers
were reinforced with reinforced with Kevlar pulp, alumina micro fibers, and poly(p-phenylene-
2,6-benzobisoxazole) (PBO) fibers. Firstly, the thermal stability of the composite materials was
analysed through thermogravimetric analysis (TGA), following ASTM E2550, and the
degradation onset temperature was used as a quantitative measure of the thermal stability. Next
the coefficient of linear thermal expansion was analysed by thermomechanical analysis (TMA)
following ASTM E831. Finally, the dynamic mechanical properties, ASTM D5992, were
measured as functions of increasing strain, frequency, and temperature in order to gain a
thorough understanding of the viscoelastic nature of these composites.
In chapter three carbon and PBO short fibers were used as reinforcement in two grades of a
polyester based thermoplastic elastomer. This research focused on two grades of material, first a
medium hardness polymer possessing the mechanical properties and behaviour of a typical
thermoplastic elastomer. Secondly, a high hardness polyester based elastomer was studies which
has mechanical properties more similar to flexible thermoplastics such as polyethylene. Again,
the thermal stability of these materials was measured by TGA, ASTM E2550. Since these
materials are semi-crystalline thermoplastics, an investigation into the melting a crystallization
5
behavior was conducted by differential scanning calorimetry (DSC), following ASTM D3418.
The mechanical properties, modulus of elasticity, yield strain, and yield stress were determined
by standard constant strain rate tensile testing, ASTM D638. A dynamic mechanical analysis
(DMA) with the materials response to increasing temperature, and frequency was conducted to
study the viscoelastic behaviour of the prepared materials. For all tests an extensive discussion
was completed describing and comparing the effect of each reinforcing fiber type, carbon and
PBO, when combined with the neat polymer matrix.
Chapter four focused on the study of high temperature and performance polyamide thermoplastic
materials. Initially three base polyamide materials were characterised for their thermal,
mechanical, and dynamic mechanical performance by conducting the same tests as in chapter
three (TGA, DSC, Tenslie, DMA). The three primary polyamides that were studied comprised of
a neat material, a highly impact modified material containing carbon black and rubber particles,
and finally a glass fiber reinforced polyamide. Next polyamide hybrid composite materials were
created by melt blending the impact modified and the glass fiber reinforced material containing
composites filled with both rubber particles and stiff glass fibers. The thermal and mechanical
properties of these hybrid materials were then compared to the base grades as previously tested.
1.5 Contributions
This work makes several key contributions towards the field of fiber reinforced polymer
research, especially the viscoelastic properties of these materials. The key contributions are listed
as follows.
a. Development of novel thermoset elastomer composite materials by utilising new
reinforcing filler materials, PBO, Kevlar, and alumina fibers. Utilization of a relatively
simple and easily scalable manufacturing process for fiber dispersion and composite
fabrication by use of high-shear mixing and vacuum degassing.
b. Reinforcement of thermoplastic elastomeric materials by use of carbon and PBO short
fibers creating innovative polymer composite materials.
c. Development of high-temperature performance polyamide rubber particle and glass fiber
reinforced hybrid composites

6
d. Characterization and analytical discussion of the thermal stability, thermal expansion, and
dynamic mechanical properties with respect to strain, frequency and temperature of the
new composite materials.
e. Study of glass transition phenomena in original semi-crystalline thermoplastic
composites as a function of fiber content and frequency by dynamic mechanical analysis.
7
1.6 References
[1] C. S. Tang and J. D. Zimmerman, “Managing New Product Development and Supply
Chain Risks : The Boeing 787 Case,” Supply Chain Forum An Int. J., vol. 10, no. 2, pp.
74–87, 2009.
[2] M. A. Masuelli, “Introduction of Fibre-Reinforced Polymers − Polymers and Composites :
Concepts , Properties and Processes,” Technol. Appl. Concr. Repair, pp. 3–40, 2013.
[3] P. K. Mallick, Fiber-reinforced composites : materials, manufacturing, and design. 2008.
[4] D. Bhattacharya and R. Gowri Shankar Rao, “Indispensable Properties, Efficacy &
Application Of Thermoplastic Elastomers,” Int. J. Innov. Res. Dev., vol. 2, no. 5, pp. 381–
392, 2013.
[5] S. Stankovich et al., “Graphene-based composite materials,” Nature, vol. 442, no. 7100,
pp. 282–286, 2006.
[6] H. F. Brinson and L. C. Brinson, Polymer engineering science and viscoelasticity: An
introduction, Second edition. 2015.
[7] R. Lakes, “Viscoelastic Properties of Materials,” in Viscoelastic Materials, Cambridge
University Press, 2009, pp. 207–270.
[8] N. G. McCrum, C. P. Buckley, and C. B. Bucknall, Principles of Polymer Engineering.
Oxford University Press, USA, 1997.
[9] R. Lakes, “Dynamic Behavior,” in Viscoelastic Materials, Cambridge University Press,
2009, pp. 55–90.
[10] R. Lakes, “Introduction: Phenomena,” in Viscoelastic Materials, Cambridge University
Press, 2009, pp. 1–13.
[11] M.-J. Wang, “Effect of Polymer-Filler and Filler-Filler Interactions on Dynamic
Properties of Filled Vulcanizates,” Rubber Chem. Technol., vol. 71, no. 3, pp. 520–589,
1998.

8
Chapter 2
Novel polyurethane elastomeric composites reinforced with Alumina, Aramid, and poly(p-phenylene-2,6-benzobisoxazole) short fibers, development and characterization of the thermal and dynamic mechanical properties
--------------------------------------------------------------------------------------------------------------------
The content of this chapter has been published in Composites Part B: Engineering (License
Number: 4118380949236)
A. Pearson and H. E. Naguib, “Novel polyurethane elastomeric composites reinforced with
alumina, aramid, and poly(p-phenylene-2,6-benzobisoxazole) short fibers, development and
characterization of the thermal and dynamic mechanical properties,” Compos. Part B Eng., vol.
122, 2017.
https://doi.org/10.1016/j.compositesb.2017.04.017

9
2.1 Abstract
Polyurethane is an extremely versatile material having seen use in a variety of applications.
However, its relatively weak mechanical properties limit the scope of applicable functions. In
this paper, composite elastomers of polyurethane have been reinforced with Kevlar pulp,
Alumina micro fibers, and poly(p-phenylene-2,6-benzobisoxazole) (PBO) fibers. The thermal
and dynamic mechanical properties were characterized by thermogravimetric analysis (TGA),
thermomechanical analysis (TMA), and dynamic mechanical analysis (DMA). Upon the addition
of the reinforcing fibers an improvement in thermal stability as well as a significant reduction of
37% to the coefficient of linear thermal expansion was found. Additionally, an improvement of
97% to the storage modulus (G’) was found with the inclusion of a small amount of PBO fibers,
1wt%, to the polyurethane matrix.

10
2.2 Introduction
Polyurethane based systems offer many inherent benefits such as low temperature flexibility,
abrasion resistance, biocompatibility, and resistance to many chemicals [1], [2]. These
characteristics make polyurethane an exceptionally versatile material proven to be suitable for a
diverse range of applications from coatings in high performance engineering and aerospace
applications to biomedical analogues [3]-[8]. Furthermore, polyurethane materials see extensive
use in more traditional consumer grade products including footwear, furniture, insulation
materials, and elastomers [7]. Of particular importance to this study are soft polyurethane
elastomers with strong damping characteristics. With the intention of expanding the use of
polyurethanes to an ever broader range of applications the incorporation of novel fillers,
additives, and reinforcing materials to polyurethane matrices has been continuously studied.
Much research has been done on the addition of graphene and other conductive nano-particles to
introduce electrical conductivity to the overall material system [8]–[11]. Additionally,
polyurethane has been adapted to demonstrate self repairing behaviour [12], flame retardants
[13]–[16], and mechanochromism for strain sensing applications [17]. Furthermore, the shape
memory behavior of polyurethanes has been widely studied [18]–[23].
The reinforcement of the relatively weak polyurethane matrix has garnered significant interest.
Significant improvement in various mechanical and thermal properties can be achieved by the
incorporation of a variety of appropriate fillers. In this sense polyurethane has been shown to be
a suitable matrix for a number of reinforcing fillers including: carbon nano-particles [24]–[29],
silicon carbide [30], iron oxide [31], iron particles to fabricate magnetorheological elastomers
[32], carbon black, silica, and aluminium oxide [33], micro fibrillated cellulose [34], and banana
fiber [35]. Other reinforcing fillers have also included more traditional carbon, and glass fibers
[36]–[39].
Here the dynamic mechanical and thermal properties have been enhanced using novel filler
materials, alumina and poly(p-phenylene-2,6-benzobisoxazole) (PBO) fibers, as well as more
traditional aramid fibers. PBO fibers were selected due to their excellent mechanical properties
[40]–[43], in addition to other added benefits such as excellent fatigue properties [44], and
improved abrasion resistance [45]. Moreover, the influence of PBO fibers to an elastomeric
matrix and the impact on the dynamic properties is not widely studied. Alumina fibers are

11
interesting due to their excellent thermal resistance as well as very good mechanical properties
[46]. The smaller size of the alumina fiber should also make for easier dispersion. Similar to
PBO, aramid fibers have garnered interest due to their excellent mechanical properties and high
strength to weight ratio, as well as their good thermal performance and high degradation
temperature [47]–[49].
The aim of this present study is to characterize the dynamic mechanical properties, thermal
stability, and coefficient of thermal expansion of polyurethane reinforced with alumina, Kevlar,
and PBO short fibers. These composite elastomers were designed to improve upon the relatively
weak mechanical, and thermal properties of the pure polyurethane matrix while retaining
excellent vibration damping characteristics. A simple and easily scalable high-shear mixing
process was used to fabricate the composites. In this study we show that alumina, Kevlar, and
PBO fibers are promising reinforcing materials for polyurethane. We have observed an increase
in thermal stability, coefficient of thermal expansion, and dynamic modulus upon the addition of
the selected fibers.
2.3 Experimental
2.3.1 Materials
Two-part polyurethane casting resin (Shore A 60) was purchased from Fibre Glast. The resin,
Part A, contains an undisclosed proprietary polyol mixture, and the hardener, Part B, contains a
proprietary isocyanate mixture. The specific gravity is 1.06 for the cured compound. Kevlar pulp
specific gravity of 1.44 (pre-processing fiber length of 1.05 mm) was also purchased from Fibre
Glast. Alumina fibers, with a chemical composition of 72% Al2O3 and 28% SiO2 and specific
gravity of 3.1 (pre-processing fiber length 30-50mm), were provided my Mitsubishi Plastics
under the brand name of MAFTEC. Zylon HM, specific gravity of 1.56 (pre-processing fiber
length 3mm), purchased from Toyobo Co. were used as the PBO reinforcing fibers. The weight
fractions of Alumina fibers prepared were 0.5%, 1%, and 3%; referred to as AL 0.5, AL 1, and
AL 3 respectively. Additionally, Kevlar fibers of 0.5% and 1% by weight, referred to as KF 0.5
and KF 1 respectively, were prepared. Finally, PBO (Zylon HM) were prepared with weight
fractions of 0.5% and 1%, referred to as PBO 0.5 and PBO 1 respectively. Table 2.1 provides a
list of prepared materials.

12
Table of Prepared Composites
Reinforcing Filler Fiber Weight Fiber Volume Nomenclature
Alumina 0.50% 0.17% Al 0.5
1% 0.34% Al 1
3% 1.05% Al 3
Kevlar Pulp 0.50% 0.37% KF 0.5
1% 0.74% KF 1
PBO (Zylon HM) 0.50% 0.34% PBO 0.5
1% 0.68% PBO 1
Polyurethane Neat
Table 2.1: Nomenclature, and fiber content of prepared composites
2.3.2 Polyurethane Composites Fabrication
Approximately 35g urethane casting resin Part A was weighed in a beaker, and Part B was then
weighed at a ratio of 100:55 A:B by weight, as specified by the manufacturer. The desired
amount of reinforcing fiber was then weighed in a separate container. The reinforcing fiber was
then mixed and stirred into Part A polyol, by hand for approximately 5 minutes. The fibers were
then further dispersed using a high shear mixture, Mixerdirect DP1 Standard Single Shaft
Disperser, with the following procedure. An initial rotational speed of 500rpm was first used to
break apart the fiber agglomerates. The speed was then increased by 500rpm at three minute
intervals until a final speed of 2000rpm was reached. The mixture was then left at 2000rpm for a
period of ten minutes. The reinforcing fibers were added and mixed with 0.5wt% increments, so
the mixing and dispersing process was repeated until the full fiber loading had been achieved; ie.
the mixing procedure, for 1wt% fiber loadings, was performed twice, once at 0.5wt% and again
at the full 1wt%. A diagram outlining the major processing steps is shown in Figure 2.1. Due to a
limitation in the polyurethane matrix, the reinforcing materials, and the dispersing method,
higher PBO and KF fiber concentration could not reasonably be achieved. The polyol, resin part
A, when dispersed with more than 1wt% of either the PBO or KF fibers becomes too viscous for
the shear mixer. To achieve higher weight fractions of fiber a solvent, such as acetone, or other

13
dispersing agent would need to be used. However, the use of these types of solvents have been
previously shown to negatively impact mechanical properties, Young’s modulus, tensile
strength, and others and this was to be avoided here [50]–[52]. The use, and affect, of a
dispersing agent or solvent to achieve higher filler loadings in this system is a potential topic for
further research. Once the total fiber loading was achieved the polyol with dispersed fibers was
degassed in a vacuum chamber for 20 minutes. After removal from the vacuum chamber casting
resin Part B was added and manually stirred for one minute and the mixture was poured into a
rectangular silicone mould with dimensions approximately 120x50x6mm. The mould was then
placed back in the vacuum chamber for an additional 12 minutes and finally left to cure at room
temperature for a period of 48 hours before testing.
Figure 2.1: Diagram of composite fabrication process outlining major processing steps

14
2.3.3 Scanning Electron Microscopy
Scanning electron microscope (SEM) images were taken using a JEOL JSM6600 scanning
electron microscope (Jeol Corp., Tokyo, Japan) operated at 10 KV. Samples were cut from the
middle of the larger composite piece and then sputter coated with a thin layer of platinum
particles. Secondary electron imaging was used to view to surface morphology and wetting
between the fibers and matrix.
2.3.4 Thermogravimetric Analysis
An investigation of the decomposition temperature of the prepared polyurethane composites was
carried out using thermogravimetric analysis (TGA Q50, TA Instruments). Samples were cut to a
weight of approximately 20mg and tested to 500 °C in a nitrogen atmosphere with a heating rate
of 20°C/min, in accordance with ASTM E2550-11. Decomposition onset temperatures were
measured automatically using TA Instruments Universal Analysis software.
2.3.5 Thermomechanical Analysis
Thermomechanical analysis (TMA Q400, TA Instruments) was performed to measure the
coefficient of linear thermal expansion (CTE) for each of the polyurethane composites. The CTE
measurements followed ASTM E831-14, samples were cut to size and tested from 30 to 90 °C
with a heating rate of 5°C/min using the supplied standard expansion probe.
2.3.6 Dynamic Mechanical Analysis
A dynamic mechanical analysis (DMA Q800, TA Instruments) was performed on the polymer
composites, testing procedure followed ASTM D5992. The dynamic mechanical properties were
measured by shear deformation using the shear sandwich clamp supplied by TA instruments. For
all tests two equal samples with dimensions 7x7x2.5mm were used, as recommended by TA
Instruments. Three separate experiments were performed with the composites’ response to
increasing shear strain, frequency, and temperature studied.
First the dynamic mechanical properties were measured at increasing displacement amplitudes
from 5 to 400 µm. This strain sweep test was performed at a constant 5Hz and 40°C ambient
temperature. Next a frequency sweep was performed by testing the composites from 0.5 to 50Hz
with a displacement amplitude of 1% shear strain and an ambient temperature of 40°C. Finally,

15
the dynamic mechanical properties were analysed under increasing temperature from 35 to 80°C,
with a heating rate of 3°C/min, a displacement amplitude of 1% shear strain, with a constant
frequency of 5Hz.
2.4 Results and Discussion
2.4.1 Thermogravimetric Analysis
The thermal stability of the polyurethane and composite materials were tested using
thermogravimetric analysis as reported in Figure 2.2 and Table 2.2. It has been demonstrated
previously that the decomposition of polyurethane takes place over two well defined regions
[53]–[55], which is the behaviour seen here. In general, the behaviour seen is for the addition of
fillers to increase the decomposition temperature, by up to 10°C for both the first and second
degradation onset temperature. This is primarily due to the excellent thermal stability of the
selected reinforcing fibers [56]. It can also be seen that there is no overall trend in the increase of
thermal stability amongst the fiber types and reinforcement amount. Most likely, this is a result
of the tested composites having a low fiber volume. A topic of further study would be to observe
the effect of a larger amount of fiber content on the thermal stability of polyurethane composites.
Figure 2.2: Thermogravimetric thermograms of prepared composites
0
10
20
30
40
50
60
70
80
90
100
0 50 100 150 200 250 300 350 400 450 500
Wei
ght
%
Temperature (°C)
Neat AL 0.5% AL 1% AL 3%
KF 0.5% KF 1% PBO 0.5% PBO 1%

16
Composite 1st Onset (°C) 2nd Onset (°C)
Neat 212.83 410.08
AL 0.5% 211.91 418.89
AL 1% 212.54 416.47
AL 3% 216.19 415.95
KF 0.5% 217.59 420.52
KF 1% 217.23 420.8
PBO 0.5% 222.59 419.62
PBO 1% 222.07 419.74
Table 2.2: First and Second onset degradation temperatures of prepared materials
2.4.2 Thermomechanical Analysis, Coefficient of Linear Thermal Expansion
The coefficient of linear thermal expansion was measured using the TA Instruments TMA Q400.
The specific coefficient values for the composites was determined using TA Universal Analysis
by taking the slope of the linear section, 40°C to 90°C, of the dimension change (µm/m) versus
temperature (°C) curve. Selected curves, and thermal expansion coefficients for each prepared
material are shown in Figure 2.3.

17
Figure 2.3: Top: Selected thermal expansion curves for prepared polyurethane materials and
composites. Bottom: Coefficient of linear thermal expansion for polyurethane and prepared
composites
It is well known that there is typically a decrease in thermal expansion coefficient with the
inclusion of reinforcing fibers due to the stiffening of the overall composite material, and the low
expansion coefficients of the reinforcing fibers [57]–[60]. This is the general trend seen in the
data here. For the alumina and Kevlar fiber types an increase in fiber content corresponds to a
decrease in thermal expansion coefficient. However, for PBO reinforcement, while there is
improvement over the pure polyurethane, it is seen that an increase in fiber content from 0.5wt%
to 1wt% does not significantly decrease the thermal expansion. A t-test, assuming unequal
variances, comparing each filled composite material with the neat polyurethane was conducted
using Microsoft Excel. The goal of this statistical test was to measure whether the inclusion of
fibers had a significant impact on the thermal expansion coefficient. A summary of these test can
0
2000
4000
6000
8000
10000
12000
14000
16000
30 40 50 60 70 80 90
Dim
ensi
on
Ch
ange
(µ
m/m
)
Temperature (°C)
Neat AL 0.5% AL 1% AL 3%KF 0.5% KF 1% PBO 0.5% PBO 1%
221.8 223.5
186.4
140.4
216.2 204.7182.9 180.8
0
50
100
150
200
250
Neat AL 0.5% AL 1% AL 3% KF 0.5% KF 1% PBO 0.5% PBO 1%
Co
effi
cien
t o
f Li
nea
r Th
erm
al
Exp
ansi
on
(µ
m/m
°C)
18
be seen in Table 2.3, showing the expansion coefficients for each of the materials, the change in
coefficients, as a percentage, for the fiber reinforced composites with respect to the neat sample,
and whether this change was statistically significant based on the results of the t-test.
Composite CTE (µm/m°C) % Change Significant (Y/N)
Neat 221.8
AL 0.5% 223.5 0.77% N
AL 1% 186.4 -15.96% Y
AL 3% 140.4 -36.70% Y
KF 0.5% 216.2 -2.52% N
KF 1% 204.7 -7.71% Y
PBO 0.5% 182.9 -17.54% Y
PBO 1% 180.8 -18.49% Y
Table 2.3: Summary of coefficient of linear thermal expansion of composites with comparison to
neat polyurethane
It can be seen from this analysis that the addition of 0.5% alumina or Kevlar fibers to the
polyurethane has no significant impact on the thermal expansion coefficient due to the small
amount of fiber added in this case.
2.4.3 Dynamic Mechanical Properties – Effect of Strain
The strain sweep was performed and the generated curves for storage modulus (G’), loss
modulus (G”), and loss factor (tan delta) are shown in Figure 2.4. From the testing, it is found
that the stiffest material, highest storage modulus, is the PBO 1% reinforced composite, followed
by AL 3% at low strains and KF 1% at high strains (> 9.5%). Further decreasing storage
modulus is PBO 0.5% followed by KF 0.5%, AL 1%, AL 0.5% and finally neat polyurethane. It
is well known that typical behaviour for fiber reinforced composites is for the storage modulus to
decrease with increasing strain, for temperatures above glass transition, which is the behaviour
seen here [61]–[63]. Table 2.4 quantifies the change in storage modulus and tan delta, from 1%
to 15% shear strain, for the tested materials. It can be seen that the inclusion of fibers affects the

19
materials resistance to increasing strains. The storage modulus for the neat polyurethane
decreases 12.4%, from 1% to 15% shear strain, in comparison to AL 3% where the storage
modulus drops 28.9% over the same period. From this analysis, it is also shown that the PBO
filled composites show the least resistance to increasing strains. PBO 0.5 and PBO 1 display a
larger drop in storage modulus than the Kevlar and alumina filled composites of the same weight
fractions. When fiber volume fractions are considered instead of weight fractions the PBO filled
compounds still show the least resistance to strain as evidenced by a larger decrease in storage
modulus for PBO 0.5 than AL 1, which have the same volume fraction (0.34%). The Kevlar
reinforced composites show the best resistance to increasing strain compared to the other filled
compounds, suggesting that the fiber-matrix bonding between the Kevlar pulp and the
polyurethane is superior to that of the PBO or the alumina fibers. This idea is confirmed by
observation of SEM images shown in Figure 2.5. Here it is established that there is superior
wetting between the fiber and the matrix for Kevlar filled composites and that the PBO
reinforced composites show reduced wetting between the fiber and the matrix. The influence of
wetting between fiber and matrix, seen by SEM images, on the mechanical properties of fiber
filled composites has been done previously by others [45], [62]–[64]. For all three types of fiber
reinforced composites the reduction in storage modulus, from 1% to 15% shear strain, increases
with the amount of reinforcement. As the strain is increased bonds between the fiber and the
matrix break and the load transferred to, and carried by the fiber is reduced thus lowering the
effective modulus, and as the fiber content is increased the effect becomes greater. In terms of
damping it is also seen that the loss modulus remains relatively constant throughout the strain
sweep and therefore, the loss factor must increase. In the neat polyurethane material, the increase
in loss factor with strain is due to the increased molecular sliding at higher strains which results
in greater internal friction and heat generation in the material causing increased energy dissipated
in the material. The inclusion of fibers to polymer matrices introduces new methods of energy
dissipation, primarily due to the nature of the matrix-fiber interface [65]. As the bonds between
the matrix and fiber are broken with increasing strain it allows the polymer chains to slide over
and around the fiber generating increased internal friction leading to increased energy
dissipation. Furthermore, the breaking of the fiber-matrix bonds due to increasing strain requires
additional energy which is dissipated in the material. From these experiments, it was found that
there was an increase in loss factor, for the fiber reinforced composites, from 1% to 15% shear

20
strain, when compared to the neat polyurethane. Furthermore, for the alumina and PBO filled
compounds this increase in loss factor becomes greater as the fiber content is increased.
Figure 2.4: Storage modulus (top), loss modulus (middle), tan delta (bottom) for composites with
respect to increasing strain
0
0.5
1
1.5
2
2.5
3
0 2 4 6 8 10 12 14 16 18 20
Sto
rage
Mo
du
lus
(MP
a)
Shear Strain %
0
0.05
0.1
0.15
0.2
0.25
0.3
0.35
0 2 4 6 8 10 12 14 16 18 20
Loss
Mo
du
lus
(MP
a)
Shear Strain %
0.1
0.11
0.12
0.13
0.14
0.15
0.16
0.17
0.18
0 2 4 6 8 10 12 14 16 18 20
Tan
Del
ta
Shear Strain %
Neat AL 0.5% AL 1% AL 3%
KF 0.5% KF 1% PBO 0.5% PBO 1%

21
Composite G' (MPa) at 1% G' (MPa) at 15% % Change
Neat 1.278 1.119 -12.4%
AL 0.5% 1.462 1.205 -17.6%
AL 1% 1.774 1.409 -20.6%
AL 3% 2.53 1.798 -28.9%
KF 0.5% 1.793 1.493 -16.7%
KF 1% 2.331 1.908 -18.1%
PBO 0.5% 2.166 1.698 -21.6%
PBO 1% 2.645 1.949 -26.3%
Composite Tan Delta at 1% Tan Delta at 15% % Change
Neat 0.1474 0.1633 10.8%
AL 0.5% 0.1394 0.1691 21.3%
AL 1% 0.1277 0.1583 24.0%
AL 3% 0.1215 0.1627 33.9%
KF 0.5% 0.1268 0.1518 19.7%
KF 1% 0.1171 0.1384 18.2%
PBO 0.5% 0.1205 0.1486 23.3%
PBO 1% 0.1146 0.146 27.4%
Table 2.4: Top: Comparison in storage modulus (G’) for composites at 1% shear strain and 15%
shear strain. Bottom: Comparison in loss factor (Tan Delta) for composites at 1% shear strain
and 15% shear strain
22
Figure 5: SEM images of selected composites at 190x magnification. Clockwise from top left:
Polyurethane Neat, AL 3%, PBO 1%, KF 1%
2.4.4 Dynamic Mechanical Properties – Effect of Frequency
The storage modulus, loss modulus, and loss factor curves for the polyurethane and polyurethane
composites subjected to dynamic mechanical testing under increasing frequency are seen in
Figure 2.6. The trend is for the storage and loss moduli as well as the loss factor to increase with
frequency, this is consistent with previous studies done for short fiber reinforced composited
above the glass transition temperature [66]–[68]. Due to the highly viscoelastic, time dependent,
nature of the martial in question a drop in elastic modulus, over time, is seen when a constant
strain is applied [66]. This is a result of the molecular rearrangement of the matrix material to
reduce internal stress concentrations. Thus the observed modulus will be higher if measured over
a short period, high frequency, than if measured over a long period, low frequency [69]. It also
follows that the energy dissipation, and subsequently loss factor, will increase with frequency
due to the amplified internal friction and heat generation seen at high frequencies. Upon the

23
addition of reinforcing fibers, it is expected, and demonstrated, that the storage modulus will
increase due to the transfer of load to the stiffer fiber. The amount of reinforcement provided by
the fiber primarily depends on the mechanical behaviour and properties of the fiber itself, and
secondly, the nature and strength of the fiber-matrix bond. Additionally, the inclusion of
reinforcing fillers will tend to act to decrease the loss factor of the material by preventing the
molecular rearrangement of the matrix material, causing more elastic like behaviour. It is evident
that the fiber type has a dramatic effect on the amount of reinforcement in terms of the storage
modulus in addition to the subsequent reduction in the loss factor. Table 2.5 quantifies the
change, from neat polyurethane, in the storage modulus and loss factor, at 10Hz, due to the
addition of fibers. The polyurethane with 1% PBO fiber reinforcement shows the highest level or
reinforcement with a 97% increase in storage modulus over the neat polyurethane. In terms of
both weight and volume fraction the PBO fibers offer the most reinforcement due to the
exceptionally high stiffness and mechanical properties of these fibers. The storage modulus of
the 0.5wt% and 1wt% PBO filled composites is higher than the comparative alumina and Kevlar
filled composites. While it has been established that the interfacial strength between the PBO
fibers and polyurethane is weaker than, most noticeably, the Kevlar fibers, it is not a critical
factor in the low strain condition in this test. When fiber weight fraction is considered the Kevlar
filled composites show superior dynamic stiffness than alumina fiber composites. However,
when volume fraction is considered the reinforcement between Kevlar and alumina fibers is
comparable. The Al 1 and KF 0.5 composites have volume fractions of 0.34% and 0.37%
respectively and the corresponding storage modulus, at 10Hz, for these composites is 1.864MPa
and 1.899MPa. Furthermore, as a qualitative comparison the storage modulus curves for these
materials is almost indistinguishable. In all cases the addition of fibers to the matrix results in a
reduction in the damping capabilities of the overall system. However, this loss of damping
capabilities is outweighed by the increase in the mechanical properties of the system with the
stiffest material, 1% PBO and polyurethane, showing only a 20% drop in loss factor. The
alumina filler offers the best compromise between stiffness and damping. From the storage
modulus and loss factor curves in Figure 2.5 the AL 3 composite provides both a higher storage
modulus and loss factor than the PBO 0.5 and KF 1 composites.

24
Figure 2.6: Storage modulus (top), loss modulus (middle), tan delta (bottom) for composites with
respect to increasing frequency
0
0.5
1
1.5
2
2.5
3
3.5
0 5 10 15 20 25 30 35 40 45 50
Sto
rage
Mo
du
lus
(MP
a)
Frequency (Hz)
0
0.05
0.1
0.15
0.2
0.25
0.3
0.35
0.4
0.45
0 5 10 15 20 25 30 35 40 45 50
Loss
Mo
du
lus
(MP
a)
Frequency (Hz)
0.1
0.11
0.12
0.13
0.14
0.15
0.16
0 5 10 15 20 25 30 35 40 45 50
Tan
Del
ta
Frequency (Hz)Neat AL 0.5% AL 1% AL 3%
KF 0.5% KF 1% PBO 0.5% PBO 1%
25
Composite G' (MPa) at 10Hz % Change
Neat 1.369
AL 0.5% 1.561 14.0%
AL 1% 1.864 36.2%
KF 0.5% 1.899 38.7%
PBO 0.5% 2.16 57.8%
KF 1% 2.404 75.6%
AL 3% 2.597 89.7%
PBO 1% 2.696 96.9%
Composite Tan Delta at 10Hz % Change
Neat 0.1442
AL 0.5% 0.1388 -3.7%
KF 0.5% 0.1302 -9.7%
AL 1% 0.128 -11.2%
AL 3% 0.1217 -15.6%
PBO 0.5% 0.1205 -16.4%
KF 1% 0.1167 -19.1%
PBO 1% 0.1151 -20.2%
Table 2.5: Top: Storage modulus values for prepared materials at 10Hz with composite materials
compared to neat polyurethane. Bottom: Loss factor values for prepared materials at 10Hz with
composite materials compared to neat polyurethane

26
2.4.5 Dynamic Mechanical Properties – Effect of Temperature
In addition to strain, displacement, and frequency, time, dependence the dynamic properties of
the polyurethane and composites also show dependence on temperature. The effect of increasing
temperature on the dynamic properties, storage and loss modulus, and loss factor is shown in
Figure 2.7. All prepared materials show similar behaviour with respect to increasing temperature
with a slight decrease in dynamic moduli and loss factor. Aside from adjusting the magnitude of
the values in question the addition of fibers does not change the behaviour of the material over
the tested temperature range. The storage modulus is compared at 35 °C and 75 °C for the
prepared materials in Table 2.6. The corresponding drop in storage modulus ranges from 13.5%
for the PBO 0.5 composite to 19.6% for the AL 0.5 composite, however, there does not exist any
real trend between the samples with the performance of the neat polyurethane falling in the
middle, showing a storage modulus decrease of 17.5%. In general, the decrease in storage
modulus throughout the temperature range is due to the increased molecular motion of the matrix
molecules. As the temperature is increased the matrix polymer chains are able to move more
freely thereby reducing the overall stress in the system leading to a reduction in the modulus.
Composite G' (MPa) at 35°C G' (MPa) at 75°C % Change
Neat 1.432 1.182 -17.5%
AL 0.5% 1.66 1.335 -19.6%
AL 1% 1.987 1.6 -19.5%
AL 3% 2.673 2.262 -15.4%
KF 0.5% 1.971 1.623 -17.7%
KF 1% 2.512 2.112 -15.9%
PBO 0.5% 2.21 1.912 -13.5%
PBO 1% 2.82 2.416 -14.3%
Table 2.6: Comparison of storage modulus values from 35°C to 75°C

27
Figure 2.7: Storage modulus (top), loss modulus (middle), tan delta (bottom) for composites with
respect to increasing temperature
0
0.5
1
1.5
2
2.5
3
30 35 40 45 50 55 60 65 70 75 80
Sto
rage
Mo
du
lus
(MP
a)
Temperature °C
0
0.05
0.1
0.15
0.2
0.25
0.3
0.35
0.4
30 35 40 45 50 55 60 65 70 75 80
Loss
Mo
du
lus
(MP
a)
Temperature °C
0.1
0.11
0.12
0.13
0.14
0.15
0.16
30 35 40 45 50 55 60 65 70 75 80
Tan
del
ta
Temperature °CNeat AL 0.5% AL 1% AL 3%
KF 0.5% KF 1% PBO 0.5% PBO 1%
28
2.5 Conclusions
Polyurethane composites with alumina (Al2O3:SiO2), Kevalr pulp, and poly(p-phenylene-2,6-
benzobisoxazole) (PBO) reinforcing fibers have been prepared by a simple manufacturing
process utilizing a high shear mixer for fiber dispersion followed by degassing of the two-part
resin and casting into a mould. The composites were then tested for their thermal and dynamic
mechanical properties by TGA, TMA and DMA. An increase in the thermal stability of the
composites was found with the addition of reinforcing fibers as well as up to a 36.7% decrease in
the coefficient of linear thermal expansion. The addition of the reinforcing fibers also contributed
to an increase in the storage modulus over the neat polyurethane matrix. For 1wt% PBO fiber
reinforcement a 97% increase in storage modulus was observed while the loss factor was only
reduced by 20%, thus achieving the goal of producing a stiffer polyurethane compound without
sacrificing the excellent damping characteristics of the pure matrix material.
2.6 Acknowledgements
The authors would like to acknowledge the following agencies for financial support: Natural
Sciences and Engineering Research Council of Canada (NSERC), and the Ontario Centres of
Excellence (OCE).
29
2.7 References
[1] Z. Wu et al., “A facile approach to modify polyurethane surfaces for biomaterial
applications,” Macromol. Biosci., vol. 9, no. 12, pp. 1165–1168, 2009.
[2] D. K. Chattopadhyay and K. V. S. N. Raju, “Structural engineering of polyurethane
coatings for high performance applications,” Prog. Polym. Sci., vol. 32, no. 3, pp. 352–
418, 2007.
[3] V. Kanyanta and A. Ivankovic, “Mechanical characterisation of polyurethane elastomer
for biomedical applications,” J. Mech. Behav. Biomed. Mater., vol. 3, no. 1, pp. 51–62,
2010.
[4] S. Mondal and D. Martin, “Hydrolytic degradation of segmented polyurethane copolymers
for biomedical applications,” Polym. Degrad. Stab., vol. 97, no. 8, pp. 1553–1563, 2012.
[5] L. Zhou et al., “Synthesis and characterization of pH-sensitive biodegradable
polyurethane for potential drug delivery applications,” Macromolecules, vol. 44, no. 4, pp.
857–864, 2011.
[6] J. Guan, K. L. Fujimoto, M. S. Sacks, and W. R. Wagner, “Preparation and
characterization of highly porous, biodegradable polyurethane scaffolds for soft tissue
applications,” Biomaterials, vol. 26, no. 18, pp. 3961–3971, 2005.
[7] K. Zhou, Z. Gui, Y. Hu, S. Jiang, and G. Tang, “The influence of cobalt oxide-graphene
hybrids on thermal degradation, fire hazards and mechanical properties of thermoplastic
polyurethane composites,” Compos. Part A Appl. Sci. Manuf., vol. 88, pp. 10–18, 2016.
[8] T. Gurunathan, C. R. K. Rao, R. Narayan, and K. V. S. N. Raju, “Polyurethane conductive
blends and composites: Synthesis and applications perspective,” J. Mater. Sci., vol. 48, no.
1, pp. 67–80, 2013.
[9] H. Kim, Y. Miura, and C. W. MacOsko, “Graphene/polyurethane nanocomposites for
improved gas barrier and electrical conductivity,” Chem. Mater., vol. 22, no. 11, pp.
3441–3450, 2010.
30
[10] J. N. Ding, Y. Fan, C. X. Zhao, Y. B. Liu, C. T. Yu, and N. Y. Yuan, “Electrical
conductivity of waterborne polyurethane/graphene composites prepared by solution
mixing,” J. Compos. Mater., vol. 46, no. 6, pp. 747–752, 2012.
[11] N. Yousefi, M. M. Gudarzi, Q. Zheng, S. H. Aboutalebi, F. Sharif, and J.-K. Kim, “Self-
alignment and high electrical conductivity of ultralarge graphene oxide–polyurethane
nanocomposites,” J. Mater. Chem., vol. 22, no. 25, p. 12709, 2012.
[12] B. Ghosh and M. W. Urban, “Self-Repairing Oxetane-Substituted Chitosan Polyurethane
Networks,” Science (80-. )., vol. 323, no. 5920, pp. 1458–1460, 2009.
[13] D. K. Chattopadhyay and D. C. Webster, “Thermal stability and flame retardancy of
polyurethanes,” Prog. Polym. Sci., vol. 34, no. 10, pp. 1068–1133, 2009.
[14] H. M. Stapleton et al., “Identification of flame retardants in polyurethane foam collected
from baby products,” Environ. Sci. Technol., vol. 45, no. 12, pp. 5323–5331, 2011.
[15] L. Song, Y. Hu, Y. Tang, R. Zhang, Z. Chen, and W. Fan, “Study on the properties of
flame retardant polyurethane/organoclay nanocomposite,” Polym. Degrad. Stab., vol. 87,
no. 1, pp. 111–116, 2005.
[16] M. J. Chen, Z. B. Shao, X. L. Wang, L. Chen, and Y. Z. Wang, “Halogen-free flame-
retardant flexible polyurethane foam with a novel nitrogen-phosphorus flame retardant,”
Ind. Eng. Chem. Res., vol. 51, no. 29, pp. 9769–9776, 2012.
[17] Z. Wang et al., “A Novel Mechanochromic and Photochromic Polymer Film: When
Rhodamine Joins Polyurethane,” Adv. Mater., vol. 27, no. 41, pp. 6469–6474, 2015.
[18] H. Tobushi, S. Hayashi, and S. Kojima, “Mechanical properties of shape memory polymer
of polyurethane series,” JSME Int. J., vol. 35, no. 3, pp. 296–302, 1992.
[19] B. K. Kim, S. Y. Lee, and M. Xu, “Polyurethanes having shape memory effects,” Polymer
(Guildf)., vol. 37, no. 26, pp. 5781–5793, 1996.
[20] M. Ahmad et al., “High Performance Shape Memory Polyurethane Synthesized with High
Molecular Weight Polyol as the Soft Segment,” Appl. Sci., vol. 2, no. 2, pp. 535–548,

31
2012.
[21] J. W. Cho, J. W. Kim, Y. C. Jung, and N. S. Goo, “Electroactive shape-memory
polyurethane composites incorporating carbon nanotubes,” Macromol. Rapid Commun.,
vol. 26, no. 5, pp. 412–416, 2005.
[22] W. M. Huang, “Thermomechanical Behavior of a Polyurethane Shape Memory Polymer
Foam,” J. Intell. Mater. Syst. Struct., vol. 17, no. 8–9, pp. 753–760, 2006.
[23] B. S. Lee, B. C. Chun, Y.-C. Chung, K. Il Sul, and J. W. Cho, “Structure and
Thermomechanical Properties of Polyurethane Block Copolymers with Shape Memory
Effect,” Macromolecules, vol. 34, no. 18, pp. 6431–6437, 2001.
[24] H. Xia and M. Song, “Preparation and characterization of polyurethane–carbon nanotube
composites,” Soft Matter, vol. 1, no. 5, p. 386, 2005.
[25] W. Chen, X. Tao, and Y. Liu, “Carbon nanotube-reinforced polyurethane composite
fibers,” Compos. Sci. Technol., vol. 66, no. 15, pp. 3029–3034, 2006.
[26] J. Xiong, Z. Zheng, X. Qin, M. Li, H. Li, and X. Wang, “The thermal and mechanical
properties of a polyurethane/multi-walled carbon nanotube composite,” Carbon N. Y., vol.
44, no. 13, pp. 2701–2707, 2006.
[27] M. R. Loos, J. Yang, D. L. Feke, I. Manas-Zloczower, S. Unal, and U. Younes,
“Enhancement of fatigue life of polyurethane composites containing carbon nanotubes,”
Compos. Part B Eng., vol. 44, no. 1, pp. 740–744, 2013.
[28] L. D. Tijing et al., “Characterization and mechanical performance comparison of
multiwalled carbon nanotube/polyurethane composites fabricated by electrospinning and
solution casting,” Compos. Part B Eng., vol. 44, no. 1, pp. 613–619, 2013.
[29] P. Pokharel, S. Choi, and D. S. Lee, “The effect of hard segment length on the thermal and
mechanical properties of polyurethane/graphene oxide nanocomposites,” Compos. Part A
Appl. Sci. Manuf., vol. 69, pp. 168–177, 2015.
[30] Z. Guo, T. Y. Kim, K. Lei, T. Pereira, J. G. Sugar, and H. T. Hahn, “Strengthening and
32
thermal stabilization of polyurethane nanocomposites with silicon carbide nanoparticles
by a surface-initiated-polymerization approach,” Compos. Sci. Technol., vol. 68, no. 1, pp.
164–170, 2008.
[31] G. Zhanhu et al., “Flexible high-loading particle-reinforced polyurethane magnetic
nanocomposite fabrication through particle-surface-initiated polymerization,”
Nanotechnology, vol. 18, no. 33, p. 335704, 2007.
[32] B. Ju et al., “Dynamic mechanical properties of magnetorheological elastomers based on
polyurethane matrix,” Polym. Compos., vol. 37, no. 5, pp. 1587–1595, 2016.
[33] S. Benli, U. Yilmazer, F. Pekel, and S. Oezkar, “Effect of fillers on thermal and
mechanical properties of polyurethane elastomer,” J. Appl. Polym. Sci., vol. 68, no. 7, pp.
1057–1065, 1998.
[34] M. Ozgur Seydibeyoglu and K. Oksman, “Novel nanocomposites based on polyurethane
and micro fibrillated cellulose,” Compos. Sci. Technol., vol. 68, no. 3–4, pp. 908–914,
2008.
[35] C. Merlini, V. Soldi, and G. M. O. Barra, “Influence of fiber surface treatment and length
on physico-chemical properties of short random banana fiber-reinforced castor oil
polyurethane composites,” Polym. Test., vol. 30, no. 8, pp. 833–840, 2011.
[36] G. Zhao, T. Wang, and Q. Wang, “Surface modification of carbon fiber and its effects on
the mechanical and tribological properties of the polyurethane composites,” Polym.
Compos., vol. 32, no. 11, pp. 1726–1733, 2011.
[37] J. P. Latere Dwan’isa, A. K. Mohanty, M. Misra, L. T. Drzal, and M. Kazemizadeh,
“Biobased polyurethane and its composite with glass fiber,” J. Mater. Sci., vol. 39, no. 6,
pp. 2081–2087, 2004.
[38] S. Jiang, Q. Li, Y. Zhao, J. Wang, and M. Kang, “Effect of surface silanization of carbon
fiber on mechanical properties of carbon fiber reinforced polyurethane composites,”
Compos. Sci. Technol., vol. 110, pp. 87–94, 2015.
[39] G. Withers, J. Souza, Y. Yu, L. Cercone, V. Khabashesku, and D. Davis, “Improved

33
mechanical properties of a water-activated polyurethane-glass fiber composite reinforced
with amino-functionalized carbon nanofibers,” J. Compos. Mater., vol. 50, no. 6, pp. 783–
793, 2016.
[40] Y. K. Huang, P. H. Frings, and E. Hennes, “Mechanical properties of Zylon/epoxy
composite,” Compos. Part B Eng., vol. 33, no. 2, pp. 109–115, 2002.
[41] L. Bian, J. Xiao, J. Zeng, S. Xing, C. Yin, and A. Jia, “Effects of thermal treatment on the
mechanical properties of poly(p-phenylene benzobisoxazole) fiber reinforced phenolic
resin composite materials,” Mater. Des., vol. 54, pp. 230–235, 2014.
[42] F. Larsson and L. Svensson, “Carbon, polyethylene and PBO hybrid fibre composites for
structural lightweight armour,” Compos. - Part A Appl. Sci. Manuf., vol. 33, no. 2, pp.
221–231, 2002.
[43] R. P. Walsh and C. A. Swenson, “Mechanical properties of zylon/epoxy composite at
295K and 77 K,” IEEE Trans. Appl. Supercond., vol. 16, no. 2, pp. 1761–1764, 2006.
[44] P. Davies, A. R. Bunsell, and E. Chailleux, “Tensile fatigue behaviour of PBO fibres,” J.
Mater. Sci., vol. 45, no. 23, pp. 6395–6400, 2010.
[45] A. Anwer, Z. S. Bagheri, G. Fernie, T. Dutta, and H. E. Naguib, “Evolution of the
Coefficient of Friction with Surface Wear for Advanced Surface Textured Composites,”
Adv. Mater. Interfaces, 2017.
[46] J. Karger-Kocsis, H. Mahmood, and A. Pegoretti, “Recent advances in fiber/matrix
interphase engineering for polymer composites,” Prog. Mater. Sci., vol. 73, pp. 1–43,
2015.
[47] A. K. Bandaru, S. Patel, Y. Sachan, S. Ahmad, R. Alagirusamy, and N. Bhatnagar,
“Mechanical behavior of Kevlar/basalt reinforced polypropylene composites,” Compos.
Part A Appl. Sci. Manuf., vol. 90, pp. 642–652, 2016.
[48] A. K. Bandaru, S. Patel, Y. Sachan, S. Ahmad, R. Alagirusamy, and N. Bhatnagar,
“Mechanical characterization of 3D angle-interlock Kevlar/basalt reinforced
polypropylene composites,” Polym. Test., vol. 55, pp. 238–246, 2016.
34
[49] C. Unterweger, O. Brüggemann, and C. Fürst, “Synthetic fibers and thermoplastic short-
fiber-reinforced polymers: Properties and characterization,” Polymer Composites, vol. 35,
no. 2. pp. 227–236, 2014.
[50] B. Finnigan, D. Martin, P. Halley, R. Truss, and K. Campbell, “Morphology and
properties of thermoplastic polyurethane nanocomposites incorporating hydrophilic
layered silicates,” Polymer (Guildf)., vol. 45, no. 7, pp. 2249–2260, 2004.
[51] Q. Wang, J. Dai, W. Li, Z. Wei, and J. Jiang, “The effects of CNT alignment on electrical
conductivity and mechanical properties of SWNT/epoxy nanocomposites,” Compos. Sci.
Technol., vol. 68, no. 7–8, pp. 1644–1648, 2008.
[52] M. R. Loos, L. A. F. Coelho, S. H. Pezzin, and S. C. Amico, “The effect of acetone
addition on the properties of epoxy,” Polímeros, vol. 18, no. 1, pp. 76–80, 2008.
[53] A. Wolska, M. Goździkiewicz, and J. Ryszkowska, “Thermal and mechanical behaviour
of flexible polyurethane foams modified with graphite and phosphorous fillers,” J. Mater.
Sci., vol. 47, no. 15, pp. 5627–5634, 2012.
[54] G. Trovati, E. A. Sanches, S. C. Neto, Y. P. Mascarenhas, and G. O. Chierice,
“Characterization of polyurethane resins by FTIR, TGA, and XRD,” J. Appl. Polym. Sci.,
vol. 115, no. 1, pp. 263–268, 2010.
[55] A. A. Abdel Hakim, M. Nassar, A. Emam, and M. Sultan, “Preparation and
characterization of rigid polyurethane foam prepared from sugar-cane bagasse polyol,”
Mater. Chem. Phys., vol. 129, no. 1–2, pp. 301–307, 2011.
[56] X. Liu and W. Yu, “Evaluating the thermal stability of high performance fibers by TGA,”
J. Appl. Polym. Sci., vol. 99, no. 3, pp. 937–944, 2006.
[57] K. F. Rogers et al., “The thermal expansion of carbon fibre-reinforced plastics,” J. Mater.
Sci., vol. 12, no. 4, pp. 718–734, 1977.
[58] Y.-M. Chen and J.-M. Ting, “Ultra high thermal conductivity polymer composites,”
Carbon N. Y., vol. 40, no. 3, pp. 359–362, 2002.

35
[59] A. N. Nakagaito and H. Yano, “The effect of fiber content on the mechanical and thermal
expansion properties of biocomposites based on microfibrillated cellulose,” Cellulose, vol.
15, no. 4, pp. 555–559, 2008.
[60] S. Rojstaczer, D. Cohn, and G. Marom, “Thermal expansion of Kevlar fibres and
composites,” J. Mater. Sci. Lett., vol. 4, no. 10, pp. 1233–1236, 1985.
[61] L. Ibarra, “Dynamic properties of short fiber-EPDM matrix composites as a function of
strain amplitude,” J. Appl. Polym. Sci., vol. 54, no. 11, pp. 1721–1730, 1994.
[62] L. Ibarra and D. Panos, “Mechanical Properties of Thermoplastic Butadiene – Styrene (
SBS ) and Oxidized Short Carbon Fibre Composites,” Polym. Int., vol. 43, pp. 1819–1826,
1997.
[63] L. Ibarra and D. Panos, “Dynamic properties of thermoplastic butadiene--styrene (SBS)
and oxidized short carbon fiber composite materials,” J. Appl. Polym. Sci., vol. 67, no. 10,
pp. 1819–1826, 1998.
[64] C. Kaynak, O. Orgun, and T. Tincer, “Matrix and interface modification of short carbon
fiber-reinforced epoxy,” Polym. Test., vol. 24, no. 4, pp. 455–462, 2005.
[65] R. Chandra, S. P. Singh, and K. Gupta, “Damping studies in fiber-reinforced composites -
a review,” Compos. Struct., vol. 46, no. 1, pp. 41–51, 1999.
[66] A. Laly, O. Zachariah, and S. Thomas, “Dynamic mechanical analysis of banana fiber
reinforced polyester composites,” Composites Science and Technology, vol. 63, no. 2. pp.
283–293, 2003.
[67] H. Kishi, M. Kuwata, S. Matsuda, T. Asami, and A. Murakami, “Damping properties of
thermoplastic-elastomer interleaved carbon fiber-reinforced epoxy composites,” Compos.
Sci. Technol., vol. 64, no. 16, pp. 2517–2523, 2004.
[68] P. Joseph, G. Mathew, K. Joseph, G. Groeninckx, and S. Thomas, “Dynamic mechanical
properties of short sisal fibre reinforced polypropylene composites,” Compos. Part A
Appl. Sci. Manuf., vol. 34, pp. 275–290, 2003.

36
[69] N. G. McCrum, C. P. Buckley, and C. B. Bucknall, Principles of Polymer Engineering.
Oxford University Press, USA, 1997.

37
Chapter 3
Polyester based thermoplastic elastomer composites reinforced with carbon and poly(p-phenylene-2,6-benzobisoxazole) short fibers

38
3.1 Abstract
Thermoplastic elastomers combine the excellent toughness and resilience of traditional
thermosetting rubbers with the ease of fabrication and ability to be remolded inherent to
thermoplastics. The reinforcement, with the addition of fibers, of the relatively weak matrix can
serve to extend the functionality of the pure matrix material. Here, a medium hardness and high
hardness grade of polyester based thermoplastic elastomers have been reinforced with short
carbon and poly(p-phenylene-2,6-benzobisoxazole) (PBO) fibers. The thermal stability, melting
and crystallization behaviour, mechanical, and viscoelastic properties of these new materials
have been characterized. A remarkable increase in strength was found with the addition of the
reinforcing fibers. With 10wt% carbon fiber a 628% and 188% increase in tensile modulus was
found for the medium and high hardness material respectively. Additionally, dynamic
mechanical analysis found significant improvement of the performance of the materials at high
temperatures.

39
3.2 Introduction
Thermoplastic elastomers are an interesting class of materials which offer the many inherent
benefits such as quick fabrication, and the ability to be remolded and recycled of traditional
thermoplastics [1]. This behaviour is combined with the flexibility and extremely tough
behaviour of traditional thermosetting rubbers [2]. Their wide range of properties have made
them applicable in many research fields as well as industrial applications [3]. The smart material
applications of thermoplastic elastomers have also been of interest. Research has been done to
investigate the shape memory potential and applications of thermoplastic elastomer materials [4].
Magneto-rheological elastomers have been created by incorporating magnetically active fillers to
a thermoplastic elastomer matrix [5], [6], and conductive, usually carbon based, particles have
been added to create thermoplastic elastomeric strain sensors [7]–[10]. Thermoplastic elastomers
are also commonly blended with hard thermoplastics usually with the goal of improving impact
strength and toughness [11], [12]. The reinforcement of the relatively weak thermoplastic
elastomer matrix by the inclusion of stiff composite fibers has also garnered significant interest.
Fibers which have been studied include natural fibers [13]–[17], PTFE nanofibers [18], glass
fiber [19], nano-clay [20], and others.
In this study two grades of thermoplastic elastomers have been reinforced with poly(p-
phenylene-2,6-benzobisoxazole) (PBO) as well as carbon fibers in an effort to improve the
mechanical and dynamic mechanical properties of the pure material. The matrix materials
studied are polyester based thermoplastic elastomers, one having a medium hardness, Shore D
55, and medium modulus, while the other grade has a high hardness, Shore D 82 and relatively
high stiffness. PBO is a liquid crystal polymeric material, comparable to aramid based fibers,
with excellent mechanical properties [21]–[24]. Previously we have demonstrated successful
reinforcement of a thermoset elastomeric polyurethane material with PBO fiber which showed
excellent dynamic mechanical and thermal performance [25]. Other benefits of PBO fibers
include improved abrasion resistance in thermoplastic elastomeric materials [26], and excellent
fatigue resistance [27]. Polymers containing PBO fibers are also have potential space
applications owing to their combination of high strength and light weight [28]. Additionally,
while carbon fiber reinforced polymers have been shown to display poor impact performance the
liquid crystalline polymer based fibers, aramid and PBO, have proven to be superior in this
regard [29]–[31]. In this sense the comparison of PBO and carbon fiber reinforced polymers is
40
interesting as while they have similar mechanical performance each system offers different
inherent benefits making them suitable for differing applications.
The goal of this study is to improve the mechanical and dynamic mechanical performance of
polyester based thermoplastic elastomer materials by the inclusion of short carbon and PBO
fibers to serve as reinforcement of the relatively weak mechanical properties of the base material.
Additionally, the impact of including the reinforcing fibers and their impact on the thermal
stability and melting a crystallization behaviour was also analysed. The mechanical properties of
these composites were characterized by a constant strain rate tensile test while dynamic
mechanical analysis was used to characterize the viscoelastic properties of the composites. Upon
completion of these studies it was found that the addition of stiff fibers to the thermoplastic
elastomer matrix significantly improved the tensile properties, modulus, and yield stress as well
as the dynamic stiffness of the material especially with respect to increasing temperatures.
3.3 Materials and Methods
3.3.1 Materials
Thermoplastic polyester elastomer (TPC-ET) materials, brand name Hytrel, were provided by
DuPont. Specific grades used in this study were Hytrel 5556 with a nominal Shore D hardness of
55, and Hytrel 8238 with a nominal Shore D hardness of 82. Hytrel 5556 has a specific gravity of
1.19, and the specific gravity of Hytrel 8238 is 1.28. Zylon HM, provided by Toyobo, were used
as the PBO fibers, and carbon fibers, Panex 35, were provided by Zoltek. The specific gravity of
the fibers is 1.56 and 1.81 for PBO and carbon fiber respectively, and both fibers have pre-
processing lengths of 3mm. Tensile modulus of the PBO fibers is reported to be 270GPa and for
the carbon fiber the modulus is 242GPa. The reported tensile strength is 5.8GPa and 4.1GPa for
PBO and carbon fibers respectively.
3.3.2 Composites Fabrication Process
The two grades of thermoplastic polyester elastomer materials were reinforced with 5wt% and
10wt% carbon fiber and PBO fiber, Table 3.1 is a table of prepared composites providing
nomenclature fiber weight fraction, and fiber volume fraction for all prepared materials.
Composite materials were prepared by compounding on a lab scale twin screw compounder
(DSM Xplore 15, DSM Netherlands). The co-rotating screws were kept at a constant speed of
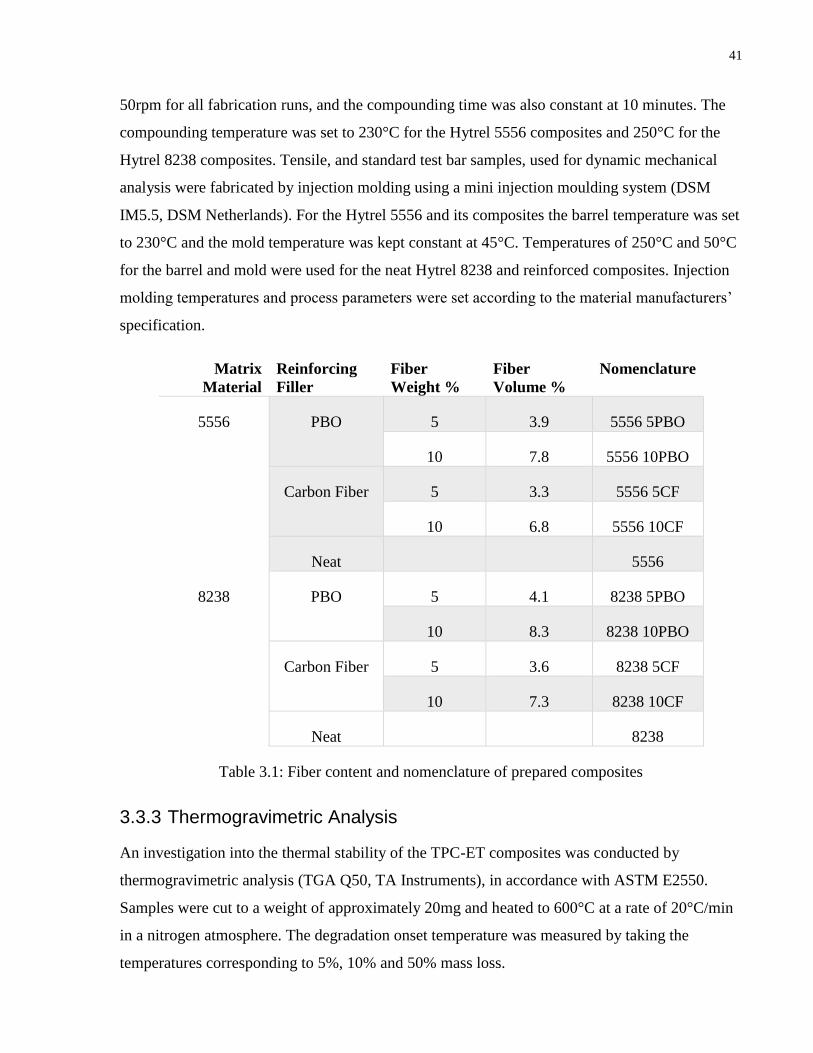
41
50rpm for all fabrication runs, and the compounding time was also constant at 10 minutes. The
compounding temperature was set to 230°C for the Hytrel 5556 composites and 250°C for the
Hytrel 8238 composites. Tensile, and standard test bar samples, used for dynamic mechanical
analysis were fabricated by injection molding using a mini injection moulding system (DSM
IM5.5, DSM Netherlands). For the Hytrel 5556 and its composites the barrel temperature was set
to 230°C and the mold temperature was kept constant at 45°C. Temperatures of 250°C and 50°C
for the barrel and mold were used for the neat Hytrel 8238 and reinforced composites. Injection
molding temperatures and process parameters were set according to the material manufacturers’
specification.
Matrix
Material
Reinforcing
Filler
Fiber
Weight %
Fiber
Volume %
Nomenclature
5556 PBO 5 3.9 5556 5PBO
10 7.8 5556 10PBO
Carbon Fiber 5 3.3 5556 5CF
10 6.8 5556 10CF
Neat
5556
8238 PBO 5 4.1 8238 5PBO
10 8.3 8238 10PBO
Carbon Fiber 5 3.6 8238 5CF
10 7.3 8238 10CF
Neat
8238
Table 3.1: Fiber content and nomenclature of prepared composites
3.3.3 Thermogravimetric Analysis
An investigation into the thermal stability of the TPC-ET composites was conducted by
thermogravimetric analysis (TGA Q50, TA Instruments), in accordance with ASTM E2550.
Samples were cut to a weight of approximately 20mg and heated to 600°C at a rate of 20°C/min
in a nitrogen atmosphere. The degradation onset temperature was measured by taking the
temperatures corresponding to 5%, 10% and 50% mass loss.
42
3.3.4 Differential Scanning Calorimetry
Melting and crystallization temperatures were measured through the use of differential scanning
calorimetry (DSC Q2000, TA instruments). Samples were prepared to a weight of approximately
10mg and subjected to heat-cool-heat temperature profile from -80°C and 260°C. the heating rate
was set to 10°C/min and the cooling rate was 5°C/min, in accordance with ASTM D3418.
3.3.5 Tensile Properties
The tensile properties, modulus, yield strain, yield stress, and stress strain behaviour of the TPC-
ET materials and composites were tested on an Instron 5848 universal testing machine. The
injection molded samples were subjected to a constant strain rate of 5mm/min and tested in
accordance with ASTM D638. The tests were conducted at room temperature and humidity.
3.3.6 Dynamic Mechanical Analysis
The dynamic mechanical properties, storage modulus and tan delta, of the thermoplastic
polyester elastomer materials and composites were measured by dynamic mechanical analysis
(DMA Q800, TA Instruments). Testing procedure followed ASTM D4065 and the dynamic
mechanical properties of the injection molded samples, approximate dimensions of 60x12x2mm,
were measured in dual cantilever mode using the 35mm dual cantilever clamp provided by TA
Instruments. The materials’ response to both increasing temperature and frequency was tested.
The DMA testing was performed with a constant strain of 0.01% while the temperature was
increased from 35-110°C with a rate of 3°C/min. The viscoelastic properties were measured at
two frequencies 1Hz, and 10Hz.
3.3.7 Scanning Electron Microscopy
Scanning electron microscopy images were taken using a JEOL JSM-IT100 using secondary
electron imaging. Samples were cut in a way that the imaged surfaced was normal to the
preferred fiber direction and sputter coated with a thin layer of gold particles prior to imaging.

43
3.4 Results and Discussion
3.4.1 Scanning Electron Microscopy
Scanning electron microscopy images for all 5556 and 8238 materials and composites are shown
in Figure 3.1. The mechanical properties of fiber reinforced polymer not only depend on the
individual properties of the matrix and fiber but the fiber dispersion and strength of the fiber
matrix bond as well. Here we can see that there is good wetting between the carbon fibers and
both 5556 and 8238 matrices, this provides evidence of good fiber matrix-bond strength which
will allow for more efficient transfer of load to the fiber. In comparison, the PBO fiber reinforced
samples had much more evidence of fiber pullout caused by the cutting force of the blade and
there was less fiber wetting from the matrix material as well. This was more noticeable for the
8238 material than the 5556 material where the PBO fiber generally showed comparatively
better wetting and less pullout. Additionally, the relative brittleness and ductility of the fibers can
be seen. The carbon fiber seemed to fracture under the cutting force while the PBO showed
much more ductile behaviour and seemed to be pulled across the matrix material. All of the fiber
reinforced samples showed good dispersion and there were no noticeable sites of fiber
agglomeration within the samples. This suggests that the compounding procedure was sufficient
to allow for adequate dispersion of the reinforcing fibers.

44
Figure 3.1: Left column top to bottom: 5556x100, 5556 5CFx350, 5556 10CFx750, 5556
5PBOx750, 5556 10PBOx350. Right column top to bottom: 8238 x100, 8238 5CFx750, 8238
10CFx350, 8238 5PBOx350, 8238 10PBOx750

45
3.4.2 Thermogravimetric Analysis
Thermal stability of polymer materials and composites is commonly measured by
thermogravimetric analysis. The thermogravimetric thermograms, showing the percentage of
remaining mass with increasing temperature, for Hytrel 5556 and 8238 and their composites with
carbon and PBO fibers are shown in Figure 3.2 and Figure 3.3. The thermal stability, degradation
onset temperatures, of these materials was measured by recording the temperature corresponding
to 5% mass loss. This temperature, along with temperature values associated with 10%, and 50%
mass loss are shown in Table 3.2. The pure materials, 5556, and 8238, show near identical
decomposition behaviour with equal 5%, and 10% mass loss temperatures. Additionally, the
50% mass loss temperature for the neat materials is very similar, 448, and 447°C, for 5556 and
8238 respectively, signifying that the rate of decomposition is also similar for both grades of
materials. The thermal decomposition of the fiber reinforced composites show two different
stories with the carbon fiber reinforced materials displaying lower decomposition temperature
and the PBO reinforced composites demonstrating superior thermal stability relative to the neat
materials. In both the 5556 and 8238 PBO reinforced composites there is an increase in
degradation onset temperature as the content of PBO fiber increases from 5wt% to 10wt%.
Figure 3.2: Thermogravimetric thermograms for 5556 and composites
0
20
40
60
80
100
100 200 300 400 500 600
Mas
s %
Temperature (°C)
5556
5556 5CF
5556 10CF
5556 5PBO
5556 10PBO

46
Figure 3: Thermogravimetric thermograms for 8238 and composites
Material 5% Mass Loss (°C) 10% Mass Loss (°C) 50% Mass Loss (°C)
5556 412 422 448
5556 5CF 411 420 446
5556 10CF 409 419 446
5556 5PBO 417 427 453
5556 10PBO 418 428 455
8238 412 422 447
8238 5CF 409 418 443
823810CF 409 418 444
8238 5PBO 421 429 454
8238 10PBO 427 437 464
Table 3.2: Temperatures corresponding to 5%, 10%, and 50% mass loss of prepared composites
0
20
40
60
80
100
100 200 300 400 500 600
MA
ss %
Temperature (°C)
8238
8238 5CF
8238 10CF
8238 5PBO
8238 10PBO

47
3.4.3 Differential Scanning Calorimetry
The melting and crystallization temperatures as found by differential scanning calorimetry for
the 5556 material and composites are seen in Table 3.3, and for the 8238 material and
composites in Table 3.4. The cooling and secondary heating curves for these materials are shown
in Figure 3.4. It is immediately noticeable that the inclusion of both carbon and PBO fibers to the
5556 and 8238 matrices dramatically increases the crystallization temperature by around 20-
30°C depending on the fiber type and concentration. In this sense, it is seen that the PBO fibers
leads to a greater increase in crystallization temperatures than the carbon fiber. This provides
evidence that both fibers act as efficient nucleating agents for the Hytrel materials. Previous
studies on reinforced Hytrel materials have concluded similar results [32]. For the 8238 material
with 5wt% and 10wt% carbon fiber and 5wt% PBO dual melting peaks are observed. This
behaviour occurs when two distinct crystal structures are formed in the material, the melting of
secondary or imperfect crystal structures occurs at a lower temperature and the melting of
primary crystal structures subsequently takes place at higher temperatures [33]–[35]. However,
also of note, is that as the content of PBO fibers is increase to 10wt% the evidence of dual
melting endotherms disappears. While the inclusion of fibers increases the nucleation sites, the
polymer chain mobility is restricted which leads to the formation of more smaller crystals.
Therefore, it can be said that the 10wt% PBO filled 8238 material prevents the formation of
secondary crystal structures in the matrix due to the restriction on the mobility of the polymer
chain. On the melting curve of the 5556 materials there also exists a smaller endothermic peak
occurring around 215°C for the pure 5556 material and a very small peak for the fiber filled
compounds. Previously, it has been demonstrated that there is sufficient mobility to allow for
recrystallization during the heating process for Hytrel 5556 [32]. This leads to a re-melting of
crystal structures formed during the heating cycle at a higher temperature.

48
Figure 3.4: Differential scanning calorimetry thermograms of 5556 materials (Left) and 8238
materials (Right)
Material Tm (°C) Tc (°C)
5556 202.6 149.8
5556 5CF 202.6 171.7
5556 10CF 202.9 172.7
5556 5PBO 203.9 176.8
5556 10PBO 204.3 180.4
Table 3.3: Melting and crystallization temperatures of 5556 materials and composites
Material Tm1 (°C) Tm2 (°C) Tc (°C)
8238 219.9 N/A 175.8
8238 5CF 214.5 222.1 193.6
8238 10CF 214.3 222.1 194.1
8238 5PBO 216.8 222.0 198.0
8238 10PBO 221.5 N/A 202.5
Table 3.4: Melting and crystallization temperatures of 8238 materials and composites
-1.5
-1
-0.5
0
0.5
1
120 170 220
Hea
t Fl
ow
(W
/g)
Temperature (°C)
5556 5556 5CF
5556 10CF 5556 5PBO
5556 10PBO
-1.5
-1
-0.5
0
0.5
1
150 170 190 210 230 250
Hea
t Fl
ow
(W
/g)
Temperature (°C)
8238 8238 5CF
8238 10CF 8238 5PBO
8238 10PBO
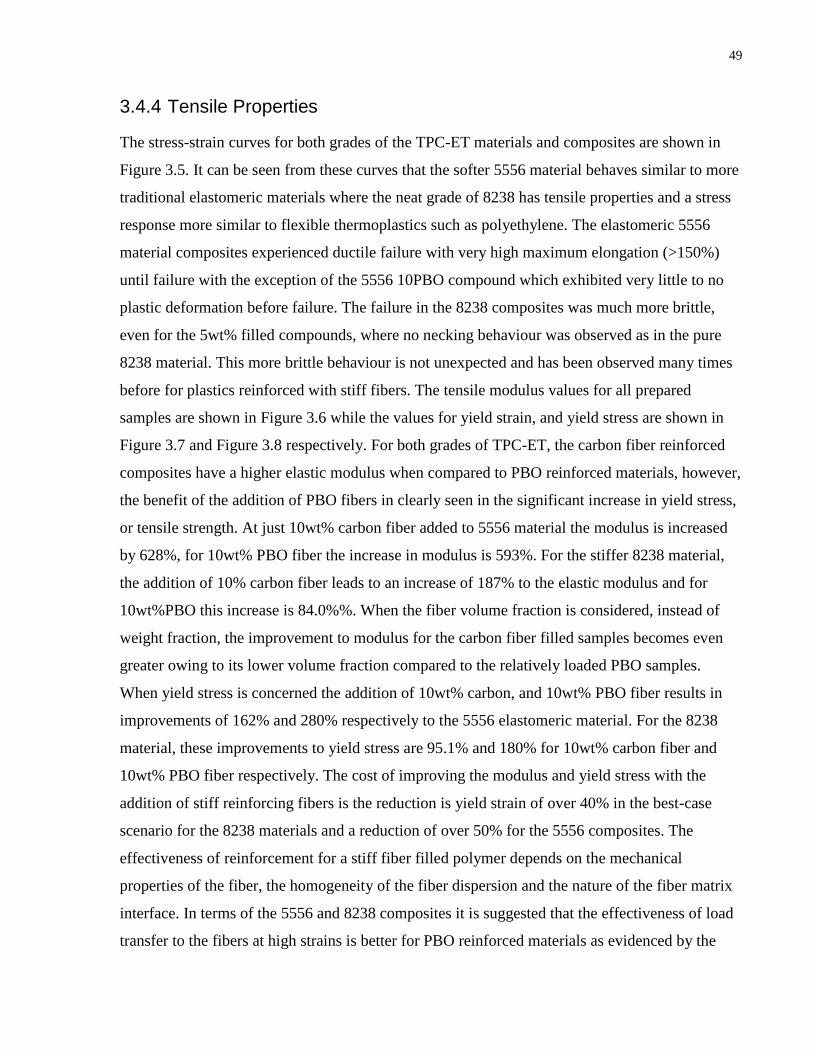
49
3.4.4 Tensile Properties
The stress-strain curves for both grades of the TPC-ET materials and composites are shown in
Figure 3.5. It can be seen from these curves that the softer 5556 material behaves similar to more
traditional elastomeric materials where the neat grade of 8238 has tensile properties and a stress
response more similar to flexible thermoplastics such as polyethylene. The elastomeric 5556
material composites experienced ductile failure with very high maximum elongation (>150%)
until failure with the exception of the 5556 10PBO compound which exhibited very little to no
plastic deformation before failure. The failure in the 8238 composites was much more brittle,
even for the 5wt% filled compounds, where no necking behaviour was observed as in the pure
8238 material. This more brittle behaviour is not unexpected and has been observed many times
before for plastics reinforced with stiff fibers. The tensile modulus values for all prepared
samples are shown in Figure 3.6 while the values for yield strain, and yield stress are shown in
Figure 3.7 and Figure 3.8 respectively. For both grades of TPC-ET, the carbon fiber reinforced
composites have a higher elastic modulus when compared to PBO reinforced materials, however,
the benefit of the addition of PBO fibers in clearly seen in the significant increase in yield stress,
or tensile strength. At just 10wt% carbon fiber added to 5556 material the modulus is increased
by 628%, for 10wt% PBO fiber the increase in modulus is 593%. For the stiffer 8238 material,
the addition of 10% carbon fiber leads to an increase of 187% to the elastic modulus and for
10wt%PBO this increase is 84.0%%. When the fiber volume fraction is considered, instead of
weight fraction, the improvement to modulus for the carbon fiber filled samples becomes even
greater owing to its lower volume fraction compared to the relatively loaded PBO samples.
When yield stress is concerned the addition of 10wt% carbon, and 10wt% PBO fiber results in
improvements of 162% and 280% respectively to the 5556 elastomeric material. For the 8238
material, these improvements to yield stress are 95.1% and 180% for 10wt% carbon fiber and
10wt% PBO fiber respectively. The cost of improving the modulus and yield stress with the
addition of stiff reinforcing fibers is the reduction is yield strain of over 40% in the best-case
scenario for the 8238 materials and a reduction of over 50% for the 5556 composites. The
effectiveness of reinforcement for a stiff fiber filled polymer depends on the mechanical
properties of the fiber, the homogeneity of the fiber dispersion and the nature of the fiber matrix
interface. In terms of the 5556 and 8238 composites it is suggested that the effectiveness of load
transfer to the fibers at high strains is better for PBO reinforced materials as evidenced by the

50
significantly higher yield stress for the PBO composites. This suggests that at higher strains and
stresses the good bonding between the matrices and the carbon fiber begin to break leading to
premature yielding of the material in comparison to the PBO reinforced composites. An
explanation for this behaviour is that the compounding process of mixing the fibers and the
matrix causes breakage of the fibers. Some breakage of the stiff fibers is expected under these
extremely high shear conditions and it is theorized that the more brittle carbon fibers experience
more breakage. The PBO fibers, being polymeric in nature, are inherently more tough than the
carbon fibers and their resistance to the compounding process is superior resulting is less fiber
breakage. The result of this is that the effective fiber length of the carbon fiber composites is
likely shorter than the PBO filled materials. It is well known that a longer fiber length will have
more effective reinforcement, which is especially noticeable after initial loading meaning the
modulus will not be as effected as the yield strength. We have established, through the use of
SEM, that there appears to be superior initial wetting between the carbon fiber and matrix
materials, this idea is partially confirmed by the relative tensile modulus of the composites. We
see that the modulus for PBO reinforced materials is lower than that of the carbon fiber
composites, especially for the 8238 material, despite the PBO fibers themselves having a greater
modulus, than carbon fiber, and a relatively higher volume fraction, thus a higher PBO
composite modulus would be expected. At the low strain, pre-yield, conditions where the
modulus is measured the fiber breakage effect, as previously discussed would not be as relevant;
however, there is another explanation which must be considered. The PBO fibers have a much
lower compression modulus and strength than the carbon fibers. Therefore, in the injection
molding process, where high compressive stresses are involved, it is likely that there is less fiber
alignment for PBO fibers. Additionally, as the composites are injected, the PBO fibers may
become deformed which would reduce the reinforcement effectiveness of the PBO fibers.

51
Figure 3.5: Stress-strain curve for 5556 (Left) and 8238 (Right) materials and composites
Figure 3.6: Tensile modulus values for 5556 (Left) and 8238 (Right) materials and composites
0
10
20
30
40
50
60
0% 20% 40% 60%
Stre
ss (
MP
a)
Strain
5556 5556 5CF
5556 10CF 5556 5PBO
5556 10PBO
0
20
40
60
80
100
0% 20% 40% 60%
Stre
ss (
MP
a)
Strain
8238 8238 5CF
8238 10CF 8238 5PBO
8238 10PBO
100.94
489.48
735.03
472.18
699.51
0
100
200
300
400
500
600
700
800
5556 5556 5CF 555610CF
55565PBO
555610PBO
Mo
du
lus
(MP
a)
Modulus
781.7
1,579.7
2,248.0
1,030.2
1,438.3
0
500
1000
1500
2000
2500
8238 82385CF
823810CF
82385PBO
823810PBO
Mo
du
lus
(MP
a)
Modulus

52
Figure 3.7: Yield strain values for 5556 (Left) and 8238 (Right) materials and composites
Figure 3.8: Yield stress values for 5556 (Left) and 8238 (Right) materials and composites
0.327
0.1650.140
0.098 0.091
0
0.05
0.1
0.15
0.2
0.25
0.3
0.35
0.4
5556 55565CF
555610CF
55565PBO
555610PBO
Yiel
d S
trai
n
Yield Strain
0.165
0.0990.083
0.0920.080
0
0.02
0.04
0.06
0.08
0.1
0.12
0.14
0.16
0.18
0.2
8238 82385CF
823810CF
82385PBO
823810PBO
Yiel
d S
trai
n
Yield Strain
13.54
27.64
35.45 34.93
51.49
0
10
20
30
40
50
60
5556 5556 5CF 555610CF
55565PBO
555610PBO
Yiel
d S
tres
s (M
Pa)
Yield Stress
32.94
54.61
68.1861.13
92.29
0
20
40
60
80
100
120
8238 8238 5CF 823810CF
82385PBO
823810PBO
Yiel
d S
ress
(M
Pa)
Yield Stress
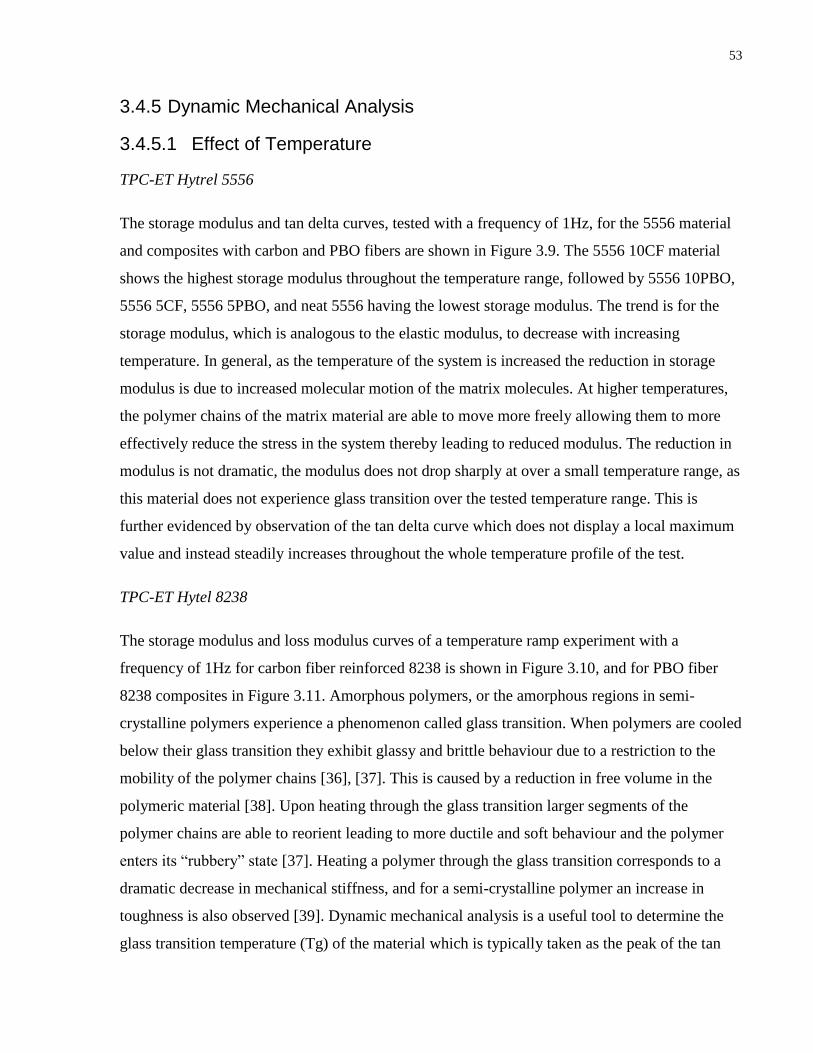
53
3.4.5 Dynamic Mechanical Analysis
3.4.5.1 Effect of Temperature
TPC-ET Hytrel 5556
The storage modulus and tan delta curves, tested with a frequency of 1Hz, for the 5556 material
and composites with carbon and PBO fibers are shown in Figure 3.9. The 5556 10CF material
shows the highest storage modulus throughout the temperature range, followed by 5556 10PBO,
5556 5CF, 5556 5PBO, and neat 5556 having the lowest storage modulus. The trend is for the
storage modulus, which is analogous to the elastic modulus, to decrease with increasing
temperature. In general, as the temperature of the system is increased the reduction in storage
modulus is due to increased molecular motion of the matrix molecules. At higher temperatures,
the polymer chains of the matrix material are able to move more freely allowing them to more
effectively reduce the stress in the system thereby leading to reduced modulus. The reduction in
modulus is not dramatic, the modulus does not drop sharply at over a small temperature range, as
this material does not experience glass transition over the tested temperature range. This is
further evidenced by observation of the tan delta curve which does not display a local maximum
value and instead steadily increases throughout the whole temperature profile of the test.
TPC-ET Hytel 8238
The storage modulus and loss modulus curves of a temperature ramp experiment with a
frequency of 1Hz for carbon fiber reinforced 8238 is shown in Figure 3.10, and for PBO fiber
8238 composites in Figure 3.11. Amorphous polymers, or the amorphous regions in semi-
crystalline polymers experience a phenomenon called glass transition. When polymers are cooled
below their glass transition they exhibit glassy and brittle behaviour due to a restriction to the
mobility of the polymer chains [36], [37]. This is caused by a reduction in free volume in the
polymeric material [38]. Upon heating through the glass transition larger segments of the
polymer chains are able to reorient leading to more ductile and soft behaviour and the polymer
enters its “rubbery” state [37]. Heating a polymer through the glass transition corresponds to a
dramatic decrease in mechanical stiffness, and for a semi-crystalline polymer an increase in
toughness is also observed [39]. Dynamic mechanical analysis is a useful tool to determine the
glass transition temperature (Tg) of the material which is typically taken as the peak of the tan

54
delta curve generated through a temperature ramp experiment. While the 5556 materials do not
experience glass transition through the selected temperature test range the 8238 materials do as
evidenced by the local maxima of tan delta. Again, similarly to the 5556 composites, the addition
of the reinforcing fibers leads to an increase in storage modulus but also leads to a reduction to
the loss factor. Likewise, to the elastic tensile modulus, the 8238 10CF material exhibits the
highest storage modulus followed by the 8238 5CF, 8238 10PBO, and 8238 5PBO displaying the
lowest storage modulus for the fiber reinforced materials. The inclusion of stiff fibers to a
polymeric matrix will tend to decrease the loss factor of the material system. The fibers act to
restrict to movement and rearrangement of the polymer chains leading to more elastic like
behaviour. In addition to the tan delta peak having a lower magnitude, the temperature
corresponding to this maximum is higher for the fiber reinforced materials. In these systems of
8238 with carbon fiber and PBO fiber reinforcement the increase to the glass transition is
evidence of good fiber wetting and a string fiber matrix bond [40]. Previously, it has been
reported that if there is sufficient wetting between the fiber and the matrix and there exists a
perfect fiber matrix interface then there will be fewer voids in the system. The result of this is
that it leads to a restriction to the mobility of the polymer chains in the matrix. Therefore, more
energy, temperature in this case, is required to promote the segmental motion of the polymer
chains which leads to the glass transition behaviour [40].
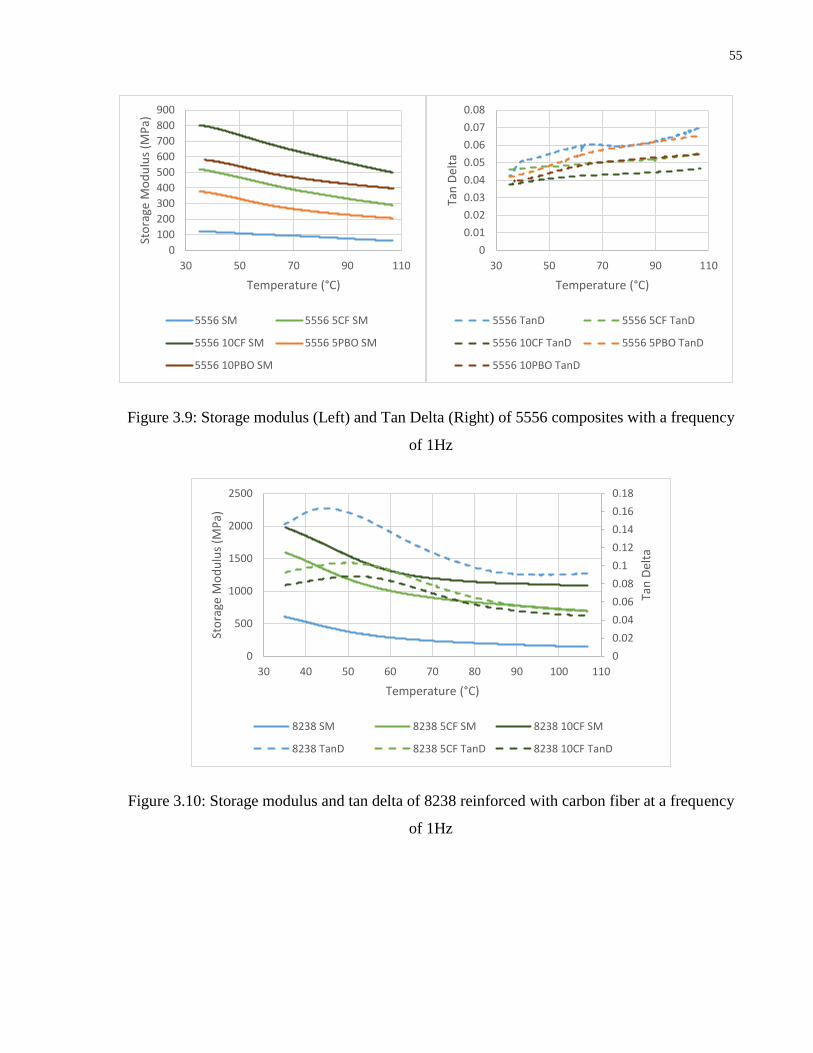
55
Figure 3.9: Storage modulus (Left) and Tan Delta (Right) of 5556 composites with a frequency
of 1Hz
Figure 3.10: Storage modulus and tan delta of 8238 reinforced with carbon fiber at a frequency
of 1Hz
0
100
200
300
400
500
600
700
800
900
30 50 70 90 110
Sto
rage
Mo
du
lus
(MP
a)
Temperature (°C)
5556 SM 5556 5CF SM
5556 10CF SM 5556 5PBO SM
5556 10PBO SM
0
0.01
0.02
0.03
0.04
0.05
0.06
0.07
0.08
30 50 70 90 110
Tan
Del
ta
Temperature (°C)
5556 TanD 5556 5CF TanD
5556 10CF TanD 5556 5PBO TanD
5556 10PBO TanD
0
0.02
0.04
0.06
0.08
0.1
0.12
0.14
0.16
0.18
0
500
1000
1500
2000
2500
30 40 50 60 70 80 90 100 110
Tan
Del
ta
Sto
rage
Mo
du
lus
(MP
a)
Temperature (°C)
8238 SM 8238 5CF SM 8238 10CF SM
8238 TanD 8238 5CF TanD 8238 10CF TanD
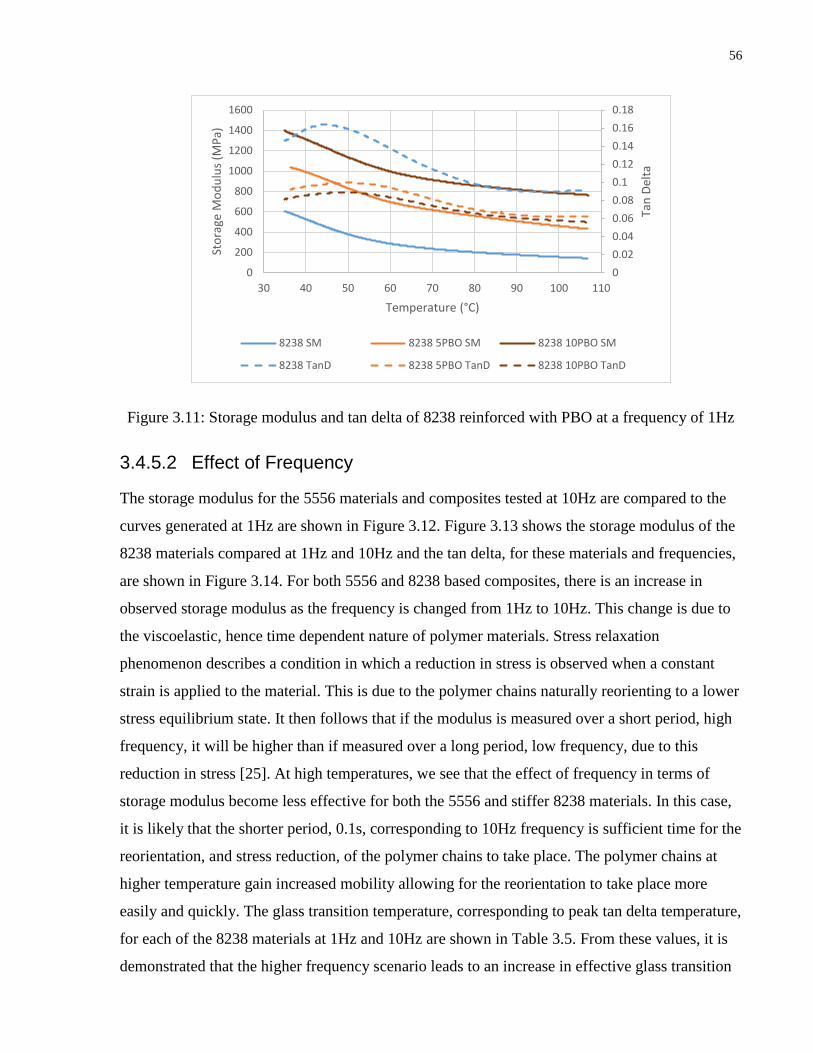
56
Figure 3.11: Storage modulus and tan delta of 8238 reinforced with PBO at a frequency of 1Hz
3.4.5.2 Effect of Frequency
The storage modulus for the 5556 materials and composites tested at 10Hz are compared to the
curves generated at 1Hz are shown in Figure 3.12. Figure 3.13 shows the storage modulus of the
8238 materials compared at 1Hz and 10Hz and the tan delta, for these materials and frequencies,
are shown in Figure 3.14. For both 5556 and 8238 based composites, there is an increase in
observed storage modulus as the frequency is changed from 1Hz to 10Hz. This change is due to
the viscoelastic, hence time dependent nature of polymer materials. Stress relaxation
phenomenon describes a condition in which a reduction in stress is observed when a constant
strain is applied to the material. This is due to the polymer chains naturally reorienting to a lower
stress equilibrium state. It then follows that if the modulus is measured over a short period, high
frequency, it will be higher than if measured over a long period, low frequency, due to this
reduction in stress [25]. At high temperatures, we see that the effect of frequency in terms of
storage modulus become less effective for both the 5556 and stiffer 8238 materials. In this case,
it is likely that the shorter period, 0.1s, corresponding to 10Hz frequency is sufficient time for the
reorientation, and stress reduction, of the polymer chains to take place. The polymer chains at
higher temperature gain increased mobility allowing for the reorientation to take place more
easily and quickly. The glass transition temperature, corresponding to peak tan delta temperature,
for each of the 8238 materials at 1Hz and 10Hz are shown in Table 3.5. From these values, it is
demonstrated that the higher frequency scenario leads to an increase in effective glass transition
0
0.02
0.04
0.06
0.08
0.1
0.12
0.14
0.16
0.18
0
200
400
600
800
1000
1200
1400
1600
30 40 50 60 70 80 90 100 110
Tan
Del
ta
Sto
rage
Mo
du
lus
(MP
a)
Temperature (°C)
8238 SM 8238 5PBO SM 8238 10PBO SM
8238 TanD 8238 5PBO TanD 8238 10PBO TanD

57
temperature for all materials. The observed increase in glass transition temperature is again due
to the time dependent nature of the polymeric materials as previously discussed. Taking the
definition of glass transition as the point where a large enough group of polymer chain segments
are able to undergo rearrangement it is logical that at high frequencies there is not sufficient time
to allow for this polymer chain segment movement. Consequently, this movement can only occur
when the temperature becomes sufficiently high. Also of note is that while the glass transition
increases from 5wt% to 10wt% carbon fiber reinforcement this is not true for the PBO reinforced
composites which show a decrease in Tg from 5wt% to 10wt% reinforcement. Previously it has
been demonstrated that if there is not sufficient fiber wetting or if the fiber content becomes too
high then a decrease in glass transition temperature can be observed [41]. If poor fiber wetting or
adhesion is observed, then there will be an increase in segmental mobility and leading to a
reduction in glass transition. In this case of PBO reinforced composites it is possible that the
8.3vol%, 10wt%, represents a high enough fiber fraction where there is the beginning of worse
fiber wetting or fiber-matrix adhesion when compared to the 4.1vol%, 5wt%, PBO reinforced
material.
Figure 3.12: Storage modulus of 5556 reinforced with carbon fiber (Left) and PBO fiber (Right)
at 1Hz and 10Hz
0
200
400
600
800
1000
30 50 70 90 110
Sto
rage
Mo
du
lus
(MP
a)
Temperature (°C)
5556 1Hz 5556 5CF 1Hz
5556 10CF 1Hz 5556 10Hz
5556 5CF 10Hz 5556 10CF 10Hz
0
100
200
300
400
500
600
700
30 50 70 90 110
Sto
rage
Mo
du
lus
(MP
a)
Temperature (°C)
5556 1Hz 5556 5PBO 1Hz
5556 10PBO 1Hz 5556 10Hz
5556 5PBO 10Hz 5556 10PBO 10Hz

58
Figure 3.13: Storage modulus of 8238 reinforced with 5wt% carbon and PBO fiber (Left) and
10wt% carbon and PBO fiber (Right) at 1Hz and 10Hz
Figure 3.14: Tan delta of 8238 reinforced with 5wt% carbon and PBO fiber (Left) ad 10wt%
carbon and PBO fiber (Right) at 1Hz and 10Hz
0
500
1000
1500
2000
2500
30 50 70 90 110
Sto
rage
Mo
du
lus
(MP
a)
Temperature (°C)
8238 1Hz 8238 5CF 1Hz
8238 5PBO 1Hz 8238 10Hz
8238 5CF 10Hz 8238 5PBO 10Hz
0
500
1000
1500
2000
2500
3000
30 50 70 90 110
Sto
rage
Mo
du
lus
(MP
a)
Temperature (°C)
8238 1Hz 8238 10CF 1Hz
8238 10PBO 1Hz 8238 10Hz
8238 10CF 10Hz 8238 10PBO 10Hz
0
0.02
0.04
0.06
0.08
0.1
0.12
0.14
0.16
0.18
30 50 70 90 110
Tan
Del
ta
Temperature (°C)
8238 1Hz 8238 5CF 1Hz
8238 5PBO 1Hz 8238 10Hz
8238 5CF 10Hz 8238 5PBO 10Hz
0
0.02
0.04
0.06
0.08
0.1
0.12
0.14
0.16
0.18
30 50 70 90 110
Tan
Del
ta
Temperature (°C)
8238 1Hz 8238 10CF 1Hz
8238 10PBO 1Hz 8238 10Hz
8238 10CF 10Hz 8238 10PBO 10Hz

59
Material Tg-1Hz (°C) Tg-10Hz (°C)
8238 43.68 53.01
8238 5CF 49.42 52.62
8238 10CF 51.00 53.76
8238 5PBO 50.63 52.12
8238 10PBO 48.51 50.60
Table 3.5: Glass transition temperatures of 8238 materials at a frequency of 1Hz and 10Hz
3.5 Conclusions
Two grades of polyester based thermoplastic elastomer materials, brand name Hytrel, have been
reinforced by melt blending with carbon fiber and poly(p-phenylene-2,6-benzobisoxazole) fibers.
The first grade tested had a medium hardness and stiffness with properties akin to elastomeric
materials, this was followed by a high hardness grade with mechanical properties more similar to
flexible thermoplastics such as polyethylene. The composites were tested for their thermal,
mechanical, and dynamic mechanical properties. Thermogravimetric analysis was done to
measure the thermal stability, and differential scanning calorimetry was conducted to analyse the
melting and crystallization behaviour. Next, the tensile mechanical properties, modulus of
elasticity, yield strain, and yield stress, was measured followed by dynamic mechanical analysis
to measure the storage modulus and loss factor, and the effect of temperature and frequency on
the composite materials. Significant improvements to the thermal stability, mechanical and
viscoelastic properties were found with the addition of the fibers. With 10wt% carbon fiber
reinforcement there was an improvement to the tensile modulus of 628% and 187% for the
medium and high hardness materials respectively. In terms of yield stress there were
improvements of 280% and 180% for the medium hardness and high hardness materials when
10wt% PBO fibers were added. Overall the PBO fibers provide the best reinforcement to the
5556 matrix where the 8238 matrix is better reinforced by the carbon fibers. In the 5556 samples
the yield stress gained by the PBO fibers far outweighs the lower modulus compared to the
carbon reinforced compounds, where in the 8238 materials there is too much of a difference in
modulus between the PBO and carbon reinforced samples.

60
3.6 Acknowledgements
The authors would like to acknowledge the following agencies for financial support: Natural
Sciences and Engineering Research Council of Canada (NSERC), and the Ontario Centres of
Excellence (OCE).

61
3.7 References
[1] D. Bhattacharya and R. Gowri Shankar Rao, “Indispensable Properties, Efficacy &
Application Of Thermoplastic Elastomers,” Int. J. Innov. Res. Dev., vol. 2, no. 5, pp. 381–
392, 2013.
[2] X. Hu, H. Kang, Y. Li, Y. Geng, R. Wang, and L. Zhang, “Preparation, morphology and
superior performances of biobased thermoplastic elastomer by in situ dynamical
vulcanization for 3D-printed materials,” Polym. (United Kingdom), vol. 108, pp. 11–20,
2017.
[3] R. J. Spontak and N. P. Patel, “Thermoplastic elastomers: fundamentals and applications,”
Curr. Opin. Colloid Interface Sci., vol. 5, no. 5–6, pp. 333–340, 2000.
[4] K. P. Mineart, S. S. Tallury, T. Li, B. Lee, and R. J. Spontak, “Phase-Change
Thermoplastic Elastomer Blends for Tunable Shape Memory by Physical Design,” Ind.
Eng. Chem. Res., p. acs.iecr.6b04039, 2016.
[5] J. Kaleta, M. Królewicz, and D. Lewandowski, “Magnetomechanical properties of
anisotropic and isotropic magnetorheological composites with thermoplastic elastomer
matrices,” Smart Mater. Struct., vol. 20, no. 8, p. 85006, 2011.
[6] P. Zając, J. Kaleta, D. Lewandowski, and A. Gasperowicz, “Isotropic magnetorheological
elastomers with thermoplastic matrices: structure, damping properties and testing,” Smart
Mater. Struct., vol. 19, no. 4, p. 45014, 2010.
[7] M. Ji, H. Deng, D. Yan, X. Li, L. Duan, and Q. Fu, “Selective localization of multi-walled
carbon nanotubes in thermoplastic elastomer blends: An effective method for tunable
resistivity-strain sensing behavior,” Compos. Sci. Technol., vol. 92, pp. 16–26, 2014.
[8] C. Cochrane, V. Koncar, M. Lewandowski, and C. Dufour, “Design and Development of a
Flexible Strain Sensor for Textile Structures Based on a Conductive Polymer Composite,”
Sensors, vol. 7, no. 4, pp. 473–492, 2007.
[9] H. Liu et al., “Electrically conductive thermoplastic elastomer nanocomposites at ultralow
graphene loading levels for strain sensor applications,” J. Mater. Chem. C, vol. 4, no. 1,
62
pp. 157–166, 2016.
[10] L. Lin et al., “Towards tunable sensitivity of electrical property to strain for conductive
polymer composites based on thermoplastic elastomer,” ACS Appl. Mater. Interfaces, vol.
5, no. 12, pp. 5815–5824, 2013.
[11] Y. Srithep et al., “Processing and characterization of recycled poly (ethylene
terephthalate) blends with chain extenders, thermoplastic elastomer, and/or poly (butylene
adipate-co-terephthalate),” Polym. Eng. Sci., vol. 51, no. 6, pp. 1023–1032, 2011.
[12] E. G. Bajsić and V. Rek, “Dynamic mechanical study of thermoplastic polyurethane /
polypropylene blends,” Chem. Eng., no. 73, pp. 1–10, 2004.
[13] S. Fu et al., “Combined effect of interfacial strength and fiber orientation on mechanical
performance of short Kevlar fiber reinforced olefin block copolymer,” Compos. Sci.
Technol., vol. 108, pp. 23–31, 2015.
[14] Y. A. El-Shekeil, S. M. Sapuan, K. Abdan, and E. S. Zainudin, “Influence of fiber content
on the mechanical and thermal properties of Kenaf fiber reinforced thermoplastic
polyurethane composites,” Mater. Des., vol. 40, pp. 299–303, 2012.
[15] Y. A. El-Shekeil, S. M. Sapuan, and M. W. Algrafi, “Effect of fiber loading on
mechanical and morphological properties of cocoa pod husk fibers reinforced
thermoplastic polyurethane composites,” Mater. Des., vol. 64, pp. 330–333, 2014.
[16] A. Kalapakdee and T. Amornsakchai, “Mechanical properties of preferentially aligned
short pineapple leaf fiber reinforced thermoplastic elastomer: Effects of fiber content and
matrix orientation,” Polym. Test., vol. 37, pp. 36–44, 2014.
[17] H. Anuar and A. Zuraida, “Improvement in mechanical properties of reinforced
thermoplastic elastomer composite with kenaf bast fibre,” Compos. Part B Eng., vol. 42,
no. 3, pp. 462–465, 2011.
[18] K. Jurczuk and A. Galeski, “Thermoplastic elastomers reinforced with
poly(tetrafluoroethylene) nanofibers,” Eur. Polym. J., vol. 80, no. 2016, pp. 58–69, 2016.
63
[19] M. He, D. Zhang, J. Guo, S. Qin, and X. Ming, “Mechanical, thermal, and dynamic
mechanical properties of long glass fiber-reinforced thermoplastic
polyurethane/polyoxymethylene composites,” Polym. Compos., vol. 35, no. 10, pp. 2067–
2073, 2014.
[20] A. K. Barick and D. K. Tripathy, “Thermal and dynamic mechanical characterization of
thermoplastic polyurethane/organoclay nanocomposites prepared by melt compounding,”
Mater. Sci. Eng. A, vol. 527, no. 3, pp. 812–823, 2010.
[21] Y. K. Huang, P. H. Frings, and E. Hennes, “Mechanical properties of Zylon,” Compos.
Part B Eng., vol. 33, pp. 109–115, 2002.
[22] L. Bian, J. Xiao, J. Zeng, S. Xing, C. Yin, and A. Jia, “Effects of thermal treatment on the
mechanical properties of poly(p-phenylene benzobisoxazole) fiber reinforced phenolic
resin composite materials,” Mater. Des., vol. 54, pp. 230–235, 2014.
[23] F. Larsson and L. Svensson, “Carbon, polyethylene and PBO hybrid fibre composites for
structural lightweight armour,” Compos. - Part A Appl. Sci. Manuf., vol. 33, no. 2, pp.
221–231, 2002.
[24] R. P. Walsh and C. A. Swenson, “Mechanical properties of zylon/epoxy composite at
295K and 77 K,” IEEE Trans. Appl. Supercond., vol. 16, no. 2, pp. 1761–1764, 2006.
[25] A. Pearson and H. E. Naguib, “Novel polyurethane elastomeric composites reinforced
with alumina, aramid, and poly(p-phenylene-2,6-benzobisoxazole) short fibers,
development and characterization of the thermal and dynamic mechanical properties,”
Compos. Part B Eng., vol. 122, 2017.
[26] A. Anwer, Z. S. Bagheri, G. Fernie, T. Dutta, and H. E. Naguib, “Evolution of the
Coefficient of Friction with Surface Wear for Advanced Surface Textured Composites,”
Adv. Mater. Interfaces, 2017.
[27] P. Davies, A. R. Bunsell, and E. Chailleux, “Tensile fatigue behaviour of PBO fibres,” J.
Mater. Sci., vol. 45, no. 23, pp. 6395–6400, 2010.
[28] L. Chen et al., “Grafting of silane and graphene oxide onto PBO fibers: Multifunctional

64
interphase for fiber/polymer matrix composites with simultaneously improved interfacial
and atomic oxygen resistant properties,” Compos. Sci. Technol., vol. 106, pp. 32–38,
2015.
[29] Z. Li, L. Gong, X. Cheng, S. He, C. Li, and H. Zhang, “Flexible silica aerogel composites
strengthened with aramid fibers and their thermal behavior,” Mater. Des., vol. 99, pp.
349–355, 2016.
[30] J. H. Song, “Pairing effect and tensile properties of laminated high-performance hybrid
composites prepared using carbon/glass and carbon/aramid fibers,” Compos. Part B Eng.,
vol. 79, pp. 61–66, 2015.
[31] M. S. Sohn, X. Z. Hu, J. K. Kim, and L. Walker, “Impact damage characterisation of
carbon fibre / epoxy composites with multi-layer reinforcement,” Carbon N. Y., vol. 31,
no. 8, pp. 681–691, 2000.
[32] J. Bae, S. Lee, B. C. Kim, H. H. Cho, and D. W. Chae, “Polyester-based thermoplastic
elastomer/MWNT composites: Rheological, thermal, and electrical properties,” Fibers
Polym., vol. 14, no. 5, pp. 729–735, 2013.
[33] J. Liang, Y. Xu, Z. Wei, P. Song, G. Chen, and W. Zhang, “Mechanical properties,
crystallization and melting behaviors of carbon fiber-reinforced PA6 composites,” J.
Therm. Anal. Calorim., vol. 115, no. 1, pp. 209–218, 2014.
[34] C. L. Wei, M. Chen, and F. E. Yu, “Temperature modulated DSC and DSC studies on the
origin of double melting peaks in poly(ether ether ketone),” Polymer (Guildf)., vol. 44, no.
26, pp. 8185–8193, 2003.
[35] P. Cebe and S. Chung, “Melting behavior of high performance composite matrix
polymers: Poly(phenylene sulfide),” Polym. Compos., vol. 11, no. 5, pp. 265–273, 1990.
[36] J. H. Gibbs and E. A. DiMarzio, “Nature of the Glass Transition and the Glassy State,” J.
Chem. Phys., vol. 28, no. 3, pp. 373–383, 1958.
[37] C. A. Angell, K. L. Ngai, G. B. McKenna, P. F. McMillan, and S. W. Martin, “Relaxation
in glassforming liquids and amorphous solids,” J. Appl. Phys., vol. 88, no. 6, pp. 3113–
65
3157, 2000.
[38] D. Turnbull and M. H. Cohen, “Free‐Volume Model of the Amorphous Phase: Glass
Transition,” J. Chem. Phys., vol. 34, no. 1, pp. 120–125, 1961.
[39] R. F. Boyer, “Glassy transitions in semicrystalline polymers,” J. Polym. Sci. Polym.
Symp., vol. 50, no. 1, pp. 189–242, 1975.
[40] L. Rebenfeld, G. P. Desio, and J. C. Wu, “Effects of fibers on the glass transition
temperature of polyphenylene sulfide composites,” J. Appl. Polym. Sci., vol. 42, no. 3, pp.
801–805, 1991.
[41] N. A. Rahman, A. Hassan, R. Yahya, and R. A. Lafia-Araga, “Impact properties of glass-
fiber/polypropylene composites: The influence of fiber loading, specimen geometry and
test temperature,” Fibers Polym., vol. 14, no. 11, pp. 1877–1885, 2013.

66
Chapter 4
Polyamide 6,6 hybrid composites with rubber particles and glass fiber for high temperature applications
67
4.1 Abstract
Recently, in many industrial fields, there has been a drive to replace traditional metallic
components with high strength polymer composites in the interest of reducing weight. Polyamide
6,6 (PA66) is a high strength thermoplastic displaying excellent performance at high
temperatures, this behaviour can be further enhanced by the addition of reinforcing fillers. Here,
PA66 matrix has been reinforced with chopped glass fiber as well as hybrid composites
containing both glass fiber and rubber particles to enhance impact performance and toughness.
The composite materials were then tested for their thermal, mechanical, and dynamic mechanical
properties. Significant improvement to mechanical performance was found with the inclusion of
glass fibers with an increase in modulus of 154%, and a 124% improvement to yield stress for a
30wt% glass reinforced PA66 over a pure material grade.
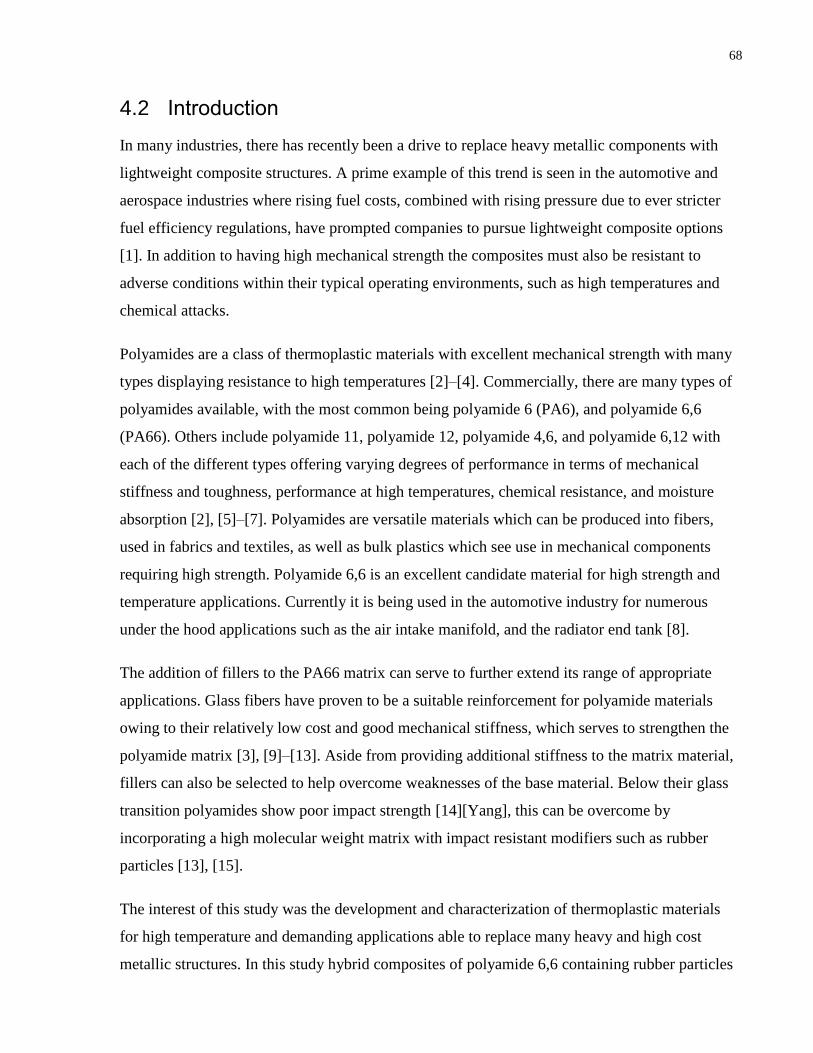
68
4.2 Introduction
In many industries, there has recently been a drive to replace heavy metallic components with
lightweight composite structures. A prime example of this trend is seen in the automotive and
aerospace industries where rising fuel costs, combined with rising pressure due to ever stricter
fuel efficiency regulations, have prompted companies to pursue lightweight composite options
[1]. In addition to having high mechanical strength the composites must also be resistant to
adverse conditions within their typical operating environments, such as high temperatures and
chemical attacks.
Polyamides are a class of thermoplastic materials with excellent mechanical strength with many
types displaying resistance to high temperatures [2]–[4]. Commercially, there are many types of
polyamides available, with the most common being polyamide 6 (PA6), and polyamide 6,6
(PA66). Others include polyamide 11, polyamide 12, polyamide 4,6, and polyamide 6,12 with
each of the different types offering varying degrees of performance in terms of mechanical
stiffness and toughness, performance at high temperatures, chemical resistance, and moisture
absorption [2], [5]–[7]. Polyamides are versatile materials which can be produced into fibers,
used in fabrics and textiles, as well as bulk plastics which see use in mechanical components
requiring high strength. Polyamide 6,6 is an excellent candidate material for high strength and
temperature applications. Currently it is being used in the automotive industry for numerous
under the hood applications such as the air intake manifold, and the radiator end tank [8].
The addition of fillers to the PA66 matrix can serve to further extend its range of appropriate
applications. Glass fibers have proven to be a suitable reinforcement for polyamide materials
owing to their relatively low cost and good mechanical stiffness, which serves to strengthen the
polyamide matrix [3], [9]–[13]. Aside from providing additional stiffness to the matrix material,
fillers can also be selected to help overcome weaknesses of the base material. Below their glass
transition polyamides show poor impact strength [14][Yang], this can be overcome by
incorporating a high molecular weight matrix with impact resistant modifiers such as rubber
particles [13], [15].
The interest of this study was the development and characterization of thermoplastic materials
for high temperature and demanding applications able to replace many heavy and high cost
metallic structures. In this study hybrid composites of polyamide 6,6 containing rubber particles
69
and chopped glass fibers have been analyzed for their thermal behaviour, melting and
crystallization temperatures, thermal stability and mechanical properties. Of great interest in the
field of polymer research is not only constant strain rate behaviour but time sensitive
performance of composite materials, thus emphasis has been placed on the dynamic mechanical
properties of the polyamide materials. The performance of the hybrid composites has been
compared to a pure glass fiber reinforced polyamide composite, a highly impact modified
polyamide containing rubber particles, and a pure PA66 material.
4.3 Materials and Methods
4.3.1 Materials
Three grades of Polyamide 6,6 (PA66) polymer pellets, Vydyne 22HSP, Vydyne 41H, and
Vydye R530HT, were provided by Ascend Performance Materials. Vydyne 22HSP is pure PA66
polymer, Vydyne 41H is a high impact grade containing a proprietary mixture of carbon black
and rubber particles, and Vydyne R530HT contains 30wt% chopped glass fiber.
4.3.2 Sample Fabrication
In addition to the three supplied grades, blends of the 41H and R530HT material were prepared
at volumetric ratios of 70% 41H and 30% R530HT, and 30% 41H and 70% R530HT. These
specific ratios were selected as they roughly correlate to glass fiber content of 10wt% for the
70:30 41H:R530HT material and 20wt% glass fiber for the 30:70 41H:R530HT blend. The
blends were prepared by compounding on a lab scale twin screw compounder (DSM Xplore 15,
DSM Netherlands). The co-rotating twin screws were set at a speed of 50rpm and the
temperature was kept constant at 290°C for each run. The compounding, or mixing, time was ten
minutes to ensure thorough mixing of the two materials and the glass fibers. Before molding, all
materials were dried in an oven at 80°C for three hours to a level of no more than 0.2% H2O by
weight.
Tensile, and standard test bar samples, used for dynamic mechanical analysis were fabricated by
injection molding (DSM IM5.5, DSM Netherlands). Injection mold processing temperatures
along with material types and nomenclature are reported in Table 4.1. The injection molding
temperatures for the barrel and the mold were set according to the material supplier
recommendations.
70
Material Name Material Grade Nomenclature Barrel
Temperature °C
Mold
Temperature °C
Vydyne 22HSP Pure PA66 22HSP 290 85
Vydyne 41H BK0677 High Impact
Modified PA66
41H 290 85
Vydyne R530HT BK02 PA66 with 30wt%
glass Fiber
R530 295 90
70:30 41H:R530 Blend containing
70% 41H and 30%
R530 by volume.
Glass fiber content
is 10.6wt%
70-41H 290 90
30:70 41H:R530 Blend containing
30% 41H and 70%
R530 by volume.
Glass fiber content
is 22wt%.
30-41H 290 90
Table 4.1: Nomenclature of prepared PA66 materials and injection molding temperatures
4.3.3 Thermogravimetric Analysis
The decomposition temperature of the polyamide materials was measured by thermogravimetric
analysis (TGA Q50, TA Instruments). Thermogravimetric testing was completed in accordance
with ASTM E2550. Samples were cut to a weight of approximately 20mg and heated to 600°C at
a rate of 20°C/min in a nitrogen atmosphere. The degradation onset temperature was measured
by taking the temperatures corresponding to 5%, 10% and 50% mass loss.
4.3.4 Differential Scanning Calorimetry
Melting and crystallization temperatures for the prepared materials were measured by differential
scanning calorimetry (DSC Q2000, TA Instruments). A standard heat-cool-heat experiment,
from -50°C and 315°C, was conducted for each sample with a heating rate of 10°C/min and a
cooling rate of 5°C/min, in accordance with ASTM D3418.

71
4.3.5 Tensile Testing
The tensile properties, tested on a Instron 5848 universal testing machine, of the materials were
measured per ASTM D638. The injection molded samples were subjected to a constant strain
rate of 5mm/min. The tests were conducted at room temperature and humidity.
4.3.6 Dynamic Mechanical Analysis
A dynamic mechanical analysis (DMA Q800, TA Instruments) was performed on the PA66
materials, testing procedure followed ASTM D4065. The dynamic mechanical properties of the
injection molded samples, approximate dimensions of 60x12x2mm, were measured in dual
cantilever mode using the 35mm dual cantilever clamp provided by TA Instruments. The
materials’ response to both increasing temperature and frequency was tested. The DMA testing
was performed with a constant strain of 0.05% while the temperature was increased from 35-
100°C with a rate of 3°C/min. The viscoelastic properties were measured at three frequencies,
0.1Hz, 1Hz, and 5Hz.
4.3.7 Scanning Electron Microscopy
Scanning electron microscopy images were taken using a JEOL JSM-IT100, Samples were cut
so that the imaged surface was normal to the preferred direction of the fibers and then sputter
coated with a thin layer of platinum particles. Backscatter detection was used for all images to
highlight the contrast between the polyamide matrix and the reinforcing glass fibers.
72
Figure 4.1: SEM images of prepared materials. Top row right to left (R-L), 22HSP 100x, 300x,
650x. Second row R-L, 41H 100x, 300x, 650x. Third row R-L, 70-41H 100x, 300x, 650x. Fourth
row R-L 30-41H 150x, 300x, 650x. Bottom row R-L, R530 150x, 300x, 650x.
73
4.4 Results and Discussion
4.4.1 Scanning Electron Microscopy
Scanning electron microscopy images of the prepared PA66 materials are shown in Figure 4.1.
The properties of fiber reinforced plastics depend on the intrinsic properties of the fiber and the
matrix as well as the fiber dispersion and wetting, and the nature of the fiber-matrix interface and
the strength of this bond. From the SEM images of the glass fiber filled materials we can see that
there is good dispersion of the fibers and no non-uniform region of material containing an
agglomerate of fiber. This confirms that the compounding time and screw speed were sufficient
to properly mix the materials and disperse the fibers uniformly throughout the composite.
Additionally, it can be seen from these images that there is good wetting between the fiber and
matrix material where the matrix seems to cling to the glass fiber. This good wetting serves as
evidence of strong fiber-matrix adhesion and good interfacial properties. Also of note is the
visual evidence of the fiber alignment created during the injection molding process. It is
expected that the alignment of the fibers will serve to increase the observed mechanical stiffness
of the material. This will be especially noticeable in the tensile results where the applied force is
parallel to the direction of the fibers.
4.4.2 Thermogravimetric Analysis
The thermal stability of the prepared PA66 materials was tested by thermogravimetric analysis,
the TGA thermograms are shown in Figure 4.2, and the temperatures corresponding to 5%, 10%
and 50% mass loss in Figure 4.3. In general, the polyamide materials demonstrate excellent
resistance to high temperatures with 41H having the highest degradation onset temperature,
corresponding to 5% mass loss, at 450°C, and the lowest is the pure PA66 22HSP having a
degradation onset temperature of 441°C. The 5% mass loss temperature for the R530 material is
443°C. The material blends of 41H and R530 demonstrate decomposition onset temperatures
between the two parent materials with the 70-41H material showing slightly higher thermal
resistance compared to the 30-41H material, 449°C versus 446°C respectively. Both blends show
a singular well defined onset temperature which gives evidence to their homogeneous nature. In
this case the addition of the glass fibers slightly improves the initial thermal stability over the
pure material. The impact of the glass fibers is more noticeable at high temperatures
corresponding to 50% mass loss. At these temperatures, the glass filled compound show

74
improvements over the non-reinforced polymers meaning that the decomposition rate is lower
for the glass reinforced materials. It is also important to consider the effect of the R530, 41H, and
22HSP being composed of slightly different polymer backbones. The differences seen in the
thermal stability of the PA66 compounds is also due to the variances in the polymer chains and
not only due to the addition of the various filler materials. The PA66 41H has a higher molecular
weight relative to the other tested compounds and demonstrated by the higher initial
decomposition temperature corresponding to 5% mass loss, and also greater thermal stability
when 10% mass loss is considered [16]. This would also conform with the highly impact
modified nature of this material. Additionally, the blends of 41H and R530 show higher
decomposition temperatures than the pure R530 material confirming the idea that the
decomposition onset temperature is dependent on the molecular weight and differences in the
polyamide chain more than the glass fiber content.
Figure 4.2: Thermogravimetric thermograms of PA66 materials
0
20
40
60
80
100
70 170 270 370 470 570
Mas
s %
Temperature (°C)
22HSP 41H R530 30-41H 70-41H

75
Figure 4.3: Temperatures corresponding to 5%, 10% and 50% mass loss of PA66 materials
4.4.3 Differential Scanning Calorimetry
The differential scanning calorimetry curves generated from the heat-cool-heat experiment are
shown in Figure 4.4. Each of the PA66 materials display dual melting peaks between 247°C and
262°C depending on the material grade. On the cooling curves, crystallization temperatures are
observed between 221°C and 230°C again depending on the grade. The specific melting and
crystallization temperatures for each of the tested materials are displayed in Table 4.2. The
existence of the crystallization peaks on the cooling curve confirms the semi crystalline nature of
polyamide 6,6. The degree of crystallinity was determined by measuring the heat of fusion, using
TA Universal Analysis software, and comparing the measured value to the heat of fusion for a
100% crystallised polyamide 66 material, 226 J/g, which was found in literature [17]. It was
found that the pure polymer, 22HSP, exhibited the highest degree of crystallinity at 25.9% while
the crystallinity of the filled compounds, 41H and R530 was 19.7% and 22.3% respectively.
Expectedly, the crystallinity of the 41H and R530 blend materials exhibited crystallinity fraction
between the base materials at 21.6% for 70-41H and 21.3% for 30-41H. The differences seen in
crystallinity is in some part be due to the variations in molecular weight and formulations of the
base matrix material. It has been demonstrated previously that the degree of crystallinity in
polymer materials decreases with increasing molecular weight [18], [19]. This argument explains
430
440
450
460
470
480
490
500
510
0 10 20 30 40 50 60
Tem
per
atu
r e
(°C
)
Mass Loss %
22HSP 41H R530 30-41H 70-41H

76
the behaviour of the Vydyne 41H material quite well as it exhibits both a higher initial
decomposition temperature and lower degree of crystallinity compared to the pure material. The
glass filled R530HT material exhibits similar initial decomposition kinetics to the pure material
but has a lower degree of crystallinity. This suggests that the glass fibers serve to negatively
impact the crystalline fraction of the material. The dual melting peaks seen in the PA66 materials
is likely a result of the melting of two different crystal morphologies as well as possible melting-
recrystallization. It has been theorised previously for semi-crystalline materials that secondary
and primary crystal structures will be formed provided the crystallization time is long enough.
Upon heating, the secondary crystal structures show a lower melting temperature with the
primary structures melting at a higher temperature [20]. The melting-recrystallization
phenomena describes a procedure where the lower temperature melting peak describes the
melting of initial crystal structures which are subsequently recrystallized upon further heating.
This then leads to the higher melting peak corresponding to the melting of more perfectly formed
crystal structures [21]. The 70-41H and 30-41H blended materials show well defined
crystallization and melting peaks occurring at a set temperature. This confirms that these blends
are behaving as a specific homogeneous material rather than a heterogeneous mixture.
Figure 4.4: DSC thermograms of prepared materials
-2
-1.5
-1
-0.5
0
0.5
1
1.5
180 200 220 240 260 280
Hea
t Fl
ow
(W
/g)
Temperature (°C)
22HSP 41H R530 30-41H 70-41H

77
Material Tc (°C) Tm1 (°C) Tm2 (°C) Crystallinity %
22Hsp 227.7 251.7 262.1 25.9
41H 230.4 252.1 260.2 19.7
R530 221.6 247.3 257.1 22.3
30-41H 226.3 248.6 257.32 21.3
70-41H 230.4 251.1 259.8 21.6
Table: 4.2: Crystallization and melting temperatures, and degree of crystallinity of PA66
materials
4.4.4 Tensile Properties
The tensile stress-strain curves for the PA66 materials are shown in Figure 4.5, and tensile
modulus and yield stress values are shown in Figure 4.6. The highly impact modified 41H
material exhibited the most ductile behaviour owing to its very high total plastic deformation
before failure (>150%). This maximum elongation is impressive when compared to the neat
22Hsp which experiences around 50% strain before failure. While not as high in terms of total
elongation before failure and plastic deformation this still represents quite tough behaviour
especially considering this testing was conducted at room temperature below the glass transition
of the material. The 70-41H material, corresponding to an approximately 10wt% glass fiber
reinforced material, experienced some plastic deformation before failure around 11% maximum
elongation. As would be predicted as the glass fiber content increases to 20wt%, 30-41H, and
30wt%, R530, the maximum elongation and overall ductility of the material decreases until the
point where the R530 material experiences brittle fracture. When compared to the neat 22HSP
material the addition of the rubber particles in the 41H material results in a decrease in overall
mechanical stiffness and strength. For this material, there is a reduction of 30.0% to the tensile
modulus and a 39.4% reduction to yield stress. For the glass fiber reinforced materials, there is
expectedly a significant increase in stiffness and mechanical strength as a portion of the applied
load is transferred to the stiff glass fibers. Additionally, the injection molding process tends to
align the fibers in the direction of flow which in this case is along the direction of applied load.

78
This makes the effectiveness of the fiber reinforcement greater than if the fibers were randomly
oriented in the matrix. The tensile modulus for the R530 material is 154% greater in comparison
to the pure 22Hsp and a 261% improvement over the impact modified 41H material.
Furthermore, there is a 124%, and 269% increase in yield stress for the R530 material in
comparison to 22Hsp and 41H respectively. The blends of 41H and R530, 30-41H and 70-41H,
predictably demonstrate mechanical behaviour and possess mechanical properties in between the
two parent materials. The tensile modulus for 70-41H, and 30-41H are 84.7% and 160% greater
than the 41H material respectively. In terms of yield stress these improvements, relative to 41H
are 72.7% and 127% for 70-41H and 30-41H respectively. In an effort to predict the properties of
the 41H ad R530 blend materials the rule of mixture (E41H:R530 = E41HV41H + ER530VR530) provides
a reasonable approximation to the observed values. When taking the tensile modulus values for
41H and R530 the rule of mixture for a 70:30 and 30:70 ratio of 41H to R530 predicts a modulus
of 2102MPa and 3332MPa. This prediction is only 3.5% off of the reported value for 70-41H
and 8.8% different from the experimental modulus of 30-41H.
79
Figure 4.5: Stress-strain curves of PA66 materials
0
20
40
60
80
100
120
140
160
180
0% 20% 40% 60% 80% 100% 120% 140% 160%
Stre
ss (
MP
a)
Strain
0
20
40
60
80
100
120
140
160
180
0% 5% 10% 15% 20%
Stre
ss (
MP
a)
Strain
22HSP 41H R530 30-41H 70-41H

80
Figure 4.6: Tensile modulus (Left) and Yield stress (Right) values for PA66 materials
4.4.5 Dynamic Mechanical Analysis
The dynamic mechanical properties were investigated under the effect of increasing temperature
and frequency. In Figure 4.7 and Figure 4.8 the storage modulus and tan delta for the three PA66
compounds are compared and a frequency of 1Hz. As expected the 30wt% glass fiber filled
R530 compound displays the highest storage modulus followed by the 30-41H material, while
the 41H displays the lowest storage modulus. Where in the standard tensile test the 30-41H
material had a higher modulus than the 22Hsp pure material, here, at low temperatures, the
reverse is true when considering storage modulus in the dual cantilever deformation mode. It is
theorized that the rubber particles, and reinforcing glass fibers, involved with the high impact
modification of the 41H, and stiffening of the R530 material alters the effective stiffness of the
composite differently in bending than in pure tension. While the storage modulus and Young’s
modulus are analogous they are not directly comparable due to the time dependent nature of the
storage modulus. Therefore, it is further suggested that the rubber particles, and glass fibers, in
the 41H material, the R530 material, and the blends drastically effect the time dependent nature
of the material. Additionally, the reinforcing effects of the chopped glass fiber are likely more
noticeable in tension due to their aligned nature in this mode than in bending. There is an inverse
relationship between storage modulus and tan delta for these materials with the glass fiber
reinforced materials having a lower loss factor compared to the other PA66 compounds. When
an external stress is applied to a viscoelastic polymer the polymer chains will tend to rearrange to
1,676
1,179
4,255
3,063
2,178
0
500
1000
1500
2000
2500
3000
3500
4000
4500
5000
22 HSP 41H R530 30-41H 70-41H
Mo
du
lus
(MP
a)
73.1
44.3
163.6
100.6
76.5
0
20
40
60
80
100
120
140
160
180
22 HSP 41H R530 30-41H 70-41H
Yiel
d S
tres
s (M
Pa)

81
reduce the internal stress in the material. This rearrangement gives rise to the excellent damping
characteristics of polymer materials as evidenced by their relatively high tan delta values in
comparison to metals which are nearly purely elastic. The inclusion of the glass fibers serve to
prevent this molecular rearrangement thus causing the material to behave more elastically and
leading to the lower loss factor in this material. The behaviour, as expected, is for increasing
amounts of glass fiber reinforcement to inversely correlate with the loss factor of the composite
material with the R530 material displaying the lowest tan delta followed by the 30-41H and the
70-41H blends. Also of importance is that the inclusion of the glass fibers greatly improves the
materials resistance to increasing temperatures. When the storage modulus of each material is
considered at 45°C and 85°C it is seen that the stiffness of the non-glass reinforced compounds
decreases significantly more than the glass filled composites. Over this temperature range the
storage modulus of the 22Hsp and 41H materials decreases by 3.8x and 4.3x respectively. For
the glass filled compounds R530, 70-41H, and 30-41H the decrease in storage modulus is only
1.5x, 1.8x, and 2x respectively. This suggests that the stiffness of the glass fiber is dominant at
high temperatures and as the glass fiber content increases, the more resistant to high
temperatures the material becomes. This phenomenon of resistance to high temperatures is also
dependent on the crystallinity of the material. At temperatures above the glass transition a more
crystalline material will exhibit better mechanical performance at high temperatures. When the
22Hsp and 41H materials are compared, this behaviour holds true, however, its effects are
dominated by the inclusion of glass fibers. This is evidenced by the R530 material which despite
having the second lowest degree of crystallinity exhibits the best resistance to temperature when
mechanical stiffness is concerned.

82
Figure 4.7: Storage modulus of PA66 materials tested with a frequency of 1Hz
Figure 4.8: Tan Delta of PA66 materials tested with a frequency of 1Hz
Figures 4.9, 4.10, 4.11, 4.12, 4.13 compare the storage and tan delta curves with increasing
frequency, 0.1, 1, and 5Hz for each PA66 material (22Hsp, 41H, R530, 30-41H, and 70-41H
respectively). With increasing frequency, the trend is for the storage modulus to increase as well.
Due to the viscoelastic, time dependent, properties of these materials when a constant strain is
applied the stress in the materials will decrease over time. It then follows that if the modulus is
measured over a longer period of time, or a low frequency, it will be lower than if measured over
0
500
1000
1500
2000
2500
3000
3500
4000
4500
5000
35 45 55 65 75 85 95
Sto
rage
Mo
du
lus
(MP
a)
Temperature C
22Hsp SM 41H SM R530 SM 30-41H SM 70-41H SM
0
0.05
0.1
0.15
0.2
0.25
35 45 55 65 75 85 95
Tan
Del
ta
Temperature (°C)
22Hsp TanD 41H TanD R530 TanD
30-41H TanD 70-41H TanD

83
a short period, or high frequency, due to this decrease in stress [22]. The glass transition
temperature (Tg) is a phenomenon associated with the amorphous regions of polymers [23], [24].
When cooled below their glass transition polymers behave as glassy and brittle structures due by
a restriction to the mobility of the polymer chains caused by a reduction in free volume [25],
[26]. Upon heating through the transition larger segments of the polymer chain are able to
reorient leading to more ductile and soft behaviour. Heating a polymer through the glass
transition corresponds to a dramatic decrease in mechanical stiffness, for dynamic mechanical
behaviour the Tg of the material is typically taken as the peak of the tan delta curve. For the three
PA66 materials the trend is for the Tg, or the tan delta peak temperature, to increase with
frequency. This is again due to the time dependent mature of the material as previously
discussed. At high frequencies, the molecular chains do not have sufficient time to reorient
before the next deformation cycle, therefore, a higher temperature, and more energy, is required
to initiate this reorientation. It has been reported that the inclusion of reinforcing fibers to a
polymeric matrix can both increase or decrease the glass transition temperature in the material
depending on the fiber type, and the strength of the fiber matrix bond [27]–[29]. It has been
theorized that if the fiber content is sufficiently high poor fiber wetting and adhesion can cause
an increase of segmental mobility in the polymer chain thus leading to a lower observed glass
transition in the material [28]. On the other hand, it has been demonstrated that when there
sufficiently good fiber wetting the glass transition will increase [29]. If the interface between the
fiber and the matrix is perfect, then there will be no voids in these sites which will in turn reduce
the mobility of the polymer chain thus increasing the glass transition temperature [29]. Another
consideration is the relative molecular weight of the matrix materials in question. The 41H
material has a higher molecular weight compared to the R530 material which accounts for
discrepancies to the thermal stability and crystallization of these materials. Based on the Flory-
Fox equation [30], it has been shown that an increase in molecular weight will subsequently lead
to higher observed glass transition temperatures. When the materials in this study are considered
both effects, of fiber reinforcement and molecular weight, must be taken into account and the
changes to the glass transition of the different materials is due to changes in molecular weight of
the polymer backbone as well as the addition of fillers.

84
Figure 4.9: Storage modulus and Tan Delta for 22Hsp material at 0.1, 1 and 5Hz
Figure 4.10: Storage modulus and Tan Delta for 41H material at 0.1, 1 and 5Hz
0
0.05
0.1
0.15
0.2
0.25
0
500
1000
1500
2000
2500
35 45 55 65 75 85 95
Tan
Del
ta
Sto
rage
Mo
du
lus
(MP
a)
Temperature (°C)
22Hsp 0.1Hz SM 22Hsp 1Hz SM 22Hsp 5Hz SM
22Hsp 0.1Hz TanD 22Hsp 1Hz TanD 22Hsp 5Hz TanD
0
0.05
0.1
0.15
0.2
0.25
0.3
0.35
0
200
400
600
800
1000
1200
1400
1600
1800
30 40 50 60 70 80 90
Tan
Del
ta
Sto
rage
Mo
du
lus
Temperature (°C)
41H 0.1Hz SM 41H 1Hz SM 41H 5Hz SM
41H 0.1Hz TanD 41H 1Hz TanD 41 5Hz TanD

85
Figure 4.11: Storage modulus and Tan Delta for R530 material at 0.1, 1 and 5Hz
Figure 4.12: Storage modulus and Tan Delta for 30-41H material at 0.1, 1 and 5Hz
0
0.01
0.02
0.03
0.04
0.05
0.06
0.07
0.08
0.09
0
1000
2000
3000
4000
5000
6000
35 45 55 65 75 85 95
Tan
Del
ta
Sto
rage
Mo
du
lus
Temperature (°C)
R530 0.1Hz SM R530 1Hz SM R530 5Hz SM
R530 0.1Hz TanD R530 1Hz TanD R530 5Hz TanD
0
0.02
0.04
0.06
0.08
0.1
0.12
0
500
1000
1500
2000
2500
3000
3500
35 45 55 65 75 85 95
Sto
rage
Mo
du
lus
(MP
a)
Temperature (°C)
30-41H 0.1Hz SM 30-41H 1Hz SM 30-41H 5Hz SM
30-41H 0.1Hz TanD 30-41H 1Hz TanD 30-41H 5Hz TanD

86
Figure 4.13: Storage modulus and Tan Delta for 70-41H material at 0.1, 1 and 5Hz
4.5 Conclusions
High performance polyamide 6,6 composites filled with reinforcing glass fibers and rubber
particles to promote high stiffness, strength, and toughness have been prepared by melt blending.
The hybrid composites were tested for their thermal stability by TGA, melting and crystallization
behaviour by DSC, mechanical properties in tension, and their dynamic mechanical properties,
storage modulus and loss factor by DMA. The results of the hybrid composites were then
compared to a pure PA66, a highly impact modified material containing rubber particles, and a
glass fiber reinforced grade of PA66. It was found that the addition of glass fibers to the matrix
resulted in a significant increase in mechanical properties, for the 30wt% glass filled grade a
154% improvement in tensile modulus and a 124% increase in yield stress was found over the
pure PA66. Additionally, through DMA it was determined that the reinforced materials showed a
much better resistance to high temperatures. The mechanical properties of the hybrid materials
are dominated by the influence of the glass fibers. While the rubber particles in the 41H material
clearly act as plasticizing agents for the fiber reinforced compounds their effect are less
noticeable in these experiments. In the tests performed in this study the properties are dominated
by the glass fibers even at 10wt% loading.
0
0.02
0.04
0.06
0.08
0.1
0.12
0.14
0.16
0
500
1000
1500
2000
2500
35 45 55 65 75 85 95
Sto
rage
Mo
du
lus
(MP
a)
Temperature (°C)
70-41H 0.1Hz SM 70-41H 1Hz SM 70-41H 5Hz SM
70-41H 0.1Hz TanD 70-41H 1Hz TanD 70-41H 5Hz TanD

87
4.6 Acknowledgements
The authors would like to acknowledge the following agencies for financial support: Natural
Sciences and Engineering Research Council of Canada (NSERC), and the Ontario Centres of
Excellence (OCE).
88
4.7 References
[1] Z. Mouti, K. Westwood, D. Long, and J. Njuguna, “An experimental investigation into
localised low-velocity impact loading on glass fibre-reinforced polyamide automotive
product,” Compos. Struct., vol. 104, pp. 43–53, 2013.
[2] F.-C. Chiu and G.-F. Kao, “Polyamide 46/multi-walled carbon nanotube nanocomposites
with enhanced thermal, electrical, and mechanical properties,” Compos. Part A Appl. Sci.
Manuf., vol. 43, no. 1, pp. 208–218, 2012.
[3] Q. Meng, Y. Gu, L. Luo, S. Wang, M. Li, and Z. Zhang, “Annealing effect on crystalline
structure and mechanical properties in long glass fiber reinforced polyamide 66,” J. Appl.
Polym. Sci., vol. 134, no. 23, pp. 1–10, 2017.
[4] B. F. Xu et al., “Mechanical properties, morphology and thermal conductivity of
polyamide composites filled with graphene nanoplatelets, Al2O3 and graphite,” Mater.
Res. Innov., vol. 19, no. sup1, pp. S1--388, 2015.
[5] Y. Zhang, J. H. Yang, T. S. Ellis, and J. Shi, “Crystal structures and their effects on the
properties of polyamide 12/clay and polyamide 6-polyamide 66/clay nanocomposites,” J.
Appl. Polym. Sci., vol. 100, no. 6, pp. 4782–4794, 2006.
[6] M. Kurokawa, Y. Uchiyama, T. Iwai, and S. Nagai, “Performance of plastic gear made of
carbon fiber reinforced polyamide 12,” Wear, vol. 254, no. 5–6, pp. 468–473, 2003.
[7] S. Kumar, S. N. Maiti, and B. K. Satapathy, “Super-toughening polyamide-612 by
controlling dispersed phase domain size: Essential work of fracture assessment,” Mater.
Des., vol. 62, pp. 382–391, 2014.
[8] A. Launay, Y. Marco, M. H. Maitournam, I. Raoult, and F. Szmytka, “Cyclic behavior of
short glass fiber reinforced polyamide for fatigue life prediction of automotive
components,” Procedia Eng., vol. 2, no. 1, pp. 901–910, 2010.
[9] E. Belmonte, M. De Monte, C.-J. Hoffmann, and M. Quaresimin, “Damage mechanisms
in a short glass fiber reinforced polyamide under fatigue loading,” Int. J. Fatigue, vol. 94,
pp. 145–157, 2017.

89
[10] D. X. Li, Y. L. You, X. Deng, W. J. Li, and Y. Xie, “Tribological properties of solid
lubricants filled glass fiber reinforced polyamide 6 composites,” Mater. Des., vol. 46, pp.
809–815, 2013.
[11] J. Chaichanawong, C. Thongchuea, and S. Areerat, “Effect of moisture on the mechanical
properties of glass fiber reinforced polyamide composites,” Adv. Powder Technol., vol.
27, no. 3, pp. 898–902, 2016.
[12] A. N. Khan and B. A. Ahmed, “Comparative study of Polyamide 6 reinforced with glass
fibre and montmorillonite,” Polym. Bull., vol. 72, no. 5, pp. 1207–1216, 2015.
[13] D. M. Laura, H. Keskkula, J. W. Barlow, and D. R. Paul, “Effect of glass fiber surface
chemistry on the mechanical properties of glass fiber reinforced, rubber-toughened nylon
6,” Polymer (Guildf)., vol. 43, no. 17, pp. 4673–4687, 2002.
[14] K. Yang, C. Xin, Y. Huang, L. Jiang, and Y. He, “Effects of extensional flow on
properties of polyamide-66/poly (2, 6-dimethyl-1, 4-phenylene oxide) blends: A study of
morphology, mechanical properties, and rheology,” Polym. Eng. Sci., 2016.
[15] H. Hunke et al., “Plasma modified Polytetrafluoroethylene (PTFE) lubrication of α-olefin-
copolymer impact-modified Polyamide 66,” Wear, vol. 338–339, pp. 122–132, 2015.
[16] B. V. Kokta, J. L. Valade, and W. N. Martin, “Dynamic thermogravimetric analysis of
polystyrene: Effect of molecular weight on thermal decomposition,” J. Appl. Polym. Sci.,
vol. 17, no. 1, pp. 1–19, 1973.
[17] R. L. Blaine, “Thermal Applications Note, Polymer Heats of Fusion, TA Instruments.”
[18] R. A. Chivers and D. R. Moore, “The effect of molecular weight and crystallinity on the
mechanical properties of injection moulded poly(aryl-ether-ether-ketone) resin,” Polymer
(Guildf)., vol. 35, no. 1, pp. 110–116, 1994.
[19] A. Zen et al., “Effect of molecular weight on the structure and crystallinity of poly(3-
hexylthiophene),” Macromolecules, vol. 39, no. 6, pp. 2162–2171, 2006.
[20] C. L. Wei, M. Chen, and F. E. Yu, “Temperature modulated DSC and DSC studies on the
90
origin of double melting peaks in poly(ether ether ketone),” Polymer (Guildf)., vol. 44, no.
26, pp. 8185–8193, 2003.
[21] P. Cebe and S. Chung, “Melting behavior of high performance composite matrix
polymers: Poly(phenylene sulfide),” Polym. Compos., vol. 11, no. 5, pp. 265–273, 1990.
[22] A. Pearson and H. E. Naguib, “Novel polyurethane elastomeric composites reinforced
with alumina, aramid, and poly(p-phenylene-2,6-benzobisoxazole) short fibers,
development and characterization of the thermal and dynamic mechanical properties,”
Compos. Part B Eng., vol. 122, 2017.
[23] J. H. Gibbs and E. A. DiMarzio, “Nature of the Glass Transition and the Glassy State,” J.
Chem. Phys., vol. 28, no. 3, pp. 373–383, 1958.
[24] G. Biroli and J. P. Garrahan, “Perspective: The glass transition,” J. Chem. Phys., vol. 138,
no. 12, p. 12A301, 2013.
[25] D. Turnbull and M. H. Cohen, “Free‐Volume Model of the Amorphous Phase: Glass
Transition,” J. Chem. Phys., vol. 34, no. 1, pp. 120–125, 1961.
[26] C. A. Angell, K. L. Ngai, G. B. McKenna, P. F. McMillan, and S. W. Martin, “Relaxation
in glassforming liquids and amorphous solids,” J. Appl. Phys., vol. 88, no. 6, pp. 3113–
3157, 2000.
[27] M. A. S. Anwer, H. E. Naguib, A. Celzard, and V. Fierro, “Comparison of the thermal,
dynamic mechanical and morphological properties of PLA-Lignin & PLA-Tannin
particulate green composites,” Compos. Part B Eng., vol. 82, pp. 92–99, 2015.
[28] N. A. Rahman, A. Hassan, R. Yahya, and R. A. Lafia-Araga, “Impact properties of glass-
fiber/polypropylene composites: The influence of fiber loading, specimen geometry and
test temperature,” Fibers Polym., vol. 14, no. 11, pp. 1877–1885, 2013.
[29] L. Rebenfeld, G. P. Desio, and J. C. Wu, “Effects of fibers on the glass transition
temperature of polyphenylene sulfide composites,” J. Appl. Polym. Sci., vol. 42, no. 3, pp.
801–805, 1991.

91
[30] T. G. Fox and P. J. Flory, “Second-order transition temperatures and related properties of
polystyrene. I. Influence of molecular weight,” J. Appl. Phys., vol. 21, no. 6, pp. 581–591,
1950.

92
Chapter 5
Conclusions and Future Work
5.1 Concluding Remarks
In summary, this work aimed at expanding the functionality of polymers by the development of
novel fiber reinforced composites. Furthermore, the focus was primarily on the effect of the
various reinforcing fibers on the viscoelastic properties of these materials and further analysis
considered the thermal performance of the new composites. Where applicable, the constant strain
rate mechanical properties and thermal expansion of the composites was studied. In an effort to
gain insight into many types of polymeric materials a wide variety of matrices were used from
thermosetting rubbers to strong and stiff thermoplastics. Additionally, a diverse range of
reinforcing fibers were analyzed from carbon fiber to liquid crystal aramid and poly(p-
phenylene-2,6-benzobisoxazole) (PBO) fibers to ceramic glass and alumina fibers.
Firstly, a polyurethane thermosetting rubber matrix was reinforced with Kevlar, PBO, and
alumina reinforcing fibers. Here, a simple process was used to incorporate the fibers into the
matrix through use of a high shear mixing process which should be easily scalable to an
industrial scale. Secondly, polyester based thermoplastic elastomer and flexible thermoplastic
(TPC-ET) was studied in chapter three, increasing the material stiffness over the first study.
Original composites consisting of these matrices reinforced with carbon and PBO fibers were
developed and analysed. Thirdly, high performance polyamides and polyamide composites were
studied. Hybrid polyamide 6,6 composites were created with glass fiber and rubber particles to
promote high strength, stiffness, and toughness.
When considering the viscoelastic properties, an increase in storage modulus was found with the
inclusion of reinforcing fibers and this was also coupled with a decrease in damping capacity, tan
delta, for the materials. Additionally, the frequency effects revealed that the observed storage
modulus of the composite materials increases with frequency. The study of glass transition
behavior under a temperature ramp experiment was also key in chapters three and four. While an
increase in glass transition temperature (Tg) was found for the carbon and PBO reinforced TPC-
ET materials, for the glass reinforced polyamide, in chapter four, the reverse was found.

93
Furthermore, all composite materials demonstrated better performance throughout the
temperature ranges tested signifying the suitability of fiber reinforced plastics for more
demanding applications.
The properties of the composite materials not only depended on the base properties of the matrix
and fiber but also the nature of the fiber-matrix interface. In chapter two, with the polyurethane
composites, it was found that Kevlar fibers had much better interfacial properties with the
polyurethane matrix than the PBO fibers. In turn this was found to dramatically affect the
materials resistance to increasing strain with the Kevlar composites performing much better.
Similar conclusions were made when the matrix changed to TPC-ET materials. Here, the carbon
fibers performed better than PBO at low strain conditions, but at high stress/strains the carbon
fiber was outperformed due to the manufacturing process which cause more breakage resulting
in a shorter length of the carbon fibers.
5.2 Future Work
There are multiple aspects of future work which can be undertaken to expand the scope of this
work.
First would be the investigation into the interfacial properties of the fiber and matrix and
research into additives which promote better fiber matrix coupling. It has been shown in this
work that the strength of the fiber-matrix bond is extremely important to not just the mechanical
stiffness, but also the materials performance at high stress and temperature. The nature of this
interface also impacts other behaviour such as crystallinity and glass transition. While in this
work the interface behaviour was studied with SEM imaging, this only provides a qualitative
description of the nature of the fiber-matrix bond. It would be beneficial to research, and also
industrial applications, to quantitatively characterize the nature of the fiber-matrix bond.
Secondly is the study of the crystallinity of the thermoplastic composites. A brief study into the
crystallinity of these materials was done in the work of this thesis, however a full parametric
study into the crystallization and melting kinetics would be beneficial. The crystallization of
thermoplastic materials greatly affects the mechanical properties of the materials, from stiffness
to toughness and also their performance at high temperatures. The crystallinity of a material is
greatly affected by the thermal history and the manufacturing process. Therefore, a study of the

94
isothermal and non-isothermal crystallization kinetics by use of X-ray diffraction would be
beneficial.
Thirdly is to develop a multi-scale material model for these composites. Modelling of these
materials is important to enable engineers to adapt them to industrial applications. Particularly of
importance would be the modelling of the viscoelastic behaviour of these materials which have
traditionally been tough to model. This is especially true when considering their long-term creep
behaviour.