dynamic model of kaplan turbine regulating system suitable for
TRANSCRIPT
Research ArticleDynamic Model of Kaplan Turbine Regulating System Suitablefor Power System Analysis
Jie Zhao Li Wang Dichen Liu Jun Wang Yu Zhao Tian Liu and Haoyu Wang
School of Electrical Engineering Wuhan University Wuhan Hubei 430072 China
Correspondence should be addressed to Li Wang 2009302540275whueducn
Received 19 August 2015 Revised 17 October 2015 Accepted 18 October 2015
Academic Editor Filippo Ubertini
Copyright copy 2015 Jie Zhao et alThis is an open access article distributed under the Creative Commons Attribution License whichpermits unrestricted use distribution and reproduction in any medium provided the original work is properly cited
Accurate modeling of Kaplan turbine regulating system is of great significance for grid security and stability analysis In this paperKaplan turbine regulating systemmodel is divided into the governor systemmodel the blade control systemmodel and the turbineand water diversion system model The Kaplan turbine has its particularity and the on-cam relationship between the wicket gateopening and the runner blade angle under a certain water head on the whole range was obtained by high-order curve fittingmethod Progressively the linearized Kaplan turbine model improved ideal Kaplan turbine model and nonlinear Kaplan turbinemodel were developed The nonlinear Kaplan turbine model considered the correction function of the blade angle on the turbinepower thereby improving the model simulation accuracy The model parameters were calculated or obtained by the improvedparticle swarm optimization (IPSO) algorithm For the blade control system model the default blade servomotor time constantgiven by value of one simplified the modeling and experimental work Further studies combined with measured test data verifiedthe established model accuracy and laid a foundation for further research into the influence of Kaplan turbine connecting to thegrid
1 Introduction
Hydraulic turbine generator units are increasingly beingrelied upon to meet a variety of control requirements as thesize and complexity of interconnected systems increase Toestablish models reflecting the actual characteristics of theprime mover and its governor is an important foundationwork for the accuracy of power grid security and stabilityanalysis [1 2] It is necessary to adjust both the wicketgate opening and the runner blade angle under differentwater head by the governor to keep efficient operation ofa Kaplan turbine which is one of the common forms ofturbines in hydropower systems [3 4] There is an urgentneed to establish Kaplan turbine regulating system dynamicmodel suitable for power system analysis based on measuredexperimental data to obtain the parameters [5]
There have been many studies on the modeling andverification of Francis turbine [6ndash10] The common Francisturbine model contains the single regulator system modelthe wicket gate control system model and the turbine and
water diversion system model The ideal turbine model orlinearized turbine model reflects the basic characteristics ofthe prime mover but the ideal turbine model reflects unitfeatures at rated operating point and the linearized turbinemodel is suitable for small power fluctuations [8 9]
The operation of Kaplan turbine involves control of thewicket gates and the runner blades position to regulatethe water flow into the turbine [2 11] Due to the on-camrelationship between the wicket gate opening and the runnerblade angle the impact of blade angle on Kaplan turbinetransient simulation accuracy should not be ignored [12 13]The linear fitting [14] polynomial interpolation and fitting[15] or intelligent algorithm [16] was used to obtain theon-cam relationship expression However the linear fittingobtained via limited points [14] to an extent may fail toreflect the function completely Different Kaplan turbine andwater diversion system models based on different functionsof wicket gate opening multiplied by function of bladeangle as inputs of nonlinear turbine model were compared[17] The parameter identification of a turbine and water
Hindawi Publishing CorporationMathematical Problems in EngineeringVolume 2015 Article ID 294523 12 pageshttpdxdoiorg1011552015294523
2 Mathematical Problems in Engineering
diversion system model may become difficult with high-order fitting function of the wicket gate opening or the bladeangle As a result the applicability of the established modeldeclines
The Kaplan turbine regulating system model containsthe mathematical models of the governor the dual-regulatedvane control system and blade control system and theturbine and water diversion system In this paper the Kaplanturbine regulating system dynamic model and parameterswere optimized suitable for power system analysis experi-mental measurement and precision requirements The maincontribution lies in the blade control system model simpli-fication the on-cam relationship obtainment the derivedfive-parameter linearized Kaplan turbine model parameterobtainment method and different Kaplan turbine regulat-ing system dynamic models comparison in gird connectedsystem The structure is organized as follows In Section 2the Kaplan turbine regulating system model is presentedSection 3 contains the development of three kinds of Kaplanturbine and water diversion systemmodel (ie the linearizedKaplan turbinemodel the improved ideal turbinemodel andthe nonlinear Kaplan turbine model) The established modelis verified by comparisonwith themeasured data in Section 4The results and discussion are presented in Section 4 as wellSection 5 presents the conclusions drawn thereof
2 Kaplan Turbine Regulating SystemMathematical Model
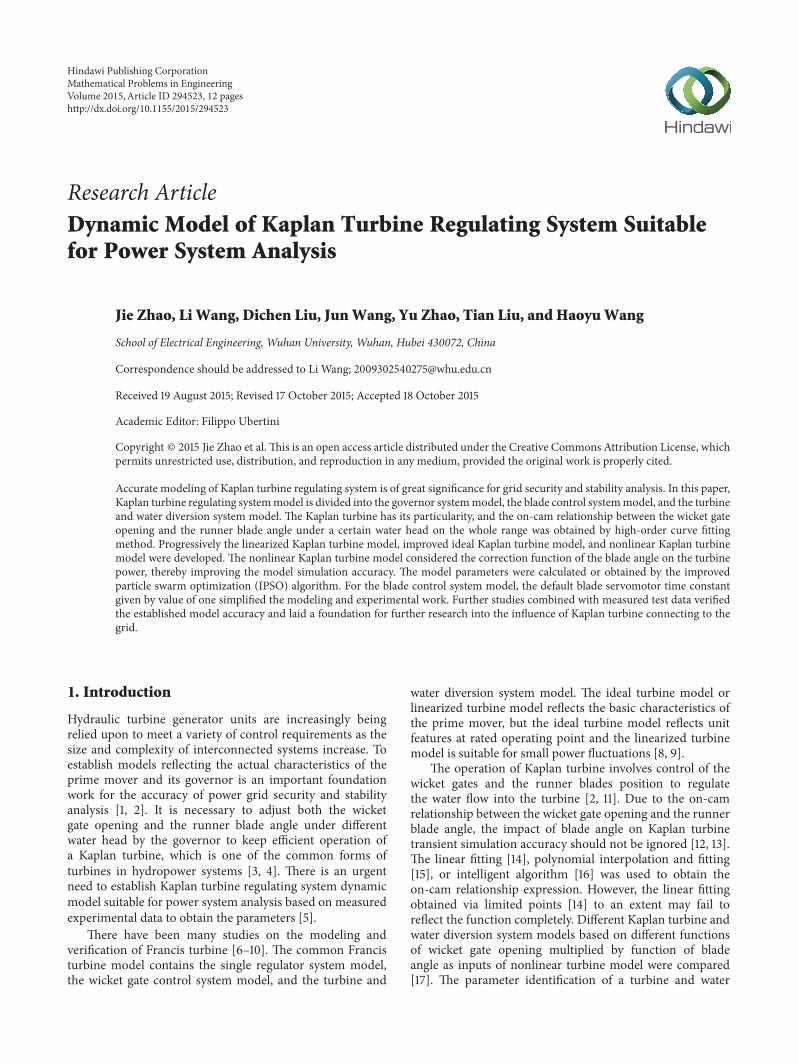
Figure 1 shows the frame diagram of hydroelectric powerwith double-regulated turbine [18] The vane control systemis based on the same principle of Francis turbineThe on-camrelationship presents the runner blade angle changes withthe wicket gate opening and the blade is kept in a certainbest angle fitting with the wicket gate opening to improve thepower generation efficiency
120596 and 120596ref are the unit frequency and given frequencyvalue respectively and 119875ref and 119875119890 are the given power andturbine load respectively 119910ref 119910 and 119910119903 are the given wicketgate opening the actual wicket gate opening and the bladeopening respectively The blade opening is transferred fromthe blade angle with the maximum value no more than one119902 is the turbine working flow ℎ is the turbine working headand 119875
119898is the mechanical power output
21 The Regulating System Model The Kaplan turbine gov-ernor system is consistent with that of the general Francisturbine Figure 2 shows the digital governor model AlsoFigure 3 shows the vane control system model consideringthe speed limit and the amplitude limit [18] 119870
119875 119870119868 and 119870
119863
are the proportional integral and differential coefficients ofthe governor respectively 119870
119904119901 119870119904119894 and 119870
119904119889are the propor-
tional integral and differential coefficients of the integratedamplifier module respectively 119890
119901is the power deviation
magnification 119879119910is the main servomotor time constant
VELopen and VELclose are the open and close servomotorspeed limits respectively 119910
119892MAX and 119910119892MIN are the limiting
values of the wicket gate opening
22 Blade Control System Model The principle of the bladecontrol system is similar to that of the vane control systemassuming that the on-cam relationship between the wicketgate opening and the runner blade angle is neglected [19]Theblade control valve adopts a proportional valve to handle theblade servomotor Figure 4 shows the blade control systemmodel under a certainwater head119879
119910119903is the blade servomotor
time constant VELopen1 and VELclose1 are the open and closeservomotor speed limits respectively 119910
119903MAX and 119910119903MIN are
the limiting values of the blade openingThe function between the blade opening the gate open-
ing and the water head is expressed as
119910119903= 119891 (119910119867) (1)
Under a certain water head the function of the wicketgate opening and the runner blade opening is given by
119910119903= 11988651199105
+ 11988641199104
+ 11988631199103
+ 11988621199102
+ 1198861119910 + 1198860 (2)
where 1198865 1198864 1198863 1198862 1198861 and 119886
0are the fitting coefficients
3 Kaplan Turbine and Water DiversionSystem Model
The linearized Kaplan turbine model improved ideal turbinemodel and nonlinear Kaplan turbine model were devel-oped The five-parameter linearized Kaplan turbine modelwas derived for parameters obtainment convenience Theimproved ideal turbine model and nonlinear turbine modelwere demonstrated based on the principle of the turbine thatthe blade opening affected the Kaplan turbine power like thelinearized turbine model did
31 Model One Linearized Kaplan Turbine Model The dy-namic characteristic of hydraulic turbine is associated withthe dynamic characteristic of the water flow in the pipeThe turbine characteristics in the vicinity of the operatingpoint are approximately linear Compared with the Francisturbine [9] the torque and water flow of Kaplan turbine canbe expressed as
119898119905= 119890119909119909 + 119890119910119910 + 119890119903119910119903+ 119890ℎℎ
119902 = 119890119902119909119909 + 119890119902119910119910 + 119890119902119903119910119903+ 119890119902ℎℎ
(3)
where 119890119909 119890119910 119890119903 and 119890
ℎare the transfer coefficients of turbine
torque to the rotational speed wicket gate opening bladeopening and water head respectively 119890
119902119909 119890119902119910 119890119902119903 and 119890
119902ℎ
are the transfer coefficients of the water flow to the rotationalspeed wicket gate opening blade opening and water headrespectively
For the turbine water diversion system considering thewall elasticity of water flow and water diversion system andignoring the friction between them the mathematical modelof water diversion system can be obtained as [6]
119866ℎ(119904) =
2119879119908
119879119903
1 minus 119890119879119903119904
1 + 119890119879119903119904 (4)
Mathematical Problems in Engineering 3
Governor Turbine
Water diversion system
Vane control system
On-cam relationship
Blade control system
y
Regulating system120596
120596ref
Pe
Pref or yref
ypid
h q
yrPm
Figure 1 Kaplan turbine regulating system frame diagram
++
+
+
minus
minus
+
++
120596
120596ref
Pe
eP
Pref or yref
ypid
KP
KDs
T1Vs + 1
KIs
Figure 2 Kaplan turbine governor model
+
_
++
+
ypid
Ksp
Ksds
Ksis
1Ty
VELopen
VELclose
yMAX
yMIN
1
s
y
LVDT1
1 + T2s
Figure 3 Kaplan turbine vane control system model
_
+
On-cam relationship
y 1
1 + T2s1Tyr
VELopen1
VELclose1
yrMAX
yrMIN
1
s
yr
Figure 4 Blade control system model
where119879119908is the water inertia time constant and119879
119903is the water
hammer phase length
If the high level terms in the Taylor expression of (4) areignored then the transfer function of the simplified elasticmodel is given as
119866ℎ(119904) = minus
119879119908119904 (1 + (124) 119879
119903
2
1199042
)
1 + (18) 119879119903
2
1199042
(5)
Furthermore if the flexibility of the water flow and thewater diversion pipe is ignored the transfer function of therigid water hammer model is expressed as
119866ℎ(119904) = minus119879
119908119904 (6)
The speed influence on the turbine power in (3) isneglected due to the little unit speed change under the gridconnected condition Figure 5 shows the linearized Kaplanturbine model and its deformed five-parameter linearizedturbine model with rigid water hammer model while 119886 119887119888 119889 and 119891 are constants above zero
32 Model Two Improved Ideal Turbine Model Assume thatthe transfer coefficients in (3) and the turbine efficiency arecertain under various working conditions and the wicket gateopening varies linearly Ignoring the unit speed influence onturbine power the ideal turbine model of the Francis turbineat rated operating point is described as [8]
119866 (119904) =
1 minus 119879119908119904
1 + 05119879119908119904
(7)
4 Mathematical Problems in Engineering
++
++
++
+
y
yr
ey
eqy
eqr
er
eqh
Gh(s) ehq h
mt
(a)
+
+
y
yr
mt
a +minusbs
1 + fs
d +minuscs
1 + fs
(b)
Figure 5 Linearized Kaplan turbine model (a) Linearized Kaplan turbine model (b) Five-parameter linearized turbine model
minus
+y
yNL
At
1 minus Tws
1 + 05Tws
Pm
Figure 6 Improved ideal turbine model
Figure 6 shows the improved ideal turbine consideringthe effect of the wicket gate and the blade on Kaplan turbinepower 119910NL is the equivalent no-load opening 119860
119905is the pro-
portional coefficient The blade effect on the Kaplan turbinepower is reflected by the calculation of119860
119905and 119910NL which are
identified by an optimization algorithm in this paper
33 Model Three Nonlinear Kaplan Turbine Model For theFrancis turbine considering the relationship between theturbine flow wicket gate opening and the water head as avalve [19] the nonlinear turbine model is described by
119902 = 119910radicℎ
119875119898= 119896119901(119902 minus 119902
0) ℎ
119902 =
1
119866ℎ(119904)
(ℎ minus ℎ0)
(8)
where 119902 is the water flow in the diversion pipeline 119902 is thederivative of 119902 ℎ
0is the static head (its per unit value is 1)
and 1199020is no-load flow 119896
119901is proportional coefficient
The nonlinear Kaplan turbine model is established basedon the following four aspects
(a) Under the normal grid connected operation the unitspeed is generally in the vicinity of rated speed so the unitspeed impact on the turbine model is ignored
(b) The hydraulic turbine with the water diversion pipelength less than 800m can adopt the rigid water hammermodel to simulate the dynamic process of the water diversionpipe
(c) Consider the nonlinear relationship between thewicket gate opening and the turbine mechanical power
(d) The effect of the blade opening on the Kaplan turbineis viewed as increasing flow amount
The variable 119866 is introduced to represent the equivalentopening for the combined effect of the wicket gate openingand the blade opening given by
119866 = 119891 (119910) sdot 119891 (119910119903) (9)
where 119891(119910) and 119891(119910119903) are the function of 119910 and 119910
119903 respec-
tivelyDifferent to the Kaplan turbine and water diversion
system models based on concrete different functions of 119910and 119910119903[17] function119891(119910) is represented by cubic polynomial
fitting and function119891(119910119903) is represented by linear fitting given
by
119891 (119910) = 11988731199103
+ 11988721199102
+ 1198871119910 + 1198870
119891 (119910119903) = 119910119903sdot 119861flow + 1
(10)
where 1198873 1198872 1198871 and 119887
0are the fitting coefficients 119861flow is
the coefficient representing the blade angle impact on theturbine water flow Herein the effect of the blade openingon the turbine is considered as incremental flow referring tothe principle of Kaplan turbine and the parameters in (10)are easy to obtain for engineering application and modelvalidation which reflects the nonlinear characteristics andworking principle of Kaplan turbine
There is a time delay between the wicket gate movementand the consequent blade angle movement in the casestudied Figure 7 shows the nonlinear Kaplan turbine modelwith rigid water hammer model considering the above fouraspects combined with (8)ndash(10)
4 Results and Discussion
The testing of the Kaplan turbine regulating system model isbased on the Kaplan turbine at Tukahe hydropower plant inYunnan province of West ChinaThe hydropower station hasthree units with one unit capacity of 55MW normal reservoirstorage level of 368m and rated head of 25m
Different fitting functions of on-cam relationship werecompared based on the whole range measured under givenwicket gate opening disturbances while the gate-runnerrelationship was determined from the turbine characteristics(TC) data in [17] The blade control effect is mainly deter-mined by the on-cam relationship speed limits and blade
Mathematical Problems in Engineering 5
minus
minus+
+
+
+
1
y
yr
yg G
Bflow
(qG)2
h
h0
1
Tws
q
q0
Pm
ΠΠ
Figure 7 Kaplan turbine and water diversion system model
servomotor time constant of the blade control systemmodelThe default blade servomotor time constant given by valueof one simplified the modeling and experimental work TheKaplan turbine regulating system dynamic model and threedifferent turbine and water diversion system models werecompared for stability analysis in the grid connected powersystem
41 On-Cam Relationship Validation of Wicket Gate Openingand Blade Opening The fifth order polynomial fitting of theon-cam relationship between the wicket gate opening and theblade opening based on the measured data near the ratedwater head is expressed as
119910119903= 2436119910
5
minus 76291199104
+ 83921199103
minus 37771199102
+ 7187119910 minus 04525
(11)
The blade opening is set to a certain value near zero whenwicket gate opening is less than 40The best fitting functionis obtained through measured data depending on differentKaplan turbines or different working heads The relationshipbetween the wicket gate opening and the blade openingneeds to be revised with appropriate polynomial fitting atother working heads Figure 8(a) shows the simulated bladeopening of the blade control system model (see Figure 4)using the expression in (11) under given wicket gate openingdisturbances of whole range
As shown in Figure 8(a) when the wicket gate openingis less than 04 by per unit value the blade opening isapproximate to zero and the maximum blade opening isabout 09 by per unit value The piecewise linear fitting resultfits with the measured data when the wicket gate opening isless than 06 and has a difference as the wicket gate openingover 06 by per unit valueThe fifth order fitting shown in (11)is closest to the measured data which shows a better on-camrelationship than the other fitting methods Given the wicketgate opening disturbances the simulation result using fifthorder fitting is consistent with themeasured data in the wholeoperating range (see Figure 8(c)) and verifies the correctnessof the on-cam relationship function
42 Influence of Blade Servomotor Time Constant on the BladeControl System Model The influence of blade servomotortime constant on the blade control systemmodel was studiedFigure 9 shows the simulation results with different 119879
119910119903
valuesThe influence of different 119879
119910119903values on the simulation
results shows that the bigger 119879119910119903
is the slower adjusted rate
is (see Figure 9) and thus 119879119910119903
should be as small as possibleDue to the rate restrictions of VELopen1 and VELclose1 theresult difference is not obvious when 119879
119910119903is less than 1 s
In conclusion the blade servomotor time constant affectsthe adjustment of blade control system model and shouldbe set in a reasonable range of value 119879
119910119903in this case is 1 s
considering that it is difficult to be tested When 119879119910119903is about
1 s (ie the blade servomotor response time link is ignored)it has little effect on the simulation result but simplifies themodeling and experimental work
43 Turbine Regulating System Model Validation The im-proved particle swarm optimization (IPSO) algorithm (iethe inertia weight is linearly changed and the chaos methodis used to generate initial particle population) is applied toidentify the model parameters [20] The inertia weight isintroduced to revise the speed update equation to improvesearch ability in the global scope The chaos method is usedto generate good initial particle population
The error evaluation index to quantize the simulationagreement is defined as
120590 =
sum119873
119894=1(119884119894minus 119884119894)
2
119873
(12)
where 119884119894is 119894th measured value 119884
119894is 119894th simulation value and
119873 is the total number of sampling pointsFigure 10 shows the graphical representation of measured
behavior of power acquired at a certain head given in 2D and3D space 119910
119903changes with 119910 when the wicket gate opening
is over a certain value In addition the relationship betweenthe wicket gate opening and the turbine mechanical power isnonlinear
The speed limits and amplitude limits of the vane controlsystem and blade control system were calculated under largewicket gate opening disturbances while other parameterswere identified by the improved particle swarm optimiza-tion (IPSO) algorithm under small wicket gate openingdisturbances and the parameters were revised through gridconnected simulation comparison The maximum iterationstep of IPSO algorithm is 100 For the error function withthe extreme point of zero the tolerance of error is set to 10minus6The parameters generally range from slightly greater than 0 to100 to get global solution as much as possible Based on theturbine power disturbance test data and the unit frequencydisturbance test data Table 1 lists the cubic fitting relationbetween variables 119910
119892and 119910 (see Figure 7) the coefficient
representing blade angle impact on the turbine water flow
6 Mathematical Problems in Engineering
yr
(pu
)
02
04
06
08
1
10 03 04 05 06 07 08 0901 02y (pu)
Measured dataPiecewise linear fittingQuadratic curve fitting
Cubic curve fittingFifth order fitting
(a)
50 100 150 2000Time (s)
0203040506070809
1
y(p
u)
(b)
Measured resultSimulation result
50 100 150 2000Time (s)
yr
(pu
)
0010203040506070809
1
(c)
Figure 8 On-cam relationship contrast curves (a) On-cam relationship fitting curves (b) Measured gate opening (c) Simulation andmeasured blade opening
10 20 30 40 50 600Time (s)
02
025
03
035
04
yr
(pu
)
Tyr = 10 sTyr = 5 sTyr = 1 s
Tyr = 05 sTyr = 001 sTyr = 01 sMeasured
Figure 9 The influence of different 119879119910119903on the blade opening
and other parameters of the double regulating system modelidentified by the IPSO algorithm Figure 11 shows the Kaplanturbine regulating systemmodel simulation result using non-linear Kaplan turbine model for unit frequency disturbance
Table 1 The parameter list
Model Parameter Value
Vane controlsystem model
119870119904119901
35119879119910
28 sVELopen 015VELclose minus015
119910119892MAX 1119910119892MIN 0
Blade controlsystem model
119879119910119903
1 sVELopen 1 0020VELclose 1 minus0017
119910119903MAX 09119910119903MIN 0
Nonlinear Kaplanturbine model
119861flow 06119910119892= 0267119910
3
minus 1421199102
+ 2383119910 minus 05916
test with disturbance values of plusmn02Hz under a certain unitpower value
Mathematical Problems in Engineering 7
0010203040506070809
1Va
riabl
es (p
u)
0 01 02 03 04 05 06 07 08 09 1y (pu)
yrPm
(a)
0 10 20 30 40 50 60 70 80 90
01020304050607080901000
102030405060
yr ()y ()
Pm
(MW
)
(b)
Figure 10 Graphical representation of measured behavior of power acquired at a certain head (a) 2D space (b) 3D space
10 20 30 40 50 60 70 800Time (s)
4975498
4985499
499550
5005501
5015502
5025
Uni
t fre
quen
cy (H
z)
(a)
10 20 30 40 50 60 70 800Time (s)
Measured ySimulated y
Measured yrSimulated yr
02025
03035
04045
05055
06065
07Va
riabl
es (p
u)
(b)
MeasuredSimulated
10 20 30 40 50 60 70 800Time (s)
1618202224262830323436
Pm
(MW
)
(c)
Figure 11 Simulation and measured results of unit frequency disturbance test (a) Given unit frequency disturbance curve (b) Wicket gateopening and blade opening curves (c) Mechanical power curves
From the simulation results shown in Figure 11 the initialrecorded gate opening and blade opening are about 05 and02 by per unit respectively The blade opening changeslinearly under the speed limits effect in the model and theblade opening change is slower than the wicket gate opening
change which can be seen from Figure 8 and speed limitdifferences listed in Table 1 There is little difference at thefinal mechanical power value due to measured blade openingdifference when the unit frequency is recovered to 50HzThewicket gate opening response and the blade opening response
8 Mathematical Problems in Engineering
Pm
(pu
)
185 205055
06065
07
50 100 150 200 2500Time (s)
Measured resultModel one result
Model two resultModel three result
02
03
04
05
06
07
08
(a)
Pm
(pu
)
MeasuredSimulated
40 60 80 100 120 140 160 180 20020Time (s)
02
03
04
05
06
07
08
(b)
Figure 12 Turbine power output comparison (a) Turbine power rising disturbance test (b) Turbine power decreasing disturbance test
Table 2 The parameter list of Kaplan turbine model
Model Parameter
Model one
119886 = 23238
119887 = 17365
119888 = 26712
119889 = 05552
119891 = 23238
Model two119910NL = 03
119860119905= 16
119879119908= 18 s
Table 3 Simulation error comparison of power rising disturbance
Turbine model 120590
Model one 55229 times 10minus5
Model two 17459 times 10minus4
Model three 44294 times 10minus5
results agree with the measured curve indicating that theestablished vane and blade control model can effectivelyreflect the dynamic characteristics of Kaplan turbine
Table 2 shows the identified parameters of the Kaplanturbine and water diversion system model using model oneand model two
Figure 12 shows the comparison results of the turbinepower rising test using these three turbine models (iemodel one model two and model three) and decreasingdisturbance test using model three with the same Kaplanturbine regulating system mathematical model respectivelyAlso Table 3 lists the power rising disturbance simulationerrors of three models
The Kaplan turbine and water diversion system modelusingmodel one (ie the linearizedKaplan turbinemodel) toa certain extent does not accurately reflect the hydroturbinedynamic process when the power output is between 062 and072 by per unit value (see Figure 12) As shown in Table 3
model two failed to completely reflect dynamic change ofthe blade opening and its simulation result has a significantdifference with the measured curve The output of modelthree (ie the nonlinear Kaplan turbine model) is basicallythe same with the measured curve which is more accuratethan model two In summary model one and model threeapply dual input of the wicket gate opening and the bladeopeningThese twomodels regard the effect of blade openingon Kaplan turbine as increasing flow amount and as a resultinfluence the unit power output Through verification of thefrequency disturbance test and turbine power disturbancetest the nonlinear Kaplan turbine model can meet the needsof the Kaplan turbine dynamic simulation better
The generator rotor inertia time constant is obtained byload rejection test Figure 13 shows the measured curves andthe speed fitting result under load rejection of 25MW
The rotor motion equation is given by
Δ119879lowast
119872= 119879119895sdot 120572lowast
(13)
where 119879119895is the rotor inertia time constant 120572lowast and Δ119879lowast
119872are
the rotor acceleration and rotor mechanical torque change byper unit value respectively The calculated rotor inertia timeconstant from linear segment of the speed change between 1199051and 1199052 (see Figure 13(b)) is 53 s
44 Grid Connected Simulation Analysis of Kaplan TurbineThe Kaplan turbine regulating system model was establishedand the simulation was performed on the IEEE 39-bussystem [21] with three different kinds of Kaplan turbineand water diversion system models using model one modeltwo and model three in Section 3 and the same Kaplanturbine regulating system mathematical model in Section 2respectively The Kaplan turbine is connected to bus 18Figure 14 shows the revised 39-bus system diagram
The generator parameters of bus 40 herein are as follows119883119889= 1217 119883
119889= 0600 1198831015840
119889= 0349 1198831015840
119902= 0600 11988310158401015840
119889=
0250 and11988310158401015840119902= 0250 and the rotor inertia time constant of
Mathematical Problems in Engineering 9
t1 t2
minus04
minus02
002040608
112
Varia
bles
(pu
)
5 10 15 20 25 300Time (s)
120596
y
yrPm
(a)
120596 = 00760t minus 03043
1101102103104105106107108109
11
120596(p
u)
172 174 176 178 18 182 18417Time (s)
(b)
Figure 13 Load rejection test (a) Measured variables curves (b) Linear segment of the speed change and the fitting curve
Kaplan turbine
1
2
3
4
5
6
7
8
9
10
11
12
13
14
15
16
1718
19
20
21 22
23
24
25 26
27
28 2930
31
32
3334
35
36
37
38
39
40
G39
G38
G37
G36
G35
G34 G33
G32
G30
G31
G40
Figure 14 Revised 39-bus system diagram
the generator is 6 s while the other parameters in the systemare not modified
Assume that there is a three-phase short-circuit fault onlines 17-18 near bus 18 at 1 s and lines 17-18 are disconnectedat 11 s Figure 15 shows the simulation results
As shown in Figure 15 the terminal voltage of Kaplanturbine is rapidly reduced to around zero when a three-phase
short-circuit fault occurs Each observation returns to thesteady-state value after removing the fault line besides thereactive power with value of a little increase The terminalvoltage changes with the three kinds of the turbine regulatingsystem dynamic model (ie the Kaplan turbine and waterdiversion system model using model one model two andmodel three) are basically the same Under the initial turbine
10 Mathematical Problems in Engineering
Model oneModel twoModel three
0996
0998
1
1002
1004
1006
1008120596
(pu
)
1 2 3 4 5 6 7 80Time (s)
(a)
Model oneModel twoModel three
0010203040506070809
Activ
e pow
er (p
u)
1 2 3 4 5 6 7 80Time (s)
(b)
Model oneModel twoModel three
036038
04042044046048
05052054
Mec
hani
cal p
ower
(pu
)
1 2 3 4 5 6 7 80Time (s)
(c)
Model oneModel twoModel three
1 2 3 4 5 6 7 80Time (s)
0
02
04
06
08
1
Term
inal
vol
tage
(pu
)
(d)
Model oneModel twoModel three
0
05
1
15
2
25
Term
inal
curr
ent (
pu
)
1 2 3 4 5 6 7 80Time (s)
(e)
minus05
minus04
minus03
minus02
minus01
0010203
Reac
tive p
ower
(pu
)
Model oneModel twoModel three
1 2 3 4 5 6 7 80time (s)
(f)
Figure 15 Power grid fault simulation results (a) Unit speed curves (b) Active power curves (c) Mechanical power curves (d) Terminalvoltage curves (e) Terminal current curves (f) Reactive power curves
mechanical power output of 045 (ie the mechanical poweris 27MW) the angle speed and the mechanical power fluctu-ations of model two are larger than those of model one andmodel three with themaximumdeviation being about 03HzThe maximum mechanical power fluctuation value of modeltwo is about 008 by per unit value (the reference capacity of
100MVA) In addition to different turbine and water diver-sion system models the governor parameters (the governorconverts the frequency deviation to wicket gate opening) alsoinfluence the amount of mechanical power adjustment
The adjustment of nonlinear turbinemodel was finer thanthat of the improved ideal turbine model since the latter was
Mathematical Problems in Engineering 11
derived based on the linearized model near the rated condi-tion and its transfer function was simple From the turbineoperating characteristics the coefficients in (3) may changesignificantly with turbine running in other conditions thusthe original parameters may cause a large amount of powerfluctuation
5 Conclusion
Kaplan turbine model in this paper is divided into thegovernor system model the blade control system model andthe turbine and water diversion system model The detaileddual-regulated vane control system model and blade controlsystemmodel were developedThe comparison of simulationand measured results showed the reasonableness and effec-tiveness of the established model and parameters The on-cam relationship between the wicket gate opening and theblade opening and the influence of the blade servomotor timeconstant on the blade control systemmodel were studiedTheblade opening was transferred from the blade angle and thefifth order polynomial fitting function could characterize theon-cam relationship with amplitude limits set of the bladeopening in this study The blade servomotor time constantshould be set in a reasonable range of value but it was difficultto be tested In this study 119879
119910119903was 1 s and thus the blade
servomotor response time link could be ignored Howeverit had a little effect on the simulation result and simplified themodeling and the experimental work
Progressively the linearized Kaplan turbine modelimproved ideal turbine model and nonlinear Kaplan turbinemodel are developed The nonlinear Kaplan turbine model isproposed which reflects the effects of the wicket gate openingand the blade opening changes on the turbine mechanicalpower (ie it regards the effect of blade opening on Kaplanturbine as increasing flow amount) and has a high accuracythrough the comparison of the simulation and the measuredresults The power disturbance test and the frequencydisturbance test confirmed that the established governormodel the dual-regulated vane and blade control systemmodel and the nonlinear Kaplan turbine model reflected thedynamic response of the Kaplan turbine adequately whichcould be applied in the power system analysis
Conflict of Interests
The authors have declared that no conflict of interests exists
Acknowledgment
This work was financially supported by the National NaturalScience Foundation of China (51307123)
References
[1] S Patterson ldquoImportance of hydro generation response result-ing from the new thermal modeling and required hydro mod-eling improvementsrdquo inProceedings of the IEEE Power Engineer-ing Society General Meeting vol 2 pp 1779ndash1783 Denver ColoUSA June 2004
[2] D M Dobrijevic and M V Jankovic ldquoAn improved method ofdamping of generator oscillationsrdquo IEEETransactions on EnergyConversion vol 14 no 4 pp 1624ndash1629 1999
[3] I Vojtko V Fecova M Kocisko and J Novak-Marcincin ldquoPro-posal of construction and analysis of turbine bladesrdquo inProceed-ings of the 4th IEEE International Symposium on Logistics andIndustrial Informatics (LINDI rsquo12) pp 75ndash80 IEEE SmoleniceSlovakia September 2012
[4] D Jost A Skerlavaj and A Lipej ldquoImprovement of efficiencyprediction for a Kaplan turbine with advanced turbulencemodelsrdquo Journal of Mechanical Engineering vol 60 no 2 pp124ndash134 2014
[5] E Malenovsky and F Pochyly ldquoDynamic analysis of kaplanturbine caused by short circuitrdquo in Proceedings of the 14th Inter-national Symposium on Transport Phenomena and Dynamics ofRotating Machinery Honolulu Hawaii USA March 2012
[6] Y C Choo K M Muttaqi and M Negnevitsky ldquoModelling ofhydraulic turbine for dynamic studies and performance ana-lysisrdquo in Proceedings of the Australasian Universities Power Engi-neering Conference pp 1ndash6 December 2007
[7] L N Hannett J W Feltes and B Fardanesh ldquoField tests to val-idate hydro turbine-governor model structure and parametersrdquoIEEE Transactions on Power Systems vol 9 no 4 pp 1744ndash17511994
[8] WorkingGroup ldquoHydraulic turbine and turbine controlmodelsfor system dynamic studiesrdquo IEEE Transactions on PowerSystems vol 7 no 1 pp 167ndash179 1992
[9] D H Thorne and E F Hill ldquoField testing and simulation ofhydraulic turbine governor performancerdquo IEEE Transactions onPower Apparatus and Systems vol 93 no 4 pp 1183ndash1191 1974
[10] Q Lu W Hu J Li and J Zhou ldquoResearch on frequency simu-lation model and control strategy of hydropower islandsrdquo inProceedings of the International Conference on Advanced PowerSystem Automation and Protection (APAP rsquo11) vol 3 pp 1896ndash1901 IEEE Beijing China October 2011
[11] J L Aguero M C Beroqui and F Issouribehere ldquoGrid fre-quency control secondary frequency control tuning taking intoaccount distributed primary frequency controlrdquo in Proceedingsof the IEEE Power and Energy Society General Meeting pp 1ndash8IEEE Minneapolis Minn USA July 2010
[12] P Schniter and L Wozniak ldquoEfficiency based optimal controlof Kaplan hydrogeneratorsrdquo IEEE Transactions on Energy Con-version vol 10 no 2 pp 348ndash353 1995
[13] P Huvet ldquoInfluence of runner blade angle variations on Kaplanturbine transientsrdquo Houille Blanche vol 41 no 1 pp 137ndash1471986
[14] D N Kosterev ldquoHydro turbine-governor model validation inpacific northwestrdquo IEEE Transactions on Power Systems vol 19no 2 pp 1144ndash1149 2004
[15] M Brezovec I Kuzle and T Tomisa ldquoNonlinear digital simu-lation model of hydroelectric power unit with Kaplan turbinerdquoIEEE Transactions on Energy Conversion vol 21 no 1 pp 235ndash241 2006
[16] W Zhao andDWei ldquoRelevance vectormachine combinedwithglowworm swarm optimization for cam relationship of Kaplanturbinerdquo Advanced Science Letters vol 11 no 1 pp 244ndash2472012
[17] D Kranjcic and G Stumberger ldquoDifferential evolution-basedidentification of the nonlinear kaplan turbine modelrdquo IEEETransactions on Energy Conversion vol 29 no 1 pp 178ndash1872014
12 Mathematical Problems in Engineering
[18] M Djukanovic M Novicevic D Dobrijevic B Babic D JSobajic and Y-H Pao ldquoNeural-net based coordinated stabi-lizing control for the exciter and governor loops of low headhydropower plantsrdquo IEEE Transactions on Energy Conversionvol 10 no 4 pp 760ndash767 1995
[19] J Zhao L Wang D Liu and J Wang ldquoPiecewise model andparameter obtainment of governor actuator in turbinerdquo Journalof Applied Mathematics vol 2015 Article ID 709272 9 pages2015
[20] E De Jaeger N Janssens B Malfliet and F Van De Meule-broeke ldquoHydro turbine model for system dynamic studiesrdquoIEEE Transactions on Power Systems vol 9 no 4 pp 1709ndash17151994
[21] M D Amadou H Mehrjerdi S Lefebvre M Saad and DAsber ldquoArea voltage control analysis in transmission systemsbased on clustering techniquerdquo IET Generation TransmissionampDistribution vol 8 no 12 pp 2134ndash2143 2014
Submit your manuscripts athttpwwwhindawicom
Hindawi Publishing Corporationhttpwwwhindawicom Volume 2014
MathematicsJournal of
Hindawi Publishing Corporationhttpwwwhindawicom Volume 2014
Mathematical Problems in Engineering
Hindawi Publishing Corporationhttpwwwhindawicom
Differential EquationsInternational Journal of
Volume 2014
Applied MathematicsJournal of
Hindawi Publishing Corporationhttpwwwhindawicom Volume 2014
Probability and StatisticsHindawi Publishing Corporationhttpwwwhindawicom Volume 2014
Journal of
Hindawi Publishing Corporationhttpwwwhindawicom Volume 2014
Mathematical PhysicsAdvances in
Complex AnalysisJournal of
Hindawi Publishing Corporationhttpwwwhindawicom Volume 2014
OptimizationJournal of
Hindawi Publishing Corporationhttpwwwhindawicom Volume 2014
CombinatoricsHindawi Publishing Corporationhttpwwwhindawicom Volume 2014
International Journal of
Hindawi Publishing Corporationhttpwwwhindawicom Volume 2014
Operations ResearchAdvances in
Journal of
Hindawi Publishing Corporationhttpwwwhindawicom Volume 2014
Function Spaces
Abstract and Applied AnalysisHindawi Publishing Corporationhttpwwwhindawicom Volume 2014
International Journal of Mathematics and Mathematical Sciences
Hindawi Publishing Corporationhttpwwwhindawicom Volume 2014
The Scientific World JournalHindawi Publishing Corporation httpwwwhindawicom Volume 2014
Hindawi Publishing Corporationhttpwwwhindawicom Volume 2014
Algebra
Discrete Dynamics in Nature and Society
Hindawi Publishing Corporationhttpwwwhindawicom Volume 2014
Hindawi Publishing Corporationhttpwwwhindawicom Volume 2014
Decision SciencesAdvances in
Discrete MathematicsJournal of
Hindawi Publishing Corporationhttpwwwhindawicom
Volume 2014 Hindawi Publishing Corporationhttpwwwhindawicom Volume 2014
Stochastic AnalysisInternational Journal of

2 Mathematical Problems in Engineering
diversion system model may become difficult with high-order fitting function of the wicket gate opening or the bladeangle As a result the applicability of the established modeldeclines
The Kaplan turbine regulating system model containsthe mathematical models of the governor the dual-regulatedvane control system and blade control system and theturbine and water diversion system In this paper the Kaplanturbine regulating system dynamic model and parameterswere optimized suitable for power system analysis experi-mental measurement and precision requirements The maincontribution lies in the blade control system model simpli-fication the on-cam relationship obtainment the derivedfive-parameter linearized Kaplan turbine model parameterobtainment method and different Kaplan turbine regulat-ing system dynamic models comparison in gird connectedsystem The structure is organized as follows In Section 2the Kaplan turbine regulating system model is presentedSection 3 contains the development of three kinds of Kaplanturbine and water diversion systemmodel (ie the linearizedKaplan turbinemodel the improved ideal turbinemodel andthe nonlinear Kaplan turbine model) The established modelis verified by comparisonwith themeasured data in Section 4The results and discussion are presented in Section 4 as wellSection 5 presents the conclusions drawn thereof
2 Kaplan Turbine Regulating SystemMathematical Model
Figure 1 shows the frame diagram of hydroelectric powerwith double-regulated turbine [18] The vane control systemis based on the same principle of Francis turbineThe on-camrelationship presents the runner blade angle changes withthe wicket gate opening and the blade is kept in a certainbest angle fitting with the wicket gate opening to improve thepower generation efficiency
120596 and 120596ref are the unit frequency and given frequencyvalue respectively and 119875ref and 119875119890 are the given power andturbine load respectively 119910ref 119910 and 119910119903 are the given wicketgate opening the actual wicket gate opening and the bladeopening respectively The blade opening is transferred fromthe blade angle with the maximum value no more than one119902 is the turbine working flow ℎ is the turbine working headand 119875
119898is the mechanical power output
21 The Regulating System Model The Kaplan turbine gov-ernor system is consistent with that of the general Francisturbine Figure 2 shows the digital governor model AlsoFigure 3 shows the vane control system model consideringthe speed limit and the amplitude limit [18] 119870
119875 119870119868 and 119870
119863
are the proportional integral and differential coefficients ofthe governor respectively 119870
119904119901 119870119904119894 and 119870
119904119889are the propor-
tional integral and differential coefficients of the integratedamplifier module respectively 119890
119901is the power deviation
magnification 119879119910is the main servomotor time constant
VELopen and VELclose are the open and close servomotorspeed limits respectively 119910
119892MAX and 119910119892MIN are the limiting
values of the wicket gate opening
22 Blade Control System Model The principle of the bladecontrol system is similar to that of the vane control systemassuming that the on-cam relationship between the wicketgate opening and the runner blade angle is neglected [19]Theblade control valve adopts a proportional valve to handle theblade servomotor Figure 4 shows the blade control systemmodel under a certainwater head119879
119910119903is the blade servomotor
time constant VELopen1 and VELclose1 are the open and closeservomotor speed limits respectively 119910
119903MAX and 119910119903MIN are
the limiting values of the blade openingThe function between the blade opening the gate open-
ing and the water head is expressed as
119910119903= 119891 (119910119867) (1)
Under a certain water head the function of the wicketgate opening and the runner blade opening is given by
119910119903= 11988651199105
+ 11988641199104
+ 11988631199103
+ 11988621199102
+ 1198861119910 + 1198860 (2)
where 1198865 1198864 1198863 1198862 1198861 and 119886
0are the fitting coefficients
3 Kaplan Turbine and Water DiversionSystem Model
The linearized Kaplan turbine model improved ideal turbinemodel and nonlinear Kaplan turbine model were devel-oped The five-parameter linearized Kaplan turbine modelwas derived for parameters obtainment convenience Theimproved ideal turbine model and nonlinear turbine modelwere demonstrated based on the principle of the turbine thatthe blade opening affected the Kaplan turbine power like thelinearized turbine model did
31 Model One Linearized Kaplan Turbine Model The dy-namic characteristic of hydraulic turbine is associated withthe dynamic characteristic of the water flow in the pipeThe turbine characteristics in the vicinity of the operatingpoint are approximately linear Compared with the Francisturbine [9] the torque and water flow of Kaplan turbine canbe expressed as
119898119905= 119890119909119909 + 119890119910119910 + 119890119903119910119903+ 119890ℎℎ
119902 = 119890119902119909119909 + 119890119902119910119910 + 119890119902119903119910119903+ 119890119902ℎℎ
(3)
where 119890119909 119890119910 119890119903 and 119890
ℎare the transfer coefficients of turbine
torque to the rotational speed wicket gate opening bladeopening and water head respectively 119890
119902119909 119890119902119910 119890119902119903 and 119890
119902ℎ
are the transfer coefficients of the water flow to the rotationalspeed wicket gate opening blade opening and water headrespectively
For the turbine water diversion system considering thewall elasticity of water flow and water diversion system andignoring the friction between them the mathematical modelof water diversion system can be obtained as [6]
119866ℎ(119904) =
2119879119908
119879119903
1 minus 119890119879119903119904
1 + 119890119879119903119904 (4)
Mathematical Problems in Engineering 3
Governor Turbine
Water diversion system
Vane control system
On-cam relationship
Blade control system
y
Regulating system120596
120596ref
Pe
Pref or yref
ypid
h q
yrPm
Figure 1 Kaplan turbine regulating system frame diagram
++
+
+
minus
minus
+
++
120596
120596ref
Pe
eP
Pref or yref
ypid
KP
KDs
T1Vs + 1
KIs
Figure 2 Kaplan turbine governor model
+
_
++
+
ypid
Ksp
Ksds
Ksis
1Ty
VELopen
VELclose
yMAX
yMIN
1
s
y
LVDT1
1 + T2s
Figure 3 Kaplan turbine vane control system model
_
+
On-cam relationship
y 1
1 + T2s1Tyr
VELopen1
VELclose1
yrMAX
yrMIN
1
s
yr
Figure 4 Blade control system model
where119879119908is the water inertia time constant and119879
119903is the water
hammer phase length
If the high level terms in the Taylor expression of (4) areignored then the transfer function of the simplified elasticmodel is given as
119866ℎ(119904) = minus
119879119908119904 (1 + (124) 119879
119903
2
1199042
)
1 + (18) 119879119903
2
1199042
(5)
Furthermore if the flexibility of the water flow and thewater diversion pipe is ignored the transfer function of therigid water hammer model is expressed as
119866ℎ(119904) = minus119879
119908119904 (6)
The speed influence on the turbine power in (3) isneglected due to the little unit speed change under the gridconnected condition Figure 5 shows the linearized Kaplanturbine model and its deformed five-parameter linearizedturbine model with rigid water hammer model while 119886 119887119888 119889 and 119891 are constants above zero
32 Model Two Improved Ideal Turbine Model Assume thatthe transfer coefficients in (3) and the turbine efficiency arecertain under various working conditions and the wicket gateopening varies linearly Ignoring the unit speed influence onturbine power the ideal turbine model of the Francis turbineat rated operating point is described as [8]
119866 (119904) =
1 minus 119879119908119904
1 + 05119879119908119904
(7)
4 Mathematical Problems in Engineering
++
++
++
+
y
yr
ey
eqy
eqr
er
eqh
Gh(s) ehq h
mt
(a)
+
+
y
yr
mt
a +minusbs
1 + fs
d +minuscs
1 + fs
(b)
Figure 5 Linearized Kaplan turbine model (a) Linearized Kaplan turbine model (b) Five-parameter linearized turbine model
minus
+y
yNL
At
1 minus Tws
1 + 05Tws
Pm
Figure 6 Improved ideal turbine model
Figure 6 shows the improved ideal turbine consideringthe effect of the wicket gate and the blade on Kaplan turbinepower 119910NL is the equivalent no-load opening 119860
119905is the pro-
portional coefficient The blade effect on the Kaplan turbinepower is reflected by the calculation of119860
119905and 119910NL which are
identified by an optimization algorithm in this paper
33 Model Three Nonlinear Kaplan Turbine Model For theFrancis turbine considering the relationship between theturbine flow wicket gate opening and the water head as avalve [19] the nonlinear turbine model is described by
119902 = 119910radicℎ
119875119898= 119896119901(119902 minus 119902
0) ℎ
119902 =
1
119866ℎ(119904)
(ℎ minus ℎ0)
(8)
where 119902 is the water flow in the diversion pipeline 119902 is thederivative of 119902 ℎ
0is the static head (its per unit value is 1)
and 1199020is no-load flow 119896
119901is proportional coefficient
The nonlinear Kaplan turbine model is established basedon the following four aspects
(a) Under the normal grid connected operation the unitspeed is generally in the vicinity of rated speed so the unitspeed impact on the turbine model is ignored
(b) The hydraulic turbine with the water diversion pipelength less than 800m can adopt the rigid water hammermodel to simulate the dynamic process of the water diversionpipe
(c) Consider the nonlinear relationship between thewicket gate opening and the turbine mechanical power
(d) The effect of the blade opening on the Kaplan turbineis viewed as increasing flow amount
The variable 119866 is introduced to represent the equivalentopening for the combined effect of the wicket gate openingand the blade opening given by
119866 = 119891 (119910) sdot 119891 (119910119903) (9)
where 119891(119910) and 119891(119910119903) are the function of 119910 and 119910
119903 respec-
tivelyDifferent to the Kaplan turbine and water diversion
system models based on concrete different functions of 119910and 119910119903[17] function119891(119910) is represented by cubic polynomial
fitting and function119891(119910119903) is represented by linear fitting given
by
119891 (119910) = 11988731199103
+ 11988721199102
+ 1198871119910 + 1198870
119891 (119910119903) = 119910119903sdot 119861flow + 1
(10)
where 1198873 1198872 1198871 and 119887
0are the fitting coefficients 119861flow is
the coefficient representing the blade angle impact on theturbine water flow Herein the effect of the blade openingon the turbine is considered as incremental flow referring tothe principle of Kaplan turbine and the parameters in (10)are easy to obtain for engineering application and modelvalidation which reflects the nonlinear characteristics andworking principle of Kaplan turbine
There is a time delay between the wicket gate movementand the consequent blade angle movement in the casestudied Figure 7 shows the nonlinear Kaplan turbine modelwith rigid water hammer model considering the above fouraspects combined with (8)ndash(10)
4 Results and Discussion
The testing of the Kaplan turbine regulating system model isbased on the Kaplan turbine at Tukahe hydropower plant inYunnan province of West ChinaThe hydropower station hasthree units with one unit capacity of 55MW normal reservoirstorage level of 368m and rated head of 25m
Different fitting functions of on-cam relationship werecompared based on the whole range measured under givenwicket gate opening disturbances while the gate-runnerrelationship was determined from the turbine characteristics(TC) data in [17] The blade control effect is mainly deter-mined by the on-cam relationship speed limits and blade
Mathematical Problems in Engineering 5
minus
minus+
+
+
+
1
y
yr
yg G
Bflow
(qG)2
h
h0
1
Tws
q
q0
Pm
ΠΠ
Figure 7 Kaplan turbine and water diversion system model
servomotor time constant of the blade control systemmodelThe default blade servomotor time constant given by valueof one simplified the modeling and experimental work TheKaplan turbine regulating system dynamic model and threedifferent turbine and water diversion system models werecompared for stability analysis in the grid connected powersystem
41 On-Cam Relationship Validation of Wicket Gate Openingand Blade Opening The fifth order polynomial fitting of theon-cam relationship between the wicket gate opening and theblade opening based on the measured data near the ratedwater head is expressed as
119910119903= 2436119910
5
minus 76291199104
+ 83921199103
minus 37771199102
+ 7187119910 minus 04525
(11)
The blade opening is set to a certain value near zero whenwicket gate opening is less than 40The best fitting functionis obtained through measured data depending on differentKaplan turbines or different working heads The relationshipbetween the wicket gate opening and the blade openingneeds to be revised with appropriate polynomial fitting atother working heads Figure 8(a) shows the simulated bladeopening of the blade control system model (see Figure 4)using the expression in (11) under given wicket gate openingdisturbances of whole range
As shown in Figure 8(a) when the wicket gate openingis less than 04 by per unit value the blade opening isapproximate to zero and the maximum blade opening isabout 09 by per unit value The piecewise linear fitting resultfits with the measured data when the wicket gate opening isless than 06 and has a difference as the wicket gate openingover 06 by per unit valueThe fifth order fitting shown in (11)is closest to the measured data which shows a better on-camrelationship than the other fitting methods Given the wicketgate opening disturbances the simulation result using fifthorder fitting is consistent with themeasured data in the wholeoperating range (see Figure 8(c)) and verifies the correctnessof the on-cam relationship function
42 Influence of Blade Servomotor Time Constant on the BladeControl System Model The influence of blade servomotortime constant on the blade control systemmodel was studiedFigure 9 shows the simulation results with different 119879
119910119903
valuesThe influence of different 119879
119910119903values on the simulation
results shows that the bigger 119879119910119903
is the slower adjusted rate
is (see Figure 9) and thus 119879119910119903
should be as small as possibleDue to the rate restrictions of VELopen1 and VELclose1 theresult difference is not obvious when 119879
119910119903is less than 1 s
In conclusion the blade servomotor time constant affectsthe adjustment of blade control system model and shouldbe set in a reasonable range of value 119879
119910119903in this case is 1 s
considering that it is difficult to be tested When 119879119910119903is about
1 s (ie the blade servomotor response time link is ignored)it has little effect on the simulation result but simplifies themodeling and experimental work
43 Turbine Regulating System Model Validation The im-proved particle swarm optimization (IPSO) algorithm (iethe inertia weight is linearly changed and the chaos methodis used to generate initial particle population) is applied toidentify the model parameters [20] The inertia weight isintroduced to revise the speed update equation to improvesearch ability in the global scope The chaos method is usedto generate good initial particle population
The error evaluation index to quantize the simulationagreement is defined as
120590 =
sum119873
119894=1(119884119894minus 119884119894)
2
119873
(12)
where 119884119894is 119894th measured value 119884
119894is 119894th simulation value and
119873 is the total number of sampling pointsFigure 10 shows the graphical representation of measured
behavior of power acquired at a certain head given in 2D and3D space 119910
119903changes with 119910 when the wicket gate opening
is over a certain value In addition the relationship betweenthe wicket gate opening and the turbine mechanical power isnonlinear
The speed limits and amplitude limits of the vane controlsystem and blade control system were calculated under largewicket gate opening disturbances while other parameterswere identified by the improved particle swarm optimiza-tion (IPSO) algorithm under small wicket gate openingdisturbances and the parameters were revised through gridconnected simulation comparison The maximum iterationstep of IPSO algorithm is 100 For the error function withthe extreme point of zero the tolerance of error is set to 10minus6The parameters generally range from slightly greater than 0 to100 to get global solution as much as possible Based on theturbine power disturbance test data and the unit frequencydisturbance test data Table 1 lists the cubic fitting relationbetween variables 119910
119892and 119910 (see Figure 7) the coefficient
representing blade angle impact on the turbine water flow
6 Mathematical Problems in Engineering
yr
(pu
)
02
04
06
08
1
10 03 04 05 06 07 08 0901 02y (pu)
Measured dataPiecewise linear fittingQuadratic curve fitting
Cubic curve fittingFifth order fitting
(a)
50 100 150 2000Time (s)
0203040506070809
1
y(p
u)
(b)
Measured resultSimulation result
50 100 150 2000Time (s)
yr
(pu
)
0010203040506070809
1
(c)
Figure 8 On-cam relationship contrast curves (a) On-cam relationship fitting curves (b) Measured gate opening (c) Simulation andmeasured blade opening
10 20 30 40 50 600Time (s)
02
025
03
035
04
yr
(pu
)
Tyr = 10 sTyr = 5 sTyr = 1 s
Tyr = 05 sTyr = 001 sTyr = 01 sMeasured
Figure 9 The influence of different 119879119910119903on the blade opening
and other parameters of the double regulating system modelidentified by the IPSO algorithm Figure 11 shows the Kaplanturbine regulating systemmodel simulation result using non-linear Kaplan turbine model for unit frequency disturbance
Table 1 The parameter list
Model Parameter Value
Vane controlsystem model
119870119904119901
35119879119910
28 sVELopen 015VELclose minus015
119910119892MAX 1119910119892MIN 0
Blade controlsystem model
119879119910119903
1 sVELopen 1 0020VELclose 1 minus0017
119910119903MAX 09119910119903MIN 0
Nonlinear Kaplanturbine model
119861flow 06119910119892= 0267119910
3
minus 1421199102
+ 2383119910 minus 05916
test with disturbance values of plusmn02Hz under a certain unitpower value
Mathematical Problems in Engineering 7
0010203040506070809
1Va
riabl
es (p
u)
0 01 02 03 04 05 06 07 08 09 1y (pu)
yrPm
(a)
0 10 20 30 40 50 60 70 80 90
01020304050607080901000
102030405060
yr ()y ()
Pm
(MW
)
(b)
Figure 10 Graphical representation of measured behavior of power acquired at a certain head (a) 2D space (b) 3D space
10 20 30 40 50 60 70 800Time (s)
4975498
4985499
499550
5005501
5015502
5025
Uni
t fre
quen
cy (H
z)
(a)
10 20 30 40 50 60 70 800Time (s)
Measured ySimulated y
Measured yrSimulated yr
02025
03035
04045
05055
06065
07Va
riabl
es (p
u)
(b)
MeasuredSimulated
10 20 30 40 50 60 70 800Time (s)
1618202224262830323436
Pm
(MW
)
(c)
Figure 11 Simulation and measured results of unit frequency disturbance test (a) Given unit frequency disturbance curve (b) Wicket gateopening and blade opening curves (c) Mechanical power curves
From the simulation results shown in Figure 11 the initialrecorded gate opening and blade opening are about 05 and02 by per unit respectively The blade opening changeslinearly under the speed limits effect in the model and theblade opening change is slower than the wicket gate opening
change which can be seen from Figure 8 and speed limitdifferences listed in Table 1 There is little difference at thefinal mechanical power value due to measured blade openingdifference when the unit frequency is recovered to 50HzThewicket gate opening response and the blade opening response
8 Mathematical Problems in Engineering
Pm
(pu
)
185 205055
06065
07
50 100 150 200 2500Time (s)
Measured resultModel one result
Model two resultModel three result
02
03
04
05
06
07
08
(a)
Pm
(pu
)
MeasuredSimulated
40 60 80 100 120 140 160 180 20020Time (s)
02
03
04
05
06
07
08
(b)
Figure 12 Turbine power output comparison (a) Turbine power rising disturbance test (b) Turbine power decreasing disturbance test
Table 2 The parameter list of Kaplan turbine model
Model Parameter
Model one
119886 = 23238
119887 = 17365
119888 = 26712
119889 = 05552
119891 = 23238
Model two119910NL = 03
119860119905= 16
119879119908= 18 s
Table 3 Simulation error comparison of power rising disturbance
Turbine model 120590
Model one 55229 times 10minus5
Model two 17459 times 10minus4
Model three 44294 times 10minus5
results agree with the measured curve indicating that theestablished vane and blade control model can effectivelyreflect the dynamic characteristics of Kaplan turbine
Table 2 shows the identified parameters of the Kaplanturbine and water diversion system model using model oneand model two
Figure 12 shows the comparison results of the turbinepower rising test using these three turbine models (iemodel one model two and model three) and decreasingdisturbance test using model three with the same Kaplanturbine regulating system mathematical model respectivelyAlso Table 3 lists the power rising disturbance simulationerrors of three models
The Kaplan turbine and water diversion system modelusingmodel one (ie the linearizedKaplan turbinemodel) toa certain extent does not accurately reflect the hydroturbinedynamic process when the power output is between 062 and072 by per unit value (see Figure 12) As shown in Table 3
model two failed to completely reflect dynamic change ofthe blade opening and its simulation result has a significantdifference with the measured curve The output of modelthree (ie the nonlinear Kaplan turbine model) is basicallythe same with the measured curve which is more accuratethan model two In summary model one and model threeapply dual input of the wicket gate opening and the bladeopeningThese twomodels regard the effect of blade openingon Kaplan turbine as increasing flow amount and as a resultinfluence the unit power output Through verification of thefrequency disturbance test and turbine power disturbancetest the nonlinear Kaplan turbine model can meet the needsof the Kaplan turbine dynamic simulation better
The generator rotor inertia time constant is obtained byload rejection test Figure 13 shows the measured curves andthe speed fitting result under load rejection of 25MW
The rotor motion equation is given by
Δ119879lowast
119872= 119879119895sdot 120572lowast
(13)
where 119879119895is the rotor inertia time constant 120572lowast and Δ119879lowast
119872are
the rotor acceleration and rotor mechanical torque change byper unit value respectively The calculated rotor inertia timeconstant from linear segment of the speed change between 1199051and 1199052 (see Figure 13(b)) is 53 s
44 Grid Connected Simulation Analysis of Kaplan TurbineThe Kaplan turbine regulating system model was establishedand the simulation was performed on the IEEE 39-bussystem [21] with three different kinds of Kaplan turbineand water diversion system models using model one modeltwo and model three in Section 3 and the same Kaplanturbine regulating system mathematical model in Section 2respectively The Kaplan turbine is connected to bus 18Figure 14 shows the revised 39-bus system diagram
The generator parameters of bus 40 herein are as follows119883119889= 1217 119883
119889= 0600 1198831015840
119889= 0349 1198831015840
119902= 0600 11988310158401015840
119889=
0250 and11988310158401015840119902= 0250 and the rotor inertia time constant of
Mathematical Problems in Engineering 9
t1 t2
minus04
minus02
002040608
112
Varia
bles
(pu
)
5 10 15 20 25 300Time (s)
120596
y
yrPm
(a)
120596 = 00760t minus 03043
1101102103104105106107108109
11
120596(p
u)
172 174 176 178 18 182 18417Time (s)
(b)
Figure 13 Load rejection test (a) Measured variables curves (b) Linear segment of the speed change and the fitting curve
Kaplan turbine
1
2
3
4
5
6
7
8
9
10
11
12
13
14
15
16
1718
19
20
21 22
23
24
25 26
27
28 2930
31
32
3334
35
36
37
38
39
40
G39
G38
G37
G36
G35
G34 G33
G32
G30
G31
G40
Figure 14 Revised 39-bus system diagram
the generator is 6 s while the other parameters in the systemare not modified
Assume that there is a three-phase short-circuit fault onlines 17-18 near bus 18 at 1 s and lines 17-18 are disconnectedat 11 s Figure 15 shows the simulation results
As shown in Figure 15 the terminal voltage of Kaplanturbine is rapidly reduced to around zero when a three-phase
short-circuit fault occurs Each observation returns to thesteady-state value after removing the fault line besides thereactive power with value of a little increase The terminalvoltage changes with the three kinds of the turbine regulatingsystem dynamic model (ie the Kaplan turbine and waterdiversion system model using model one model two andmodel three) are basically the same Under the initial turbine
10 Mathematical Problems in Engineering
Model oneModel twoModel three
0996
0998
1
1002
1004
1006
1008120596
(pu
)
1 2 3 4 5 6 7 80Time (s)
(a)
Model oneModel twoModel three
0010203040506070809
Activ
e pow
er (p
u)
1 2 3 4 5 6 7 80Time (s)
(b)
Model oneModel twoModel three
036038
04042044046048
05052054
Mec
hani
cal p
ower
(pu
)
1 2 3 4 5 6 7 80Time (s)
(c)
Model oneModel twoModel three
1 2 3 4 5 6 7 80Time (s)
0
02
04
06
08
1
Term
inal
vol
tage
(pu
)
(d)
Model oneModel twoModel three
0
05
1
15
2
25
Term
inal
curr
ent (
pu
)
1 2 3 4 5 6 7 80Time (s)
(e)
minus05
minus04
minus03
minus02
minus01
0010203
Reac
tive p
ower
(pu
)
Model oneModel twoModel three
1 2 3 4 5 6 7 80time (s)
(f)
Figure 15 Power grid fault simulation results (a) Unit speed curves (b) Active power curves (c) Mechanical power curves (d) Terminalvoltage curves (e) Terminal current curves (f) Reactive power curves
mechanical power output of 045 (ie the mechanical poweris 27MW) the angle speed and the mechanical power fluctu-ations of model two are larger than those of model one andmodel three with themaximumdeviation being about 03HzThe maximum mechanical power fluctuation value of modeltwo is about 008 by per unit value (the reference capacity of
100MVA) In addition to different turbine and water diver-sion system models the governor parameters (the governorconverts the frequency deviation to wicket gate opening) alsoinfluence the amount of mechanical power adjustment
The adjustment of nonlinear turbinemodel was finer thanthat of the improved ideal turbine model since the latter was
Mathematical Problems in Engineering 11
derived based on the linearized model near the rated condi-tion and its transfer function was simple From the turbineoperating characteristics the coefficients in (3) may changesignificantly with turbine running in other conditions thusthe original parameters may cause a large amount of powerfluctuation
5 Conclusion
Kaplan turbine model in this paper is divided into thegovernor system model the blade control system model andthe turbine and water diversion system model The detaileddual-regulated vane control system model and blade controlsystemmodel were developedThe comparison of simulationand measured results showed the reasonableness and effec-tiveness of the established model and parameters The on-cam relationship between the wicket gate opening and theblade opening and the influence of the blade servomotor timeconstant on the blade control systemmodel were studiedTheblade opening was transferred from the blade angle and thefifth order polynomial fitting function could characterize theon-cam relationship with amplitude limits set of the bladeopening in this study The blade servomotor time constantshould be set in a reasonable range of value but it was difficultto be tested In this study 119879
119910119903was 1 s and thus the blade
servomotor response time link could be ignored Howeverit had a little effect on the simulation result and simplified themodeling and the experimental work
Progressively the linearized Kaplan turbine modelimproved ideal turbine model and nonlinear Kaplan turbinemodel are developed The nonlinear Kaplan turbine model isproposed which reflects the effects of the wicket gate openingand the blade opening changes on the turbine mechanicalpower (ie it regards the effect of blade opening on Kaplanturbine as increasing flow amount) and has a high accuracythrough the comparison of the simulation and the measuredresults The power disturbance test and the frequencydisturbance test confirmed that the established governormodel the dual-regulated vane and blade control systemmodel and the nonlinear Kaplan turbine model reflected thedynamic response of the Kaplan turbine adequately whichcould be applied in the power system analysis
Conflict of Interests
The authors have declared that no conflict of interests exists
Acknowledgment
This work was financially supported by the National NaturalScience Foundation of China (51307123)
References
[1] S Patterson ldquoImportance of hydro generation response result-ing from the new thermal modeling and required hydro mod-eling improvementsrdquo inProceedings of the IEEE Power Engineer-ing Society General Meeting vol 2 pp 1779ndash1783 Denver ColoUSA June 2004
[2] D M Dobrijevic and M V Jankovic ldquoAn improved method ofdamping of generator oscillationsrdquo IEEETransactions on EnergyConversion vol 14 no 4 pp 1624ndash1629 1999
[3] I Vojtko V Fecova M Kocisko and J Novak-Marcincin ldquoPro-posal of construction and analysis of turbine bladesrdquo inProceed-ings of the 4th IEEE International Symposium on Logistics andIndustrial Informatics (LINDI rsquo12) pp 75ndash80 IEEE SmoleniceSlovakia September 2012
[4] D Jost A Skerlavaj and A Lipej ldquoImprovement of efficiencyprediction for a Kaplan turbine with advanced turbulencemodelsrdquo Journal of Mechanical Engineering vol 60 no 2 pp124ndash134 2014
[5] E Malenovsky and F Pochyly ldquoDynamic analysis of kaplanturbine caused by short circuitrdquo in Proceedings of the 14th Inter-national Symposium on Transport Phenomena and Dynamics ofRotating Machinery Honolulu Hawaii USA March 2012
[6] Y C Choo K M Muttaqi and M Negnevitsky ldquoModelling ofhydraulic turbine for dynamic studies and performance ana-lysisrdquo in Proceedings of the Australasian Universities Power Engi-neering Conference pp 1ndash6 December 2007
[7] L N Hannett J W Feltes and B Fardanesh ldquoField tests to val-idate hydro turbine-governor model structure and parametersrdquoIEEE Transactions on Power Systems vol 9 no 4 pp 1744ndash17511994
[8] WorkingGroup ldquoHydraulic turbine and turbine controlmodelsfor system dynamic studiesrdquo IEEE Transactions on PowerSystems vol 7 no 1 pp 167ndash179 1992
[9] D H Thorne and E F Hill ldquoField testing and simulation ofhydraulic turbine governor performancerdquo IEEE Transactions onPower Apparatus and Systems vol 93 no 4 pp 1183ndash1191 1974
[10] Q Lu W Hu J Li and J Zhou ldquoResearch on frequency simu-lation model and control strategy of hydropower islandsrdquo inProceedings of the International Conference on Advanced PowerSystem Automation and Protection (APAP rsquo11) vol 3 pp 1896ndash1901 IEEE Beijing China October 2011
[11] J L Aguero M C Beroqui and F Issouribehere ldquoGrid fre-quency control secondary frequency control tuning taking intoaccount distributed primary frequency controlrdquo in Proceedingsof the IEEE Power and Energy Society General Meeting pp 1ndash8IEEE Minneapolis Minn USA July 2010
[12] P Schniter and L Wozniak ldquoEfficiency based optimal controlof Kaplan hydrogeneratorsrdquo IEEE Transactions on Energy Con-version vol 10 no 2 pp 348ndash353 1995
[13] P Huvet ldquoInfluence of runner blade angle variations on Kaplanturbine transientsrdquo Houille Blanche vol 41 no 1 pp 137ndash1471986
[14] D N Kosterev ldquoHydro turbine-governor model validation inpacific northwestrdquo IEEE Transactions on Power Systems vol 19no 2 pp 1144ndash1149 2004
[15] M Brezovec I Kuzle and T Tomisa ldquoNonlinear digital simu-lation model of hydroelectric power unit with Kaplan turbinerdquoIEEE Transactions on Energy Conversion vol 21 no 1 pp 235ndash241 2006
[16] W Zhao andDWei ldquoRelevance vectormachine combinedwithglowworm swarm optimization for cam relationship of Kaplanturbinerdquo Advanced Science Letters vol 11 no 1 pp 244ndash2472012
[17] D Kranjcic and G Stumberger ldquoDifferential evolution-basedidentification of the nonlinear kaplan turbine modelrdquo IEEETransactions on Energy Conversion vol 29 no 1 pp 178ndash1872014
12 Mathematical Problems in Engineering
[18] M Djukanovic M Novicevic D Dobrijevic B Babic D JSobajic and Y-H Pao ldquoNeural-net based coordinated stabi-lizing control for the exciter and governor loops of low headhydropower plantsrdquo IEEE Transactions on Energy Conversionvol 10 no 4 pp 760ndash767 1995
[19] J Zhao L Wang D Liu and J Wang ldquoPiecewise model andparameter obtainment of governor actuator in turbinerdquo Journalof Applied Mathematics vol 2015 Article ID 709272 9 pages2015
[20] E De Jaeger N Janssens B Malfliet and F Van De Meule-broeke ldquoHydro turbine model for system dynamic studiesrdquoIEEE Transactions on Power Systems vol 9 no 4 pp 1709ndash17151994
[21] M D Amadou H Mehrjerdi S Lefebvre M Saad and DAsber ldquoArea voltage control analysis in transmission systemsbased on clustering techniquerdquo IET Generation TransmissionampDistribution vol 8 no 12 pp 2134ndash2143 2014
Submit your manuscripts athttpwwwhindawicom
Hindawi Publishing Corporationhttpwwwhindawicom Volume 2014
MathematicsJournal of
Hindawi Publishing Corporationhttpwwwhindawicom Volume 2014
Mathematical Problems in Engineering
Hindawi Publishing Corporationhttpwwwhindawicom
Differential EquationsInternational Journal of
Volume 2014
Applied MathematicsJournal of
Hindawi Publishing Corporationhttpwwwhindawicom Volume 2014
Probability and StatisticsHindawi Publishing Corporationhttpwwwhindawicom Volume 2014
Journal of
Hindawi Publishing Corporationhttpwwwhindawicom Volume 2014
Mathematical PhysicsAdvances in
Complex AnalysisJournal of
Hindawi Publishing Corporationhttpwwwhindawicom Volume 2014
OptimizationJournal of
Hindawi Publishing Corporationhttpwwwhindawicom Volume 2014
CombinatoricsHindawi Publishing Corporationhttpwwwhindawicom Volume 2014
International Journal of
Hindawi Publishing Corporationhttpwwwhindawicom Volume 2014
Operations ResearchAdvances in
Journal of
Hindawi Publishing Corporationhttpwwwhindawicom Volume 2014
Function Spaces
Abstract and Applied AnalysisHindawi Publishing Corporationhttpwwwhindawicom Volume 2014
International Journal of Mathematics and Mathematical Sciences
Hindawi Publishing Corporationhttpwwwhindawicom Volume 2014
The Scientific World JournalHindawi Publishing Corporation httpwwwhindawicom Volume 2014
Hindawi Publishing Corporationhttpwwwhindawicom Volume 2014
Algebra
Discrete Dynamics in Nature and Society
Hindawi Publishing Corporationhttpwwwhindawicom Volume 2014
Hindawi Publishing Corporationhttpwwwhindawicom Volume 2014
Decision SciencesAdvances in
Discrete MathematicsJournal of
Hindawi Publishing Corporationhttpwwwhindawicom
Volume 2014 Hindawi Publishing Corporationhttpwwwhindawicom Volume 2014
Stochastic AnalysisInternational Journal of
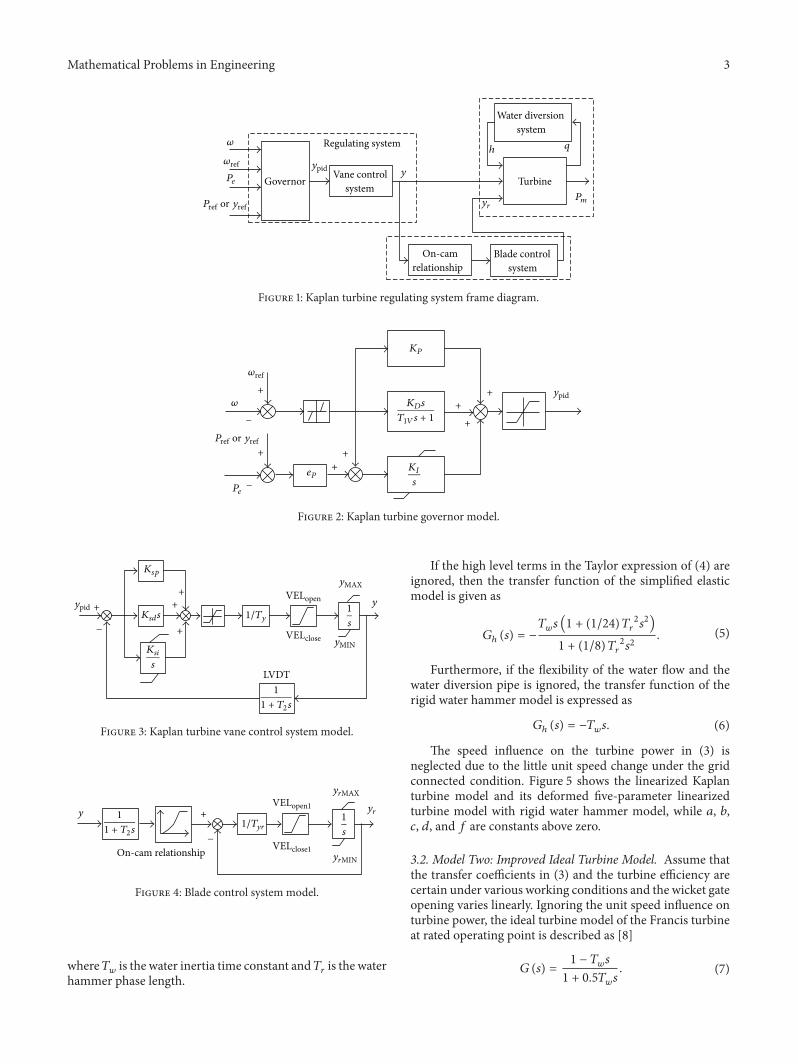
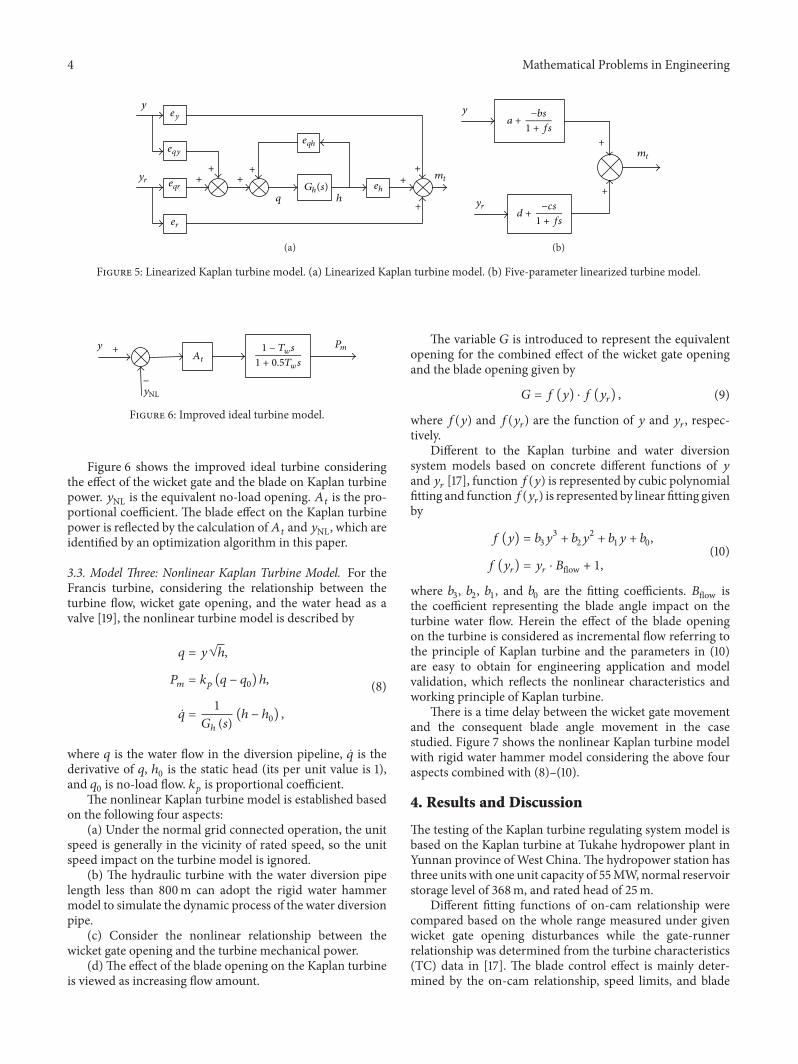
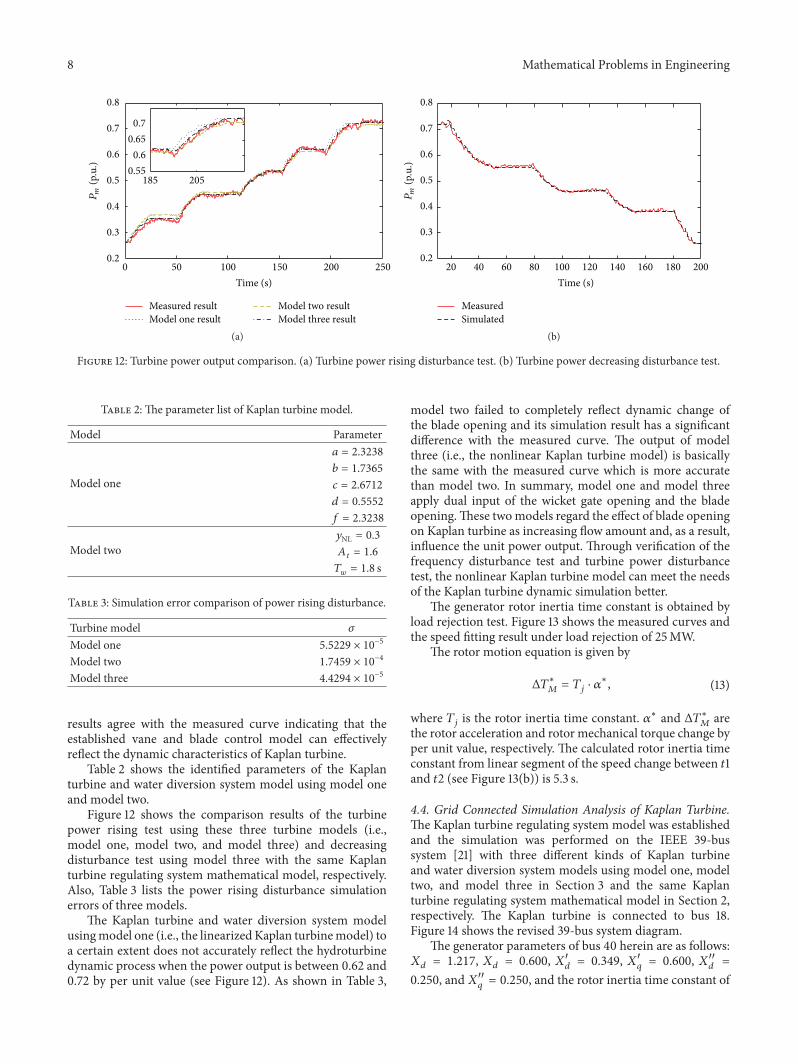
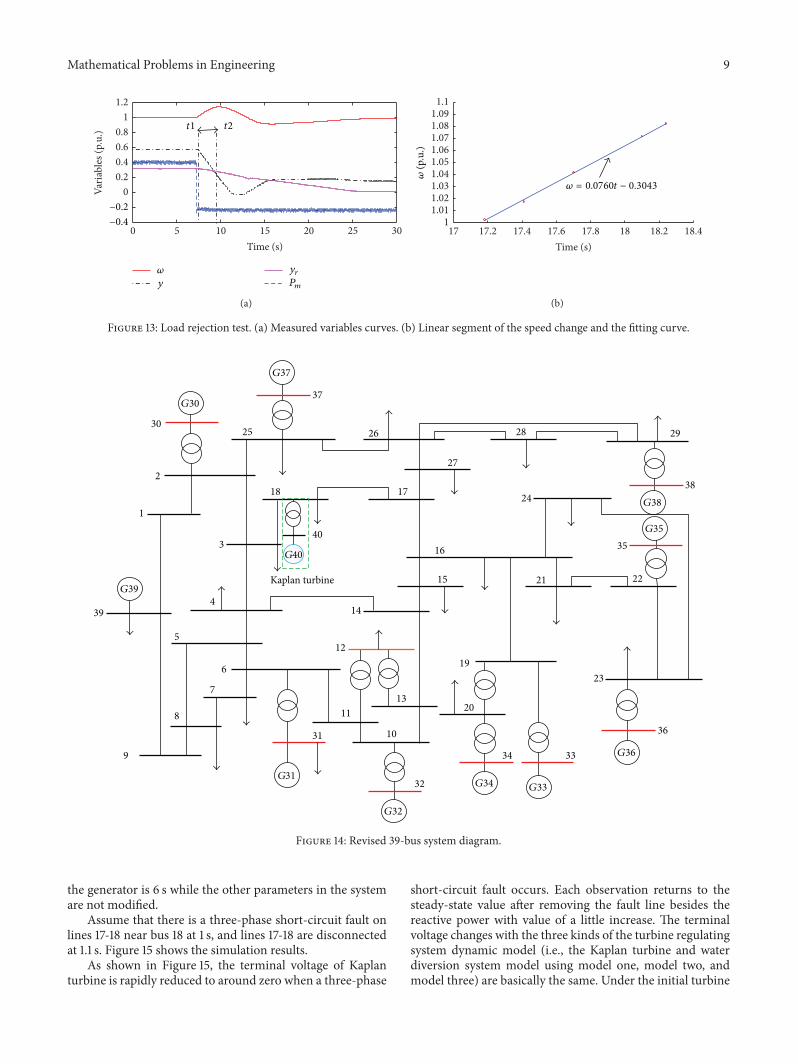
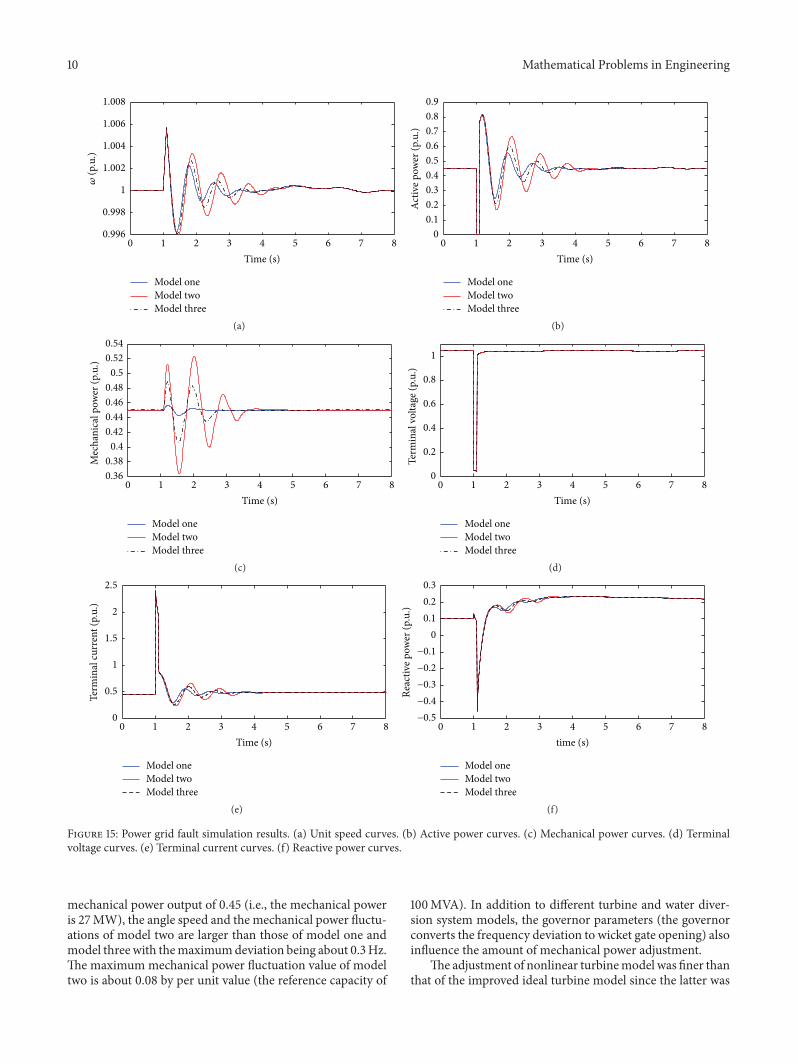