dynamic product portfolio management modeling for the
TRANSCRIPT
Dynamic Product Portfolio Management Modeling for the
Financial Technology Industry
Seyed Behnam Khakbaz Ph.D. Candidate, Department of Business Management, Faculty of Management, University of
Tehran, Tehran, Iran. (Email: [email protected])
Mohammad Ali Shahhoseini* *Corresponding author, Associate Prof., Department of Business Management, Faculty of
Management, University of Tehran, Tehran, Iran. (Email: [email protected])
Ali Divandari Prof., Department of Business Management, Faculty of Management, University of Tehran,
Tehran, Iran. (Email: [email protected])
Hamidreza Rabiee
Prof., Faculty of Information Technology, Sharif University of Technology, Tehran, Iran.
(Email: [email protected])
Document Type: Original Article 2020, Vol. 4, No. 3. 49-79
Received: 2019/11/30 Accepted: 2020/10/25 Published: 2020/11/11
Abstract Resource allocation, as the main objective of managerial science, requires analyzing the long- and short-term effects of a policy, although this analysis would be more difficult in dynamic and volatile industries such as financial technology. Moreover, the integration of industries leads to more diverse product categories for a single company and makes it difficult for the implementation of decision making about resource allocation. In this regard, systemic PPM (PPM) models can be applied to balance long- and short-term generated values of the company by adopting policies about resource allocation for different products with respect to risk management concepts. The proposed systemic model should include interrelationships between different products, time relevant, and most importantly the potentials of dynamic analysis of product strategies, which is the main purpose of this research. The research strategy is to conduct a case study on the Iranian financial technology industry, by using systemic PPM modeling. In this research, a dynamic model was used in the payment industry, due to its competitive forces. Thus, system dynamics methodology was the research tool for analyzing data. Further, four cycles of risk management, resource allocation, innovation, and development were identified and then, analyzed in a dynamic approach to evaluating their efficiency for business development. Based on the results, the system dynamics methodology provided great outcomes for this problem. Finally, scenario analysis, focus, deep understandings of the decision-making process with respects to mental models, and stock and flow diagrams were among the most significant findings of this article.
Keywords: Product portfolio management, System dynamics, Resource allocation, Fintech industry, Financial services.
DOI: 10.22034/ijf.2020.209903.1092 Publisher: Iran Finance Association
Copyright: author(s) Type of License: Creative Commons License (CC-BY 4.0)

50
Iranian Journal of Finance, 2020, Vol. 4, No. 3 (Khakbaz, B.)
Introduction
Sustainable competitive advantage is regarded as a critical issue for companies
in all industries, especially in a competitive industry like information
technology. In the competitive industry, companies would provide a wide
variety of products (Rothaermel, Hitt, & Jobe, 2006). However, managing the
limited resources of the company to deliver the most value for the customers
and the company is the most important concern related to this strategy (Kester,
Hultink, & Griffin, 2014). Furthermore, innovation management and product
and business development play an important role in gaining competitive
advantages, especially in product and business portfolio management (Otten,
Spruit, & Helms, 2015).
Resource allocation has been considered the main subject for managers
and practice, and various theories have been proposed to evaluate this subject.
On the other hand, a large body of research has been conducted on the PPM, as
a controversial problem for this objective (resource allocation) (Jugend & da
Silva, 2014). Nowadays, multi-business firms, which are active in different
sub-industries, are faced with similar problems concerning business portfolio
management (Tanriverdi & Venkatraman, 2005).
The financial technology industry, which is considered a joint subset of
financial industry and information technology industry, is somehow
competitive (both the financial industry and information technology industries
are very competitive and somewhat competitive ones), especially in the Iranian
Fintech industry.
This can be concluded by some of the company specifications like
fundamental innovation and technology disruption (Brown & Eisenhardt, 1997;
Schmalensee, 2000), revenue, market share and profitability volatility (Lee,
Venkatraman, Tanriverdi, & Iyer, 2010; Schmalensee, 2000). For example,
Payment, as a subset of financial technology, is one of the most competitive
industries in Iran with 1440 Herfindahl-Hirschman indexes1 related to Central
Bank of Iran (CBI), according to the Shaparak Report. For comparison, see
table1 (www.shaparak.ir, 2020) (McKinsey & Company, 2020):
1 The Herfindahl-Hirschman Index (HHI) is a common measure of market concentration that is used to
determine market competitiveness
51
Systemic Product Portfolio Management Modeling
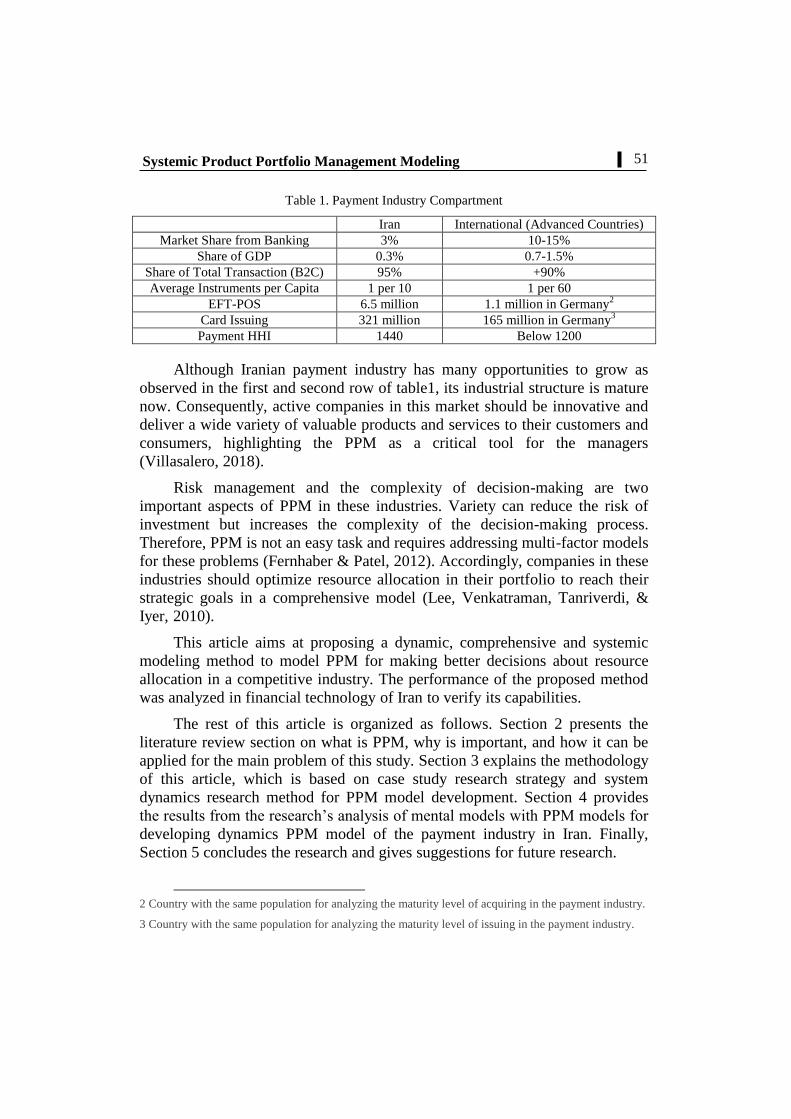
Table 1. Payment Industry Compartment
Iran International (Advanced Countries)
Market Share from Banking 3% 10-15%
Share of GDP 0.3% 0.7-1.5%
Share of Total Transaction (B2C) 95% +90%
Average Instruments per Capita 1 per 10 1 per 60
EFT-POS 6.5 million 1.1 million in Germany2
Card Issuing 321 million 165 million in Germany3
Payment HHI 1440 Below 1200
Although Iranian payment industry has many opportunities to grow as
observed in the first and second row of table1, its industrial structure is mature
now. Consequently, active companies in this market should be innovative and
deliver a wide variety of valuable products and services to their customers and
consumers, highlighting the PPM as a critical tool for the managers
(Villasalero, 2018).
Risk management and the complexity of decision-making are two
important aspects of PPM in these industries. Variety can reduce the risk of
investment but increases the complexity of the decision-making process.
Therefore, PPM is not an easy task and requires addressing multi-factor models
for these problems (Fernhaber & Patel, 2012). Accordingly, companies in these
industries should optimize resource allocation in their portfolio to reach their
strategic goals in a comprehensive model (Lee, Venkatraman, Tanriverdi, &
Iyer, 2010).
This article aims at proposing a dynamic, comprehensive and systemic
modeling method to model PPM for making better decisions about resource
allocation in a competitive industry. The performance of the proposed method
was analyzed in financial technology of Iran to verify its capabilities.
The rest of this article is organized as follows. Section 2 presents the
literature review section on what is PPM, why is important, and how it can be
applied for the main problem of this study. Section 3 explains the methodology
of this article, which is based on case study research strategy and system
dynamics research method for PPM model development. Section 4 provides
the results from the research’s analysis of mental models with PPM models for
developing dynamics PPM model of the payment industry in Iran. Finally,
Section 5 concludes the research and gives suggestions for future research.
2 Country with the same population for analyzing the maturity level of acquiring in the payment industry.
3 Country with the same population for analyzing the maturity level of issuing in the payment industry.

52
Iranian Journal of Finance, 2020, Vol. 4, No. 3 (Khakbaz, B.)
Background
So far, various portfolio models have introduced the notion of resource
allocation as a key decision for firms for financial investment and product
development (Kester, Hultink, & Griffin, 2014). Portfolio concept is a useful
management tool for enforcing a discipline in the allocation of the company’s
limited resources to an optimal combination of business operations, which will
maximize long-term returns at a given level of risk (Turnbull, 1990; Cooper,
Edgett, & Kleinschmidt, 1999). Generally, currently developed portfolio
approaches are mostly based on industrial organization, political economy
(socio-economic influences), resource-based capability, and strategic approach
(Jugend & da Silva, 2014). The portfolio approach for industrial marketing and
purchasing management originated from the financial investment context, from
which it expanded to product investments, corporate strategy, and business
relationships contexts (Turnbull, 1990).
The inherent logic of many models still follows Markowitz’s (1952)
argument to maximize portfolio returns and minimize risks, by carefully
choosing a portfolio compiled of different assets and equities. According to this
theory, optimal outcomes cannot be achieved when stock investments are
considered independent from each other. Instead, it is more efficient to
consider each individual stock as an element of a portfolio that needs to be
calibrated carefully to reach an optimal balance of risk and return (Markowitz,
1952). PPM is somehow very similar to investment portfolios and aims to
optimize risk and return of the portfolios and their main proposition for this
objective is to make a portfolio more diverse to optimization point in an
uncertain situation (Kester, Hultink, & Griffin, 2014). Firms have different
products and services in their portfolio, each of which represents a certain level
of return (i.e., size of future cash flows) and riskiness (i.e., the uncertainty in
those cash flows). Similar to stocks in a financial portfolio, these return and
risk need to be balanced in a product/service portfolio (Cooper, Edgett, &
Kleinschmidt, 1999). The Markowitz theory assumes that investors are rational
and markets are efficient, which often do not hold in the context of
product/services portfolio decision-making. The product/services portfolio
decision-making is a dynamic resource allocation process that should address
strategic considerations across projects in the portfolio, as well as
interdependencies between projects, in addition to dealing with multiple
decision-makers who are often dispersed across locations (Kester, Hultink, &
Griffin, 2014; Chao & Kavadias, 2008; Killen, Jugdev, Drouin, & Petit, 2012).
Therefore, considering different causes and effects of a resource allocation
decision making is a critical analysis tool for PPM. Moreover, the importance
53
Systemic Product Portfolio Management Modeling
Researcher Year Approach
BCG 1973 Market growth and related market share matrix
Walker 1984Three different matrix: Profitability analysis matrix, Market-
Competitor Matrix, Maket and sales growth matrix
Cooper Edget &
Kleinschmidt2000
Applying financial indicators for assessing products with
respect to their importance in portfolio
Chao and Kavadias 2008Financial indicators (NPV, RoI, IRR) for assessing product
portfolio
McKinsey & Company2008 (Last
Version)
Industrial analysis and company's competitive advantage
matrix
McNally, Durmusoglu,
Calantone &
Harmancioglu
2009 Applying TRM
Bausch and Pils 2009 Portfolio vs non-diversified analysis
Killen Jugdev, Drouin &
Petit2012
Assessing financial indicators for strategic alignment (long
term effects)
Yang & Lee 2012 Scoring the products with respects to performance indicators
Kester, Hultink & Griffin 2014 Assessing importance of products in portfolio
Jugend & Da Silva 2014 Scoring the products with respects to criterias
Ralf W.Seifertab, Jean-
SébastiennTancrezc ,Işık
Biçera
2016Dynamic product portfolio management with life cycle
considerations
Erno Mustonen, Jonne
Seppänen, Arto Tolonen,
Janne Harkonen
2019Strategic targets and key performance indicators over life-
cycle of products
Cooper and Sommer 2020Applying Agile Perspective in product portfolio
management
of time is another difference between these portfolio management models.
Many PPM policies depend on operation time and operation duration (Cooper,
Edgett, & Kleinschmidt, 1999; Kester, Hultink, & Griffin, 2014; Chao &
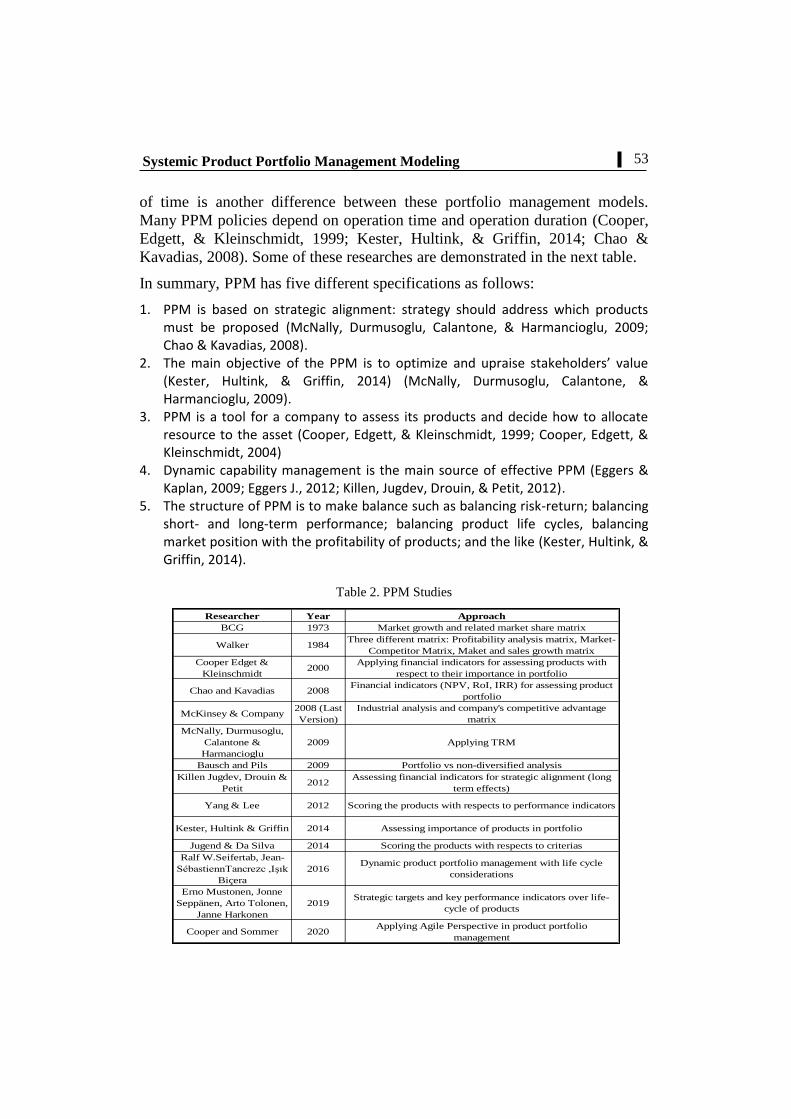
Kavadias, 2008). Some of these researches are demonstrated in the next table.
In summary, PPM has five different specifications as follows:
1. PPM is based on strategic alignment: strategy should address which products must be proposed (McNally, Durmusoglu, Calantone, & Harmancioglu, 2009; Chao & Kavadias, 2008).
2. The main objective of the PPM is to optimize and upraise stakeholders’ value (Kester, Hultink, & Griffin, 2014) (McNally, Durmusoglu, Calantone, & Harmancioglu, 2009).
3. PPM is a tool for a company to assess its products and decide how to allocate resource to the asset (Cooper, Edgett, & Kleinschmidt, 1999; Cooper, Edgett, & Kleinschmidt, 2004)
4. Dynamic capability management is the main source of effective PPM (Eggers & Kaplan, 2009; Eggers J., 2012; Killen, Jugdev, Drouin, & Petit, 2012).
5. The structure of PPM is to make balance such as balancing risk-return; balancing short- and long-term performance; balancing product life cycles, balancing market position with the profitability of products; and the like (Kester, Hultink, & Griffin, 2014).
Table 2. PPM Studies
54
Iranian Journal of Finance, 2020, Vol. 4, No. 3 (Khakbaz, B.)
Thus, PPM should consist of a comprehensive analysis of how to allocate
a specific resource in a given time for different products, by considering the
strategic objectives of the company. This tool provides a dynamic analysis of
PPM, which can be used for selecting a proper mixture of products for a
company and investing on them in a systemic perspective (Merten, Reiner, &
Wiedmann, 1987). This is a dynamic procedure for decision making about
different products of a company and how to operate regarding their long- term
proposed value for the company. To this aim, considering different subjects in
a comprehensive and related manner (systemic view) is a critical issue
(Kortelainen, Piirainen, & Tuominen, 2008; Killen, Jugdev, Drouin, & Petit,
2012).
PPM (PPM)
In general, different PPM models mainly focus on evaluating aspects of
strategic, technological, market and marketing, risk, and economical return
issues of the studied company in a simple mode (Jugend & da Silva, 2014;
Cooper, Edgett, & Kleinschmidt, 2000). In summary, there are four distinct
categories of PPM models, which are presented in the following:
Financial models: The main objectives of these PPM models is to
maximize the value of the portfolio with respects to the efficiency of the
portfolio, which can be assessed by the ratio of revenue to consumed
resources for making revenue. For this objective, different indicators
should be analyzed, some of which are net present value (NPV), generated
expected commercial value, internal rate of return (IRR), return on
investment (RoI), and point of equilibrium of the portfolio (Cooper, Edgett,
& Kleinschmidt, 2000; Chao & Kavadias, 2008). Consequently, financial
models can be used for prioritizing products of the portfolio and are the
most common methods for PPM. However, these models fail to consider
some long term and market-oriented subjects such as innovation and
changing the demand side of the market or strategic alignment of the
portfolio (Killen, Jugdev, Drouin, & Petit, 2012; Chao & Kavadias, 2008).
Moreover, these models neglect related effects of the products (some
products are supplied to the market only for acquisition or awareness and
companies would make a profit from them in other products), leading to
limited optimized portfolios (Lindstedt, Liesio, & Salo, 2008).
Scoring and ranking models: These models are applied for scoring and
ranking the degree of importance of products in the portfolios (Cooper,
Edgett, & Kleinschmidt, 2000; Kester, Hultink, & Griffin, 2014).
Furthermore, these models are based on two factors of perspective
(perspective is defined with company’s goals and objectives such as

55
Systemic Product Portfolio Management Modeling
competitive advantages, sustainability, customer satisfaction, quality of
service, innovation, profitability, etc.) and criteria (each perspective can be
described by some criteria; for example, the quality of service can be
assessed by sales, customer’s retention, and market growth rate). The
products in a portfolio are ranked with respects to each product's point in
each criterion and their multiplication by the weight of these criteria
(Jugend & da Silva, 2014). Some of these models are AHP (Analytic
Hierarchal Process) and BSC (Balances Score Card), which can be applied
for strategic alignment and market orientation aspects of the product
portfolios (Jugend & da Silva, 2014; Oh, Yang, & Lee, 2012). However,
ranking models mainly neglect interrelationships of products, such as
financial models, and are based on the intuition of experts (financial models
are based on data); as a result, these models have somehow important
limitations (Kester, Hultink, & Griffin, 2014).
Roadmap models: Product and technology road map is a good tool for
strategic alignment and balancing portfolios. Technology Roadmap Method
(TRM) is the most applied method for this category (Jugend & da Silva,
2014). In this method, companies would apply road maps of future
technological advances in their industries. Thus, gradual and disruptive
innovations can be used by TRM (McNally, Durmusoglu, Calantone, &
Harmancioglu, 2009).
Graphs and Diagrams models: Utilizing diagrams, graphs and matrixes like
Boston Consultancy Group (BCG) matrix or General Electric (GE)
quadrant (developed by Mckinsey & Company) are the last categories of
PPM models. These models can make strategic alignment for companies
and help them to design balanced portfolios (Cooper, Edgett, &
Kleinschmidt, 1999). However, the effectiveness of these models depends
on operational and strategic alignment in companies, as well as their
leadership capabilities (Chao & Kavadias, 2008). Positioning models are
based on the simultaneous analysis of internal (for example competitive
power, quality of service, cost of service, processes of service delivery,
workforce capabilities, marketing mix policies, etc.) and external (market
attractiveness, market growth rate, market size, a contribution margin of
industry, etc.) factors (Oh, Yang, & Lee, 2012; Cooper, Edgett, &
Kleinschmidt, 2000; Jugend & da Silva, 2014)
56
Iranian Journal of Finance, 2020, Vol. 4, No. 3 (Khakbaz, B.)
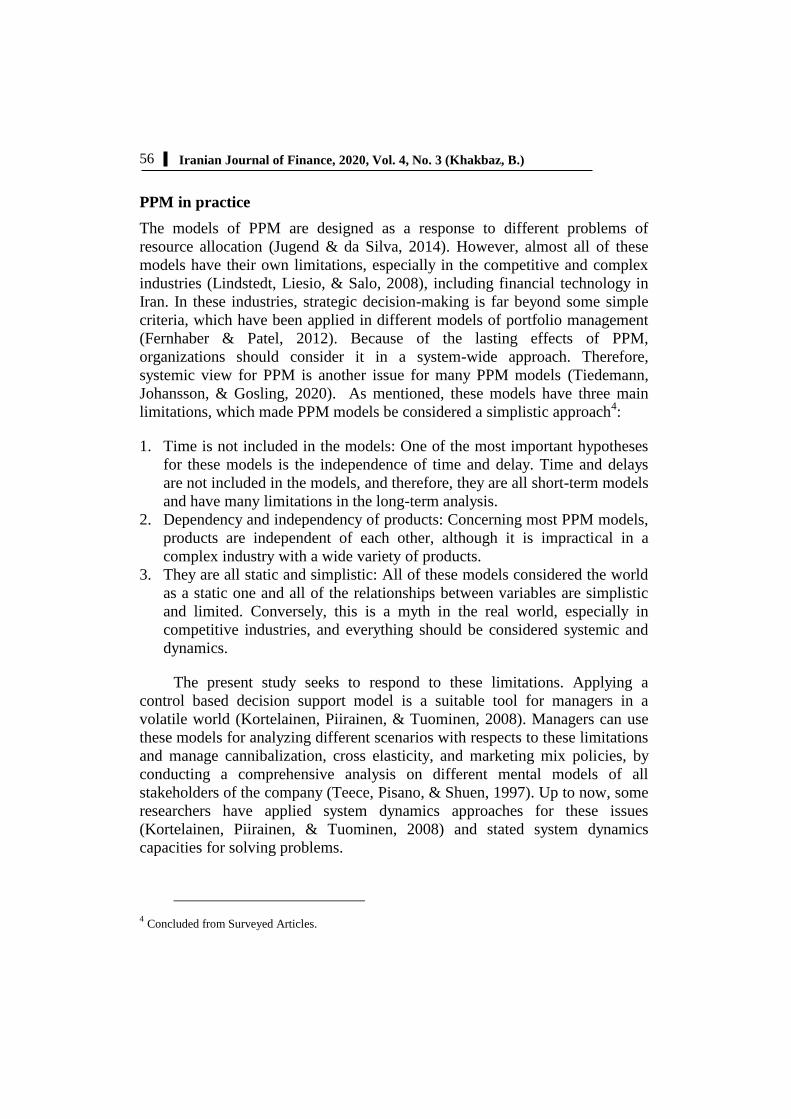
PPM in practice
The models of PPM are designed as a response to different problems of
resource allocation (Jugend & da Silva, 2014). However, almost all of these
models have their own limitations, especially in the competitive and complex
industries (Lindstedt, Liesio, & Salo, 2008), including financial technology in
Iran. In these industries, strategic decision-making is far beyond some simple
criteria, which have been applied in different models of portfolio management
(Fernhaber & Patel, 2012). Because of the lasting effects of PPM,
organizations should consider it in a system-wide approach. Therefore,
systemic view for PPM is another issue for many PPM models (Tiedemann,
Johansson, & Gosling, 2020). As mentioned, these models have three main
limitations, which made PPM models be considered a simplistic approach4:
1. Time is not included in the models: One of the most important hypotheses
for these models is the independence of time and delay. Time and delays
are not included in the models, and therefore, they are all short-term models
and have many limitations in the long-term analysis.
2. Dependency and independency of products: Concerning most PPM models,
products are independent of each other, although it is impractical in a
complex industry with a wide variety of products.
3. They are all static and simplistic: All of these models considered the world
as a static one and all of the relationships between variables are simplistic
and limited. Conversely, this is a myth in the real world, especially in
competitive industries, and everything should be considered systemic and
dynamics.
The present study seeks to respond to these limitations. Applying a
control based decision support model is a suitable tool for managers in a
volatile world (Kortelainen, Piirainen, & Tuominen, 2008). Managers can use
these models for analyzing different scenarios with respects to these limitations
and manage cannibalization, cross elasticity, and marketing mix policies, by
conducting a comprehensive analysis on different mental models of all
stakeholders of the company (Teece, Pisano, & Shuen, 1997). Up to now, some
researchers have applied system dynamics approaches for these issues
(Kortelainen, Piirainen, & Tuominen, 2008) and stated system dynamics
capacities for solving problems.
4 Concluded from Surveyed Articles.

57
Systemic Product Portfolio Management Modeling
PPM in the financial technology industry
As mentioned, the main objective of PPM is to balance allocated resources,
strategic alignment, and risk management, as well as to maximize generated
value of a company (Chao & Kavadias, 2008; Cooper, Edgett, & Kleinschmidt,
2004; Kester, Hultink, & Griffin, 2014). This research first attempts to design a
dynamic PPM model for the financial technology industry in Iran to
demonstrate the possibilities of applying system dynamics in this field. For this
purpose, we considered the BCG matrix, the best static model of PPM models,
as the base model. In this matrix, market growth demonstrates investment
attractiveness while market share is the criteria for assessing cash flows
(Cooper, Edgett, & Kleinschmidt, 1999; Jugend & da Silva, 2014). However,
market share depends on competitive power and market growth may affect
market share and cash flows. Moreover, cash flows have effects on investment
capabilities. Figure 1 illustrates the analysis of the BCG matrix for a portfolio
with two products (Chao & Kavadias, 2008). As shown, the base model is the
process of investment optimization in the market, which consists of four
variables of cash flow, related market development of each product,
competitive power of each product, and strategy and structure of decision-
making. This cycle can be named as resource allocation cycle.
Figure 1. Base cycle for resource allocation
The optimization of the generated value of the company is another subject
in PPM. Value can be demonstrated as profit, return on investment, internal
rate of return, and net present value. Further, the value cannot be seen as a one-
dimensional variable and depends on risks generated by-products and their
58
Iranian Journal of Finance, 2020, Vol. 4, No. 3 (Khakbaz, B.)
lifecycle (Voss, 2012; Cooper, Edgett, & Kleinschmidt, 1999; Kester, Hultink,
& Griffin, 2014). Product lifecycle somehow relies on the business structure of
the company, such as strategy, structure, marketing policies, and the like (Voss,
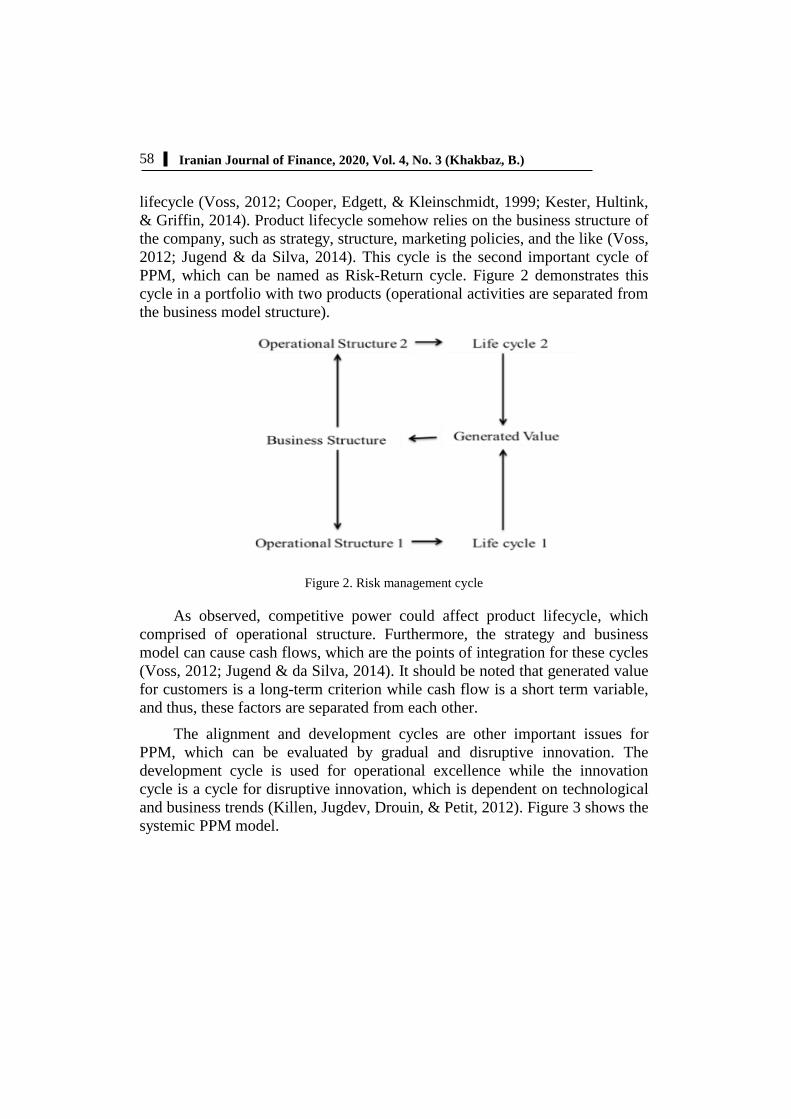
2012; Jugend & da Silva, 2014). This cycle is the second important cycle of
PPM, which can be named as Risk-Return cycle. Figure 2 demonstrates this
cycle in a portfolio with two products (operational activities are separated from
the business model structure).
Figure 2. Risk management cycle
As observed, competitive power could affect product lifecycle, which
comprised of operational structure. Furthermore, the strategy and business
model can cause cash flows, which are the points of integration for these cycles
(Voss, 2012; Jugend & da Silva, 2014). It should be noted that generated value
for customers is a long-term criterion while cash flow is a short term variable,
and thus, these factors are separated from each other.
The alignment and development cycles are other important issues for
PPM, which can be evaluated by gradual and disruptive innovation. The
development cycle is used for operational excellence while the innovation
cycle is a cycle for disruptive innovation, which is dependent on technological
and business trends (Killen, Jugdev, Drouin, & Petit, 2012). Figure 3 shows the
systemic PPM model.

59
Systemic Product Portfolio Management Modeling
Figure 3. Systemic PPM Model

60
Iranian Journal of Finance, 2020, Vol. 4, No. 3 (Khakbaz, B.)
Research Methodology
The research question is to develop an approach that is useful for designing a
PPM model in a systemic approach. Since the main goal of this study is to
analyze a corporate with different products, which is active in the industry,
deeply and inclusively, the research strategy is a case study to facilitate gaining
a comprehensive understanding of the PPM models in financial technology of
Iran. The case study included different research methodologies, with a common
feature of deep understanding of a real case (Blaikie, 2009). The case study
could be applied for a specific company or organization, and consequently, we
used it for a given issue in a determined industry in a specific market and
analyzed details of this objective with a comprehensive method (system
dynamics). Therefore, system dynamics was used as the analyzing
methodology. This section addresses the main methodology (case study) and
its approaches (system dynamics) to the problem (PPM model).
Case Study
The case study focuses on understanding the dynamics of a contemporary
phenomenon present within a single setting or its real-life context, especially
when the boundaries between the phenomenon and context are not evident
(Yin, 2011). The case study methodology is a tool for researchers to study
complex phenomena within their contexts (Stake, 1995). Case study
collaborates perspectives of the researcher and participants from phenomena's
context and guides the researcher to better analyze phenomena concerning
different views of participants. Case Study can be applied when (Yin, 2011):
The researcher wants to focus on “why” and “how” questions
The researcher should manipulate the behavior of participant and different
player in phenomena
The researcher wants to know contextual conditions related to phenomena
There are unclear boundaries for the definitions of phenomena.
In this study, a “how” question for Iranian financial technology industry
(Case as it defined by Yin definition with specific boundaries- market,
technology and geography) is the main driver for applying case study
methodology. Therefore, a single case, explanatory approach (explaining
presumed causal links in real life and too complex context) must be considered.
In this way, we defined a four-phase method for applying case study
methodology with respects to Yin methodology, which are as follows:
1. Designing a case study: Design refers to the logical sequence that connects
the empirical data to a study's initial research questions and, ultimately, to
61
Systemic Product Portfolio Management Modeling
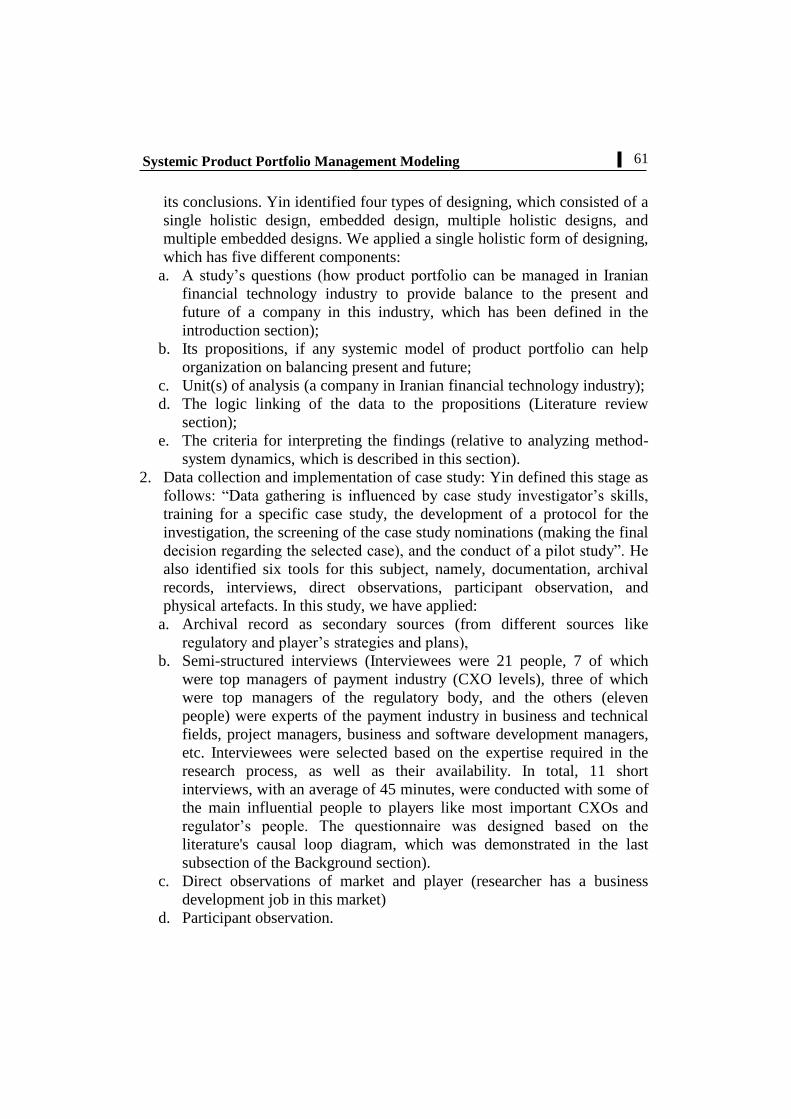
its conclusions. Yin identified four types of designing, which consisted of a
single holistic design, embedded design, multiple holistic designs, and
multiple embedded designs. We applied a single holistic form of designing,
which has five different components:
a. A study’s questions (how product portfolio can be managed in Iranian
financial technology industry to provide balance to the present and
future of a company in this industry, which has been defined in the
introduction section);
b. Its propositions, if any systemic model of product portfolio can help
organization on balancing present and future;
c. Unit(s) of analysis (a company in Iranian financial technology industry);
d. The logic linking of the data to the propositions (Literature review
section);
e. The criteria for interpreting the findings (relative to analyzing method-
system dynamics, which is described in this section).
2. Data collection and implementation of case study: Yin defined this stage as
follows: “Data gathering is influenced by case study investigator’s skills,
training for a specific case study, the development of a protocol for the
investigation, the screening of the case study nominations (making the final
decision regarding the selected case), and the conduct of a pilot study”. He
also identified six tools for this subject, namely, documentation, archival
records, interviews, direct observations, participant observation, and
physical artefacts. In this study, we have applied:
a. Archival record as secondary sources (from different sources like
regulatory and player’s strategies and plans),
b. Semi-structured interviews (Interviewees were 21 people, 7 of which
were top managers of payment industry (CXO levels), three of which
were top managers of the regulatory body, and the others (eleven
people) were experts of the payment industry in business and technical
fields, project managers, business and software development managers,
etc. Interviewees were selected based on the expertise required in the
research process, as well as their availability. In total, 11 short
interviews, with an average of 45 minutes, were conducted with some of
the main influential people to players like most important CXOs and
regulator’s people. The questionnaire was designed based on the
literature's causal loop diagram, which was demonstrated in the last
subsection of the Background section).
c. Direct observations of market and player (researcher has a business
development job in this market)
d. Participant observation.

62
Iranian Journal of Finance, 2020, Vol. 4, No. 3 (Khakbaz, B.)
Moreover, we have applied causal loop diagrams for modelling collected data
and information. These models are the main structure of the analysis.
3. Analyzing and validating the data: The procedure for conducting the
interviews was aimed at improving validity and reliability by careful
preparation and feedback from the respondents. The data analysis in the
study partly coincided with the data collection, because of the inherent
flexibility in case study research. After each interview, the data was
transcribed, summarized, and grouped, and ultimately, the relevant
qualitative data were coded into themes. Subsequently, the code phrases
were reduced and related to the key theoretical concepts. At the same time,
we kept the meaning of what the participant said intact. First searching for
similarities and differences in the transcripts, and second by editing and
sorting common themes in the transcripts identifies themes. The analysis
progressed steadily during the data collection so that to easily identify
which issues should be explored further in the subsequent interviews. Data
analysis consisted of examining, categorizing, tabulating, testing, or
otherwise recombining both quantitative and qualitative evidence to
address the initial propositions of a study. In this article, a system dynamics
approach was utilized for analyzing data, which is further described in this
section.
4. Reporting: This article is the report of our research.
In the following, we analyzed the PPM modelling and its capabilities in Iranian
financial technology industry for corporate activity in this market. The studied
company is one of the top three players in this industry, the name of which was
not mentioned in this article, because of its confidentiality.
System Dynamics
As it has been defined in last subsection (Case Study), system dynamics is the
main research method in second (gathering data and execution) and third
(analyzing and validating gathered data) in this research’s methodology.
System dynamics is an approach to analyze complex problems in their
environment. Moreover, causal loop diagram models are helpful instruments
for modelling the qualitative problems in a simple way especially in the most
complex problems. Scenario planning is another of system dynamics
capacities, which can help analyzer assess different solutions concerning the
environment (Sterman, Business Dynamics: Systems Thinking and Modeling
for a Complex World, 2000). As results, we have selected system dynamics as
one of our analysis instruments for its three main capabilities in lots of
instruments which we have seen in the literature, like static financial analysis
63
Systemic Product Portfolio Management Modeling
for PPM which have lots of problems, especially in the competitive industries
like financial technology (PayTech sub-industry).
The world is becoming more and more complex which make conceptual
designing a difficult process. Consequently, the concept "Micro-world" is a
good approach to analyze some of the pre-defined variables to understand the
behavior of different phenomena. Creation, modification and manipulation of
"Micro-world" increase our knowledge about a different phenomenon we live
in, work or stop working with (Woodside, 2006). A managing phenomenon
like payment industry requires a holistic and comprehensive method, which is
system dynamics. System dynamics is based on studying complex feedback
systems. It can be applied to managing non- linear aspects of phenomena with
internal/ external interaction between its elements. Forrester has applied system
Dynamics in 1958. Afterwards, it has been used for different problems like
economic analysis, strategy development etc. (Khakbaz & Hajiheydari, 2015).
With its main feature (analyzing a complex system with feedbacks); it can
provide a valuable model. These models would identify factors that affect the
outcomes of processes, programs, and decisions. System Dynamics is a
suitable analyzing approach that can help researchers to build formal computer
simulations for their systems. They can use it to assess their policies and design
organizations that are more productive. It can be used to analyzing long term
effects of decisions for developing better strategies for the success of
companies (Sterman, System dynamics modeling: Tools for learning in a
complex world, 2001).
System dynamics models were control feedback models, which one of the
main qualitative methods for this objective is causal loop diagrams. Causal
loop diagrams provided a high-level means of conceptualizing models in terms
of their feedback loop structure (Sterman, Business Dynamics: Systems
Thinking and Modeling for a Complex World, 2000). Causal loop diagrams
could be used in a freestanding model without computer simulation to assist
issue structuring and problem-solving. Causal loop diagrams can be used for
analyzing systems (quantitative) and for providing insight to managerial issues
by inferring (not calculating) the behavior of systems. This tool with assistance
to system thinking can be applied for solving different complex problems. It
can be done by modeling complex phenomena and analyzing the problem of
making a better understanding of it in its context (Wolstenholme, 1998).
Consequently, this research applied causal loop diagrams as a tool to
analyze the complex phenomenon of Iranian financial technology industry in a
systemic approach. Causal loop diagrams would be used in the results section

64
Iranian Journal of Finance, 2020, Vol. 4, No. 3 (Khakbaz, B.)
for making an insightful model for managers with respects to PPM concepts (a
dynamic model for Iranian financial technology industry for help to the
managers handles their product portfolio).
Research Findings
This section includes three subsections, one of which presents data gathered
from interviews; the second one is the payment industry system identified from
literature and interviews, and the last subsection is the scenario of planning and
analyzing the studied case strategies for PPM.
Information from Interviews
We have identified different aspects of the systemic model for PPM in Iranian
financial technology industry in interviews, which are as follows:
Rapid technological advance: Technological changes in this industry are
very rapid and there is no distinct roadmap for technology management.
Therefore, the technology trend is a volatile variable for the PPM system,
which should be considered.
Industry structure: Regulation in financial technology of Iran is somehow
complex and is a barrier for business development. The regulatory
department provides rules for operations and prohibits many innovative
approaches, which limited the innovation cycle for this industry.
Marketing: Because of the last issue, marketing and especially
advertisement is a critical subject for competition in this industry and
makes them dependent on the advertisement. Consequently, the market
high prices are sensitive.
Players: There are many active players in this industry and every huge and
small company in Iran want to provide financial technology services,
especially payment services. As a result, the distinction between services
and quality of service has been neglected in the market.
Human resource: Crowded industry makes the human resource a very
scarce resource in the market and financial technology industry in Iran is
one of the most competitive industries in this market for recruiting human
resources.
Wide variety of products: Many huge information technology companies in
Iran are active in financial technology and they provide many other sub-
industry services like satellite, telecom, etc.; therefore, they have a very
complex decision-making process about PPM.
65
Systemic Product Portfolio Management Modeling
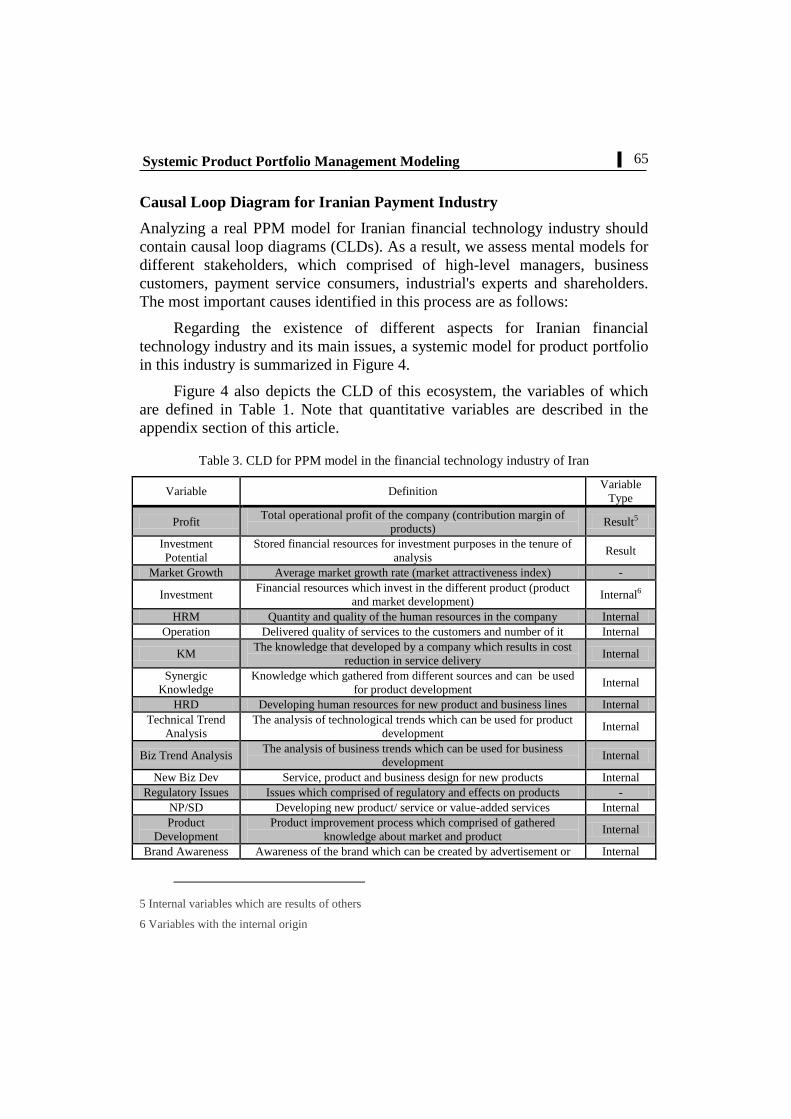
Causal Loop Diagram for Iranian Payment Industry
Analyzing a real PPM model for Iranian financial technology industry should
contain causal loop diagrams (CLDs). As a result, we assess mental models for
different stakeholders, which comprised of high-level managers, business
customers, payment service consumers, industrial's experts and shareholders.
The most important causes identified in this process are as follows:
Regarding the existence of different aspects for Iranian financial
technology industry and its main issues, a systemic model for product portfolio
in this industry is summarized in Figure 4.
Figure 4 also depicts the CLD of this ecosystem, the variables of which
are defined in Table 1. Note that quantitative variables are described in the
appendix section of this article.
Table 3. CLD for PPM model in the financial technology industry of Iran
Variable
Type Definition Variable
Result5 Total operational profit of the company (contribution margin of
products) Profit
Result Stored financial resources for investment purposes in the tenure of
analysis
Investment
Potential
- Average market growth rate (market attractiveness index) Market Growth
Internal6 Financial resources which invest in the different product (product
and market development) Investment
Internal Quantity and quality of the human resources in the company HRM
Internal Delivered quality of services to the customers and number of it Operation
Internal The knowledge that developed by a company which results in cost
reduction in service delivery KM
Internal Knowledge which gathered from different sources and can be used
for product development
Synergic
Knowledge
Internal Developing human resources for new product and business lines HRD
Internal The analysis of technological trends which can be used for product
development
Technical Trend
Analysis
Internal The analysis of business trends which can be used for business
development Biz Trend Analysis
Internal Service, product and business design for new products New Biz Dev
- Issues which comprised of regulatory and effects on products Regulatory Issues
Internal Developing new product/ service or value-added services NP/SD
Internal Product improvement process which comprised of gathered
knowledge about market and product
Product
Development
Internal Awareness of the brand which can be created by advertisement or Brand Awareness
5 Internal variables which are results of others
6 Variables with the internal origin

66
Iranian Journal of Finance, 2020, Vol. 4, No. 3 (Khakbaz, B.)
Variable
Type Definition Variable
other promotional tools
Results/
Internal
The loyalty of customers to the brand which concluded to
purchasing service from the company Brand Loyalty
- The competition power between a rival company in the industry Rivalry Force
- Market maturity and potential to growth Market Quality
Results Company’s position in the market Market Position
- Future market share (with analysis) Expected Market
Share
Results Total generated value of the product in its lifecycle Product Lifetime
Value
Results Total generated value of the company for its shareholders in long-
term
Shareholder’s
Long- Term Value
Figure 4. CLD for PPM model in financial technology ecosystem of Iran
67
Systemic Product Portfolio Management Modeling
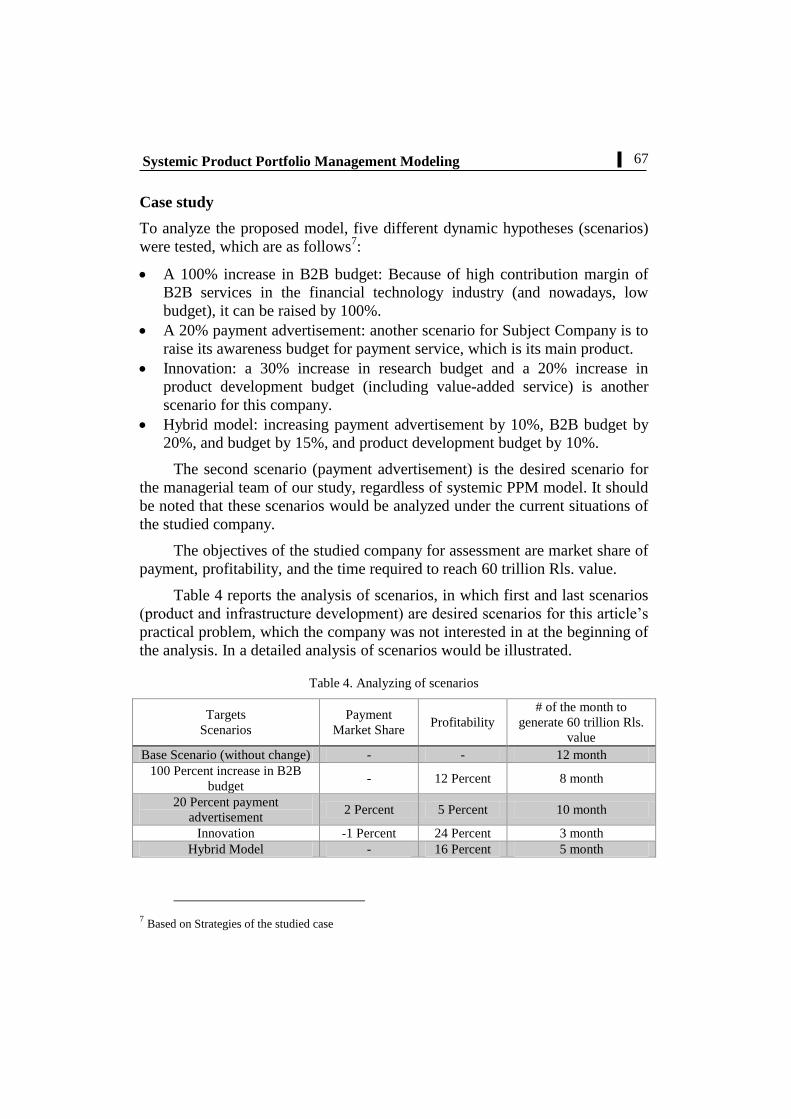
Case study
To analyze the proposed model, five different dynamic hypotheses (scenarios)
were tested, which are as follows7:
A 100% increase in B2B budget: Because of high contribution margin of
B2B services in the financial technology industry (and nowadays, low
budget), it can be raised by 100%.
A 20% payment advertisement: another scenario for Subject Company is to
raise its awareness budget for payment service, which is its main product.
Innovation: a 30% increase in research budget and a 20% increase in
product development budget (including value-added service) is another
scenario for this company.
Hybrid model: increasing payment advertisement by 10%, B2B budget by
20%, and budget by 15%, and product development budget by 10%.
The second scenario (payment advertisement) is the desired scenario for
the managerial team of our study, regardless of systemic PPM model. It should
be noted that these scenarios would be analyzed under the current situations of
the studied company.
The objectives of the studied company for assessment are market share of
payment, profitability, and the time required to reach 60 trillion Rls. value.
Table 4 reports the analysis of scenarios, in which first and last scenarios
(product and infrastructure development) are desired scenarios for this article’s
practical problem, which the company was not interested in at the beginning of
the analysis. In a detailed analysis of scenarios would be illustrated.
Table 4. Analyzing of scenarios
Targets
Scenarios
Payment
Market Share Profitability
# of the month to
generate 60 trillion Rls.
value
Base Scenario (without change) - - 12 month
100 Percent increase in B2B
budget - 12 Percent 8 month
20 Percent payment
advertisement 2 Percent 5 Percent 10 month
Innovation 1 Percent- 24 Percent 3 month
Hybrid Model - 16 Percent 5 month
7 Based on Strategies of the studied case
68
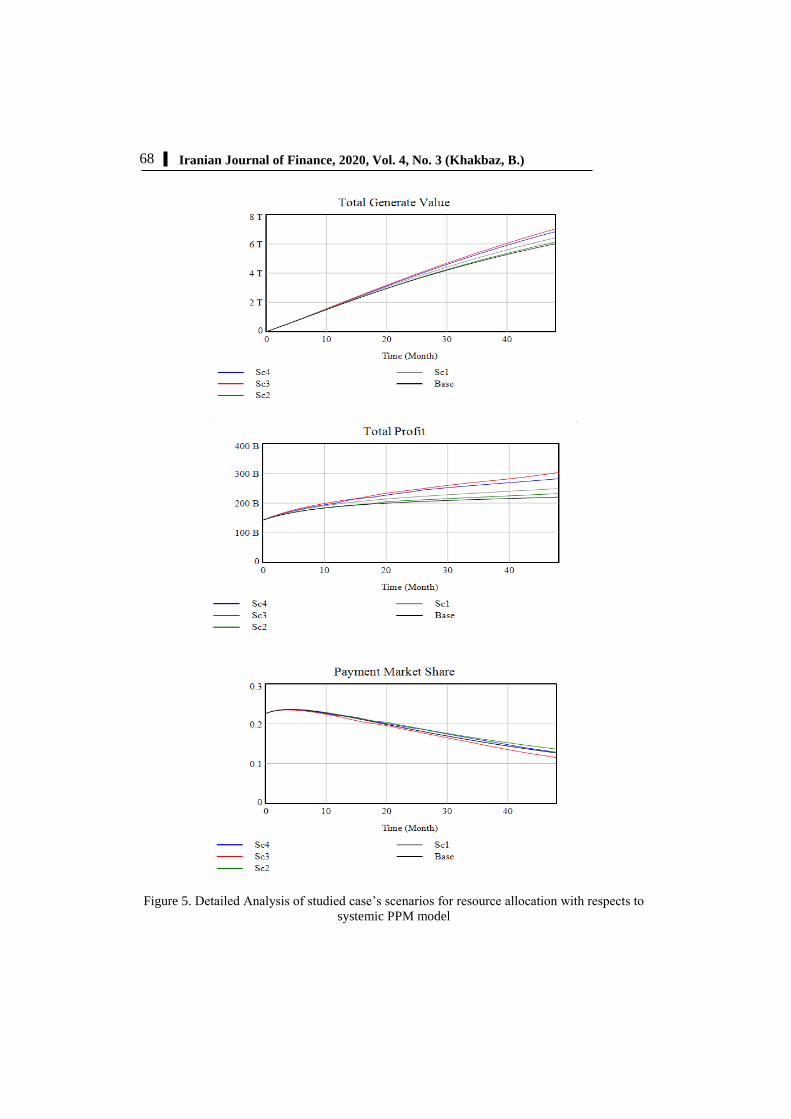
Iranian Journal of Finance, 2020, Vol. 4, No. 3 (Khakbaz, B.)
Figure 5. Detailed Analysis of studied case’s scenarios for resource allocation with respects to
systemic PPM model

69
Systemic Product Portfolio Management Modeling
Conclusion
Technological advances and business trends make industries more complicated
and dependent on each other. Therefore, active companies should serve
different customer’s requirements simultaneously, which make them corporate
with different business lines and products (Schmalensee, 2000; Villasalero,
2018). On the other hand, resources are limited and every company should
prioritize its business lines and products to serve them to the market (Kester,
Hultink, & Griffin, 2014). Under this situation, PPM is a critical issue and
should be considered in a perfect way to make organizations more sustainable
(Rothaermel, Hitt, & Jobe, 2006).
PPM is a new approach to designing a strategy for competition in today’s
volatile and competitive market (Schmalensee, 2000; Fernhaber & Patel,
2012). As described in this article, the main issue for any multi-product- the
multi-business company is managing its resource allocation for uprising
generated value of its stakeholders (Tanriverdi & Venkatraman, 2005).
Moreover, PPM can be used to reach this main objective (Chao & Kavadias,
2008; Kester, Hultink, & Griffin, 2014). Strategic alignment is another issue
for active companies, which can make them a successful or a failed company
(McNally, Durmusoglu, Calantone, & Harmancioglu, 2009). Furthermore, firm
value consists of short and long-term factors and allows balancing the best
companies (Rothaermel, Hitt, & Jobe, 2006; Eggers & Kaplan, 2009). As a
result, PPM models should provide a balance in a company and aligns it with
strategic goals of a company in the industry (Otten, Spruit, & Helms, 2015)
(Kester, Hultink, & Griffin, 2014). Therefore, product portfolios should present
different specification, the most important of which is its ability to balance
future with today’s operation, strategic alignment for organizational
development, and the potential for prioritizing products and resource allocation
model. This is the main objective of this article.
Traditional PPM models have three main limitations. Time is not included
in these models (especially when a policy should be implemented), for how
many times and how it would make results for the company. The second
limitation of traditional models is their failure to analyze a holistic portfolio
with all dependency of products to each other. Traditional models consider
every product as a standalone one, which is not practical, especially in highly
competitive industries. Another limitation is the form of analysis. All models
take everything a simple and static thing while it is not a reality especially in
highly dynamic markets (Fernhaber & Patel, 2012) (Lindstedt, Liesio, & Salo,
2008). Consequently, we proposed a systemic and holistic approach for
70
Iranian Journal of Finance, 2020, Vol. 4, No. 3 (Khakbaz, B.)
analyzing product portfolios for a competitive industry with a system dynamics
methodology.
This holistic perspective had been customized for Iranian payment
industry in a case study approach to demonstrate the power of systemic PPM
model in practice. The financial technology industry in Iran is somewhat
different from other parts of the world. Regulatory issues make this industry a
highly competitive one and players should define their strategies in a more
precise approach. As mentioned in the Literature Review section, four distinct
cycles can be proposed for modeling this industry’s product portfolio, which
are resource allocation cycle, innovation cycle, risk cycle, and development
cycle. Resource allocation cycle concentrates on how to allocate resources and
invest in different product strategies. Risk cycle refers to providing a design to
balance the value generation for the company with product policies. Innovation
and development cycle is designed to respond to market and make products
aligned with strategic objectives. This model can be used for the product
portfolio, although it should be analyzed so that the main problems of product
portfolio are handled by the proposed approach, as shown in the Results
section.
Another contribution of this article is aiming at different factors for a
systemic PPM model in the financial technology industry of Iran. As explained
in the studied case model, some factors are manageable while others cannot be
managed. Some of the unmanageable factors are causing and the others are
effects, some have more important effects and some are less important and it
can be used by active managers in this industry and also researchers in a
similar industry.
This article sought to describe the possibilities of dynamic scenario
planning for assessing product strategies of a company. Based on the results, it
can be said that dynamic modelling can be applied to making better decisions.
Moreover, the results indicated that hybrid scenarios are not preferable in
reality (the most desirable strategies for large-scale companies).
Another and last contribution of this article is identifying the importance
of feedbacks and dynamics perspectives in designing strategies. Applying this
perspective can help companies to make a better choice with known long term
effects (lots of companies can’t analyze long-term effects and thus, they only
focus on short-term effects and select their strategies with respect to the
effects). As a result, systemic modeling for product portfolios can be applied
for strategizing activities in a holistic approach.
Funding: This research received no external funding.
71
Systemic Product Portfolio Management Modeling
References
Bausch, A., & Pils, F. (2009). Product diversification strategy and financial
performance: meta-analytic evidence on causality and construct multidimensionality.
Review of Management Science, 90-157.
Blaikie, N. (2009). Designing Social Research: The Logic of Anticipation (2nd
ed.). Oxford: Polity Press.
Brown, S., & Eisenhardt, K. (1997). The art of continuous change: linking
complexity theory and time-paced evolution in relentlessly shifting organizations.
Administrative Science Quarterly, 42(1), 1-34.
Chao, R. O., & Kavadias, S. (2008). A theoretical framework for managing the
new product development portfolio: When and how to use strategic buckets.
Management Science, 54(5), 907-921.
Cooper, R. G., & Sommer, A. F. (2020). New-PPM with Agile. Research-
Technology Management.
Cooper, R. G., Edgett, S. J., & Kleinschmidt, E. J. (1999). New PPM: practices
and performance. Journal of Product Innovation Management, 16(4), 333-351.
Cooper, R. G., Edgett, S. J., & Kleinschmidt, E. J. (2004). Benchmarking Best
NPD Practices—II. Research-Technology Management, 47(3), 50-59.
Cooper, R., Edgett, S., & Kleinschmidt, E. (2000). New problems, new
solutions: making portfolio management more effective. Research-Technology
Management, 43(2), 18-33.
Eggers, J. (2012). All experience is not created equal: learning, adapting, and
focusing in PPM. Strategic Management Journal, 33(3), 315-335.
Eggers, J., & Kaplan, S. (2009). Cognition and renewal: comparing CEO and
organizational effects on incumbent adaptation to technical change. Organization
Science, 20(2), 461-477.
Fernhaber, S. A., & Patel, P. C. (2012). How do young firms manage product
portfolio complexity? The role of absorptive capacity and ambidexterity. Strategic
Management Journal, 33(13), 1516-1539.
Jugend, D., & da Silva, S. L. (2014). Product-portfolio management: A
framework based on Methods, Organization, and Strategy. Concurrent Engineering:
Research, 22(1), 17-28.
Kester, L., Hultink, E. J., & Griffin, A. (2014). An Empirical Investigation of the
Antecedents and Outcomes of NPD Portfolio Success. Journal of Product Innovation
Management, 31(6), 1199-1213.
72
Iranian Journal of Finance, 2020, Vol. 4, No. 3 (Khakbaz, B.)
Khakbaz, S. B., & Hajiheydari, N. (2015). Proposing a basic methodology for
developing balanced scorecard by the system dynamics approach. Kybernetes, 44(6/7),
1049-1066.
Killen, C., Jugdev, K., Drouin, N., & Petit, Y. (2012). Advancing Project and
Portfolio Management Research: Applying Strategic Management Theories.
International Journal of Project Management, 30(5), 325-538.
Kortelainen, S., Piirainen, K., & Tuominen, M. (2008). A System Dynamics
Model of Learning and Innovation Process Profitability. Athens, Greece: The
International Conference of the System Dynamics Society.
Lee, C.-H., Venkatraman, N., Tanriverdi, H., & Iyer, B. (2010).
Complementarity‐based hyper-competition in the software industry: Theory and
empirical test, 1990–2002. Strategic Management Journal, 31(13), 1431-1456.
Lindstedt, M., Liesio, J., & Salo, A. (2008). Participatory development of a
strategic product portfolio in a telecommunication company. International Journal of
Technology Management, 42(3), 250-265.
Markowitz, H. (1952). Portfolio selection. The Journal of Finance, 7(1), 77-91.
McKinsey & Company. (2020). McKinsey on Payments. McKinsey Insights.
McNally, R. C., Durmusoglu, S. S., Calantone, R. J., & Harmancioglu, N.
(2009). Exploring new PPM decisions: The role of managers' dispositional traits.
Journal of Product Innovation Management, 38(1), 127-143.
Merten, P. P., Reiner, L., & Wiedmann, K.-P. (1987). Portfolio simulation: a
tool to support strategic management. System Dynamics Review banner, 3(2), 81-101.
Mustonen, E., Seppänen, J., Tolonen, A., & Harkonen, J. (2019). PPM Strategic
Targets And Key Performance Indicators Over Life-Cycle – A Case Study In
Telecommunications Business. Business and Society.
Oh, J., Yang, J., & Lee, S. (2012). Managing uncertainty to improve decision-
making in NPD portfolio management with a fuzzy expert system. Expert Systems
with Application, 39(10), 9868-9885.
Otten, S., Spruit, M., & Helms, R. (2015). Towards decision analytics in PPM.
Decision Analytics, 2(4), 1-25.
Rothaermel, F. T., Hitt, M. A., & Jobe, L. A. (2006). Balancing Vertical
Integration and Strategic Outsourcing: Effects on Product Portfolio, Product Success,
and Firm Performance. Strategic Management Journal, 27(11), 1033-1056.
Schmalensee, R. (2000). Antitrust issues in Competitive industries. American
Economic Review, 99, 192-196.
Stake, R. E. (1995). The art of case study research. Thousand Oaks: SAGE
Publications.
73
Systemic Product Portfolio Management Modeling
Sterman, J. D. (2000). Business Dynamics: Systems Thinking and Modeling for a
Complex World (1st ed.). Boston, MA.: McGraw-Hill Education.
Sterman, J. D. (2001). System dynamics modeling: Tools for learning in a
complex world. California Management Review, 43(4), 8-25.
Tanriverdi, H., & Venkatraman, N. (2005). Knowledge relatedness and the
performance of multibusiness firms. Strategic Management Journal, 26(2), 97-119.
Teece, D., Pisano, G., & Shuen, A. (1997). Dynamic capabilities and strategic
management. Strategic Management Journal, 18(7), 509-533.
Tiedemann, F., Johansson, E., & Gosling, J. (2020). Structuring a new product
development process portfolio using decoupling thinking. Production Planning &
Control.
Turnbull, P. W. (1990). A review of portfolio planning models for industrial
marketing and purchasing management. European Journal of Marketing, 24(3), 7-22.
Villasalero, M. (2018). Multi-Business Firms, Knowledge Flows and Intra-
Network Open Innovations. Journal of the Knowledge Economy, 9(1), 162-179.
Voss, M. (2012). impact of customer integration on project portfolio
management and its success—developing a conceptual framework. International
Journal of Project Management, 30(5), 567-581.
W.Seifertab, R., Jean-SébastiennTancrezc, & Biçera, I. (2016). Dynamic PPM
with life cycle considerations. International Journal of Production Economics, 71-83.
Wolstenholme, E. (1998). Qualitative v. Quantitative Modelling: The Evolving
Balance. Journal of the Operational Research Society, 50(4), 422-428.
Woodside, A. (2006). Advancing systems thinking and building microworlds in
business and industrial marketing. Journal of Business and Industrial Marketing,
21(1), 24 -29.
www.shaparak.ir. (2020). Retrieved from www.shaparak.ir:
https://shaparak.ir/content?id=754
Yin, R. K. (2011). Applications of case study research (3rd ed.). SAGE
Publications, Inc.
74
Iranian Journal of Finance, 2020, Vol. 4, No. 3 (Khakbaz, B.)
Bibliographic information of this paper for citing:
Khakbaz, Seyed Behnam; Shahhoseini, Mohammad Ali; Divandari, Ali & Rabiee,
Hamidreza (2020). Systemic Product Portfolio Management Modeling for Iranian
Financial Technology Industry. Iranian Journal of Finance, 4(3), 49-79.
Copyright © 2020, Seyed Behnam Khakbaz, Mohammad Ali Shahhoseini, Ali
Divandari and Hamidreza Rabiee
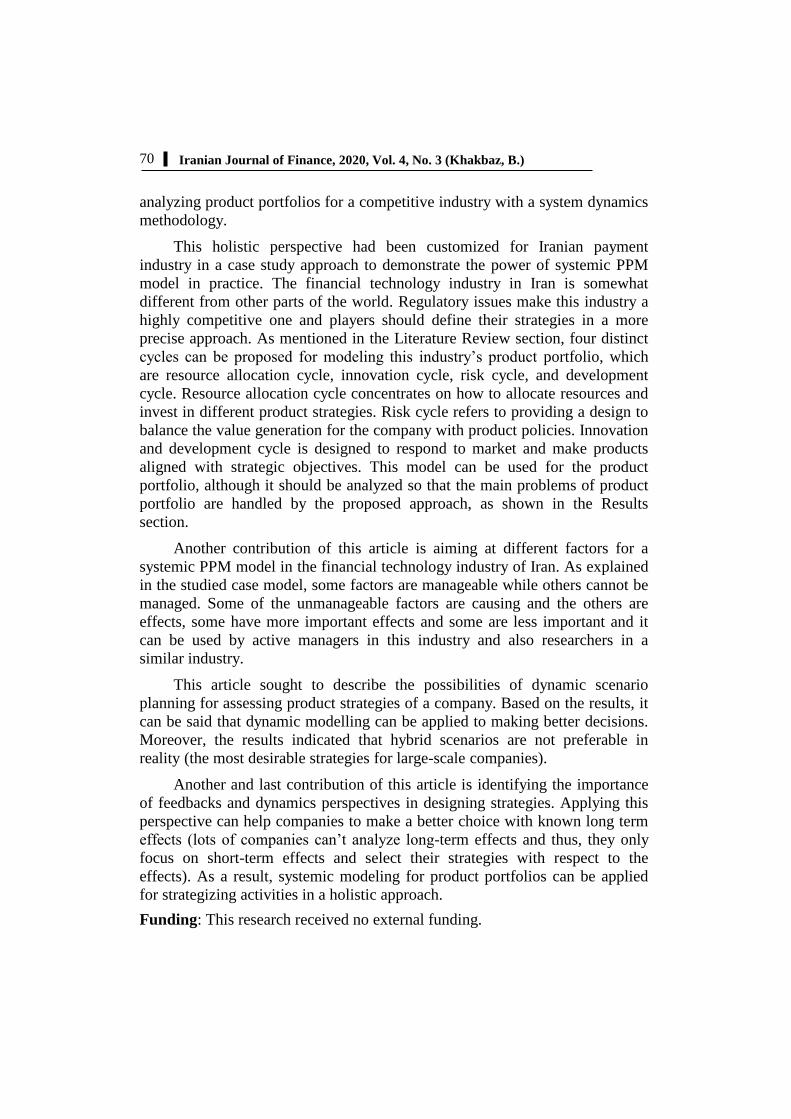
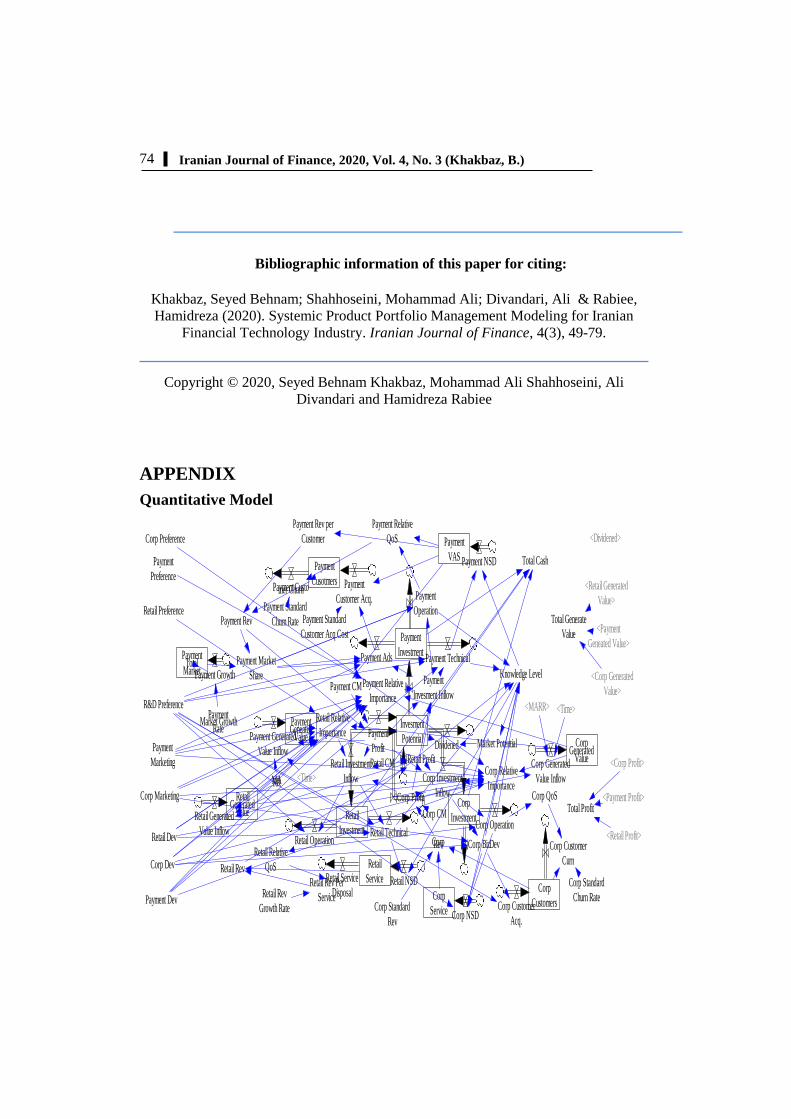
APPENDIX
Quantitative Model
Invesment
PotenrialPayment
Profit Dividened
Payment
Investment
Payment
Invesment Inflow
Payment Ads
Payment
Operation
Payment Technical
Payment
VAS Payment NSDPayment
Cusotmers Payment
Customer Acq.Payment Customer Churn
Payment Standard
Churn Rate Payment Standard
Customer Acq Cost
Payment Rev per
Customer
Payment Rev
Payment Market
SharePayment CM
Knowledge Level
PaymentGeneated
ValuePayment Generated
Value Inflow
MARR
PaymentMarket Growth
Rate
PaymentTotal
MarketPayment Growth
Market Potential
Payment Relative
QoS
Payment Relative
ImportanceR&D Preference
<Time>
Retail Profit
Retail
Investment
Retail Investment
Inflow
Retail TechnicalRetail Operation
Retail
Service Retail NSD
Retail Relative
QoS
Retail Rev Per
Service
Retail Rev
RetailGenerated
ValueRetail Generated
Value Inflow
Retail CM
Retail Relative
Importance
Retail Service
DisposalRetail Rev
Growth Rate
<Dividened>
<Payment
Geneated Value>
<Retail Generated
Value>
Corp
Investment
Corp Investment
InflowCorp Profit
Corp Relative
Importance
Corp Operation
Corp BizDev
Corp
Service
Corp
CustomersCorp NSD
Corp Customer
Acq.
Corp Customer
Curn
Corp QoS
Corp Standard
Churn RateCorp Standard
Rev
CorpRev
Corp CM
CorpGenerated
ValueCorp Generated
Value Inflow
<MARR> <Time>
Corp Preference
Payment
Preference
Retail Preference
<Corp Generated
Value>
Total Generate
Value
<Corp Profit>
<Payment Profit>
<Retail Profit>
Total Profit
Total Cash
Payment
Marketing
Corp Marketing
Retail Dev
Corp Dev
Payment Dev

75
Systemic Product Portfolio Management Modeling
Business Services Section
(01) Corp BizDev=SQRT(Corp Dev*Corp Marketing)*0.6*Corp Investment
Inflow
(02) Corp CM= 0.3
(03) "Corp Customer Acq."= DELAY1(INTEGER( "R&D
Preference"*Corp BizDev/1e+09), 6)
(04) Corp Customer Curn=DELAY3( INTEGER( Corp Standard Churn
Rate/Corp QoS*Corp Customers), 4)
(05) Corp Customers= INTEG ("Corp Customer Acq."-Corp Customer
Curn,500)
(06) Corp Dev= 1 [0.1,2,0.1]
(07) Corp Generated Value= INTEG (Corp Generated Value Inflow,1)
(08) Corp Generated Value Inflow=Corp Profit/((1+MARR)^Time)
(09) Corp Investment= INTEG (Corp Investment Inflow-Corp BizDev-Corp
Operation,1e+10)
(10) Corp Investment Inflow=DELAY3( (Retail Profit+Payment Profit+Corp
Profit)*Corp Relative Importance, 12)
(11) Corp Marketing= 1 [0.1,2,0.1]
(12) Corp NSD=INTEGER( DELAY1( INTEGER( ("R&D
Preference"*Knowledge Level*Corp BizDev+Knowledge Level*Corp
Operation)/(10*1e+12)), 12))
(13) Corp Operation= Corp Dev*0.4*Corp Investment Inflow
(14) Corp Preference= 1
(15) Corp Profit=Corp CM*Corp Rev
(16) Corp QoS= LOG (Corp Operation/1e+10,10)/100+1
(17) Corp Relative Importance=((Corp Dev+Corp Marketing)/(Corp
Dev+Corp Marketing+Payment Dev+Payment Marketing+2*Retail
Dev))*Corp Preference*Corp Generated Value/(Corp Generated
Value+Payment Geneated Value+Retail Generated Value)
(18) Corp Rev= Corp Customers*Corp Service*Corp Standard Rev
(19) Corp Service= INTEG ( Corp NSD, 2)
76
Iranian Journal of Finance, 2020, Vol. 4, No. 3 (Khakbaz, B.)
(20) Corp Standard Churn Rate= 0.01
(21) Corp Standard Rev=2e+07
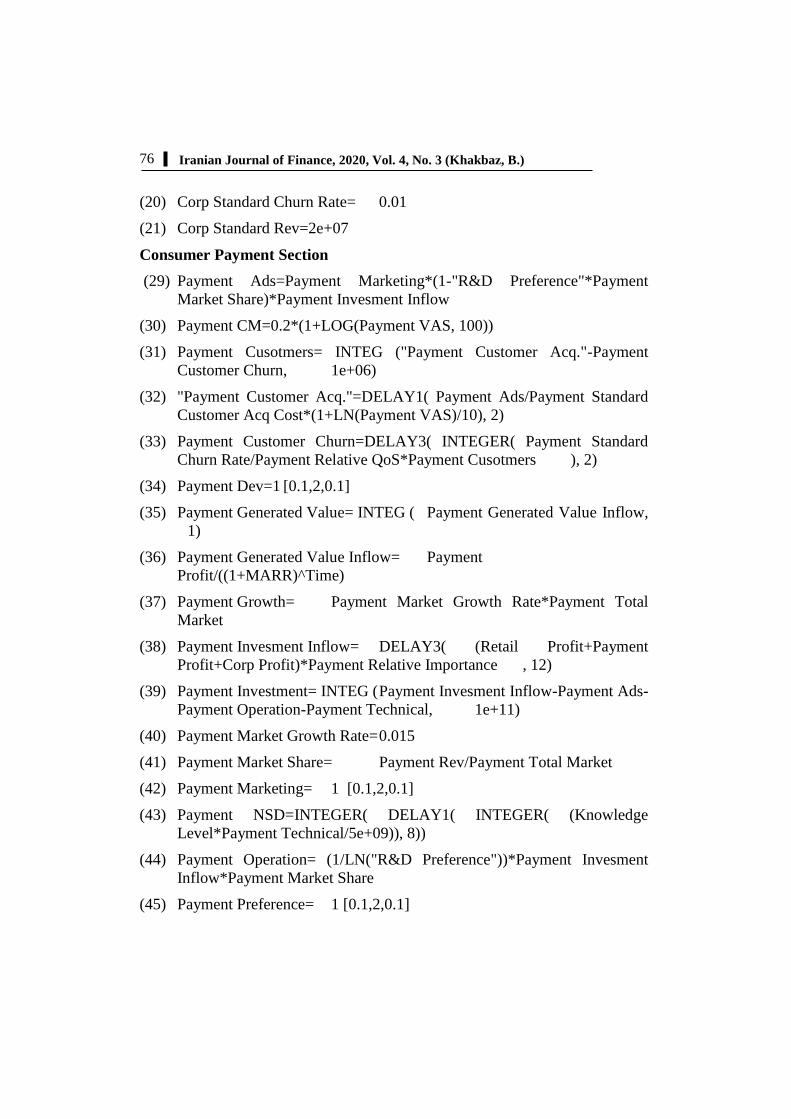
Consumer Payment Section
(29) Payment Ads=Payment Marketing*(1-"R&D Preference"*Payment
Market Share)*Payment Invesment Inflow
(30) Payment CM=0.2*(1+LOG(Payment VAS, 100))
(31) Payment Cusotmers= INTEG ("Payment Customer Acq."-Payment
Customer Churn, 1e+06)
(32) "Payment Customer Acq."=DELAY1( Payment Ads/Payment Standard
Customer Acq Cost*(1+LN(Payment VAS)/10), 2)
(33) Payment Customer Churn=DELAY3( INTEGER( Payment Standard
Churn Rate/Payment Relative QoS*Payment Cusotmers ), 2)
(34) Payment Dev=1 [0.1,2,0.1]
(35) Payment Generated Value= INTEG ( Payment Generated Value Inflow,
1)
(36) Payment Generated Value Inflow= Payment
Profit/((1+MARR)^Time)
(37) Payment Growth= Payment Market Growth Rate*Payment Total
Market
(38) Payment Invesment Inflow= DELAY3( (Retail Profit+Payment
Profit+Corp Profit)*Payment Relative Importance , 12)
(39) Payment Investment= INTEG ( Payment Invesment Inflow-Payment Ads-
Payment Operation-Payment Technical, 1e+11)
(40) Payment Market Growth Rate= 0.015
(41) Payment Market Share= Payment Rev/Payment Total Market
(42) Payment Marketing= 1 [0.1,2,0.1]
(43) Payment NSD=INTEGER( DELAY1( INTEGER( (Knowledge
Level*Payment Technical/5e+09)), 8))
(44) Payment Operation= (1/LN("R&D Preference"))*Payment Invesment
Inflow*Payment Market Share
(45) Payment Preference= 1 [0.1,2,0.1]

77
Systemic Product Portfolio Management Modeling
(46) Payment Profit= Payment CM*Payment Rev
(47) Payment Relative Importance=((Payment Dev+Payment
Marketing)/(Corp Dev+Corp Marketing+Payment Dev+Payment
Marketing +2*Retail Dev))*Payment Preference*Payment
Geneated Value/(Payment Geneated Value +Retail Generated
Value+Corp Generated Value)
(48) Payment Relative QoS= LOG (Payment Operation*Payment
VAS/1e+10,10)/100+1
(49) Payment Rev=Payment Cusotmers*Payment Rev per Customer
(50) Payment Rev per Customer= 350000*(1+LOG(Payment VAS,5))
(51) Payment Standard Churn Rate=0.01
(52) Payment Standard Customer Acq Cost=1e+07
(53) Payment Technical= Payment Dev*LN( "R&D Preference")*Payment
Market Share*Payment Invesment Inflow
(54) Payment Total Market= INTEG (Payment Growth,1.5e+12)
(55) Payment VAS= INTEG (Payment NSD, 1)
Account-Based Services (Retail) Section
(57) Retail CM= 0.2
(58) Retail Dev=1 [0.1,2,0.1]
(59) Retail Generated Value= INTEG (Retail Generated Value Inflow,1)
(60) Retail Generated Value Inflow=Retail Profit/((1+MARR)^Time)
(61) Retail Investment= INTEG ( Retail Investment Inflow-Retail
Operation-Retail Technical, 1e+11)
(62) Retail Investment Inflow= DELAY3( (Retail Profit+Payment
Profit+Corp Profit)*Retail Relative Importance , 12)
(63) Retail NSD=INTEGER( DELAY1( INTEGER( (Knowledge
Level*Retail Technical/3e+09)), 12))
(64) Retail Operation=(1/LOG( "R&D Preference",10))*Retail Investment
Inflow/10
(65) Retail Preference=1 [0.1,2,0.1]
(66) Retail Profit=Retail CM*Retail Rev
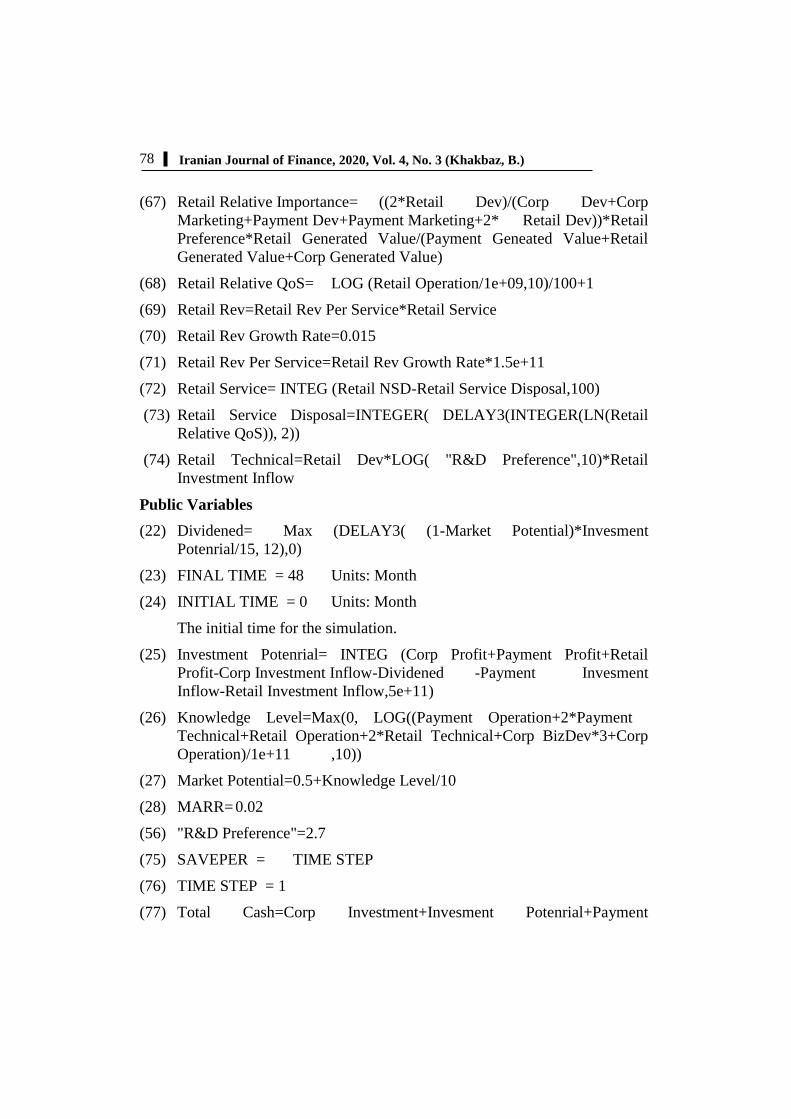
78
Iranian Journal of Finance, 2020, Vol. 4, No. 3 (Khakbaz, B.)
(67) Retail Relative Importance= ((2*Retail Dev)/(Corp Dev+Corp
Marketing+Payment Dev+Payment Marketing+2* Retail Dev))*Retail
Preference*Retail Generated Value/(Payment Geneated Value+Retail
Generated Value+Corp Generated Value)
(68) Retail Relative QoS= LOG (Retail Operation/1e+09,10)/100+1
(69) Retail Rev=Retail Rev Per Service*Retail Service
(70) Retail Rev Growth Rate=0.015
(71) Retail Rev Per Service=Retail Rev Growth Rate*1.5e+11
(72) Retail Service= INTEG (Retail NSD-Retail Service Disposal,100)
(73) Retail Service Disposal=INTEGER( DELAY3(INTEGER(LN(Retail
Relative QoS)), 2))
(74) Retail Technical=Retail Dev*LOG( "R&D Preference",10)*Retail
Investment Inflow
Public Variables
(22) Dividened= Max (DELAY3( (1-Market Potential)*Invesment
Potenrial/15, 12),0)
(23) FINAL TIME = 48 Units: Month
(24) INITIAL TIME = 0 Units: Month
The initial time for the simulation.
(25) Investment Potenrial= INTEG (Corp Profit+Payment Profit+Retail
Profit-Corp Investment Inflow-Dividened -Payment Invesment
Inflow-Retail Investment Inflow,5e+11)
(26) Knowledge Level=Max(0, LOG((Payment Operation+2*Payment
Technical+Retail Operation+2*Retail Technical+Corp BizDev*3+Corp
Operation)/1e+11 ,10))
(27) Market Potential=0.5+Knowledge Level/10
(28) MARR= 0.02
(56) "R&D Preference"=2.7
(75) SAVEPER = TIME STEP
(76) TIME STEP = 1
(77) Total Cash=Corp Investment+Invesment Potenrial+Payment

79
Systemic Product Portfolio Management Modeling
Investment+Retail Investment
(78) Total Generate Value= Corp Generated Value+Payment Geneated
Value+Retail Generated Value
(79) Total Profit=Corp Profit+Payment Profit+Retail Profit