dynamic tiering – taking advantage of the best of hdds and
TRANSCRIPT
Dynamic Tiering –y gTaking Advantage of the Best of HDDs and Solid StateHDDs and Solid StateAVERE SYSTEMS, INCaveresystems comaveresystems.com
April 12, 2010
R Bi hi i CEO d P id t
0
Ron Bianchini, CEO and President
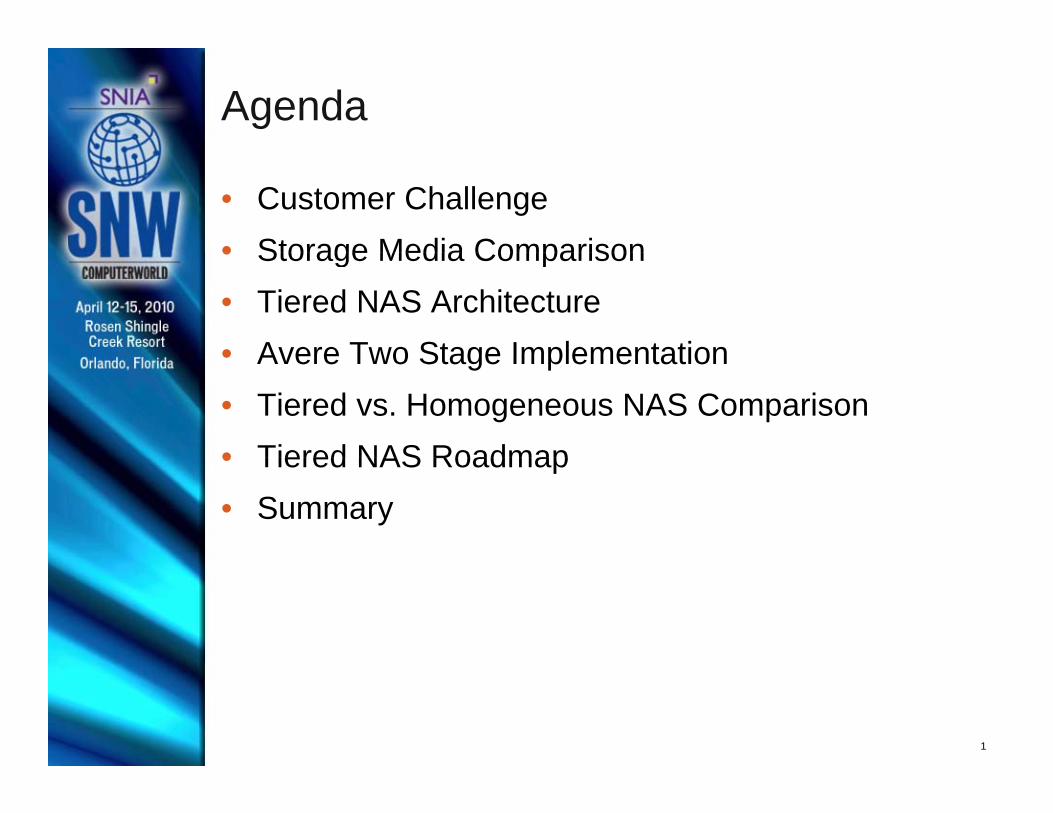
Agenda
• Customer Challenge• Storage Media Comparison• Storage Media Comparison• Tiered NAS Architecture• Avere Two Stage Implementation• Avere Two Stage Implementation• Tiered vs. Homogeneous NAS Comparison• Tiered NAS Roadmap• Tiered NAS Roadmap• Summary
1

Customer Challenge
• Hard disk drives (HDDs) are getting bigger not faster
• Many costly 15k RPM drives required to achieve performancey y q p
• Challenging due to budget, power, cooling, floor space constraints
L SSD b t t l ti i d• Leverage SSD, but current solutions are expensive and incomplete
Track Linear Density (bpi)
Track Density (tpi)
A l D it
Sector
Platters
Areal Density
2
Platters
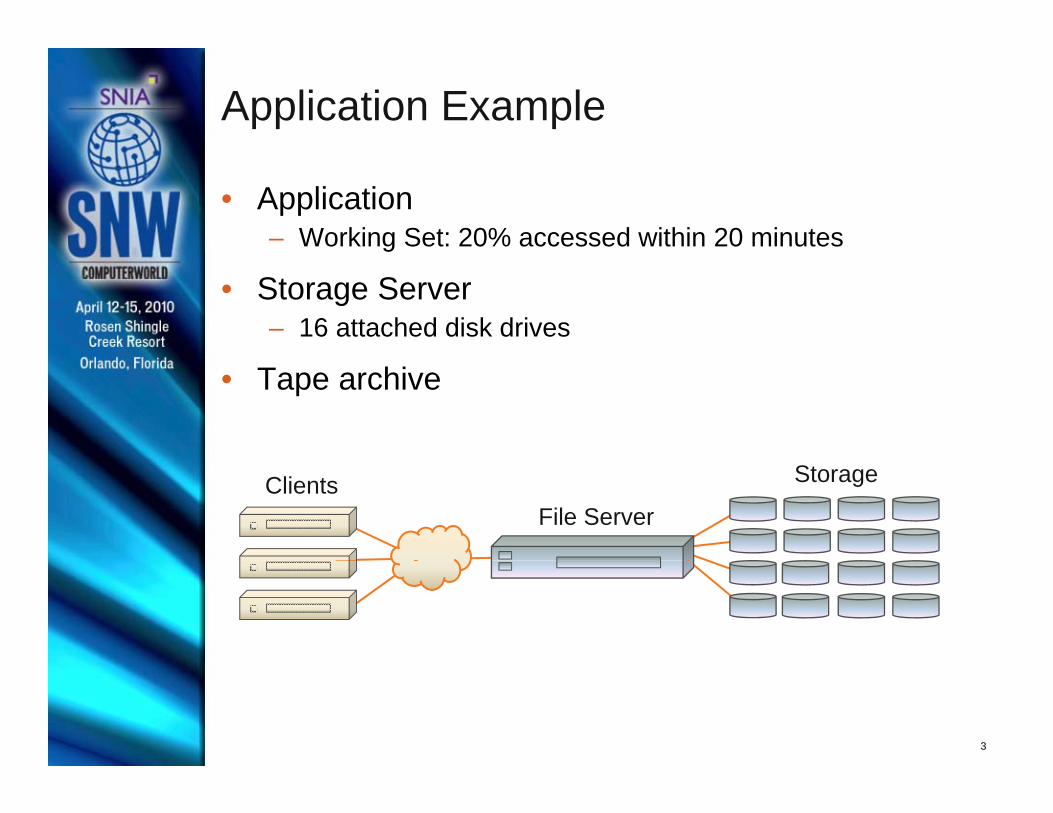
Application Example
• Application– Working Set: 20% accessed within 20 minutes
• Storage Server– 16 attached disk drives
• Tape archive
ClientsFile Server
Storage
3
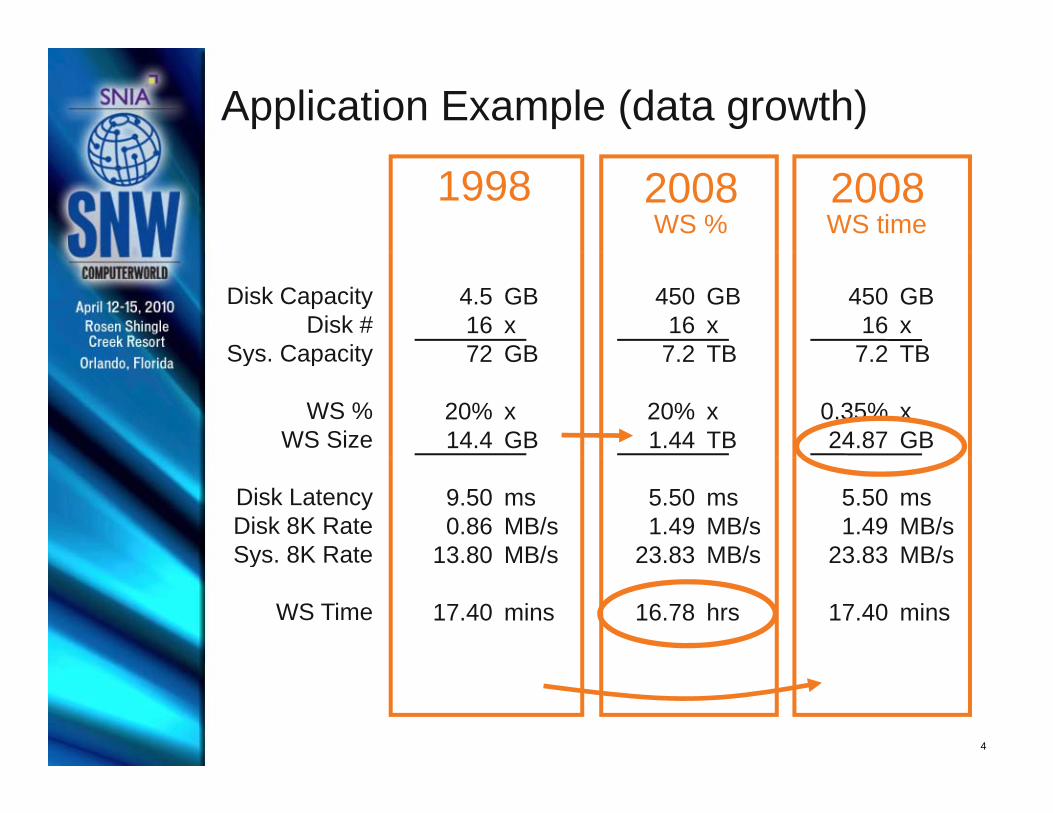
Application Example (data growth)
1998 2008WS %
2008WS time
4.51672
GBxGB
450167 2
GBxTB
450167 2
GBxTB
Disk CapacityDisk #
Sys Capacity 72
20%14.4
GB
xGB
7.2
20%1.44
TB
xTB
7.2
0.35%24.87
TB
xGB
Sys. Capacity
WS %WS Size
9.500.86
13.80
msMB/sMB/s
5.501.49
23.83
msMB/sMB/s
5.501.49
23.83
msMB/sMB/s
Disk LatencyDisk 8K RateSys. 8K Rate 13.80
17.40
MB/s
mins
23.83
16.78
MB/s
hrs
23.83
17.40
MB/s
mins
Sys. 8K Rate
WS Time
4
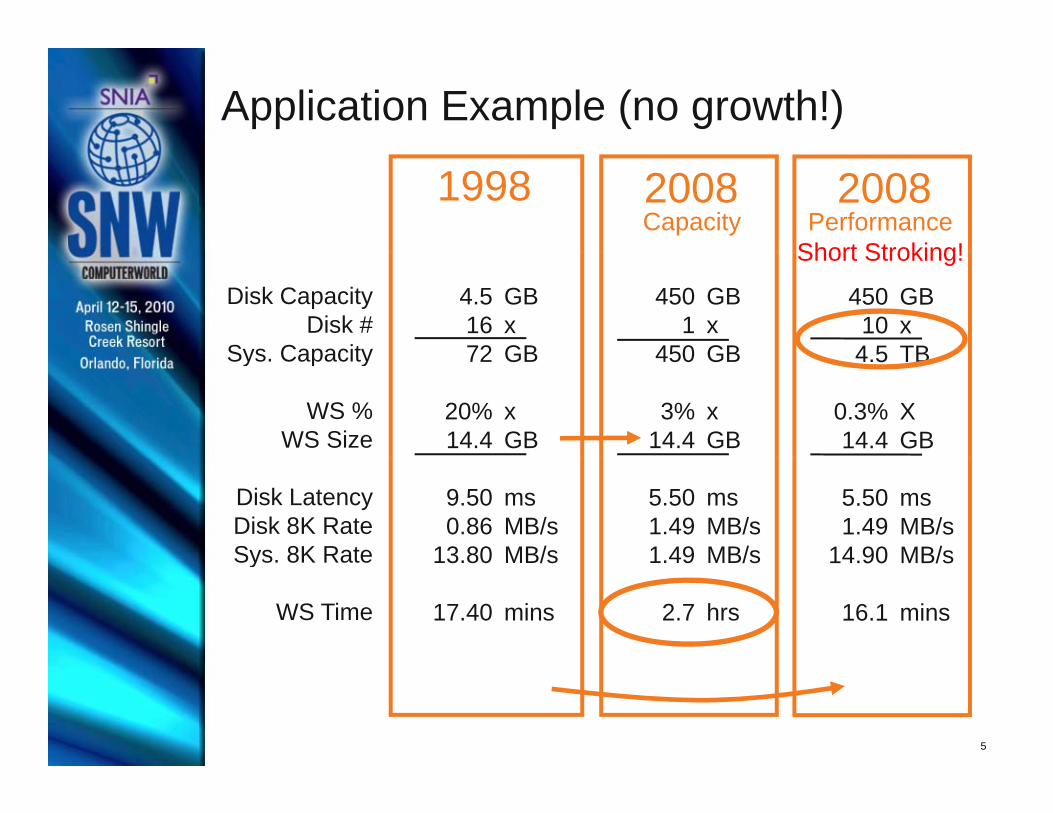
Application Example (no growth!)
1998 2008Capacity
2008Performance
Short Stroking!
4.51672
GBxGB
4501
450
GBxGB
450104 5
GBxTB
Short Stroking!
Disk CapacityDisk #
Sys Capacity 72
20%14.4
GB
xGB
450
3%14.4
GB
xGB
4.5
0.3%14.4
TB
XGB
Sys. Capacity
WS %WS Size
9.500.86
13.80
msMB/sMB/s
5.501.491.49
msMB/sMB/s
5.501.49
14 90
msMB/sMB/s
Disk LatencyDisk 8K RateSys. 8K Rate 13.80
17.40
MB/s
mins
1.49
2.7
MB/s
hrs
14.90
16.1
MB/s
mins
Sys. 8K Rate
WS Time
5
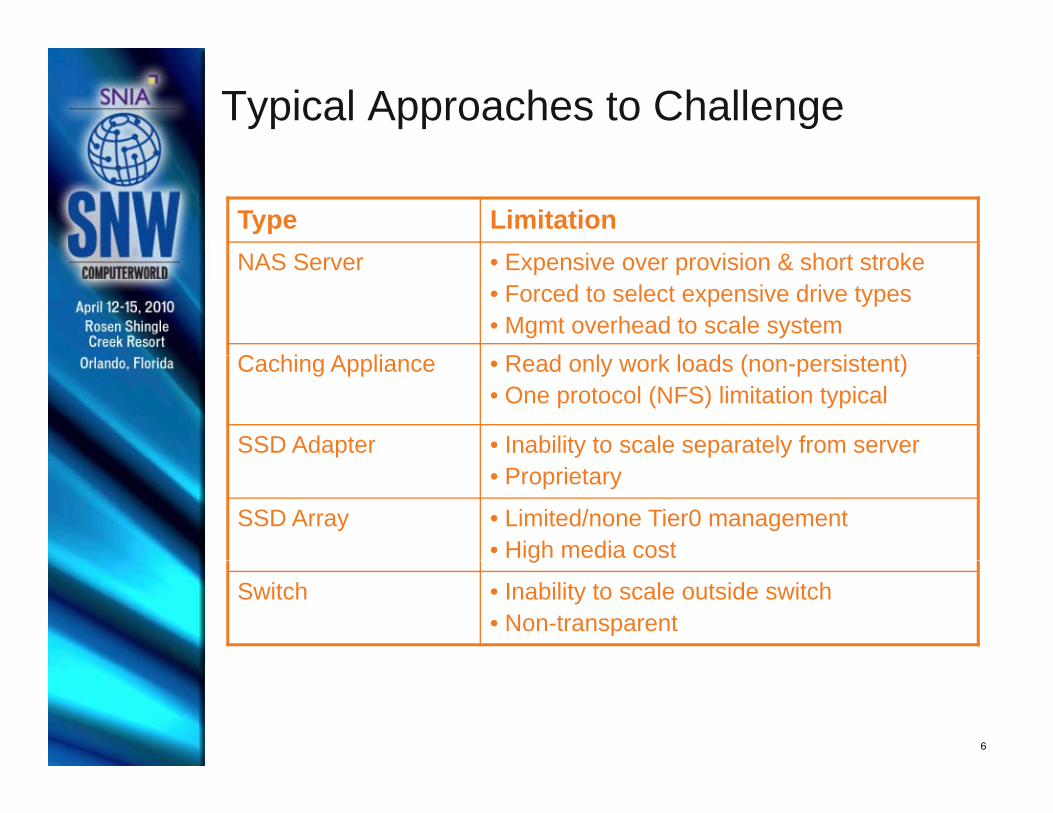
Typical Approaches to Challenge
Type LimitationS S &NAS Server • Expensive over provision & short stroke
• Forced to select expensive drive types• Mgmt overhead to scale system
C hi A li R d l k l d ( i t t)Caching Appliance • Read only work loads (non-persistent)• One protocol (NFS) limitation typical
SSD Adapter • Inability to scale separately from server• Proprietary
SSD Array • Limited/none Tier0 management• High media costg
Switch • Inability to scale outside switch• Non-transparent
6
Historical Approach: Evolutionary
• Industry following evolutionary path– Denser disk drives, reduced access density– Increase data management needed– Increase performance via over provisioning & caching
St t f t h• Start from scratch– Start with specification of NAS Server– Consider media to satisfy performance requirements– Identify allocation algorithms to map data to media
7
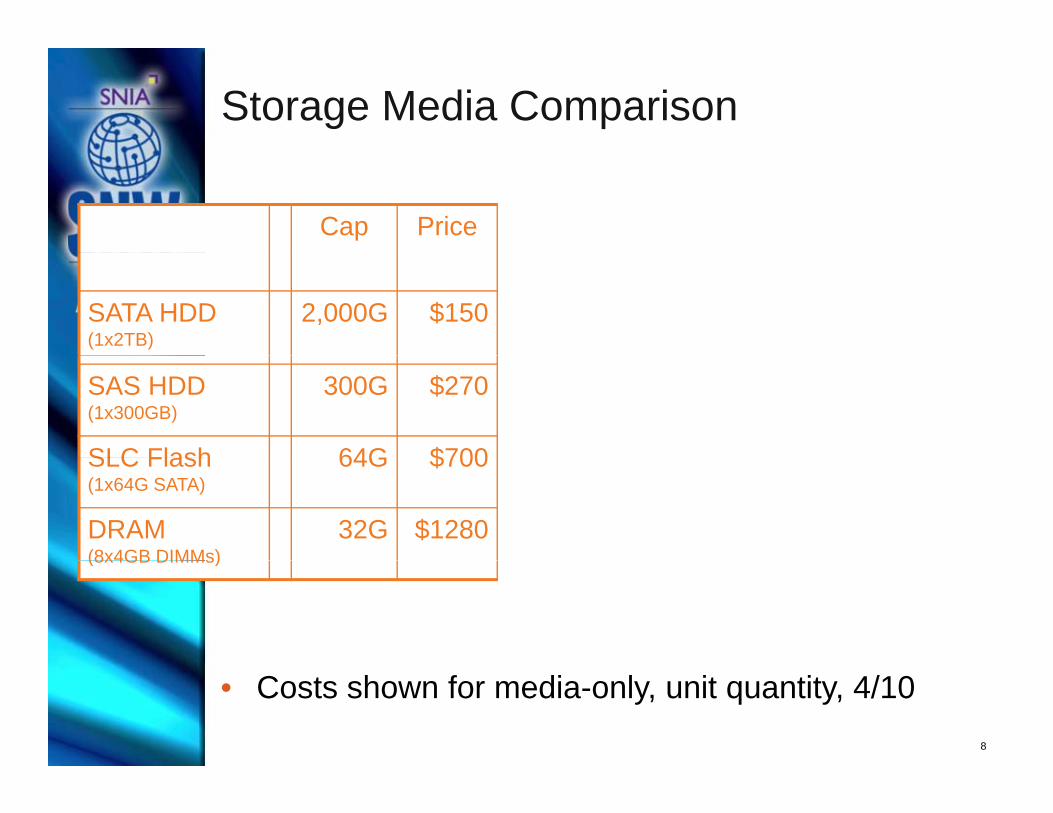
Storage Media Comparison
Cap Price
SATA HDD (1x2TB)
2,000G $150
SAS HDD (1x300GB)
300G $270
SLC Flash 64G $700SLC Flash (1x64G SATA)
64G $700
DRAM (8x4GB DIMMs)
32G $1280(8x4GB DIMMs)
• Costs shown for media-only, unit quantity, 4/108
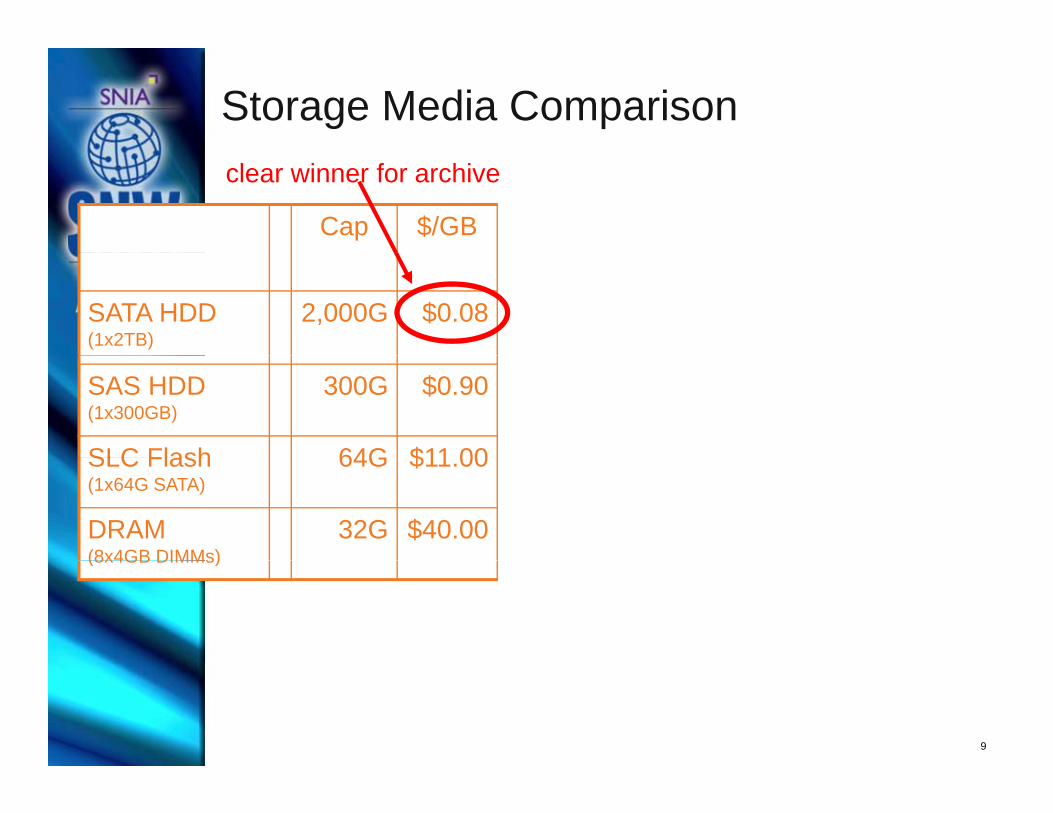
Storage Media Comparison
Cap $/GB
clear winner for archive
SATA HDD (1x2TB)
2,000G $0.08
SAS HDD (1x300GB)
300G $0.90
SLC Flash 64G $11 00SLC Flash (1x64G SATA)
64G $11.00
DRAM (8x4GB DIMMs)
32G $40.00(8x4GB DIMMs)
9
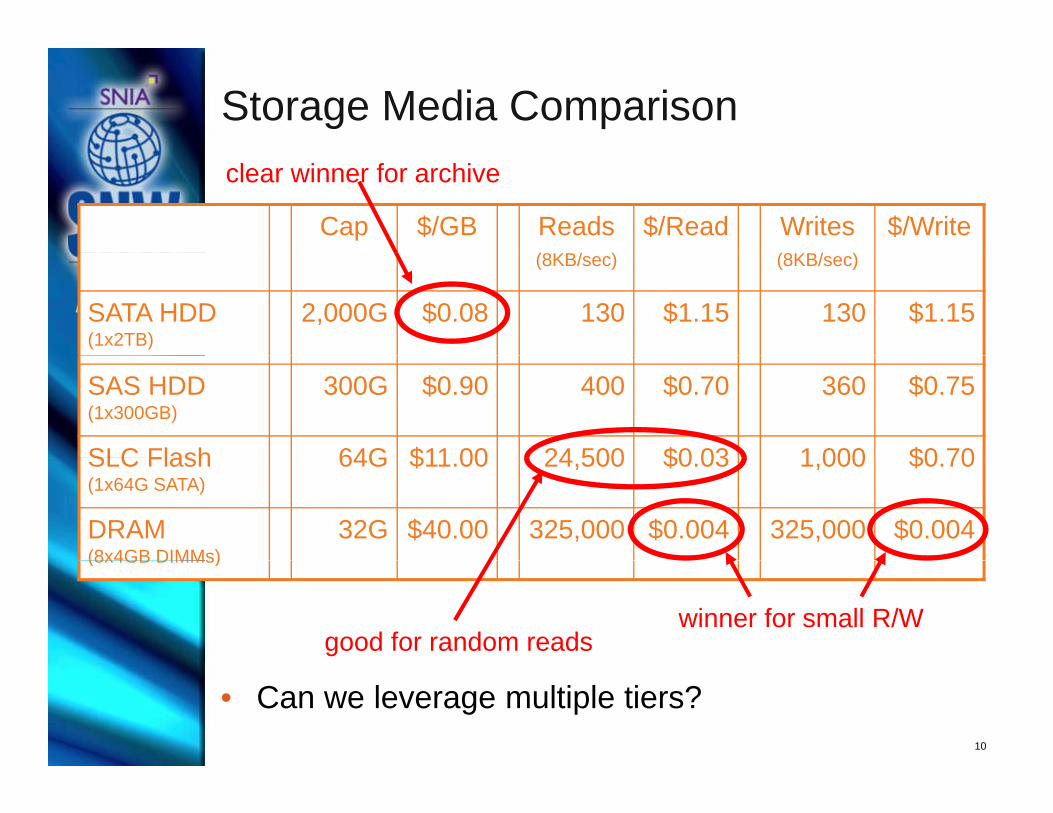
Storage Media Comparison
Cap $/GB Reads(8KB/ )
$/Read Writes(8KB/ )
$/Write
clear winner for archive
(8KB/sec) (8KB/sec)
SATA HDD (1x2TB)
2,000G $0.08 130 $1.15 130 $1.15
SAS HDD (1x300GB)
300G $0.90 400 $0.70 360 $0.75
SLC Flash 64G $11 00 24 500 $0 03 1 000 $0 70SLC Flash (1x64G SATA)
64G $11.00 24,500 $0.03 1,000 $0.70
DRAM (8x4GB DIMMs)
32G $40.00 325,000 $0.004 325,000 $0.004(8x4GB DIMMs)
winner for small R/Wgood for random reads
• Can we leverage multiple tiers?10
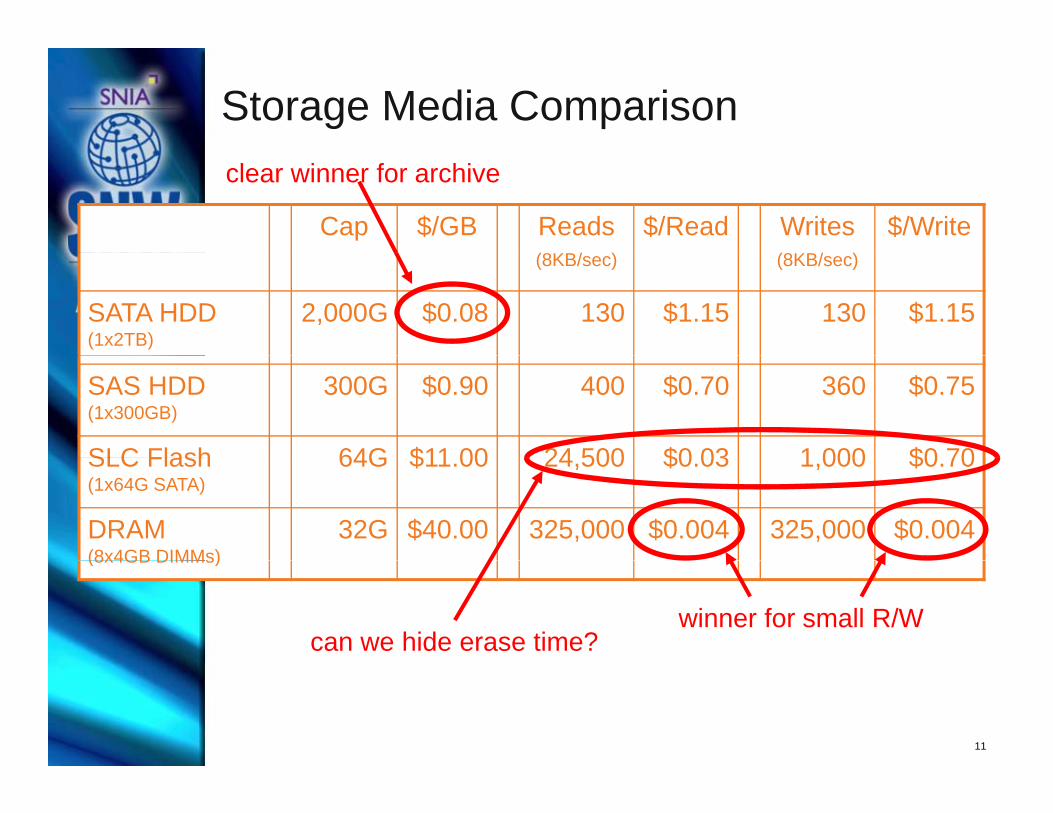
Storage Media Comparison
Cap $/GB Reads(8KB/ )
$/Read Writes(8KB/ )
$/Write
clear winner for archive
(8KB/sec) (8KB/sec)
SATA HDD (1x2TB)
2,000G $0.08 130 $1.15 130 $1.15
SAS HDD (1x300GB)
300G $0.90 400 $0.70 360 $0.75
SLC Flash 64G $11 00 24 500 $0 03 1 000 $0 70SLC Flash (1x64G SATA)
64G $11.00 24,500 $0.03 1,000 $0.70
DRAM (8x4GB DIMMs)
32G $40.00 325,000 $0.004 325,000 $0.004(8x4GB DIMMs)
winner for small R/Wcan we hide erase time?
11

Storage Media Comparison
Cap $/GB Reads(8KB/ )
$/Read Writes(8KB/ )
$/Write
clear winner for archive can we hide access latency?
(8KB/sec) (8KB/sec)
SATA HDD (1x2TB)
2,000G $0.08 130 $1.15 130 $1.15
SAS HDD (1x300GB)
300G $0.90 400 $0.70 360 $0.75
SLC 2M write buf 64G $11 00 24 500 $0 03 4 200 $0 16SLC 2M write buf(1x64G SATA)
64G $11.00 24,500 $0.03 4,200 $0.16
DRAM (8x4GB DIMMs)
32G $40.00 325,000 $0.004 325,000 $0.004(8x4GB DIMMs)
good for random accesswinner for small R/W
12
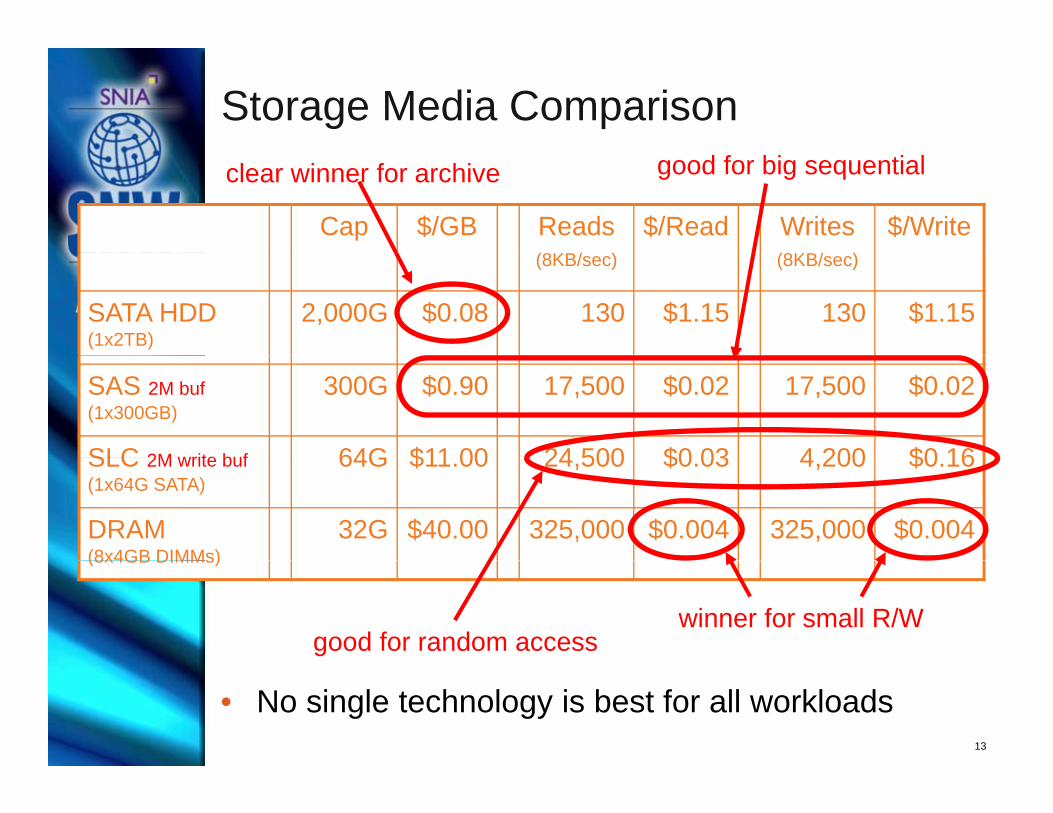
Storage Media Comparison
Cap $/GB Reads(8KB/ )
$/Read Writes(8KB/ )
$/Write
clear winner for archive good for big sequential
(8KB/sec) (8KB/sec)
SATA HDD (1x2TB)
2,000G $0.08 130 $1.15 130 $1.15
SAS 2M buf(1x300GB)
300G $0.90 17,500 $0.02 17,500 $0.02
SLC 2M write buf 64G $11 00 24 500 $0 03 4 200 $0 16SLC 2M write buf (1x64G SATA)
64G $11.00 24,500 $0.03 4,200 $0.16
DRAM (8x4GB DIMMs)
32G $40.00 325,000 $0.004 325,000 $0.004(8x4GB DIMMs)
good for random accesswinner for small R/W
• No single technology is best for all workloads13
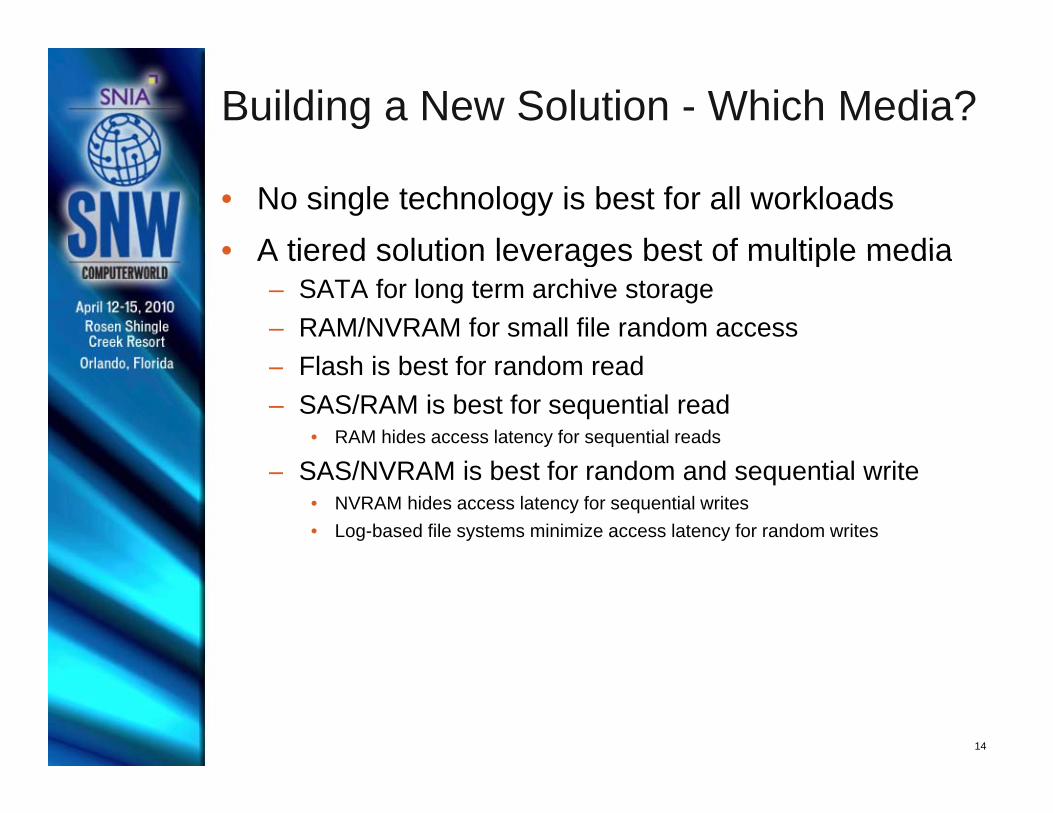
Building a New Solution - Which Media?
• No single technology is best for all workloads• A tiered solution leverages best of multiple media• A tiered solution leverages best of multiple media
– SATA for long term archive storage– RAM/NVRAM for small file random access– Flash is best for random read– SAS/RAM is best for sequential read
• RAM hides access latency for sequential reads
– SAS/NVRAM is best for random and sequential write• NVRAM hides access latency for sequential writes• Log-based file systems minimize access latency for random writes
14

Storage Media Comparison Summary
Small LargeR d
LargeS ti lRandom Sequential
Archiva SATA SATA SATAl SATA SATA SATA
Read RAM SSD SAS
Write RAM SAS SAS
15

Current NAS Systems
• All NAS operations onhomogeneous storage
dir1 m-ddirectory opsto find a file
g g– Data/meta-data
file1 m-d
file1 data
sequentialfile read
• Drive array defines capacityand performanceC it ( l tt ) file2 m-d• Capacity (platters)– add drives
• Performance (arms)
file2 data
file2 m-drandom
file writes
• Performance (arms)– choose FC vs SATA– add drives
h t t k
file3 m-d
file3 dataPerformance
• short stroke
16
HomogeneousDisk Storage
Capacity

Tiered NAS Architecture
dir1 m-dUtilize storage
media of variousaccess densities
Identifyfrequentlyaccessed
data
dir1 m-d
file1 m-d
file1 data
Distribute activedata to
Appropriate
file1 m-d
file1 data
file2 m-d
Appropriate mediaMatch
data access frequencyto media access density
RAM
file2 m-d
file2 data
file2 m-dfile2 m-d
file3 m-d
file3 data
PerformanceDisk
FlashBattery-backed
RAM
17
Mass Storage
increasing access density
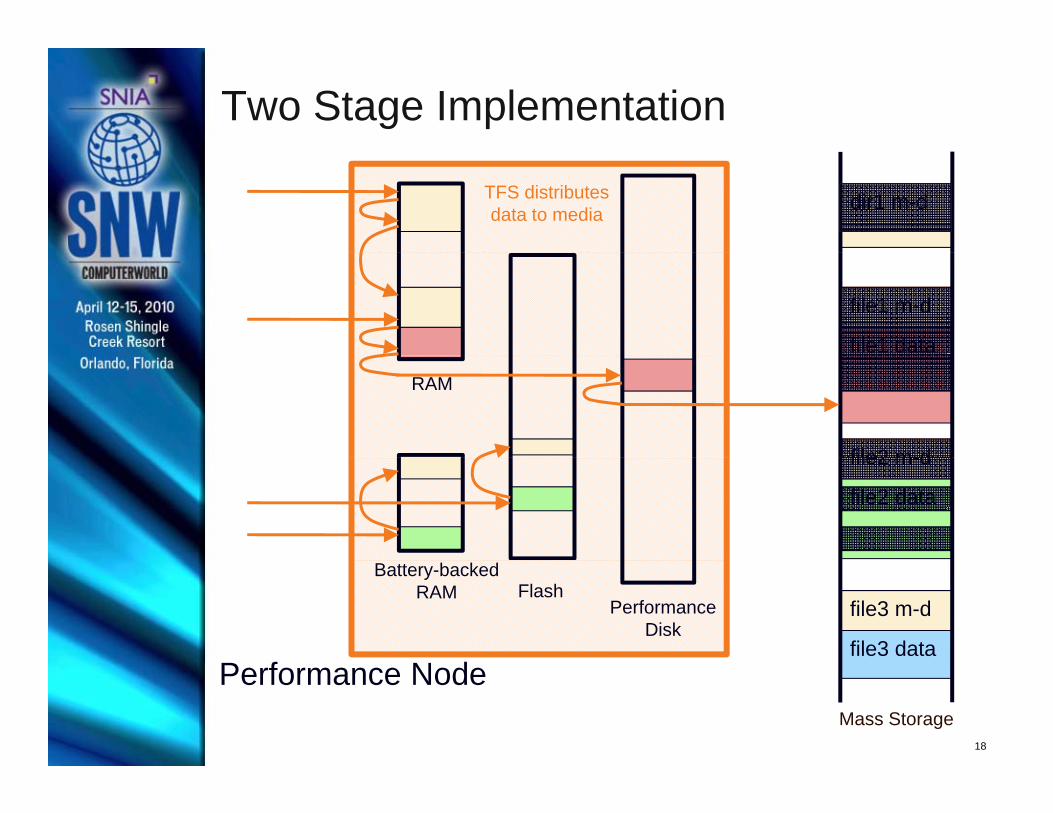
Two Stage Implementation
dir1 m-dTFS distributesdata to media
file1 m-d
file1 data
file2 m-d
RAM
file2 data
file2 m-d
file3 m-d
file3 dataP f N d
PerformanceDisk
FlashBattery-backed
RAM
18
Performance NodeMass Storage
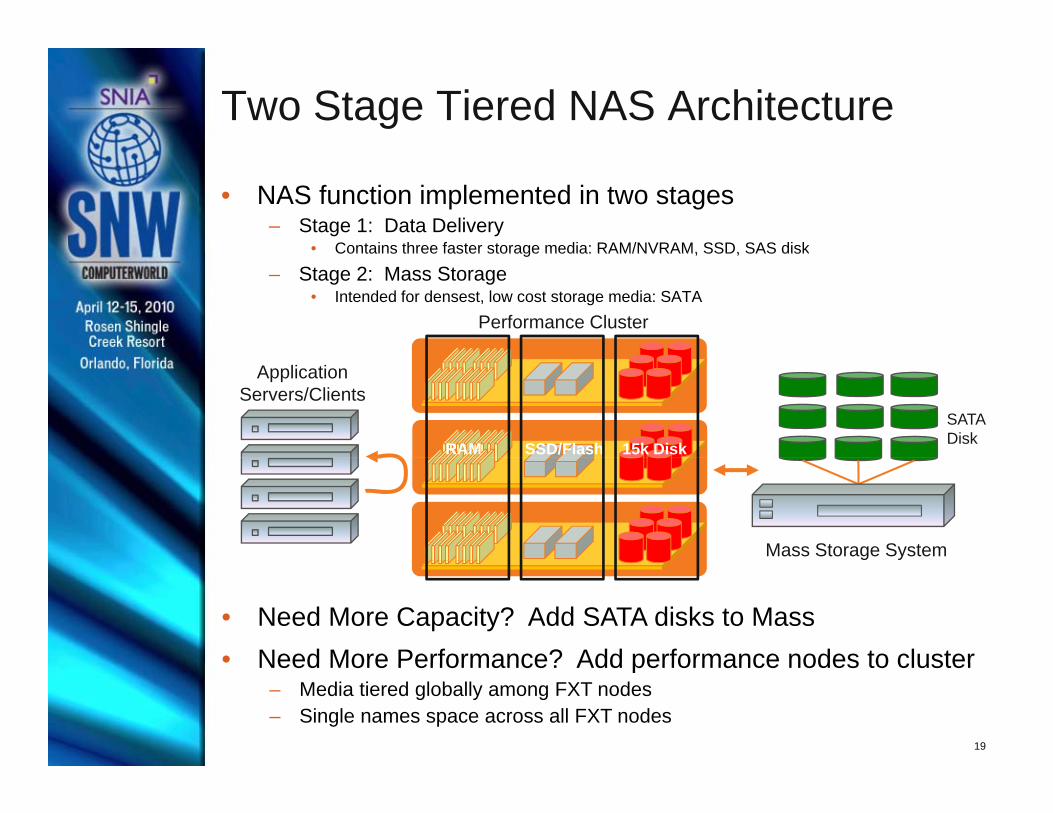
Two Stage Tiered NAS Architecture
• NAS function implemented in two stages– Stage 1: Data Delivery
• Contains three faster storage media: RAM/NVRAM, SSD, SAS diskContains three faster storage media: RAM/NVRAM, SSD, SAS disk
– Stage 2: Mass Storage• Intended for densest, low cost storage media: SATA
Performance Cluster
RAM SSD/Flash 15k Disk
Performance Node
SATADisk
ApplicationServers/Clients
Mass Storage System
• Need More Capacity? Add SATA disks to Mass• Need More Performance? Add performance nodes to cluster
19
Need More Performance? Add performance nodes to cluster– Media tiered globally among FXT nodes– Single names space across all FXT nodes

True Dynamic Tiering
• What? Finest level of granularity
• When? Data is tiered on-the-fly
LUN Volume File Block
• When? Data is tiered on-the-fly
Weeks Days Hours On-The-Fly
• How? Automatic movement between tiers
Manual Disruptive
Manual Non-disruptive
Policy-based Automatic
– Automatic by frequency, access pattern and size20
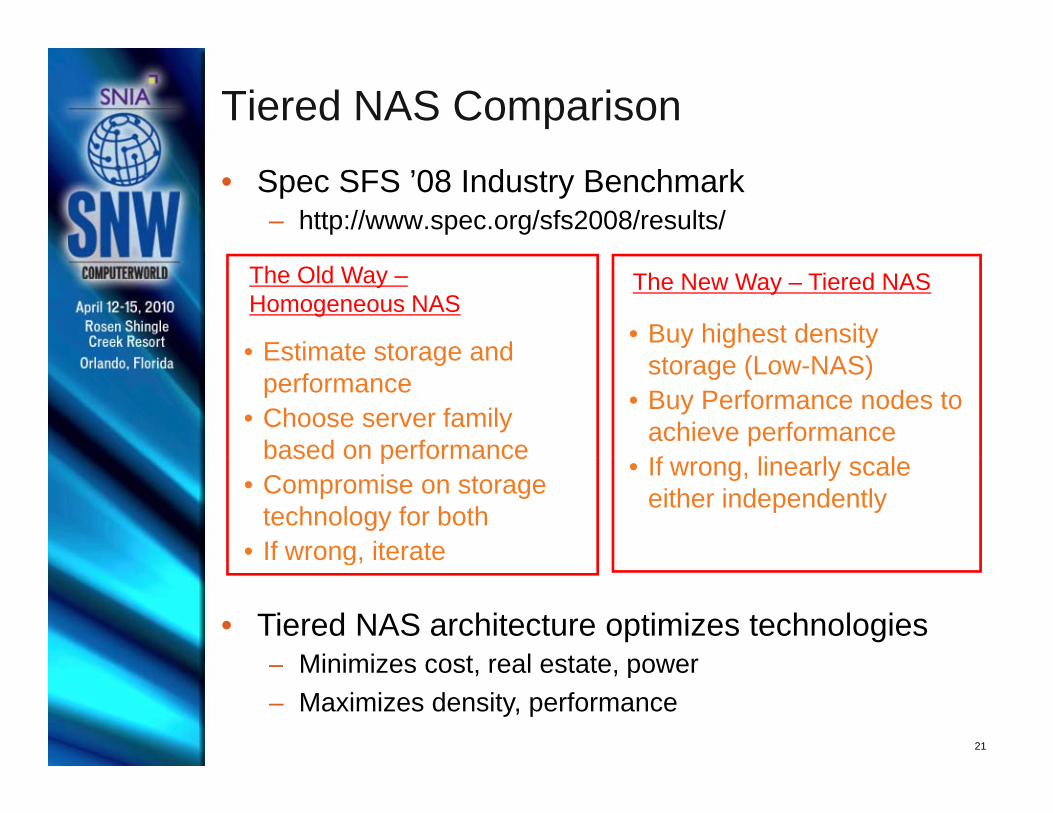
Tiered NAS Comparison
• Spec SFS ’08 Industry Benchmark– http://www.spec.org/sfs2008/results/
• Estimate storage and
The Old Way –Homogeneous NAS
• Buy highest density (L NAS)
The New Way – Tiered NAS
Estimate storage and performance
• Choose server family based on performance
storage (Low-NAS)• Buy Performance nodes to
achieve performanceIf li l lbased on performance
• Compromise on storage technology for both
• If wrong, iterate
• If wrong, linearly scale either independently
g,
• Tiered NAS architecture optimizes technologiesMinimizes cost real estate power
21
– Minimizes cost, real estate, power– Maximizes density, performance
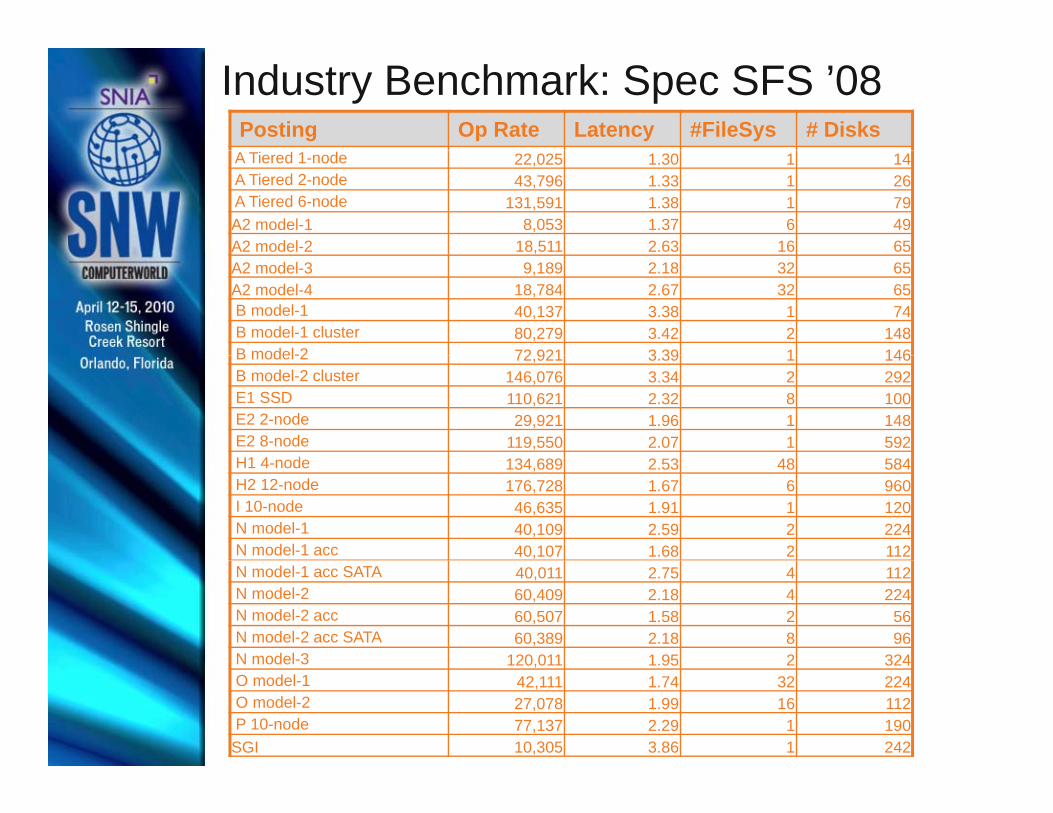
Industry Benchmark: Spec SFS ’08Posting Op Rate Latency #FileSys # Disks
A Tiered 1-node 22,025 1.30 1 14A Tiered 2-node 43,796 1.33 1 26A Tiered 6-node 131,591 1.38 1 79A2 model-1 8,053 1.37 6 49A2 model-2 18,511 2.63 16 65,A2 model-3 9,189 2.18 32 65A2 model-4 18,784 2.67 32 65B model-1 40,137 3.38 1 74B model-1 cluster 80,279 3.42 2 148B model-2 72 921 3 39 1 146B model-2 72,921 3.39 1 146B model-2 cluster 146,076 3.34 2 292E1 SSD 110,621 2.32 8 100E2 2-node 29,921 1.96 1 148E2 8-node 119,550 2.07 1 592H1 4 dH1 4-node 134,689 2.53 48 584H2 12-node 176,728 1.67 6 960I 10-node 46,635 1.91 1 120N model-1 40,109 2.59 2 224N model-1 acc 40,107 1.68 2 112N model-1 acc SATA 40,011 2.75 4 112N model-2 60,409 2.18 4 224N model-2 acc 60,507 1.58 2 56N model-2 acc SATA 60,389 2.18 8 96N model-3 120 011 1 95 2 324N model 3 120,011 1.95 2 324O model-1 42,111 1.74 32 224O model-2 27,078 1.99 16 112P 10-node 77,137 2.29 1 190SGI 10,305 3.86 1 242

Industry Benchmark: Spec SFS ’08 (20K+)
Posting Op Rate Latency #FileSys # DisksA Tiered 1-node 22,025 1.30 1 14A Tiered 2-node 43,796 1.33 1 26A Tiered 6-node 131,591 1.38 1 79B model-1 40,137 3.38 1 74
Massinclusive
B model-1 cluster 80,279 3.42 2 148B model-2 72,921 3.39 1 146B model-2 cluster 146,076 3.34 2 292E1 SSD 110,621 2.32 8 100E1 SSD 110,621 2.32 8 100E2 2-node 29,921 1.96 1 148E2 8-node 119,550 2.07 1 592H1 4-node 134,689 2.53 48 584H2 12-node 176 728 1 67 6 960H2 12-node 176,728 1.67 6 960I 10-node 46,635 1.91 1 120N model-1 40,109 2.59 2 224N model-1 acc 40,107 1.68 2 112N model 1 acc SATA 40 011 2 75 4 112N model-1 acc SATA 40,011 2.75 4 112N model-2 60,409 2.18 4 224N model-2 acc 60,507 1.58 2 56N model-2 acc SATA 60,389 2.18 8 96N model-3 120,011 1.95 2 324O model-1 42,111 1.74 32 224O model-2 27,078 1.99 16 112P 10-node 77,137 2.29 1 190
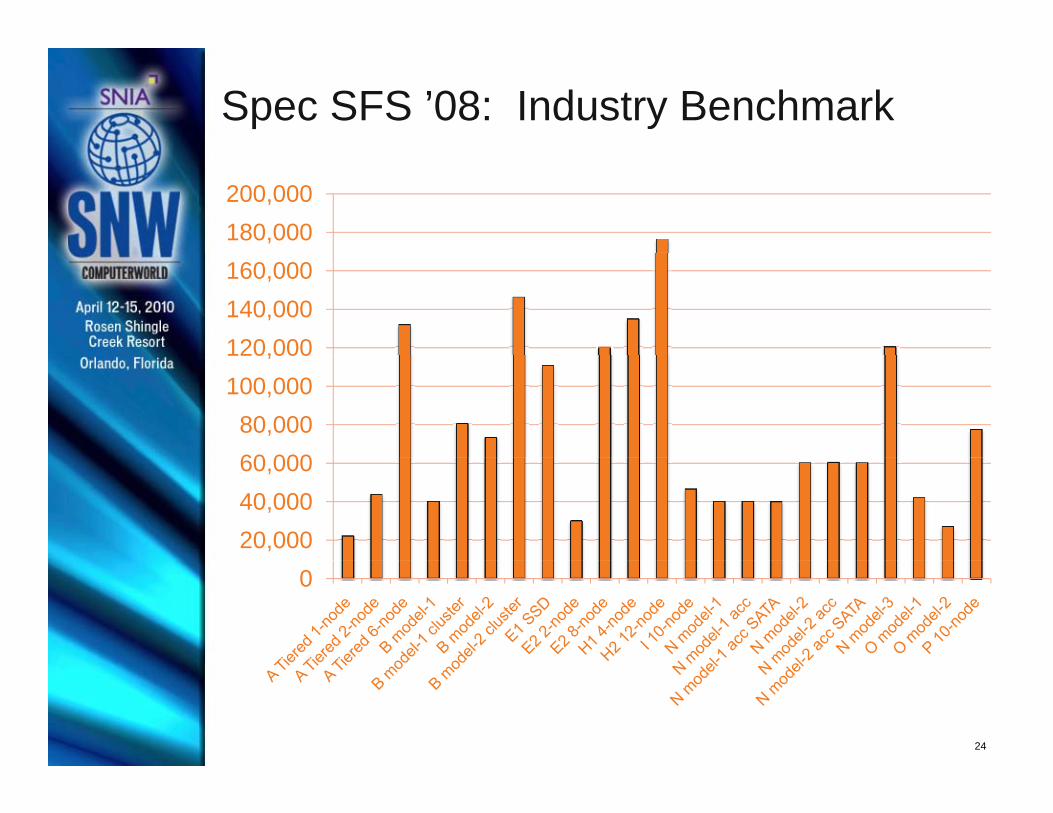
Spec SFS ’08: Industry Benchmark
180,000200,000
120,000140,000160,000
60 00080,000
100,000120,000
20,00040,00060,000
0
24
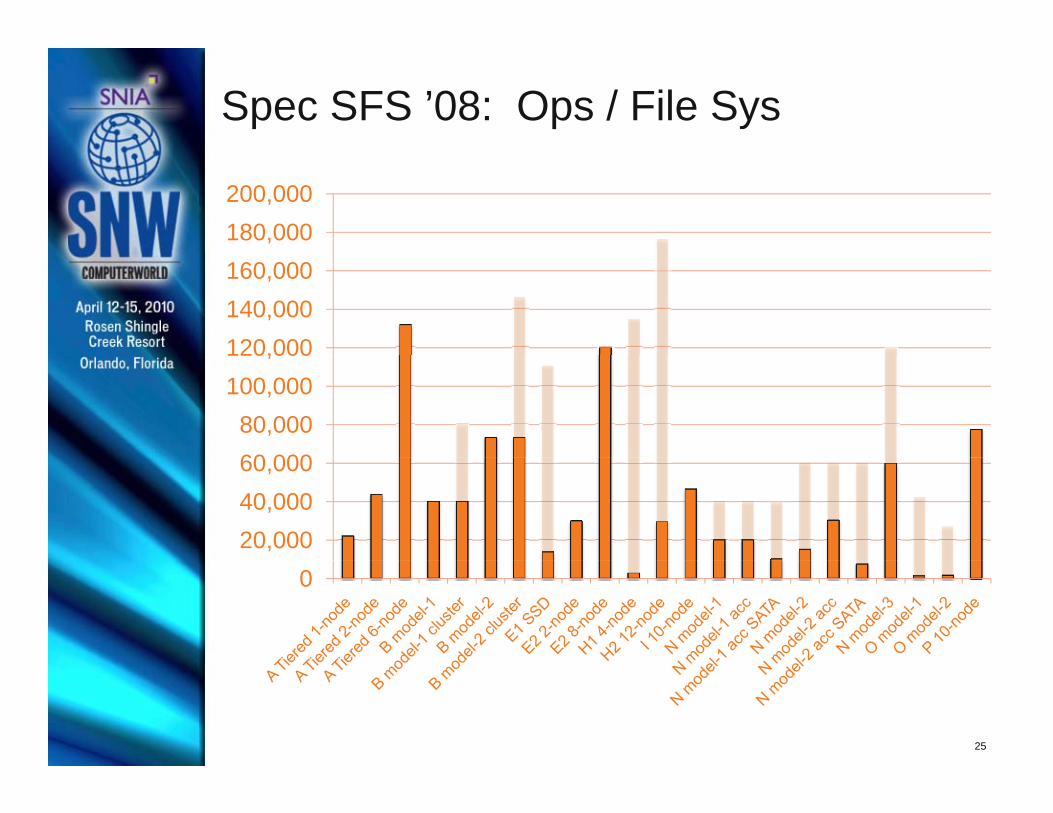
Spec SFS ’08: Ops / File Sys
180,000200,000
120,000140,000160,000
60 00080,000
100,000120,000
20,00040,00060,000
0
25
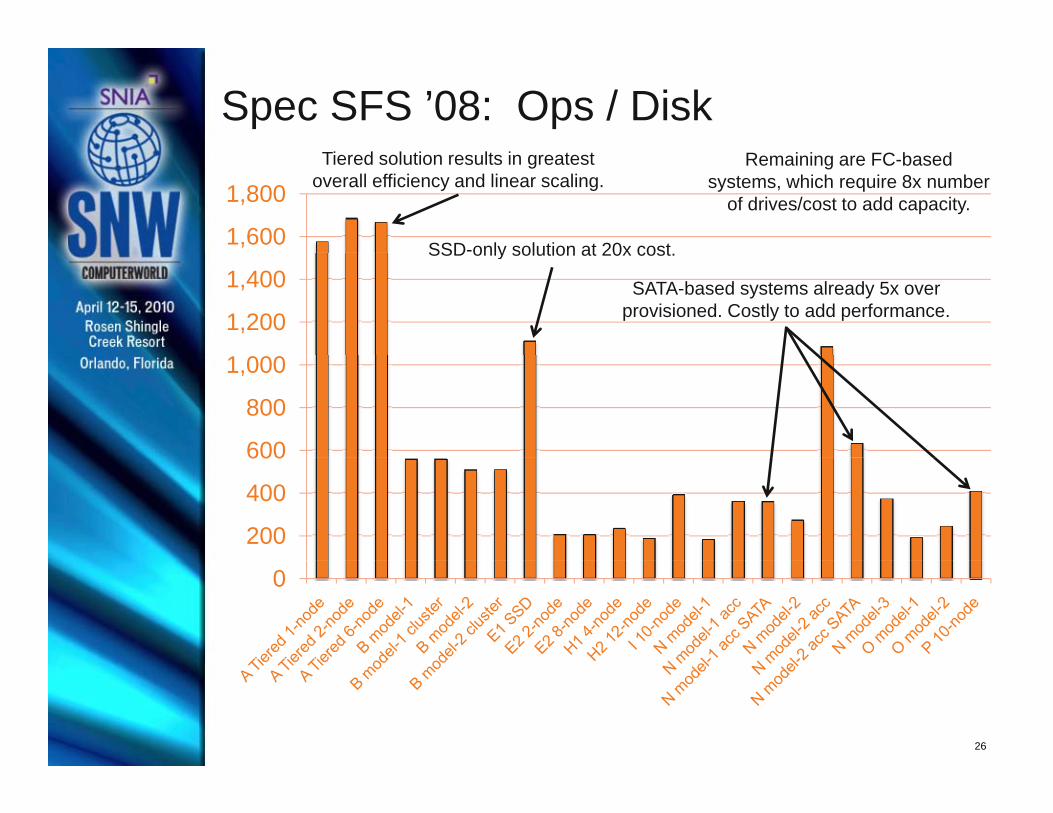
Spec SFS ’08: Ops / Disk
1,600
1,800Remaining are FC-based
systems, which require 8x number of drives/cost to add capacity.
Tiered solution results in greatestoverall efficiency and linear scaling.
SSD-only solution at 20x cost
1,200
1,400 SATA-based systems already 5x over provisioned. Costly to add performance.
SSD only solution at 20x cost.
600
800
1,000
200
400
600
0
26
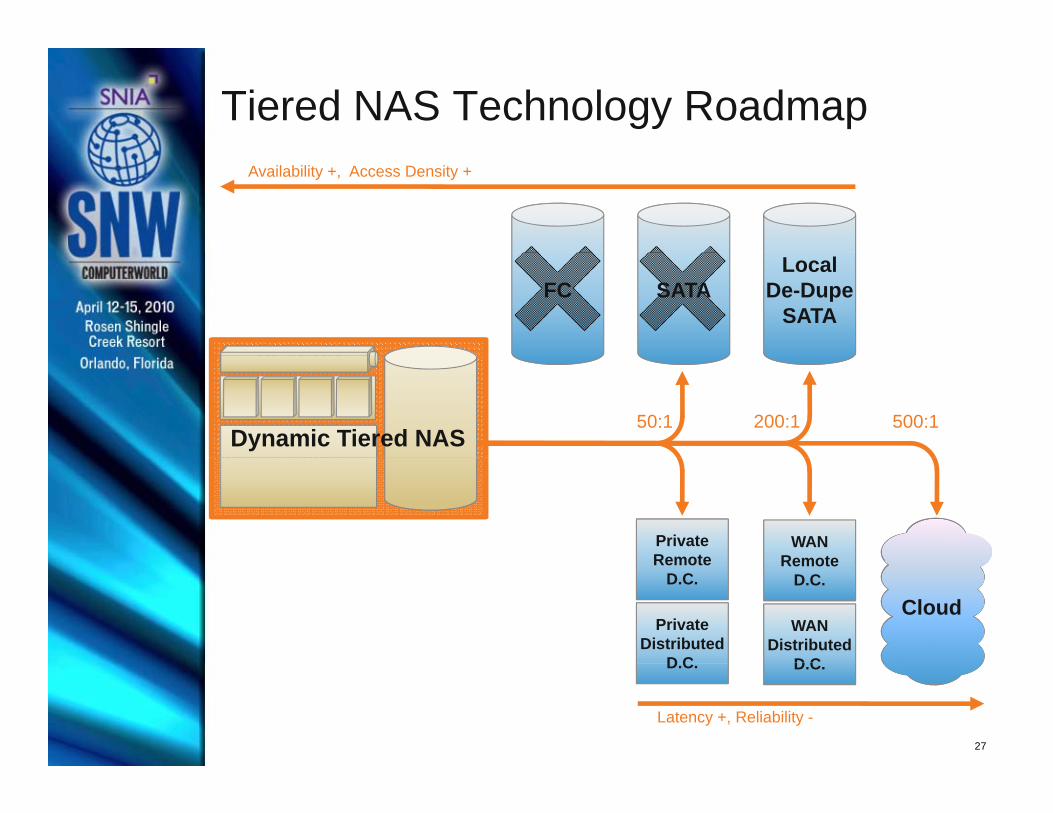
Tiered NAS Technology RoadmapAvailability +, Access Density +
SATAFC
NVRAM
LocalDe-Dupe
SATA
NVRAMRAM
SSDSAS 200:1 500:150:1
Dynamic Tiered NASSSD
PrivateRemote
WANRemoteRemote
D.C.
PrivateDistributed
D C
Remote D.C.
WANDistributed
D C
Cloud
D.C.
Latency +, Reliability -
D.C.
27
Summary
• No single storage media is best for all applications• Tiered NAS Architecture• Tiered NAS Architecture
– Leverage all media types– Most efficient– Optimize cost/performance– Support wide-range of application workloads
• Two Stage Implementation• Two Stage Implementation– Simple to deploy and manage– True separation of performance and capacity scaling
N d it ? Add SATA di k• Need more capacity? Add SATA disks• Need more performance? Add FXT nodes
28
Thank you!
AVERE SYSTEMS, INCaveresystems comaveresystems.com
April 12, 2010
R Bi hi i CEO d P id tRon Bianchini, CEO and President