dynamical influence on inter-annual and decadal ozone change
DESCRIPTION
Dynamical Influence on Inter-annual and Decadal Ozone Change. Sandip Dhomse, Mark Weber, J.P. Burrows Universtät Bremen FB1 , Insti tüt für Umweltphysik (iup). [email protected]. http://www.iup.physik.uni-bremen.de. Outline Introduction Data used Inter-annual variability - PowerPoint PPT PresentationTRANSCRIPT

Dynamical Influence on Inter-annual and Decadal Ozone Change
http://[email protected]
Sandip Dhomse, Mark Weber, J.P.
Burrows
Universtät Bremen FB1, Institüt für
Umweltphysik (iup)

Outline
• Introduction• Data used• Inter-annual variability• Decadal variability• Tele-connection patterns
(Introduction)• Summary and Conclusion• Outlook
[email protected] 11/11/03

No abrupt change in chemical composition
Introduction
[email protected] 11/11/03
Sun - at the same position

[email protected] 11/11/03
Total Ozone is higher in NH (spring) than SH (spring)
Low TOZ
In tropics
Relatively High TOZ in tropics during SH spring

Wave activity controls
• Stratospheric
circulation
• Stratosphere
Troposphere
Exchange
[email protected] 11/11/03
Holton et al., 1995

SH winter- colder
[email protected] 11/11/03
Mean Winter temp. (shaded) And zonal wind (contour) for NH and SH
SH – polar jet stronger
Tropopause colder during NH winter

Planetary waves
Planetary waves are large-scale distortions to the mean flow
The flow (black) meanders across latitude circles (blue).
V
V
[email protected] 11/11/03


Brewer-Dobson circulation
•Breaking planetary waves apply a FORCE to the winds-
decelerates the speed
•Pressure gradient force- remains unaffected
•Corioli’s force - REDUCED so there is a net force towards the
pole.
•Air RISES over the equator, drifts steadily POLEWARD
(while meandering around the latitude circles) and SINKS at
the poles
[email protected] 11/11/03

[email protected] 11/11/03
Two components of EP flux are calculated as,(Andrews,et.al 1987)
)''/'']/)cos()cos({[cos
)''/''(cos
10
)(
0)(
uwvuuafaF
uvvuaF
zzz
zz
And its divergence is
z
FFaF
z
)cos()cos( 1
• Eliassen Palm (EP) flux vector is a measure of the upward propagating momentum carried by planetary waves
• The divergence of EP flux gives the volume where momentum is deposited
Measuring the wave activity
Heat flux
Momentum flux

[email protected] 11/11/03
Measuring the wave activity
)))(((''
)))(((''
TTvvmeanTv
vvuumeanvu
zonalzonal
zonalzonal
''vuF
''TvF z

[email protected] 11/11/03

Data used
Meteorological data set • ERA40 - 23 pressure levels• ERA15 - 17 pressure levels• UK Met. Office - 22 pressure levels • ECMWF - 21 pressure levels• NCEP - 17 pressure levels
Ozone data set• GOME - total ozone data • TOMS - total ozone data
[email protected] 11/11/ 03

[email protected] 11/11/ 03
Inter-annual variation of flux and Ozone
High flux - increase in Brewer-Dobson circulation - more transport

[email protected] 11/11/ 03
Record high lower stratosphericheat flux on 20th/21stSeptember (ERA40 1960-2002)
Splitting of the polar vortex on 26th September 2002
First major stratospheric warming in SH

[email protected] 11/11/ 03
wave activity and winter gain in ozone
Weber et al. 2003
High correlation between winter heat flux (wave activity) and spring/fall ozone ratio
Winter ozone gain in Antarctic 2002 presents an intermediate case between other Antarctic winters and cold Arctic winters (higher contribution from transport)
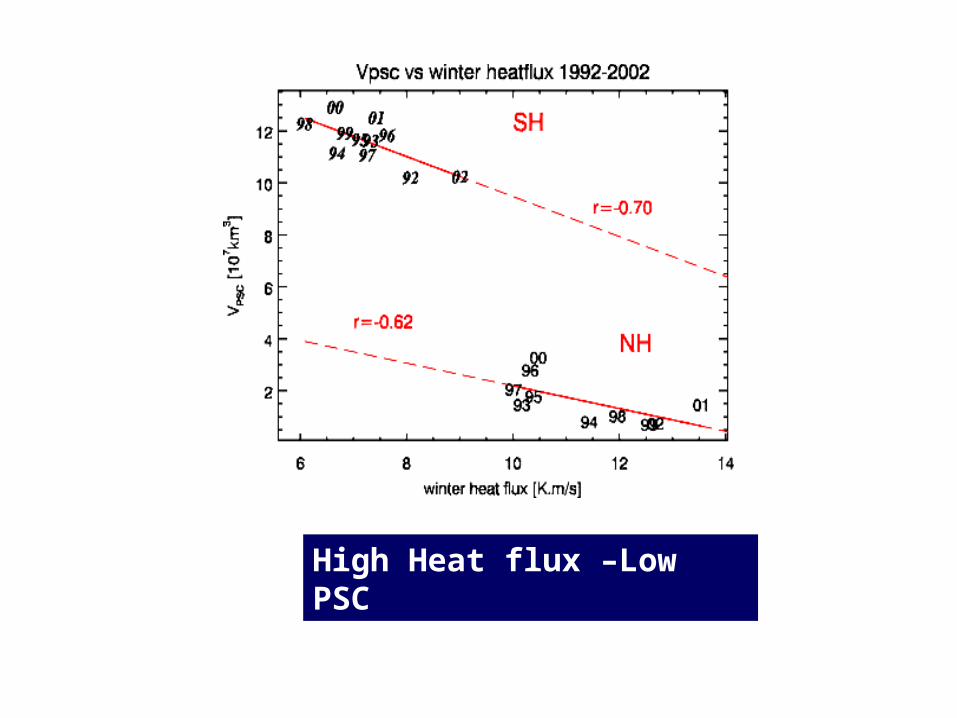
High Heat flux –Low PSC

[email protected] 11/11/ 03
[email protected] 11/11/ 03
Does dynamics the same? Or Chemistry is changing?
Model Differences
ERA40
ERA40 +ERA15


[email protected] 11/11/ 03
PSC volume using ERA40 data
T <195 K (PSC volume)
SH (JAN-DEC)NH (JUL-JUN)

[email protected] 11/11/ 03
Days (Jul-Jun)
195 K- PSC temperature
SH –colder temperature
Days (Jan-Dec)


[email protected] 11/11/03
Summary
• Strong correlation between seasonal heat flux and total ozone in March.
• No significant trend on seasonal scale in heat flux.
• Maximum cooling trend is in November and January ( -1.2 K/decade) , but there is not trend in heat flux.
• Different models, different periods lead to different trends.


[email protected] 11/11/03
Conclusion
• There are no significant trends in 2D (latitude & altitude) analysis of the data.
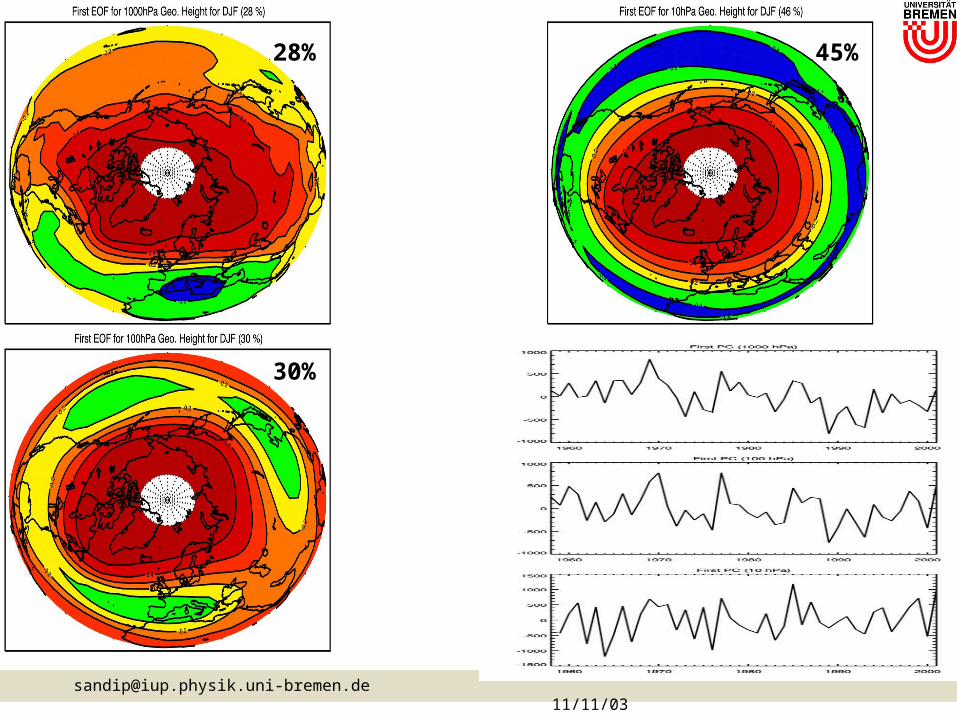
• 3D analysis of data will be useful to find the dependence of ozone on different tele-connection patterns.
• EOF analysis is good tool for 3D analysis.

[email protected] 11/11/03
Outlook
• Study ozone dependence on different tele-connection pattern using EOF technique.
• Find out different patterns in the ozone variability using GOME vertical profile data (neural network) , TOMS, SAGE, POAM, ozonesonde datasets.
