dynamics ax performance tuning
DESCRIPTION
Dynamics ax performance tuningTRANSCRIPT
Dynamics AX Performance Tuning
Martin ZhenPrinciple technical consultant @ OutsourceAX Development
About OutsourceAX Development
OutsourceAX Development is an offshore Dynamics AX Development provider, providing Dynamics AX development/support services to Microsoft Dynamics Partners and Customers.
Agenda
Performance Tuning
System monitoring/tooling for SQL
Problem solving strategy
Dynamics AX Trace Parser Tool
Performance Analyzer for Microsoft Dynamics
Tuning Strategy
Solid State Drives
System monitoring/tooling for SQL
• SQL Server Profiler
• System monitoring / Perfmon / PAL tool
• Activity Monitor (SQL Server Management Studio)
• Event logs, SQL logs
• Dynamic Management Views (DMVs) / standard reports
• SQL trace (sp_trace TSQL)
• System Stored Procedures (sp_who, sp_lock…)
• DBCC statements
• Built-in functions (@@CPU_BUSY, @@CONNECTIONS…)
• Trace Flags
• Database Engine Tuning Advisors
http://msdn.microsoft.com/en-us/library/ms179428.aspx
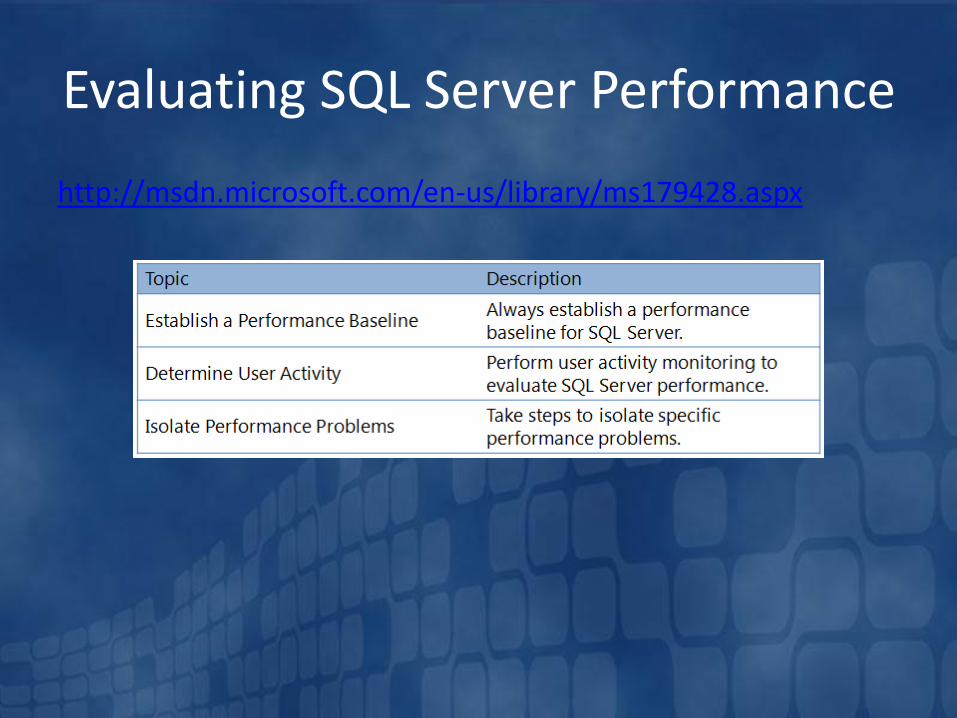
Evaluating SQL Server Performance
http://msdn.microsoft.com/en-us/library/ms179428.aspx
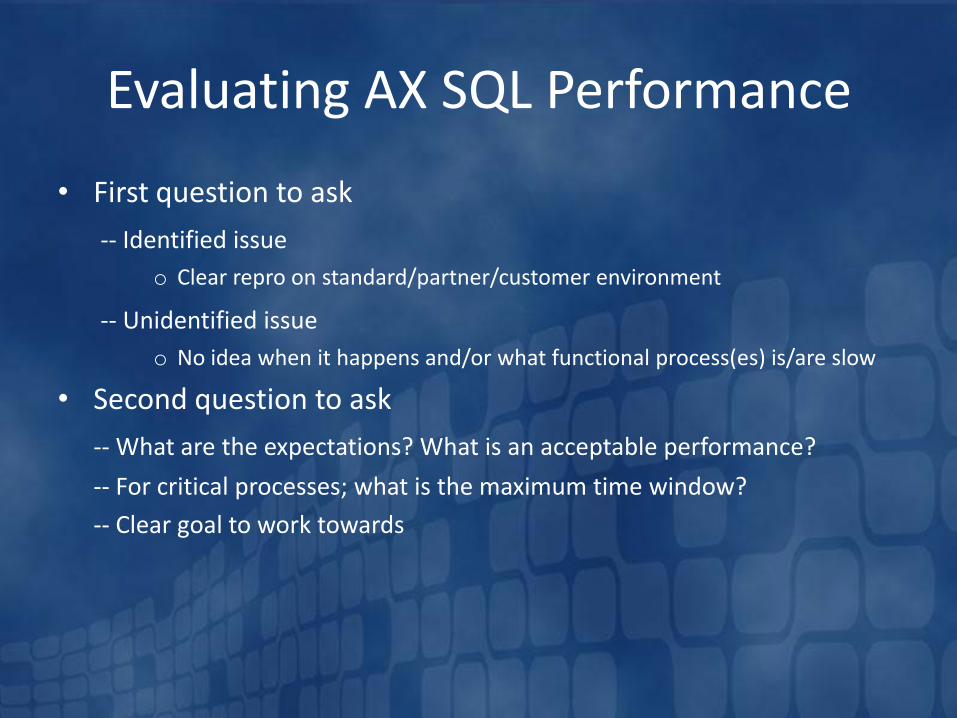
Evaluating AX SQL Performance
• First question to ask
-- Identified issue
o Clear repro on standard/partner/customer environment
-- Unidentified issue
o No idea when it happens and/or what functional process(es) is/are slow
• Second question to ask
-- What are the expectations? What is an acceptable performance?
-- For critical processes; what is the maximum time window?
-- Clear goal to work towards
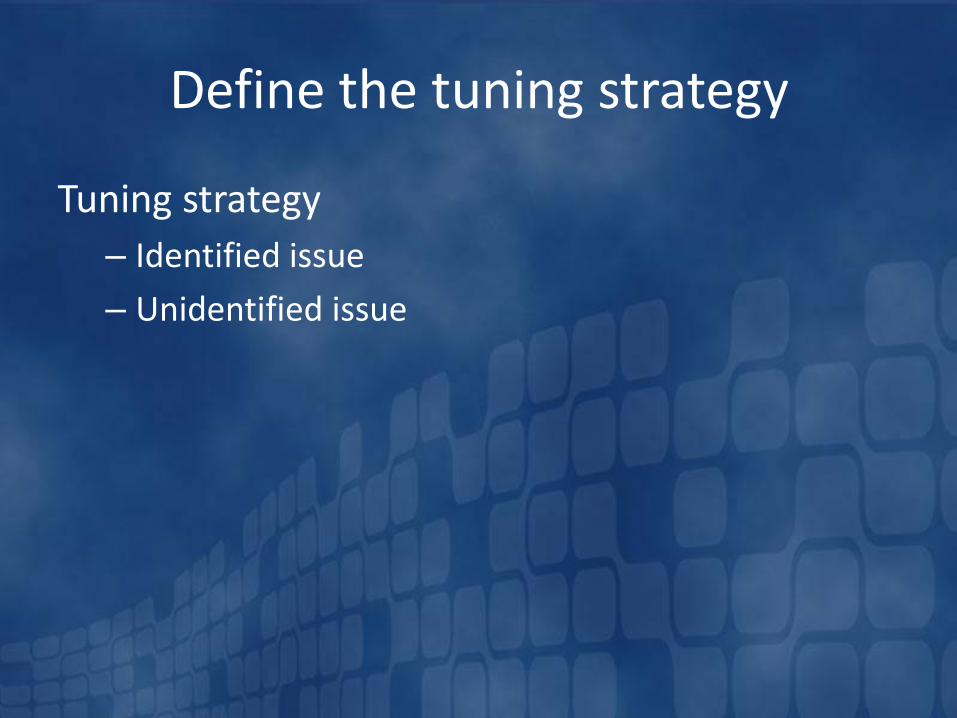
Define the tuning strategy
Tuning strategy
– Identified issue
– Unidentified issue
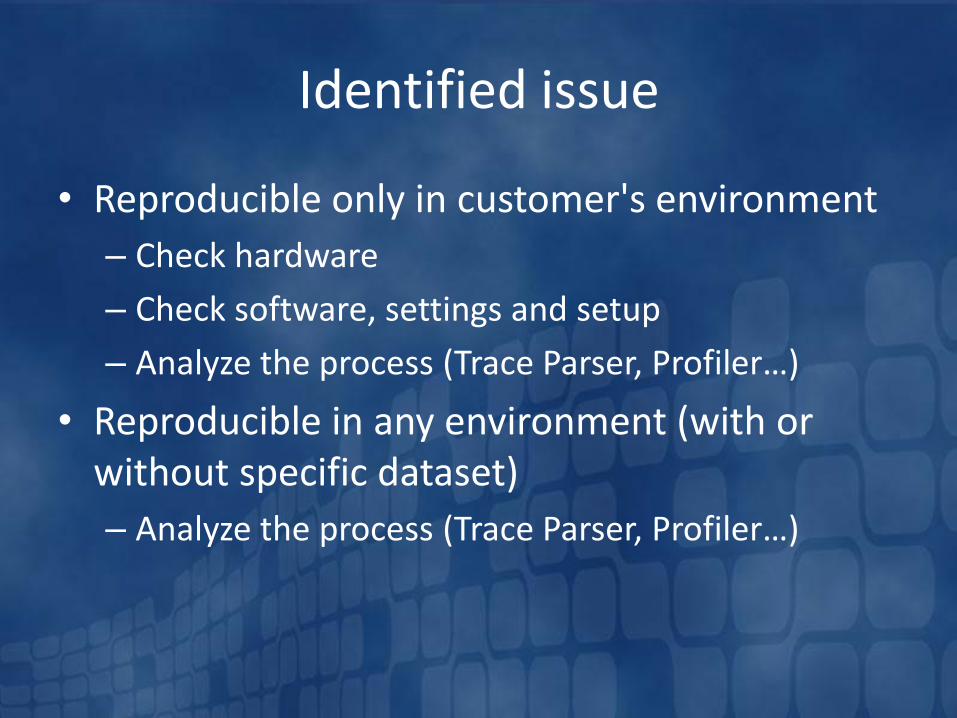
Identified issue
• Reproducible only in customer's environment
– Check hardware
– Check software, settings and setup
– Analyze the process (Trace Parser, Profiler…)
• Reproducible in any environment (with or without specific dataset)
– Analyze the process (Trace Parser, Profiler…)
Unidentified issue
• Check hardware
• Check software, settings and setup
• Long term data collection (AXPERF, IDM)
Check Hardware: Tools
• Performance Monitoring (Perfmon)– Under OS Administrative Tools
– Reliability and Performance Monitor (Windows Server 2008)
• Microsoft Network Monitor (Netmon)– Minimum client-server network requirements
• Bandwidth >= 100 mbps
• Latency <= 5ms
– Minimum server-server network bandwidth is 1 gbps
– Netmon v3.2 for Windows Server 2003 and 2008 download• http://www.microsoft.com/downloads/details.aspx?familyid=f4db40af-1e08-4a21-
a26b-ec2f4dc4190d&displaylang=en
Check Software, Settings and Setup: References
• System requirement guides (see previous slides)
• For SQL Server:– Latest Service Pack from http://support.microsoft.com
– Recent CU Package from http://support.microsoft.com
• For Dynamics AX:– Latest Service Pack from https://mbs.microsoft.com/partnersource
– Recent Rollup package from PartnerSource or contact Microsoft Support
• For SQL Server Settings:
– AX Performance team blog:
http://blogs.msdn.com/axperf
Check Software, Settings and Setup
• Disk setup– AX data file(s), transaction log file and Tempdb on dedicated separate
LUNs.• AX data file(s): RAID 0+1, or 10 preferred • AX transaction log file: RAID 1, 0+1, or 10 preferred• Tempdb database files: RAID 1, 0+1, or 10 preferred
– The TempDB is heavily utilized when the Read Committed Snapshot Isolation (RCSI) is activated, for Sort operations and Intermediate join results. To get an additional performance gain Tempdb should be properly sized and should have as many data files as core CPUs.
– Check Disk sector alignment as it can have a serious impact on performance of the system. More information on how to optimize can be found here:• http://support.microsoft.com/kb/929491• http://blogs.msdn.com/jimmymay/archive/2008/10/14/disk-
partitionalignment-for-sql-server-slide-deck.aspx
Check Software, Settings and Setup
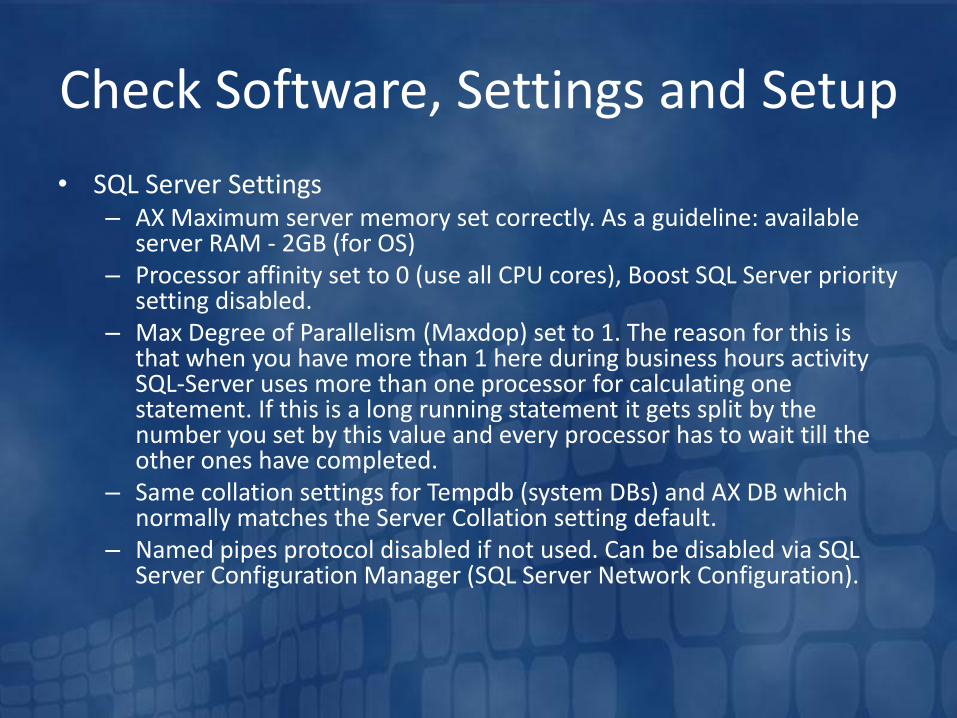
• SQL Server Settings– AX Maximum server memory set correctly. As a guideline: available
server RAM - 2GB (for OS)– Processor affinity set to 0 (use all CPU cores), Boost SQL Server priority
setting disabled.– Max Degree of Parallelism (Maxdop) set to 1. The reason for this is
that when you have more than 1 here during business hours activity SQL-Server uses more than one processor for calculating one statement. If this is a long running statement it gets split by the number you set by this value and every processor has to wait till the other ones have completed.
– Same collation settings for Tempdb (system DBs) and AX DB which normally matches the Server Collation setting default.
– Named pipes protocol disabled if not used. Can be disabled via SQL Server Configuration Manager (SQL Server Network Configuration).
Check Software, Settings and Setup
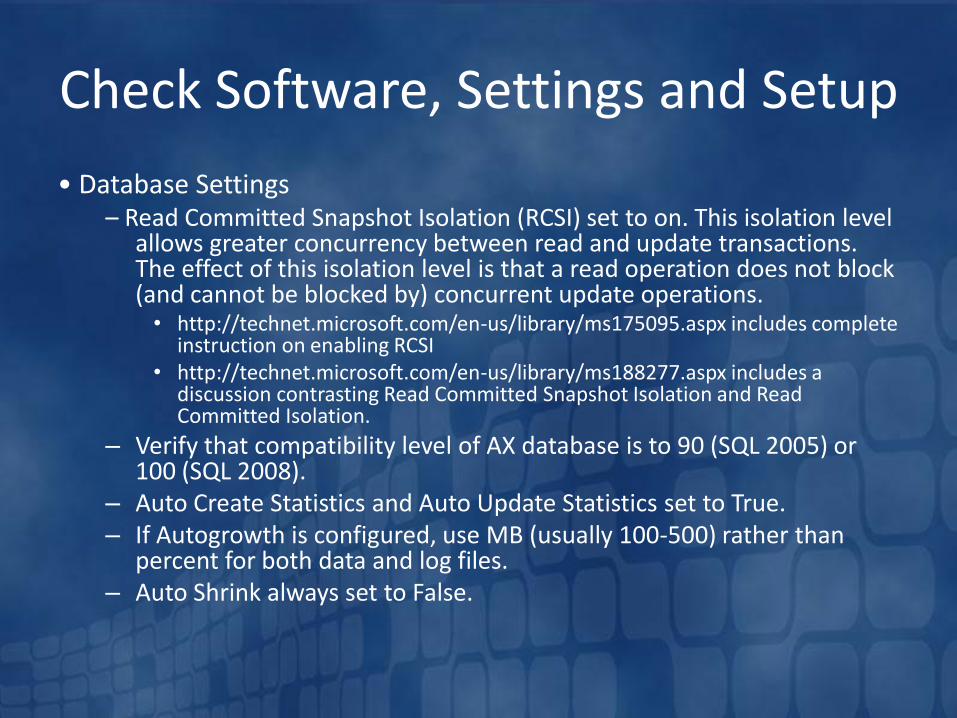
• Database Settings– Read Committed Snapshot Isolation (RCSI) set to on. This isolation level
allows greater concurrency between read and update transactions. The effect of this isolation level is that a read operation does not block (and cannot be blocked by) concurrent update operations.• http://technet.microsoft.com/en-us/library/ms175095.aspx includes complete
instruction on enabling RCSI• http://technet.microsoft.com/en-us/library/ms188277.aspx includes a
discussion contrasting Read Committed Snapshot Isolation and Read Committed Isolation.
– Verify that compatibility level of AX database is to 90 (SQL 2005) or 100 (SQL 2008).
– Auto Create Statistics and Auto Update Statistics set to True.– If Autogrowth is configured, use MB (usually 100-500) rather than
percent for both data and log files.– Auto Shrink always set to False.
Check Software, Settings and Setup
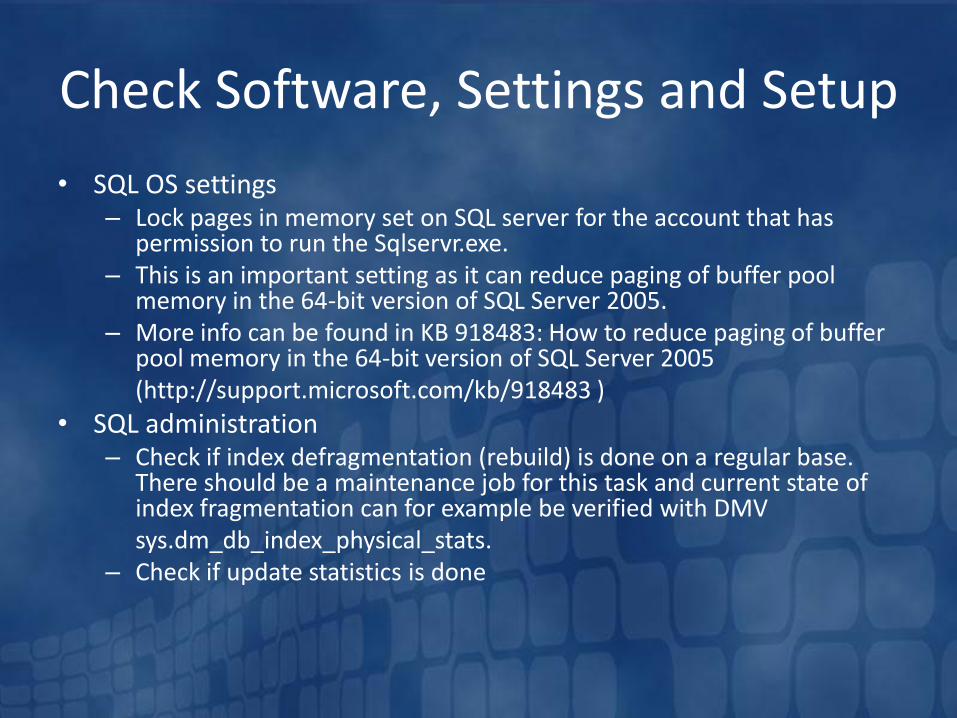
• SQL OS settings– Lock pages in memory set on SQL server for the account that has
permission to run the Sqlservr.exe.– This is an important setting as it can reduce paging of buffer pool
memory in the 64-bit version of SQL Server 2005.– More info can be found in KB 918483: How to reduce paging of buffer
pool memory in the 64-bit version of SQL Server 2005(http://support.microsoft.com/kb/918483 )
• SQL administration– Check if index defragmentation (rebuild) is done on a regular base.
There should be a maintenance job for this task and current state of index fragmentation can for example be verified with DMVsys.dm_db_index_physical_stats.
– Check if update statistics is done
Check Software, Settings and Setup
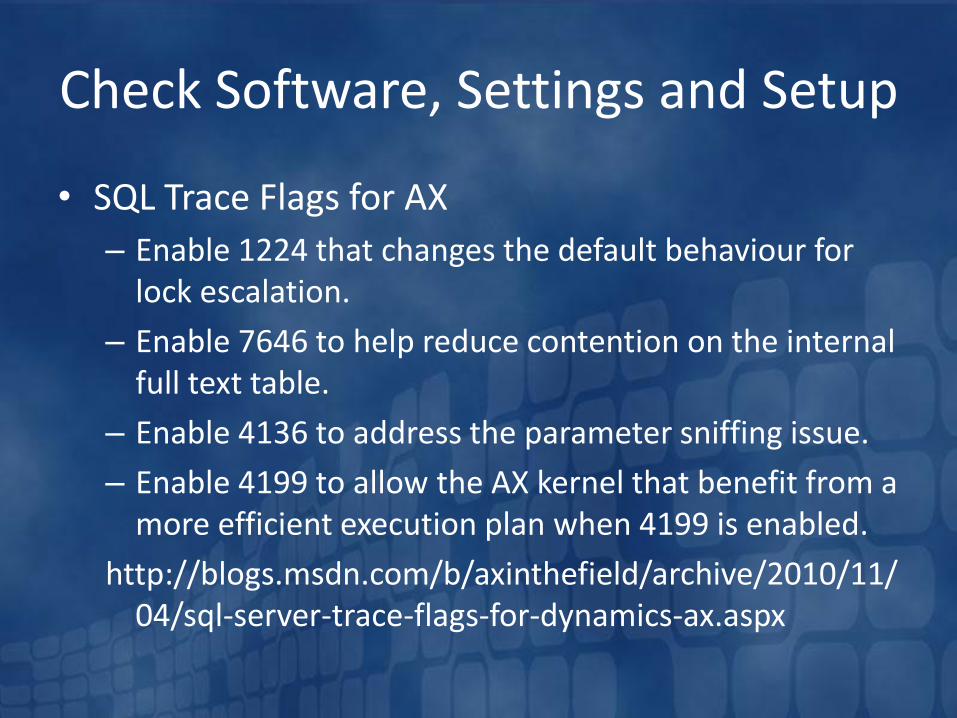
• SQL Trace Flags for AX
– Enable 1224 that changes the default behaviour for lock escalation.
– Enable 7646 to help reduce contention on the internal full text table.
– Enable 4136 to address the parameter sniffing issue.
– Enable 4199 to allow the AX kernel that benefit from a more efficient execution plan when 4199 is enabled.
http://blogs.msdn.com/b/axinthefield/archive/2010/11/04/sql-server-trace-flags-for-dynamics-ax.aspx
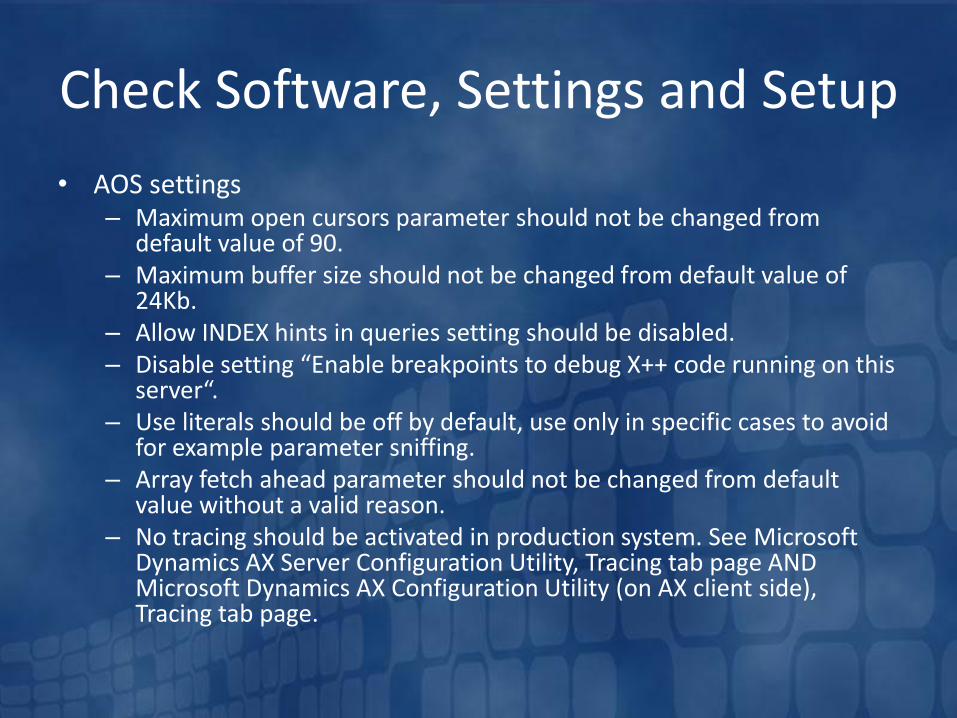
Check Software, Settings and Setup
• AOS settings– Maximum open cursors parameter should not be changed from
default value of 90.– Maximum buffer size should not be changed from default value of
24Kb.– Allow INDEX hints in queries setting should be disabled.– Disable setting “Enable breakpoints to debug X++ code running on this
server“.– Use literals should be off by default, use only in specific cases to avoid
for example parameter sniffing.– Array fetch ahead parameter should not be changed from default
value without a valid reason.– No tracing should be activated in production system. See Microsoft
Dynamics AX Server Configuration Utility, Tracing tab page AND Microsoft Dynamics AX Configuration Utility (on AX client side), Tracing tab page.
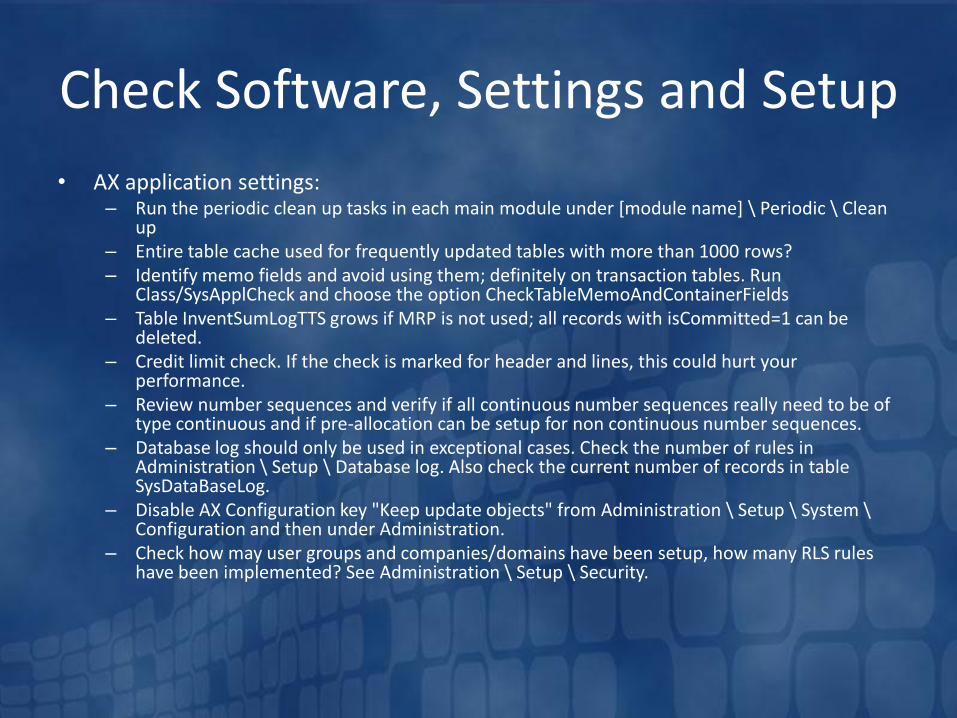
Check Software, Settings and Setup
• AX application settings:– Run the periodic clean up tasks in each main module under [module name] \ Periodic \ Clean
up– Entire table cache used for frequently updated tables with more than 1000 rows?– Identify memo fields and avoid using them; definitely on transaction tables. Run
Class/SysApplCheck and choose the option CheckTableMemoAndContainerFields– Table InventSumLogTTS grows if MRP is not used; all records with isCommitted=1 can be
deleted.– Credit limit check. If the check is marked for header and lines, this could hurt your
performance.– Review number sequences and verify if all continuous number sequences really need to be of
type continuous and if pre-allocation can be setup for non continuous number sequences.– Database log should only be used in exceptional cases. Check the number of rules in
Administration \ Setup \ Database log. Also check the current number of records in table SysDataBaseLog.
– Disable AX Configuration key "Keep update objects" from Administration \ Setup \ System \Configuration and then under Administration.
– Check how may user groups and companies/domains have been setup, how many RLS rules have been implemented? See Administration \ Setup \ Security.
Treat the cause, not the symptoms!
• Performance tuning rules:
– a) everything relates to queries
– b) tune the source (queries), not the symptoms (hardware)
• 90% of perf tuning is in identifying root causes• Once causes identified, resolution is generally relatively
easy
Treat the cause, not the symptoms!
• Don’t lose time measuring the consequences, get straight down to business with the queries (the source).
• First, identify inefficient queries
• Then, tune queries identified
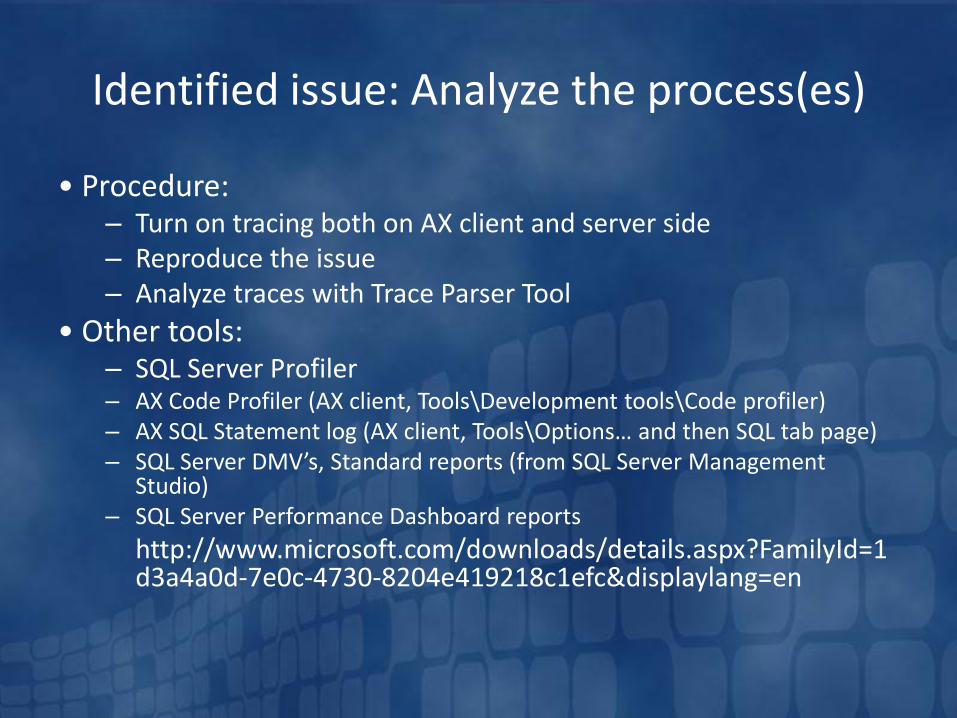
Identified issue: Analyze the process(es)
• Procedure:– Turn on tracing both on AX client and server side– Reproduce the issue– Analyze traces with Trace Parser Tool
• Other tools:– SQL Server Profiler– AX Code Profiler (AX client, Tools\Development tools\Code profiler)– AX SQL Statement log (AX client, Tools\Options… and then SQL tab page)– SQL Server DMV’s, Standard reports (from SQL Server Management
Studio)– SQL Server Performance Dashboard reports
http://www.microsoft.com/downloads/details.aspx?FamilyId=1d3a4a0d-7e0c-4730-8204e419218c1efc&displaylang=en
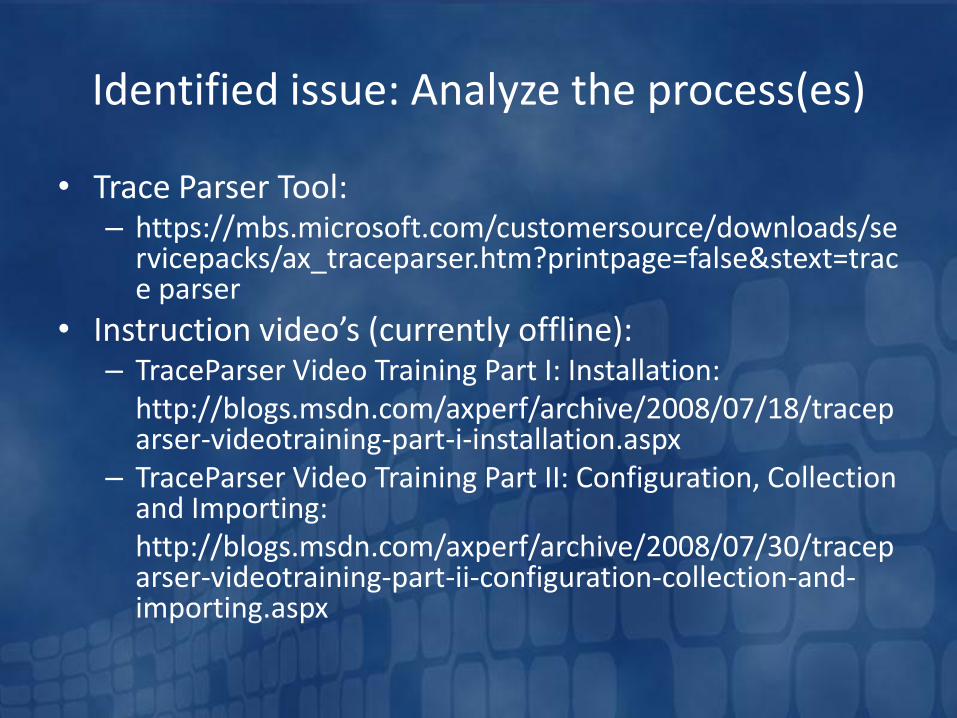
Identified issue: Analyze the process(es)
• Trace Parser Tool:– https://mbs.microsoft.com/customersource/downloads/se
rvicepacks/ax_traceparser.htm?printpage=false&stext=trace parser
• Instruction video’s (currently offline):– TraceParser Video Training Part I: Installation:
http://blogs.msdn.com/axperf/archive/2008/07/18/traceparser-videotraining-part-i-installation.aspx
– TraceParser Video Training Part II: Configuration, Collection and Importing:http://blogs.msdn.com/axperf/archive/2008/07/30/traceparser-videotraining-part-ii-configuration-collection-and-importing.aspx
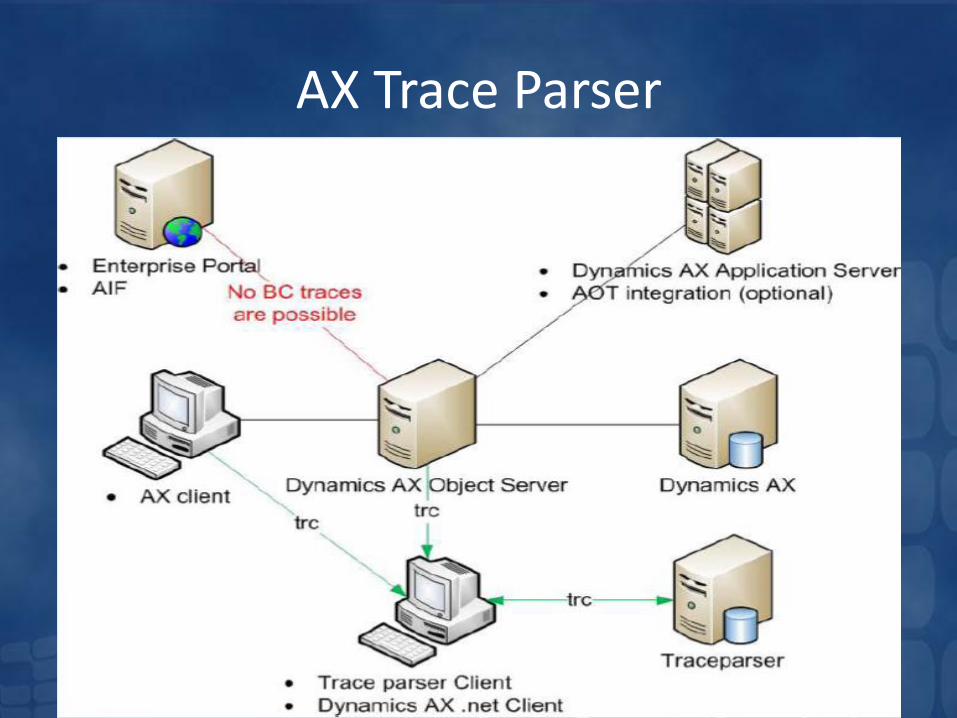
AX Trace Parser
• The Microsoft Dynamics AX Trace Parser is a user interface and data analyzer added to Microsoft Dynamics AX 2009 and built on top of Microsoft SQL Server 2005 and the Event Tracing for Windows (ETW) framework.
• The ETW framework allows an administrator to conduct tracing with system overhead of approximately 4%.
AX Trace Parser
• The Trace Parser enables:– Rapid analysis of traces to find the longest running
code
– Longest running SQL query
– Highest call count, and other metrics useful in debugging a performance problem.
– A call tree of the code that was executed, allowing the developer to gain insight quickly into unfamiliar code.
– Jumping from the search feature to the call tree, so that the person analyzing the trace can determine how the problematic code was called.
AX Trace Parser
AX Trace Parser
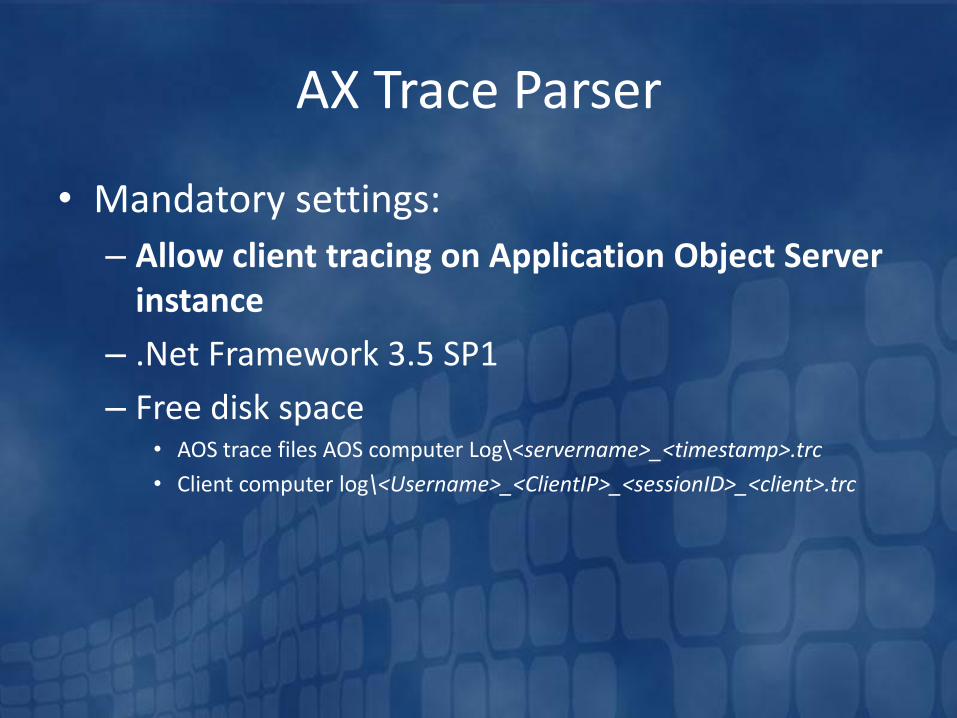
• Mandatory settings:
– Allow client tracing on Application Object Server instance
– .Net Framework 3.5 SP1
– Free disk space• AOS trace files AOS computer Log\<servername>_<timestamp>.trc
• Client computer log\<Username>_<ClientIP>_<sessionID>_<client>.trc
AX Trace Parser
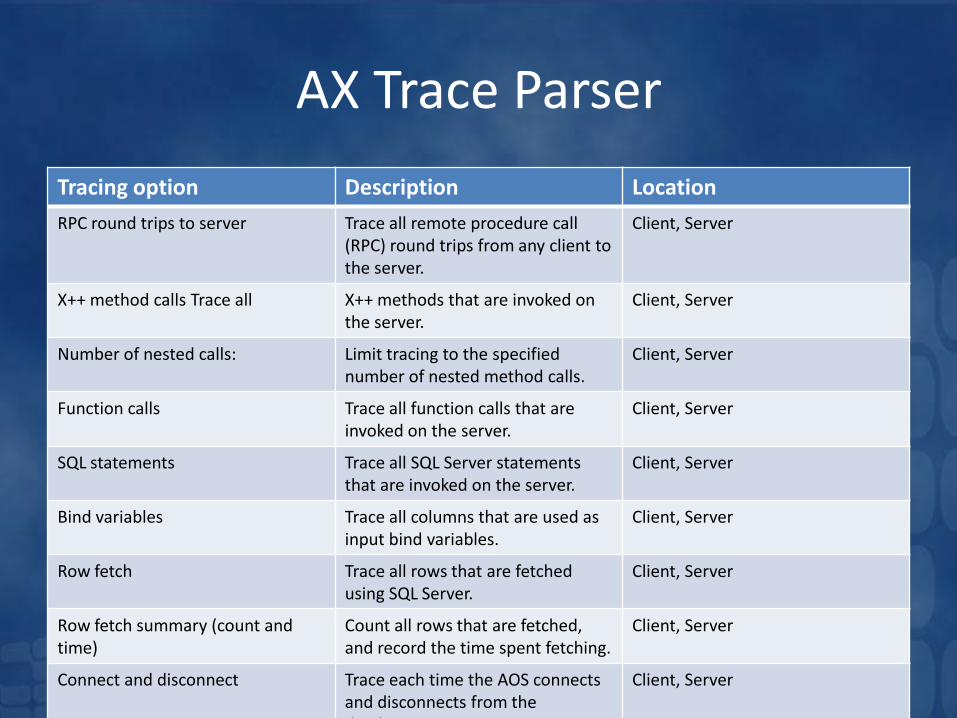
Tracing option Description Location
RPC round trips to server Trace all remote procedure call (RPC) round trips from any client to the server.
Client, Server
X++ method calls Trace all X++ methods that are invoked onthe server.
Client, Server
Number of nested calls: Limit tracing to the specified number of nested method calls.
Client, Server
Function calls Trace all function calls that are invoked on the server.
Client, Server
SQL statements Trace all SQL Server statements that are invoked on the server.
Client, Server
Bind variables Trace all columns that are used as input bind variables.
Client, Server
Row fetch Trace all rows that are fetched using SQL Server.
Client, Server
Row fetch summary (count and time)
Count all rows that are fetched, and record the time spent fetching.
Client, Server
Connect and disconnect Trace each time the AOS connects and disconnects from the database.
Client, Server
AX Trace Parser
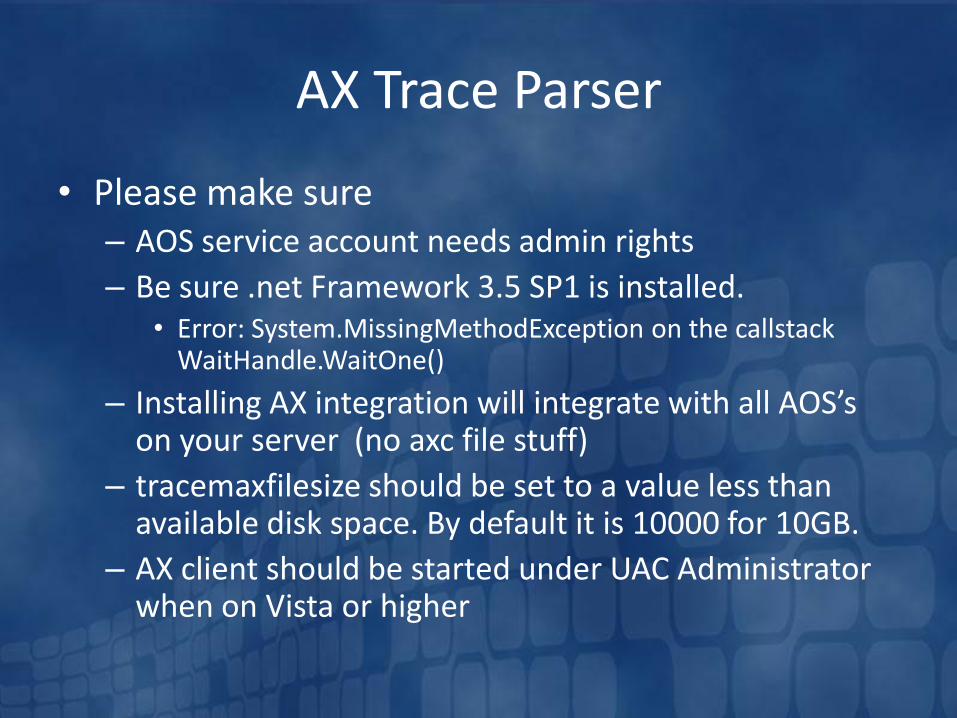
• Please make sure– AOS service account needs admin rights
– Be sure .net Framework 3.5 SP1 is installed.• Error: System.MissingMethodException on the callstack
WaitHandle.WaitOne()
– Installing AX integration will integrate with all AOS’s on your server (no axc file stuff)
– tracemaxfilesize should be set to a value less than available disk space. By default it is 10000 for 10GB.
– AX client should be started under UAC Administrator when on Vista or higher
AX Trace Parser
DEMO: AX Trace Parser
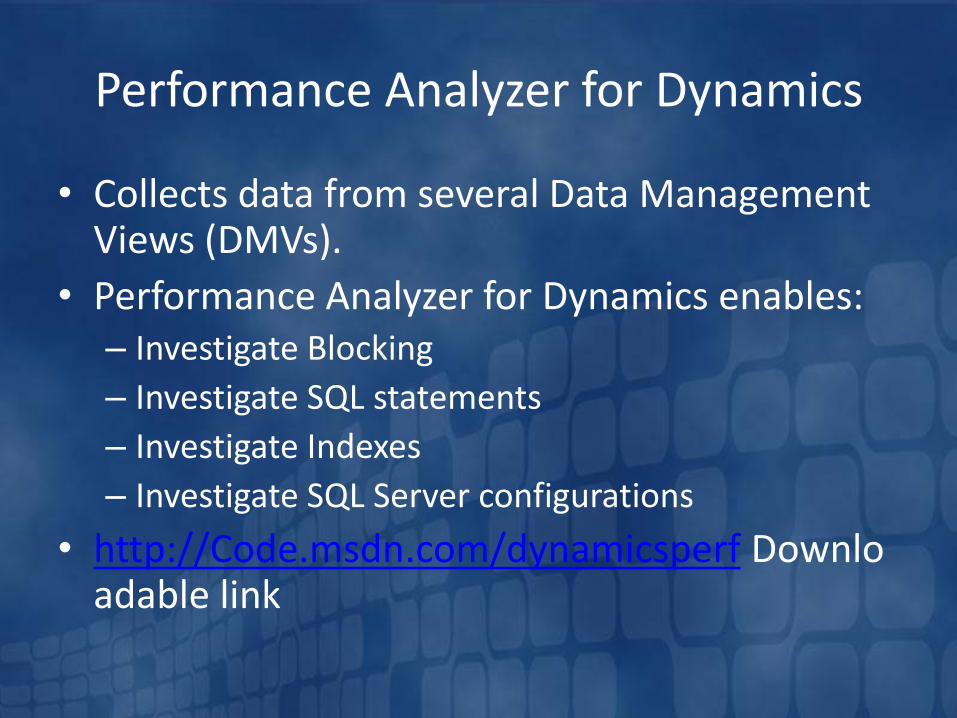
Performance Analyzer for Dynamics
• Collects data from several Data Management Views (DMVs).
• Performance Analyzer for Dynamics enables:– Investigate Blocking
– Investigate SQL statements
– Investigate Indexes
– Investigate SQL Server configurations
• http://Code.msdn.com/dynamicsperf Downloadable link
Performance Analyzer for Dynamics
DEMO: Performance Analyzer for Dynamics
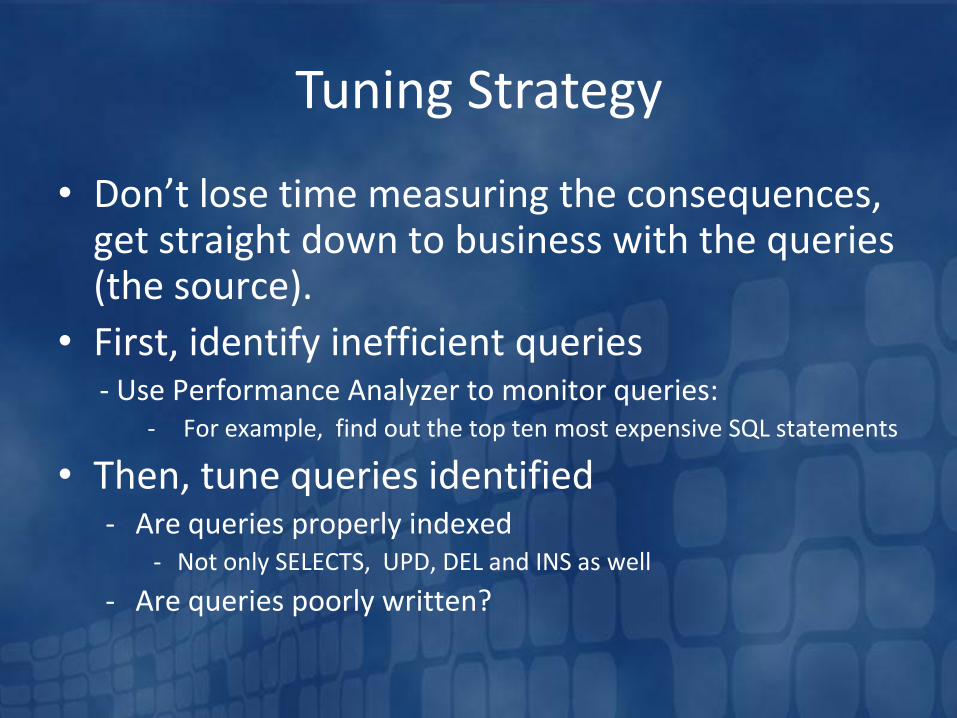
Tuning Strategy
• Don’t lose time measuring the consequences, get straight down to business with the queries (the source).
• First, identify inefficient queries- Use Performance Analyzer to monitor queries:
- For example, find out the top ten most expensive SQL statements
• Then, tune queries identified- Are queries properly indexed
- Not only SELECTS, UPD, DEL and INS as well
- Are queries poorly written?
Tuning Strategy
• Dynamics AX kernel generated the SQL statement
• Tweak the X++ SQL Statement and AOT Queries
• Use SQL Server Profiler to monitor the generated SQL statement
Solid State Drives (SSDs)
• SSDs are ideal for tempdb, given tembdb’s disk oriented workload
• SSDs have lower mean time between failures than HDDs
• no moving parts to wear down
• HDDs involve physically moving metal at high speed
• SSDs are similar in nature to RAM. – No physically moving parts
– Concurrent access
– Extremely high speed
Solid State Drives (SSDs)
• Even if SSD fails, having tempdb on it creates no risk• tempdb persists no transactional data
• tempdb is totally rebuilt upon every reboot of SQL Server
• even if device totally fails, tempdb can be relocated on HDD during restart of SQL Server
• Testing / Live results• Customer testing & live deployment of SDD on tempdb alone
confirms significant improvement in system performance
• large-scale financial services online system
• 19,000% reduction in IO stalls in batch processing
Solid State Drives (SSDs)
• Move tables (and associated indexes) that are accessed (created, updated, read) with high frequency to Solid State Hard Drives.
– Reason: Tables that are accessed with high frequency have the potential to become a bottleneck in an application.
OAD Performance Services
• Performance Review
– Help you understand the root cause for performance bottleneck
– Provide steps for suggested resolutions.
– Delivered remotely or onsite
Contact OutsourceAX Development support for more information about the performance service. [email protected]

Thanks you!
Questions?
If you have follow up questions, please feel free to send me an email.