dynamics of methane emissions during municipal wastewater
TRANSCRIPT

Faculty of Bioscience Engineering
Academic year 2012 – 2013
Dynamics of methane emissions during municipal
wastewater treatment
Tamara Van Eynde
Promotor: Prof. dr. ir. Eveline Volcke
Tutor: ir. Matthijs Daelman
Master’s dissertation submitted in fulfillment of the requirements for the degree of
Master of science in Bioscience Engineering: Environmental Technology


Declaration of author rights
The author and the promotor give the authorization to consult and to copy parts of this work for
personal use only. Every other use is subject to the copyright laws, more specifically the source must
be extensively specified when using from this thesis. Permission to reproduce any materials
contained in this work should be obtained from the author.
Ghent, June 2013
Author Promotor
Tamara Van Eynde Prof. Dr. Ir. Eveline Volcke


Preface This work is the result of a thesis research at the Department of Biosystems Engineering at the
faculty of Bioscience Engineering at Ghent University. The first efforts started in August 2012. It was
a long and winding road, with numerous obstacles and blind alleys. I beat my brains understanding
microbiological behaviour, interpreting model outputs and detecting Matlab errors. If there is one
thing I learned during this entire process, it is that nothing is like you first thought it would be.
Problems and questions arise with every step of progress and solutions are not always clear and
achievable.
We cannot solve our problems with the same thinking we used when we created them.
Albert Einstein
After 10 months of toiling, I can proudly present you my master thesis ‘Dynamics of methane
emissions during municipal wastewater treatment’. I want to thank the people who contributed to
the realization of this work. My first word of thanks goes to my promoter prof. dr. ir. Eveline Volcke
for the regular evaluation and recommendations. Secondly, I want to thank my tutor ir. Matthijs
Daelman for guiding me through this entire process and for always standing by me. I also would like
to thank dr. Ulf Jeppsson for providing the MATLAB code of BSM1. I am thankful for M.Sc. Güray
Yildiz for learning to work with the GC and Eddy Philips for helping me to set up my experiments.
Further, I thank my fellow thesis students for the enjoyable moments during the breaks at the
faculty. Lastly, I am also grateful to my parents, family and friends for listening to my frustrations,
for encouraging me and for giving me the powerful relaxation and entertainment.


Abstract During municipal wastewater treatment, three important greenhouse gases are emitted, namely
methane, nitrous oxide and carbon dioxide. In this master thesis, the dynamics of methane
emissions during municipal wastewater treatment were investigated.
Data from research available in literature suggest that methane emissions from wastewater
treatment contributes with 1.59% to the global anthropogenic greenhouse gas emissions, in terms
of CO2 equivalents. Methane is generated at the wastewater treatment plant (WWTP) under
anaerobic conditions. Due to its high volatility, it is easily stripped to the atmosphere when the
liquid is exposed to the air. Methane can also be generated before it enters the plant. Anaerobic
conditions in the sewer systems favour generation of methane, and this methane enters the WWTP
with the influent. Instead of being stripped, methane can also be converted aerobically by
methanotrophic organisms in the activated sludge reactor. At this moment, the reaction kinetics and
parameters affecting this process are not completely understood.
For this master thesis work, experiments have been conducted to measure the rate of methane
oxidation in activated sludge. The effect of temperature and ammonium concentration on the
methane oxidation rate was investigated. However, due to practical limitations, it was not possible
to observe methane oxidation.
Through modelling, methane emissions and conversion were implemented in activated sludge
models. The process of methane oxidation was implemented in Activated Sludge Model no. 1
(ASM1) and Benchmark Simulation Model no. 1 (BSM1). The modified models, called ASM1m and
BSM1m, allow consideration of methane emissions in the evaluation of activated sludge processes.
Values for stoichiometric and kinetic parameters, necessary to describe the process, were based on
literature.
A simulation study was performed to identify important parameters affecting methane oxidation
and emission. Especially the sludge retention time (SRT) and aeration intensity of the aerobic
reactors are recognized as important for the control of methane emissions from WWTPs. The
simulation study also indicated that utilization of methane containing gases to aerate the activated
sludge reactor is a promising technique to reduce methane emissions from wastewater treatment.


Samenvatting Tijdens afvalwaterzuivering worden drie belangrijke broeikasgassen vrijgesteld in de atmosfeer,
namelijk methaan, lachgas en koolstofdioxide. De dynamiek van methaanemissies bij gemeentelijke
afvalwaterzuivering is het onderwerp van deze masterproef.
Literatuuronderzoek geeft aan dat methaanemissies door afvalwaterzuivering verantwoordelijk zijn
voor 1.59% van de globale antropogene broeikasgasemissies, uitgedrukt in CO2-equivalenten.
Methaan wordt hoofdzakelijk gevormd in anaerobe condities in de waterzuiveringsinstallatie en
door zijn hoge vluchtigheid wordt het gemakkelijk gestript wanneer de vloeistof wordt blootgesteld
aan de lucht. Bovendien zijn de anaerobe condities in de rioolstelsels gunstig voor methaanvorming,
waardoor het afvalwater reeds methaan bevat wanneer het de rioolwaterzuivering (RWZI)
binnentreedt. Methaan wordt niet alleen gestript, het wordt ook aeroob omgezet worden door
methanotrofe bacteriën in de actief slib reactor. Op dit moment bestaat er echter nog veel
onzekerheid over de proceskinetiek en de parameters die methaanoxidatie beïnvloeden.
In deze studie werd experimenteel onderzoek uitgevoerd om de snelheid van methaanoxidatie in
actief slib waar te meten. Ook het effect van de temperatuur en ammoniumconcentratie op de
snelheid van methaanconversie werden onderzocht. Door praktische beperkingen was het echter
niet mogelijk om oxidatie van methaan waar te nemen.
Via modelbouw werden emissie en conversie van methaan geïmplementeerd in actief slib modellen.
Het methaanoxidatieproces werd geïmplementeerd in Activated Sludge Model no. 1 (ASM1) en
Benchmark Simulation Model no. 1 (BSM1). De aangepaste modellen, genaamd ASM1m en BSM1m,
houden rekening met methaanemissies bij de evaluatie van de prestatie van actief slib processen.
Waarden voor stoichiometrische en kinetische parameters, nodig voor de beschrijving van het
model, zijn gebaseerd op onderzoek in de literatuur.
Een simulatiestudie werd uitgevoerd om parameters te identificeren die een effect uitoefenen op
het methaanoxidatieproces. Vooral de slibretentietijd (SRT) en reactorbeluchting blijken belangrijk
te zijn voor het beheersen van methaanemissies bij afvalwaterzuivering. Bovendien geeft de
simulatiestudie aan dat beluchting van de actief slib reactoren met methaan bevattende gassen
afkomstig van andere delen van de RWZI een veelbelovende techniek is om de methaanuitstoot
door afvalwaterzuivering te reduceren.


Contents | i
Contents List of abbreviations .............................................................................................................................. v
List of symbols...................................................................................................................................... vii
Chapter I: Introduction .......................................................................................................................... 1
Chapter II: Literature review ................................................................................................................. 3
1. Introduction ................................................................................................................................ 3
2. Emissions of greenhouse gases during wastewater treatment ................................................. 3
2.1 Carbon dioxide .................................................................................................................... 3
2.2 Methane ............................................................................................................................. 3
2.3 Nitrous oxide ...................................................................................................................... 4
2.4 Water vapour ...................................................................................................................... 4
2.5 Reduction of GHG emissions during wastewater treatment ............................................. 4
3. The global warming effect .......................................................................................................... 4
4. Contribution of methane emissions to global GHG emissions ................................................... 5
4.1 Share of anthropogenic GHG in global atmospheric GHG concentration .......................... 5
4.2 Share of wastewater treatment in anthropogenic GHG emissions ................................... 7
4.3 Share of methane emissions in total emissions released from WWTPs ............................ 8
4.4 Summery ........................................................................................................................... 11
5. Estimation of methane emissions from wastewater treatment processes ............................. 12
5.1 Country level ..................................................................................................................... 12
5.2 Facility level ...................................................................................................................... 15
6. Origin of methane emissions during municipal wastewater treatment .................................. 15
6.1 Mechanism of methane formation .................................................................................. 15
6.2 Methane stripping ............................................................................................................ 16
6.3 Sewer systems .................................................................................................................. 17
6.4 Primary and secondary wastewater treatment ............................................................... 18
6.5 Sludge treatment .............................................................................................................. 19
6.6 Biosolids ............................................................................................................................ 20
7. Biological conversion of methane ............................................................................................ 20
7.1 Microbiology ..................................................................................................................... 20
7.2 Engineered systems .......................................................................................................... 25

ii | Contents
8. Factors affecting methane emissions during wastewater treatment ..................................... 30
8.1 Management of the system ............................................................................................. 30
8.2 Anaerobic sludge digestion .............................................................................................. 30
8.3 Environmental temperature ............................................................................................ 30
8.4 Dissolved oxygen concentration in the aerobic parts of the WWTP ............................... 31
8.5 Addition of chemicals in sewers to reduce the influent methane load ........................... 31
9. Conclusions .............................................................................................................................. 32
Chapter III: Experimental research ..................................................................................................... 33
1. Introduction ............................................................................................................................. 33
2. Experimental set-up ................................................................................................................. 33
2.1 General ............................................................................................................................. 33
2.2 Experimental set-up no. 1 ................................................................................................ 33
2.3 Experimental set-up no.2 ................................................................................................. 34
2.3 Experimental set-up no.3 ................................................................................................. 35
2.4 Practical limitations .......................................................................................................... 35
3. Analytical methods .................................................................................................................. 36
3.1 Analysis of the methane headspace concentration ......................................................... 36
3.2 Soluble ammonia concentration ...................................................................................... 36
3.3 TSS and VSS concentration .............................................................................................. 36
4. Results ...................................................................................................................................... 36
5. Conclusions .............................................................................................................................. 37
Chapter IV: Modelling methane oxidation in activated sludge processes ........................................ 39
1. Introduction ............................................................................................................................. 39
2. ASM1 with methane oxidation – ASM1m ................................................................................ 39
3. State variables .......................................................................................................................... 40
4. Conversion processes .............................................................................................................. 40
4.1 Stoichiometry ................................................................................................................... 40
4.2 Reaction kinetics .............................................................................................................. 44
4.3 Parameters ....................................................................................................................... 44
5. Mass balances .......................................................................................................................... 47
5.1 Advective transport.......................................................................................................... 47
5.2 Interphase transport ........................................................................................................ 48

Contents | iii
5.3 Conversion processes ....................................................................................................... 49
6. Implementation of ASM1m in Matlab - Simulink ..................................................................... 49
6.1 Simulink model ................................................................................................................. 49
6.2 Evaluation of the reactor performance ............................................................................ 51
7. Incorporation of ASM1m in a wastewater treatment plant model – BSM1m ......................... 52
7.1 Simulation benchmark ...................................................................................................... 52
7.2 BSM1 with methane oxidation – BSM1m......................................................................... 53
7.3 Evaluation of the plant performance ............................................................................... 53
8. Conclusions ............................................................................................................................... 54
Chapter V: Simulation study ................................................................................................................ 57
1. Introduction .............................................................................................................................. 57
2. Set-up of simulation study........................................................................................................ 57
2.1 Initialization of ASM1m .................................................................................................... 57
2.2 Initialization of BSM1m .................................................................................................... 59
3. Behaviour of ASM1m ................................................................................................................ 60
3.1 Reference scenario ........................................................................................................... 61
3.2 Scenario analysis ............................................................................................................... 62
4. Simulation of methane conversion in a wastewater treatment plant with BSM1m ............... 66
4.1 Reference scenario ........................................................................................................... 66
4.2 Scenario analysis ............................................................................................................... 68
5. Conclusions ............................................................................................................................... 76
5.1 ASM1m ............................................................................................................................. 76
5.2 BSM1m ............................................................................................................................. 77
Chapter VI: General conclusions and further perspectives ........................................................... 79
References ................................................................................................................................. 81
Appendices ................................................................................................................................ 87
Appendix 1: Assumptions and simplifications in ASM1 .................................................................. 87
Appendix 2: Constraints ASM1 ......................................................................................................... 90
Appendix 3: Significance of all added stoichiometric coefficients ................................................... 91
Appendix 4: Effluent quality limits ................................................................................................... 92
Appendix 5: BSM1m in Matlab - Simulink ........................................................................................ 93
Appendix 6: Effect of the methane saturation concentration in ASM1m ........................................ 94

iv | Contents
Appendix 7: Effect of reactor aeration in the BSM1m plant ........................................................... 95
Appendix 8: Effect of methane influent concentration in the BSM1m plant ................................. 98
Appendix 9: Effect of the biomass SRT in the BSM1m plant ........................................................... 99

List of abbreviations | v
List of abbreviations
ADM1 Anaerobic Digester Model no. 1
AGO Australian Greenhouse Office
AMEGGES Australian Methodology for the Estimation of Greenhouse Gas Emissions and Sinks
AMO Ammonia Monooygenase
AOB Ammonia Oxidizing bacteria
ASM Activated sludge model
ASM1 Activated sludge model no. 1
ASM1m Activated sludge model no. 1m
BNR Biological Nitrogen Removal
BOD Biological Oxygen Demand
BSM1 Benchmark Simulation Model no. 1
BSM1m Benchmark Simulation Model no. 1m
BSM2 Benchmark Simulation Model no. 2
CEC California Energy Commission
COD Chemical Oxygen Demand
COST European Co-operation in the field of Scientific and Technical Research
CSTR Continuous Stirred Reactor Tank
DHS Downflow Hanging Sponge reactor
DO Dissolved Oxygen
EQI Effluent Quality Index
GC Gas Chromatograph
GWP Global Warming Potential
GHG Greenhouse Gas

vi | List of abbreviations
HFBR Horizontal Flow Biofilm Reactor
HRT Hydraulic Retention Time
IAWPRC International Association on Water Pollution Research and Control
IPCC Intergovernmental Panel on Climate Change
IWA International Water Association
IWSA International Water Supply Association
LCA Life Cycle Analysis
MMO Methane Monooxygenase
MOB Methane Oxidizing Bacteria
NACWA National Association of Clean Water Agencies
OCI Operational Cost Index
OLAND Oxygen-Limited Autotrophic Nitrification/ Denitrification
pMMO Particulate Methane Monooxygenase
PE Population Equivalent
RBCOD Readily Biodegradable Chemical Oxygen Demand
sMMO Soluble Methane Monooxygenase
SRT Sludge Residence Time
TIV Time In Violation
UASB Upflow Anaerobic Sludge Blanket
UNFCCC United Nations Framework Convention On Climate Change
USEPA United States Environmental Protection Agency
WWTP Wastewater Treatment Plant
µ-DMD Differential Mobility Detector
µ-TCD Thermal Conductivity Detector

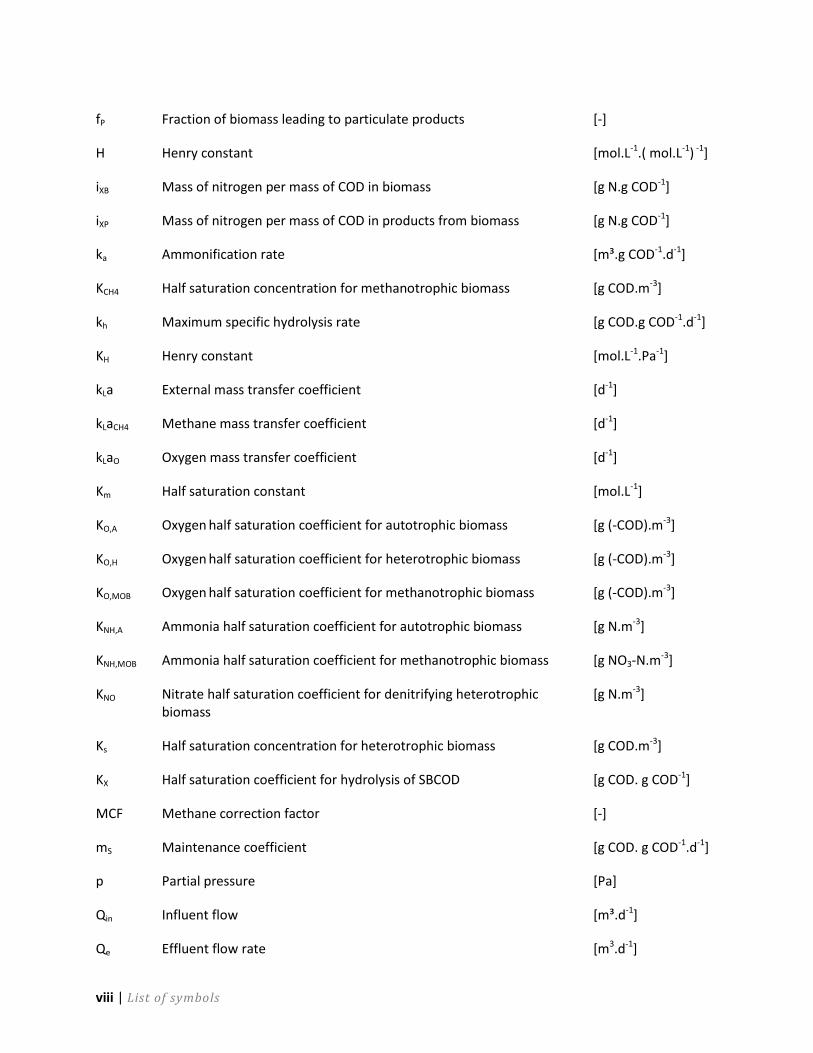
List of symbols | vii
List of symbols
A Area [m2]
bA Decay coefficient for autotrophic biomass [d-1]
BBOD5 Weighting factor of BOD5 effluent load (BBOD5 = 2) [g pollution unit. g-1]
BCOD Weighting factor of BOD5 effluent load (BCOD = 1) [g pollution unit. g-1]
bH Decay coefficient for heterotrophic biomass [d-1]
BNHj Weighting factor of Kjeldahl nitrogen effluent load (BNKj = 30) [g pollution unit. g-1]
BNO Weighting factor of nitrate effluent load (BNO = 10) [g pollution unit. g-1]
BTSS Weighting factor of TSS effluent load (BTSS = 2) [g pollution unit. g-1]
BBOD5 Weighting factor of BOD5 effluent load (BBOD5 = 2) [g pollution unit. g-1]
BCOD Weighting factor of BOD5 effluent load (BCOD = 1) [g pollution unit. g-1]
bMOB Decay coefficient for methanotrophic biomass [d-1]
BNHj Weighting factor of Kjeldahl nitrogen effluent load (BNKj = 30) [g pollution unit. g-1]
BNO Weighting factor of nitrate effluent load (BNO = 10) [g pollution unit. g-1]
bMOB Decay coefficient for methanotrophic biomass [d-1]
B0 Maximum methane producing potential [g CH4. g COD-1]
C Concentration of soluble (S) or particulate (X) material in bulk liquid [g COD.m-3]
Cg Gas phase concentration [mol.L-1]
Cin Influent soluble (S) or particulate (X) material concentration [g COD.m-3]
C* Concentration of volatile soluble material in bulk liquid in equilibrium with the gas phase
[g COD.m-3]
DCH4 Diffusion coefficient for methane in water at a certain temperature [cm².s-1]
DO2 Diffusion coefficient for oxygen in water at a certain temperature [cm².s-1]
EF Emission factor [g CH4. g COD-1]
FNA Free nitrous acid
viii | List of symbols
fP Fraction of biomass leading to particulate products [-]
H Henry constant [mol.L-1.( mol.L-1) -1]
iXB Mass of nitrogen per mass of COD in biomass [g N.g COD-1]
iXP Mass of nitrogen per mass of COD in products from biomass [g N.g COD-1]
ka Ammonification rate [m³.g COD-1.d-1]
KCH4 Half saturation concentration for methanotrophic biomass [g COD.m-3]
kh Maximum specific hydrolysis rate [g COD.g COD-1.d-1]
KH Henry constant [mol.L-1.Pa-1]
kLa External mass transfer coefficient [d-1]
kLaCH4 Methane mass transfer coefficient [d-1]
kLaO Oxygen mass transfer coefficient [d-1]
Km Half saturation constant [mol.L-1]
KO,A Oxygen half saturation coefficient for autotrophic biomass [g (-COD).m-3]
KO,H Oxygen half saturation coefficient for heterotrophic biomass [g (-COD).m-3]
KO,MOB Oxygen half saturation coefficient for methanotrophic biomass [g (-COD).m-3]
KNH,A Ammonia half saturation coefficient for autotrophic biomass [g N.m-3]
KNH,MOB Ammonia half saturation coefficient for methanotrophic biomass [g NO3-N.m-3]
KNO Nitrate half saturation coefficient for denitrifying heterotrophic biomass
[g N.m-3]
Ks Half saturation concentration for heterotrophic biomass [g COD.m-3]
KX Half saturation coefficient for hydrolysis of SBCOD [g COD. g COD-1]
MCF Methane correction factor [-]
mS Maintenance coefficient [g COD. g COD-1.d-1]
p Partial pressure [Pa]
Qin Influent flow [m³.d-1]
Qe Effluent flow rate [m3.d-1]

List of symbols | ix
r Conversion rate [g COD.m-3.d-1]
rCH4 Specific methane consumption rate [g COD.g COD-1.d-1]
ri Conversion rate of component i [g COD.m-3.d-1]
rS Specific substrate consumption rate [g COD.g COD-1.d-1]
SALK Alkalinity [mole.m-3]
SCH4 Soluble methane substrate [g COD.m-3]
SCH4,sat Saturated methane concentration [g COD.m-3]
SI Soluble inert organic matter [g COD.m-3]
SO Dissolved oxygen [g (-COD).m-3]
SO,sat Saturated oxygen concentration [g (-COD).m-3]
SP Sludge production [kg TSS.d-1]
SND Soluble biodegradable organic nitrogen [g N.m-3]
SNH Ammonium and ammonia [g N.m-3]
SNO Nitrate and nitrite [g N.m-3]
SS Readily biodegradable substrate [g COD.m-3]
t Time [d]
tobs Period of observation [d]
TSSas Total amount of suspended solids present in the activated sludge reactors
[g TSS]
TSSsc Total amount of suspended solids present in the secondary clarifier [g TSS]
V Volume [m³]
XI Particulate inert organic matter [g COD.m-3]
XI2TSS Conversion factor COD to TSS for XI [g TSS. g COD-1]
XBA Active autotrophic biomass [g COD.m-3]
XBA2TSS Conversion factor COD to TSS for XBA [g TSS. g COD-1]
XBH Active heterotrophic biomass [g COD.m-3]

x | List of symbols
XBH2TSS Conversion factor COD to TSS for XBH [g TSS. g COD-1]
XMOB Active methanotrophic biomass [g COD.m-3]
XMOB Conversion factor COD to TSS for XMOB [g TSS. g COD-1]
XND Particulate biodegradable organic nitrogen [g N.m-3]
XP Particulate products arising from biomass decay [g COD.m-3]
XP2TSS Conversion factor COD to TSS for XP [g TSS. g COD-1]
XS Slowly biodegradable substrate [g COD.m-3]
XS2TSS Conversion factor COD to TSS for XS [g TSS. g COD-1]
YA Yield for autotrophic biomass [g COD.g COD-1]
YH Yield for heterotrophic biomass [g COD.g COD-1]
YMOB Yield for methanotrophic biomass [g COD.g COD-1]
Yxs, true True growth yield coefficient [g COD.g COD-1.d-1]
ηy,g Correction factor for μH under anoxic conditions [-]
ηy,h Correction factor for hydrolysis under anoxic conditions [-]
μ Maximum specific biomass growth [d-1]
μmax,A Maximum specific growth rate for autotrophic biomass [d-1]
μmax,H Maximum specific growth rate for heterotrophic biomass [d-1]
μmax,MOB Maximum specific growth rate for methanotrophic biomass [d-1]
ρj process rate expression for process j [g COD.m-3.d-1]
νij Stoichiometric coefficient component i for process j [-]

Chapter I: Introduction | 1
Chapter I: Introduction Three important greenhouse gases are emitted during municipal wastewater treatment, namely
methane, nitrous oxide and carbon dioxide. Because of the rising importance of the abatement of
greenhouse gas emissions, it is important to understand the processes responsible for these
emissions. In this master thesis, the dynamics of methane emissions during municipal wastewater
treatment were investigated. The objective was to investigate the process of methane oxidation by
activated sludge in order to better understand methane emissions from wastewater treatment. The
aim was to (1) analyse the performed research in literature, (2) determine the process kinetics, (3)
identify the affecting parameters and (4) find out the effect of this parameters. It was hypothesised
that the temperature, ammonium concentration, aeration intensity and the sludge residence time
(SRT) would affect methane oxidation by activated sludge. A literature survey, experimental
research and simulations were performed.
Chapter II gives an overview of the established knowledge and performed research. A literature
survey was performed to investigate the importance of methane emissions from WWTPs and to
identify the biological and physical processes taking place before and during wastewater treatment.
Also some methodologies to estimate methane emissions from wastewater treatment are discussed
in this Chapter. Notably, methane can also be converted aerobically in the activated sludge tank. At
this moment, this process is not clearly understood.
Experimental research was performed to measure the rate of methane conversion in a lab-scale
activated sludge reactor and to investigate the effect of temperature and ammonium concentration.
The applied materials and methods are described in Chapter III.
Modelling techniques were used to simulate methane emissions during activated sludge processes.
Therefore, processes of methane emission and conversion were implemented in existing activated
sludge models. The modified models are described in Chapter IV. A simulation study was performed.
The results from the different scenarios analyses are presented and discussed in Chapter V.
General conclusions and further perspectives of this master thesis are given in Chapter VI.


Chapter II: Literature review | 3
Chapter II: Literature review
1. Introduction
The rising interest in the abatement of anthropogenic greenhouse gas (GHG) emissions requires
identification and optimization of the main GHG emitting activities and processes. The wastewater
treatment sector is known as a considerable source of GHG emissions. Three important GHGs are
emitted during wastewater treatment, i.e. carbon dioxide (CO2), methane (CH4), and nitrous oxide
(N2O) (IPCC 2006) This chapter gives an overview of the established knowledge and reported full-
scale observations of methane emissions from wastewater treatment.
In section 2 and 3, some information about the GHG emissions caused by the wastewater treatment
sector and the effect of global warming is considered. The importance of methane emissions from
wastewater treatment is investigated in section 4. Some estimation methodologies are discussed in
section 5. In section 6, the processes of methane generation and the affecting factors are identified.
Biological conversion of methane in the activated sludge reactor is described in section 7.
Parameters affecting methane emission from WWTPs are enumerated in the last section.
2. Emissions of greenhouse gases during wastewater treatment
Three important GHGs are emitted from wastewater treatment plants (WWTPs) i.e. carbon dioxide,
methane and nitrous oxide. Also water vapour is released to the atmosphere. Their generation
processes are summarized in this section.
2.1 Carbon dioxide
The emission of carbon dioxide during municipal wastewater treatment originates either directly
from the respiration of organic matter or incineration of sludge and combustion of biogas, or
indirectly from fossil fuel combustion to generate the energy required to operate the plant. The
direct emission is generally accepted as ‘biogenic’ carbon-neutral or short-cycle carbon dioxide
emission and is not considered as anthropogenic (IPCC 2006, CH2MHill 2008, STOWA 2010). The
indirect emission is sufficiently known and emitted quantities of indirect carbon dioxide from
wastewater treatment can be easily predicted (STOWA 2010).
2.2 Methane
More uncertainty exists about the emission of methane during wastewater treatment (STOWA
2010). Methane is produced at various stages of the WWTP (Daelman et al. 2012b). Because
methane can already be formed in the sewer system, it also enters the WWTP with the influent

4 | Chapter II: Literature review
(Guisasola et al. 2008). Methane can be stripped and microbially consumed during several processes
in wastewater treatment (Daelman et al. 2012b).
2.3 Nitrous oxide
The dynamics of nitrous oxide emissions released from WWTPs are not completely understood
(STOWA 2010). Nitrous oxide is a by- or intermediate product of nitrification - denitrification
processes in the respectively aerobic and anoxic phase of WWTPs. Also combustion of biogas can be
a source of nitrous oxide emissions (CH2MHill 2008). A lot of research for nitrous oxide emissions
during municipal wastewater treatment is already performed.
2.4 Water vapour
Also water vapour (H2O) is released during wastewater treatment. Although water vapour
contributes considerably to the greenhouse gas effect, it is not considered as a ‘real’ GHG. The
hydrological water cycle emits water vapour to the atmosphere and brings it back to the earth
surface in the form of rain. Human activities do not directly affect this water cycle. Water vapour
emissions only contribute to the natural greenhouse gas effect (Solomon and Averyt 2007).
2.5 Reduction of GHG emissions during wastewater treatment
Considering the increasing interest in reduction of the global warming effect, the abatement of the
emission of GHG gases in wastewater treatment plants (WWTPs) can play an important role in
sustainable development on a global scale (IPCC 2006). At this moment, knowledge on the dynamics
of methane and nitrous oxide emissions during wastewater treatment is limited and a general
standardized method to estimate these emissions does not exist (Frijns 2012). Because methane is
identified as the most important GHG in wastewater treatment (section 4) and performed research
for methane emissions from WWTPs is limited, further research would be useful to reduce the
problem of global warming.
3. The global warming effect
The greenhouse effect provides an agreeable temperature on earth of on average ca. 14°C and
makes life possible (IPCC 2007). In the past, before the beginning of the industrial revolution, the
emission of anthropogenic greenhouse gases was limited and the global average surface
temperature remained constant (Griggs and Noguer 2002). The temperature has increased by about
0.74°C over the 100 year period 1906 – 2005, due to anthropogenic greenhouse gas emissions in
addition to the naturally occurring emissions (IPCC 2007). This global warming induced other
environmental processes e.g. melting of the ice sheets in polar regions, retreat of mountain glaciers

Chapter II: Literature review | 5
in non-polar regions and rising of the global average sea level which favoured further warming up
and strengthened the perceived effects (Griggs and Noguer 2002).
The average earth temperature is not only determined by the concentration of ‘real’ GHG in the
atmosphere. The hydrological cycle strongly affects the climate. A large part of the present day total
greenhouse effect can be attributed to water vapour (ca. 50%) and clouds (ca. 25%). The
atmospheric carbon dioxide is only responsible for about 20% of the total greenhouse gas effect.
(Schmidt et al. 2010). The contribution of methane and nitrous oxide is less than 5%.
4. Contribution of methane emissions to global GHG emissions
In this section, the importance of methane released during wastewater treatment is investigated.
First, the share of anthropogenic greenhouse gases in total greenhouse gas emissions is considered.
Secondly, the contribution of wastewater treatment in total anthropogenic GHG emissions is
discussed. Afterwards, the share of methane in total emissions from wastewater treatment is
investigated. Finally, the contribution of methane emissions from WWTPs in total anthropogenic
GHG emissions are investigated.
4.1 Share of anthropogenic GHG in global atmospheric GHG
concentration
The concentration of GHGs in the atmosphere has been rising since the beginning of the industrial
revolution. Figure 1 illustrates the increasing concentrations of carbon dioxide, methane and nitrous
oxide during the millennium 1000 - 2000 (Griggs and Noguer 2002). Since the beginning of the
industrial revolution in 1750, the atmospheric concentration of these three gases has increased by
39%, 158% and 19% respectively (EPA 2013). The main sources are fossil fuel burning and land use
change for carbon dioxide; use of fossil fuels, cattle, rice agriculture and landfills for methane; and
agricultural soils, cattle feed lots and chemical industry for nitrous oxide (Griggs and Noguer 2002).
Globally, about 60% of total methane emissions and 40% of total nitrous oxide emissions come from
human activities (EPA 2013). The contribution of GHGs emitted by human activities in total
anthropogenic GHG emissions in the United States in 2011 is given in Figure 2. Methane is the
second most prevalent GHG and accounts for about 8.8% of all greenhouse gas emissions from
human activities in the United States (EPA 2013). Because human activities do not directly affect the
hydrological water cycle, water vapour is not considered as an anthropogenic GHG.

6 | Chapter II: Literature review
Figure 1: Global atmospheric concentrations of three well mixed greenhouse gases (Griggs and Noguer 2002)
Figure 2: GHGs emitted in the United States in 2011 - percentages are based on CO2-equivalents (EPA 2013)
Table 1 gives an overview of the global warming potential (GWP) of the three most important GHGs
in function of the time horizon. The GWP is the ratio of the warming effect caused by a substance to
the warming effect caused by a similar mass of carbon dioxide. GWPs are always calculated over a
certain time horizon. The change in GWP for different time horizons depends upon the atmospheric
lifetimes of the GHGs (Griggs and Noguer 2002). The time horizon is the length of time over which
the effect of a certain GHG on the earth’s climate needs to be quantified (Reay et al. 2010). The
Methane 9%
Fluorinated gases
2% Nitrous oxide
5%
Carbon dioxide
84%

Chapter II: Literature review | 7
atmospheric lifetime is 50-200 years for carbon dioxide, 21 years for methane and 120 years for
nitrous oxide (EPA 2013). Because carbon dioxide is the reference substance, its GWP is always 1.
The GWP for methane is lower for larger time horizons, the GWP for nitrous oxide is the highest for
a time horizon of 100 years (Table 1). This can be explained as follows. Because of the low
atmospheric lifetime of methane, its warming effect decreases for higher time horizons. The GWP
for nitrous oxide is slightly higher at a 100 years time horizon, compared with 20 years. Presumably,
the global warming effect of carbon dioxide decreases more than that of nitrous oxide when the
time horizon is changed from 20 to 100 years, resulting in a net rise of the GWP for nitrous oxide.
For a 500 years horizon, the GWP of nitrous oxide is reduced to almost half of its value, which
indicates a strong decrease in warming effect of nitrous oxide when larger time horizons are
assumed. A time horizon of 100 years is considered in this work.
Table 1: Direct global warming potential relative to carbon dioxide (IPCC 2007)
Gas
Global Warming Potential (Time Horizon in years)
20 years 100 years 500 years CO2 1 1 1
CH4 72 25 7.6
N2O 289 298 153
The global atmospheric concentration and absolute rate of concentration change of methane and
nitrous oxide is small compared to carbon dioxide (Figure 1). However, considering the GWP, the
effect of a certain increase in methane or nitrous oxide concentration is several times higher than
the same increase in the concentration of carbon dioxide (Table 1). This means that an increase of
only a few ppm methane or nitrous oxide in the atmosphere can cause a significant warming up-
effect.
4.2 Share of wastewater treatment in anthropogenic GHG
emissions
IPCC (2007) published global emissions of anthropogenic GHGs from different sectors between 1970
and 2004. Their contribution in total anthropogenic GHG emissions in given schematically in Figure
3. The waste and wastewater sector was responsible for 2.8% of total anthropogenic GHG emissions
during the observed period.

8 | Chapter II: Literature review
Figure 3: Share of different sectors in total anthropogenic greenhouse gas emissions in 2004 in terms of CO2 equivalents,
GWPs for a time horizon of 100 years were used (IPCC 2007)
Investigation of emissions from WWTPs in Australia indicates that the wastewater handling sector
represents only 0.4% of Australia’s anthropogenic GHG emissions. It should be mentioned that
indirect emissions due to energy consumption are not included in these estimations (Foley and Lant
2007). Comparing this result with Figure 3 indicates that the contribution of the waste and
wastewater sector in total GHG emissions is mainly determined by the waste sector, the
contribution of the wastewater treatment is rather small. EPA (2013) published that 0.3% of all
anthropogenic GHG emissions in 2011 were caused by the wastewater treatment sector. This value
is more or less in accordance with the result reported by Foley and Lant (2007).
Emissions from wastewater treatment were reduced with more than 6.7% between 2005 and 2011.
The share of wastewater treatment in United States’ total anthropogenic methane and nitrous oxide
emissions is 2.8 and 1.5% respectively (EPA 2013).
4.3 Share of methane emissions in total emissions released from
WWTPs
Total GHG emissions from a certain WWTP are often expressed as the climate footprint. The climate
or carbon footprint of a WWTP gives an indication of the environmental impact of the treatment of
wastewater generated by one inhabitant or one population equivalent (PE). The climate footprint is
expressed in CO2 equivalents (Frijns 2012). Table 2 gives an overview of performed estimations of
GHG emissions from WWTPs. Total GHG and methane emissions from WWTPs are given in the third
and fourth column. Values used for conversion in the right units are given below the table. The fifth
column represents the share of methane in the climate footprint of the investigated WWTPs. This is
the ratio of methane emissions to total GHG emissions from the WWTP, in terms of CO2 equivalents.
Energy supply 30%
Residential and commercial
buildings 9%
Agriculture 16%
Industry 22%
Waste and wastewater
3%
Forestry 20%
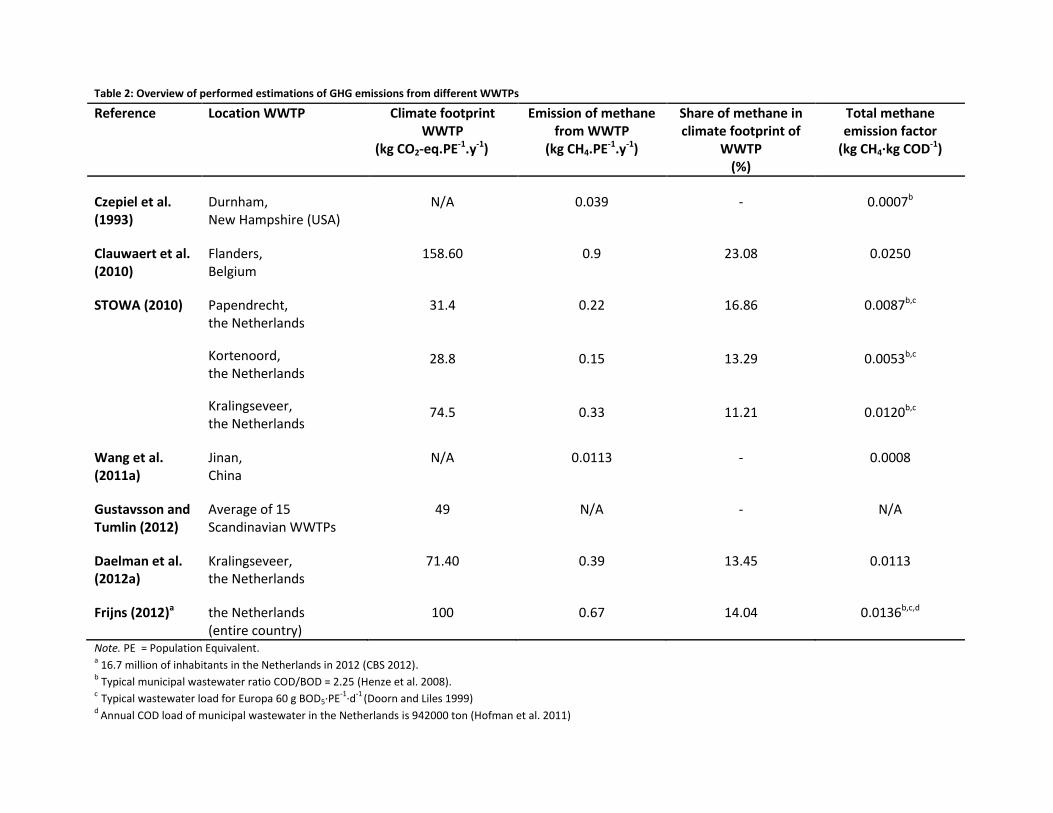
Table 2: Overview of performed estimations of GHG emissions from different WWTPs
Reference Location WWTP Climate footprint WWTP
(kg CO2-eq.PE-1.y-1)
Emission of methane from WWTP
(kg CH4.PE-1.y-1)
Share of methane in climate footprint of
WWTP (%)
Total methane emission factor
(kg CH4∙kg COD-1)
Czepiel et al. (1993)
Durnham, New Hampshire (USA)
N/A 0.039 - 0.0007b
Clauwaert et al. (2010)
Flanders, Belgium
158.60 0.9 23.08 0.0250
STOWA (2010) Papendrecht, the Netherlands
Kortenoord, the Netherlands
Kralingseveer, the Netherlands
31.4
28.8
74.5
0.22
0.15
0.33
16.86
13.29
11.21
0.0087b,c
0.0053b,c
0.0120b,c
Wang et al. (2011a)
Jinan, China
N/A 0.0113 - 0.0008
Gustavsson and Tumlin (2012)
Average of 15 Scandinavian WWTPs
49 N/A - N/A
Daelman et al. (2012a)
Kralingseveer, the Netherlands
71.40 0.39 13.45 0.0113
Frijns (2012)a the Netherlands (entire country)
100 0.67 14.04 0.0136b,c,d
Note. PE = Population Equivalent. a 16.7 million of inhabitants in the Netherlands in 2012 (CBS 2012).
b Typical municipal wastewater ratio COD/BOD = 2.25 (Henze et al. 2008).
c Typical wastewater load for Europa 60 g BOD5∙PE
-1∙d
-1 (Doorn and Liles 1999)
d Annual COD load of municipal wastewater in the Netherlands is 942000 ton (Hofman et al. 2011)

10 | Chapter II: Literature review
Annual methane emissions per capita loading vary strongly (almost factor 100) among the
investigated WWTPs. However, the share of methane in total GHGs emitted is in the same order of
magnitude for all WWTPs. The estimations varied only between 11 and 23%. Two reasons can be
given for the variations in estimations of GHG emissions from WWTPs. First, each WWTPs has its
different treatment procedure and size, works at different operational conditions and handles
influent streams with other flow rates and waste loads. Hence, the amount of GHGs emitted actually
vary for different WWTPs, regardless of treatment capacity. Secondly, a WWTP’s GHG emissions
cannot be perfectly determined. System boundaries should be chosen and assumptions and
simplifications are made in case on-line measurements are not possible. A few differences between
the different studies performed are given below.
4.3.1 Assumptions and system boundaries
The climate footprint estimates the GHG emissions of the entire WWTP. Of course, assumptions
need to be made and - in case that direct GHG measurement is not possible - GHG emissions have to
be estimated. The outcome of a study can vary strongly depending upon the system boundaries of
the WWTPs considered and the estimation method (see section 5) used. Frijns (2012) did not take
into account the use of renewable energy and nitrous oxide and methane emissions from sewer
systems were considered negligible compared with emissions from WWTPs. The carbon footprints
of the 15 WWTPs estimated by Gustavsson and Tumlin (2012) ranged between 21 and 90 kg CO2 eq.
PE-1.y-1. The study indicated that the choice of emission factors largely influences the carbon
footprint of the WWTP. Also in this case, direct emissions of methane in the sewers were not
included within the system boundaries (Gustavsson and Tumlin 2012). Clauwaert et al. (2010)
performed a life cycle analysis (LCA) of a WWTP in Flanders, Belgium. The resulting emission values
of the worst-case and best-case scenario differ considerably (1500 kg CO2 eq.PE-1.y-1 ), so more field
measurements are necessary to obtain reliable results. Annual GHG estimations from a WWTP in
Australia for the worst-case scenario were a factor 11 higher than the best-case scenario. This large
difference in the estimation of a WWTP’s emission is owing to the high level of uncertainty of the
emission factors (Foley and Lant 2007).
4.3.2 Characteristics of the WWTP
The characteristics of a certain WWTP and the occurring environmental conditions also affect
methane emissions. Wang et al. (2011a) measured the methane flux from each processing unit of
the WWTP in Jinan from March to June. The results show that the main factors influencing methane
emissions are the dissolved oxygen (DO) concentration and water temperature. STOWA (2010)
performed measurements of GHG emissions in three WWTPs in the Netherlands. The study showed
that the share of methane in the carbon footprint of a WWTP is significantly higher for a WWTP with
(Kralingseveer) than a WWTP without anaerobic digester (Kortenoord and Papendrecht) and
changes seasonally (STOWA 2010). GWRC (2011) published that the presence of a sludge digester

Chapter II: Literature review | 11
rises the methane emissions released and increases the contribution of methane emissions in the
total climate footprint.
4.3.3 Nitrous oxide emissions
There exists a lot of variation in the nitrous oxide emissions from WWTPs (STOWA 2010, GWRC
2011). This will also affect the share of methane in the carbon footprint of a WWTP. The
contribution of nitrous oxide emission to total GHG emissions released from WWTPs in the
Netherlands varies from 2 and 90%, in terms of CO2 equivalents. The contribution of methane
emission varies between 5 to 40% (GWRC 2011).
4.4 Summery
In 2001, annual global methane emission due to municipal and industrial wastewater treatment
amounted 39 million of tonnes or 11.14% of the total anthropogenic methane emission (El-Fadel
and Massoud 2001). The contribution of different anthropogenic GHGs in total emissions and the
share of methane emissions due to wastewater treatment in the global anthropogenic methane
nitrous oxide emissions are illustrated in Figure 4.
Figure 4: Distribution of global anthropogenic GHGs in total emissions and the share of methane emissions due to
wastewater treatment in the global anthropogenic methane and nitrous oxide emissions in terms of CO2 equivalents (El-
Fadel and Massoud 2001, IPCC 2007)
The amount of methane emitted during wastewater treatment accounts for 1.59% of the global
anthropogenic GHG emission, in terms of CO2 equivalents. Both industrial and municipal wastewater
treatment was considered, but emissions from sewers were not included (El-Fadel and Massoud
CO2 deforestation,
decay of biomass, etc
17.3%
N20 7.9%
F-gases 1.1%
CO2 fossil fuel use
56.6%
CO2 other 2.8%
CH4 waste water
treatment 11.1%
CH4 other sectors 88.9%
CH4
14.3%

12 | Chapter II: Literature review
2001, IPCC 2007). Regarding this result, reduction of methane released during wastewater
treatment processes would be useful to control global greenhouse gas emissions. However, national
data indicate a smaller contribution of the wastewater treatment sector in total anthropogenic GHG
emissions. Methane emissions from wastewater treatment in the Netherlands are supposed to be
less than 0.5% of the total national GHG emission (VROM 2008). Also methane emissions in the
United States are estimated to account for only 0.25% of the country’s anthropogenic GHG
emissions (EPA 2013). About the same contribution (0.3%) was obtained from GHG estimations in
Australia (Foley and Lant 2007). These variation can be explained by the difference in climates and
type of treatment processes used. The difficulties related to estimations of GHG emissions from
WWTPs were already discussed in section 4.3.
5. Estimation of methane emissions from wastewater treatment
processes
Emissions from wastewater treatment can be estimated on different levels. Estimation methods at
country and facility level are discussed.
5.1 Country level
The United Nations Framework Convention on Climate Change (UNFCCC) is an international
organisation concerned with the reduction of anthropogenic GHG emissions (UNFCCC 2012). The
UNFCCC obliges participating countries to make an inventory of their national anthropogenic GHG
emissions in five sectors i.e. (1) energy, (2) industrial processes and product use, (3) agriculture,
forestry and other land use, (4) waste and (5) other sectors. Wastewater treatment is included in the
waste sector. Consequently, national emissions released by wastewater treatment should be
determined by each participating country (IPCC 2006). However, emissions released by WWTPs are
often not measured directly, but national GHG emissions are estimated (Foley and Lant 2009).
Different methodologies for estimating national GHG emissions exist. Two of them are discussed, i.e.
the IPCC and USEPA method. Also some emission factors used by specific countries are mentioned.
5.1.1 IPPC method
The Intergovernmental Panel on Climate Change (IPCC) developed a methodology which allows to
estimate emissions from wastewater treatment. At the invitation of the UNFCCC, the IPCC
developed the 2006 IPCC Guidelines for National Greenhouse Gas Inventories (2006 Guidelines) to
provide internationally agreed methodologies to estimate greenhouse gas inventories to report to
the UNFCCC (IPCC 2006).
Chapter II: Literature review | 13
According to the IPCC, methane emissions from a WWTP can be estimated as function of the
amount of organic waste processed and an emission factor that characterizes the extent to which
this waste generates methane. The emission factor is function of the maximum methane production
potential and the methane correction factor for the wastewater treatment and discharge system
(Equation (1)). It is an indication of the degree to which the system is anaerobic. Methane emission
factors are equal for domestic and industrial wastewater (IPCC 2006).
Where:
B0 Maximum methane production potential [kg CH4/ kg COD]
EF Methane emission factor [kg CH4/ kg COD]
MCF Methane correction factor [-]
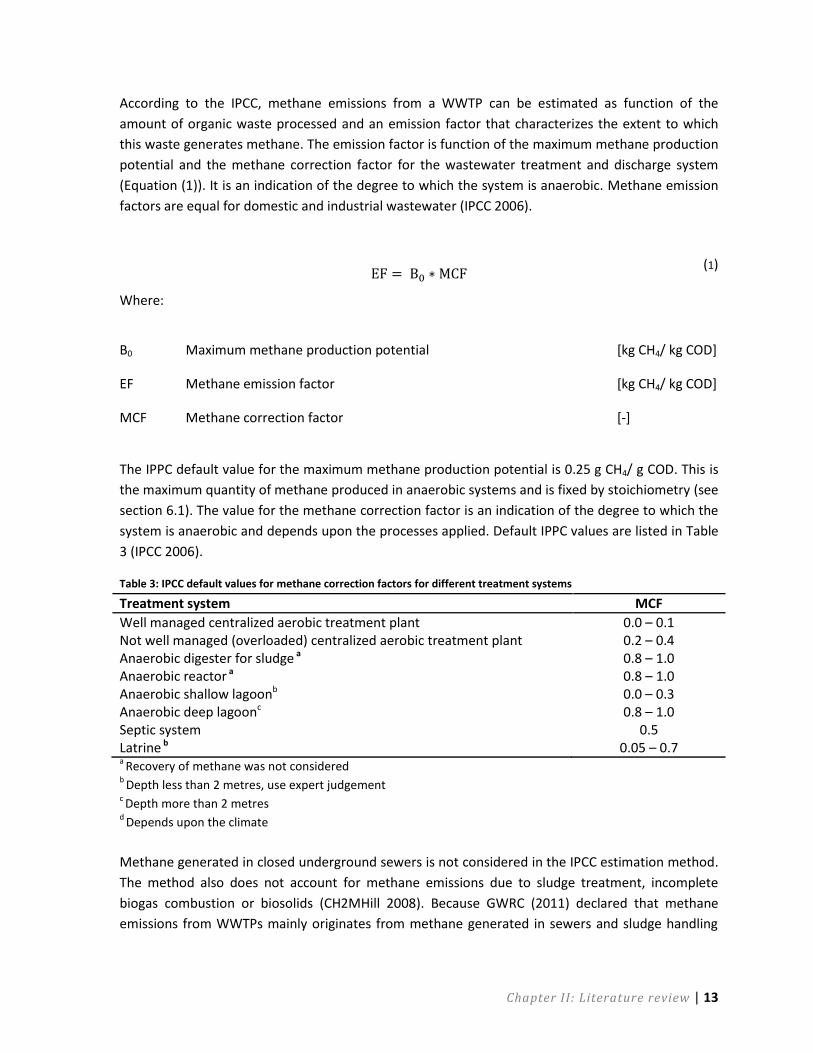
The IPPC default value for the maximum methane production potential is 0.25 g CH4/ g COD. This is
the maximum quantity of methane produced in anaerobic systems and is fixed by stoichiometry (see
section 6.1). The value for the methane correction factor is an indication of the degree to which the
system is anaerobic and depends upon the processes applied. Default IPPC values are listed in Table
3 (IPCC 2006).
Table 3: IPCC default values for methane correction factors for different treatment systems
Treatment system MCF
Well managed centralized aerobic treatment plant 0.0 – 0.1 Not well managed (overloaded) centralized aerobic treatment plant 0.2 – 0.4 Anaerobic digester for sludge a 0.8 – 1.0 Anaerobic reactor a 0.8 – 1.0 Anaerobic shallow lagoonb 0.0 – 0.3 Anaerobic deep lagoonc 0.8 – 1.0 Septic system 0.5 Latrine b 0.05 – 0.7 a
Recovery of methane was not considered
b Depth less than 2 metres, use expert judgement
c Depth more than 2 metres
d Depends upon the climate
Methane generated in closed underground sewers is not considered in the IPCC estimation method.
The method also does not account for methane emissions due to sludge treatment, incomplete
biogas combustion or biosolids (CH2MHill 2008). Because GWRC (2011) declared that methane
emissions from WWTPs mainly originates from methane generated in sewers and sludge handling
(1)
14 | Chapter II: Literature review
processes, application of the IPCC method can result in considerable underestimations of the
emissions released by WWTPs.
Earlier mentioned methane emission values from IPCC (2007) (section 4) were estimated using the
IPCC method. Emissions reported by Foley and Lant (2007) rely on both the IPCC guidelines and the
AGO’s Australian Methodology for the Estimation of Greenhouse Gas Emissions and Sinks 2005
(AMEGGES).
5.1.2 USEPA method
The United States Environmental Protection Agency (USEPA) developed a method to estimate
emissions released by the United States. The USEPA method is based on the IPCC methodology and
considers methane emissions from septic systems, centrally treated aerobic and anaerobic systems
and anaerobic digestion.
Though, the USEPA method rather overestimates methane emissions released by the wastewater
treatment sector in the United States. In January 2007, the National Association of Clean Water
Agencies (NACWA) submitted a comment letter to the USEPA with suggestions for improving its
estimation methodology. Applying the proposed changes resulted in a more appropriate estimate of
the United States’ methane emissions from wastewater treatment (CH2MHill 2008).
Earlier mentioned methane emission values from EPA (2013) (section 4) were estimated through the
USEPA method.
5.1.3 Country specific emission factors
An average emission factor for a certain country can be formulated when national methane
emissions are investigated. VROM (2008) formulated two methane emission factors for WWTPs in
the Netherlands, one for WWTPs without sludge digestion (0.007 g CH4. g COD-1) and one for
WWTPs with sludge digestion (0.0085 g CH4.g COD-1). STOWA (2010) measured the GHG emissions
from three representative WWTPs in the Netherlands and concluded that the VROM emission factor
can be considered as applicable to estimate the methane emissions of a WWTP. However, GHG
emissions were only measured for a short period (STOWA 2010). Daelman et al. (2012b) performed
long-term measurements of methane emissions at the WWTP at Kralingseveer (the Netherlands).
The results of this study (Table 2) confirmed the applicability of the VROM emission factor.
Based on the carbon footprint estimation of the Dutch wastewater treatment sector (Frijns 2012),
an emission factor of 0.0136 g CH4.g COD-1 for the Netherlands could be calculated (Table 2). The
IPCC guidelines were used to estimate methane emissions. Industrial wastewater treatment facilities
were not considered. The obtained emission factor is higher than the VROM emission factor, though
in the same order of magnitude.

Chapter II: Literature review | 15
5.2 Facility level
The IPCC and USEPA estimation methods were developed to estimate GHG emissions at country
level. The IPCC method also allows estimation of emissions released by individual plants. However,
this method is not the best possible approach for GHG emissions at facility level. The IPCC uses
general assumptions (at country level) and does not make use of facility specific information
(CH2MHill 2008).
For more accurate and detailed GHG estimations released from individual plants, a protocol should
be developed with flexibility on the level of detail and accuracy. It should also account for the type
of wastewater treatment applied. On this moment, a universal correct methodology does not exist
and several approaches for this requested protocol are made (CH2MHill 2008). For methane, more
research should be done on the potential for methane formation in anaerobic systems and on the
concentration of dissolved methane in all anaerobic processes (Foley and Lant 2007).
In the last column of Table 2, the total methane emission factors over all unit processes of the
investigated WWTPs were calculated. Most methane emissions were determined by online
measurements. Only Clauwaert et al. (2010) estimated methane emissions based on an emission
factor of 0.9 kg CH4.PE-1.y-1 and Gustavsson and Tumlin (2012) used different values in literature in
case methane emissions could not be measured. None of the performed studies considered direct
emissions from sewers. The calculated emission factors vary between 0.0007 and 0.0250 g CH4.g
COD-1. The reasons for this variation in methane emissions were already discussed in section 4.3.
6. Origin of methane emissions during municipal wastewater
treatment
In general, formation processes of methane emissions during wastewater treatment are well known.
However, the amount of methane emitted from sewer systems and WWTPs are an area of
uncertainty (GWRC 2011). An overview of actual knowledge and limitations is given below.
6.1 Mechanism of methane formation
Methane is generated during anaerobic digestion in anaerobic conditions where carbonaceous
substrate is available. Anaerobic digestion reduces complex organic matter to methane in a complex
reaction performed by several groups of microorganisms acting symbiotically, the methanogenic
bacteria or methanogens. The process of methane generation is also named methanogenesis
(Equation (2)).
(2)

16 | Chapter II: Literature review
Because 1 mole of glucose corresponds with 192 g COD, the theoretical maximum methane
production potential is 0.25 kg CH4/ kg COD removed. Generated methane can be microbially
oxidized to carbon dioxide in aerobic conditions. Methane can also be converted in the absence of
oxygen, but this route of methane transformation is not important in full-scale systems (Foley and
Lant 2007). Methane conversion processes are described in section 7.
Methane can also be generated in aerobic conditions. However, methane is only generated
aerobically by non-microbial processes in plants, animals and marine environments (Keppler et al.
2009). It is unlikely that methane is formed in aerobic parts of the WWTP.
6.2 Methane stripping
Methane is generated in the liquid phase, but it can be easily stripped and released to the
atmosphere. The relative volatility of methane is very high, its Henry coefficient is about 1.4 x 10⁻⁸
mol.L-1.Pa-1 at standard conditions (NIST 2011). The saturated methane concentration in water is
about 22 mg.L-1 at standard conditions (Guisasola et al. 2008).
The rate of methane stripping depends upon the aeration of the liquid. Foley and Lant (2009)
investigated the methane mass transfer coefficient based on superficial gas velocity, to provide
better estimations of methane emission from WWTPs. The result of the methane mass transfer
coefficient is given in Figure 5. These values are obtained by lab-scale stripping experiments in a gas
sparging bar with a diameter of 0.05 m and a depth of 0.815 m. The volumetric mass transfer
coefficient varies with the depth, but data are lacking to provide a validated correction method for
varying depth (Foley and Lant 2009). The mass transfer coefficient (kLa) of methane is directly
proportional to the superficial gas velocity (Figure 5).
Figure 5: Methane volumetric mass transfer coefficients (kLa) from clean water (blue line) and mixed liquor
(red line) stripping experiment in a lab-scale column (Foley and Lant 2009)

Chapter II: Literature review | 17
The solubility of methane varies with the temperature and ambient pressure. Methane can only be
converted by microorganisms in the liquid phase. Under the typical atmospheric methane
concentration of 1.75 ppm, its solubility is almost zero. Though, supersaturation can be reached in
case the rate of methane generation is higher than the rate of stripping to the gas phase (Foley and
Lant 2007). Effluent streams of anaerobic systems are often supersaturated with methane, unlike
many assumptions (Hartley and Lant 2006).
6.3 Sewer systems
Methane can already be formed during wastewater collection and transfer. Sewer systems have a
high methane producing potential, due to the easily reached anaerobic conditions and supply of
readily biodegradable carbonaceous material. Methane in sewers and rising mains is produced by
methanogenic organisms in biofilm processes. In the deepest layers of the biofilm, no oxygen is
present and methanogenesis can occur (Guisasola et al. 2008). All methane generated can already
be oxidized in the aerobic surface layer of the biofilm (Damgaard et al. 2001). However, Guisasola et
al. (2008) observed considerable amounts of methane in sewers and stated that the saturated
methane concentration can be easily exceeded. Daelman et al. (2012b) observed considerable
amounts of dissolved methane in the influent stream of the observed WWTP. This methane is
formed in the sewer and was estimated as 1% of the influent COD load (Daelman et al. 2012b). Next
to methane, also hydrogen sulphide (H2S) is formed in sewers through reduction of sulphate (SO4-).
Experimental research indicates simultaneous occurrence of methanogenesis and sulphate
reduction in sewers (Guisasola et al. 2008).
The methane production potential depends on location-specific factors and emission profiles differs
for each pipeline. This makes it difficult to provide a default sewer emission factor (House and
Evison 1997). Foley et al. (2009) published a easily and robust manner to estimate methane
emissions in rising mains in function of the average hydraulic residence time (HRT) and the pipe area
to volume (A/V) ratio (Equation (3)).The pipe area to volume (A/V) ratio is inversely related to the
diameter of the pipe.
Where:
CCH4 Concentration of dissolved methane [kg.m-3]
A Surface area of pipe [m2]
V Pipe volume [m3]
HRT Average hydraulic residence time [d]
(3)

18 | Chapter II: Literature review
This relationship was obtained by empirical fitting of the full scale measurement results (Foley et al.
2009). Regarding Equation (3), larger rising main sewer networks with higher retention times and
lower pipe diameters increase methane generation in sewers. The positive correlation between
methane production and the A/V ratio and HRT of sewers is in accordance with the observations
from Guisasola et al. (2009). Foley et al. (2009) also observed an increasing methane concentration
further downstream.
Emissions from sewer systems are often considered as negligible and not taken into account while
estimating GHG emissions released from WWTPs. IPCC (2006) assumes that wastewater in closed
underground sewers are not a significant source of methane. However, GWRC (2011) declared that
their contribution is considerable and they should not be neglected. Guisasola et al. (2008)
measured methane emissions in sewer systems by full-scale and lab-scale experiments in rising
mains. It could be concluded that methane generated in sewers may have a GHG effect that is
comparable to that due to the wastewater treatment process itself and can therefore substantially
increase the climate footprint of a WWTP (Guisasola et al. 2008). STOWA (2010) established that
influent methane accounted for respectively 86% and 77% of all methane emitted from the WWTPs
at Papendrecht and Kortenoord (the Netherlands). Daelman et al. (2012b) observed a contribution
of less than 31% at the WWTP at Kralingseveer (the Netherlands). The reason for this difference is
the presence of an anaerobic digester at the WWTP at Kralingseveer, which increases overall
methane emissions. Papendrecht and Kortenoord do not apply anaerobic digestion (Daelman et al.
2012a). The effect of anaerobic digestion on methane emissions is described in section 6.5.
6.4 Primary and secondary wastewater treatment
Primary and secondary treatment of wastewater can be divided into aerobic and anaerobic
treatment. Anaerobic waste water treatment is predominantly applied in warm climates.
Wastewater in our regions is treated in aerobic processes.
6.4.1 Anaerobic treatment systems
Methane emissions from anaerobic treatment processes can be estimated by emissions factors.
Foley and Lant (2007) summarized methane emissions factors for different types of anaerobic
treatment processes reported in literature (Table 4).
Methane losses from anaerobic treatment, due to dissolved methane which leaves the reactor with
the effluent and is not captured in the biogas system, are difficult to estimate. In case the effluent is
saturated with methane at a concentration of approximately 17-22 mg.L-1, the fraction of methane
losses varies between ca. 12 and 28%. The more supersaturated a system, the more methane will be
lost by dissolution. At 300% supersaturation, more than half of the generated methane can be lost
with the effluent.
Chapter II: Literature review | 19
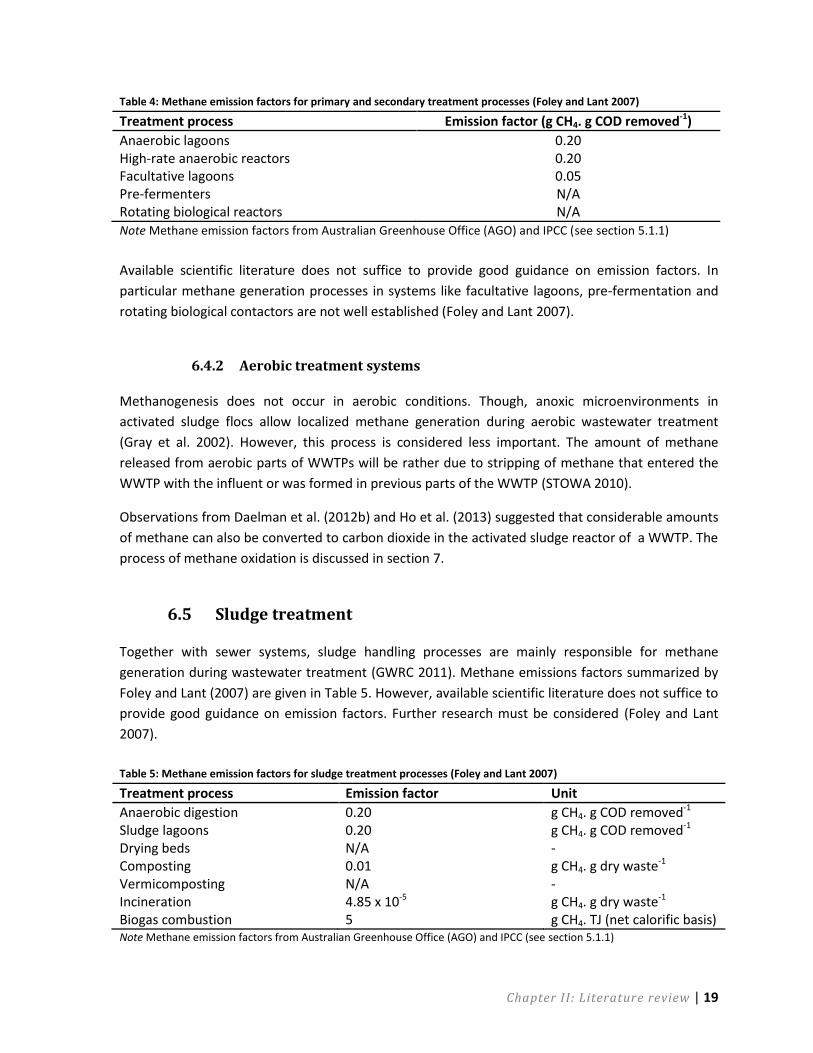
Table 4: Methane emission factors for primary and secondary treatment processes (Foley and Lant 2007)
Treatment process Emission factor (g CH4. g COD removed-1)
Anaerobic lagoons 0.20 High-rate anaerobic reactors 0.20 Facultative lagoons 0.05 Pre-fermenters N/A Rotating biological reactors N/A Note Methane emission factors from Australian Greenhouse Office (AGO) and IPCC (see section 5.1.1)
Available scientific literature does not suffice to provide good guidance on emission factors. In
particular methane generation processes in systems like facultative lagoons, pre-fermentation and
rotating biological contactors are not well established (Foley and Lant 2007).
6.4.2 Aerobic treatment systems
Methanogenesis does not occur in aerobic conditions. Though, anoxic microenvironments in
activated sludge flocs allow localized methane generation during aerobic wastewater treatment
(Gray et al. 2002). However, this process is considered less important. The amount of methane
released from aerobic parts of WWTPs will be rather due to stripping of methane that entered the
WWTP with the influent or was formed in previous parts of the WWTP (STOWA 2010).
Observations from Daelman et al. (2012b) and Ho et al. (2013) suggested that considerable amounts
of methane can also be converted to carbon dioxide in the activated sludge reactor of a WWTP. The
process of methane oxidation is discussed in section 7.
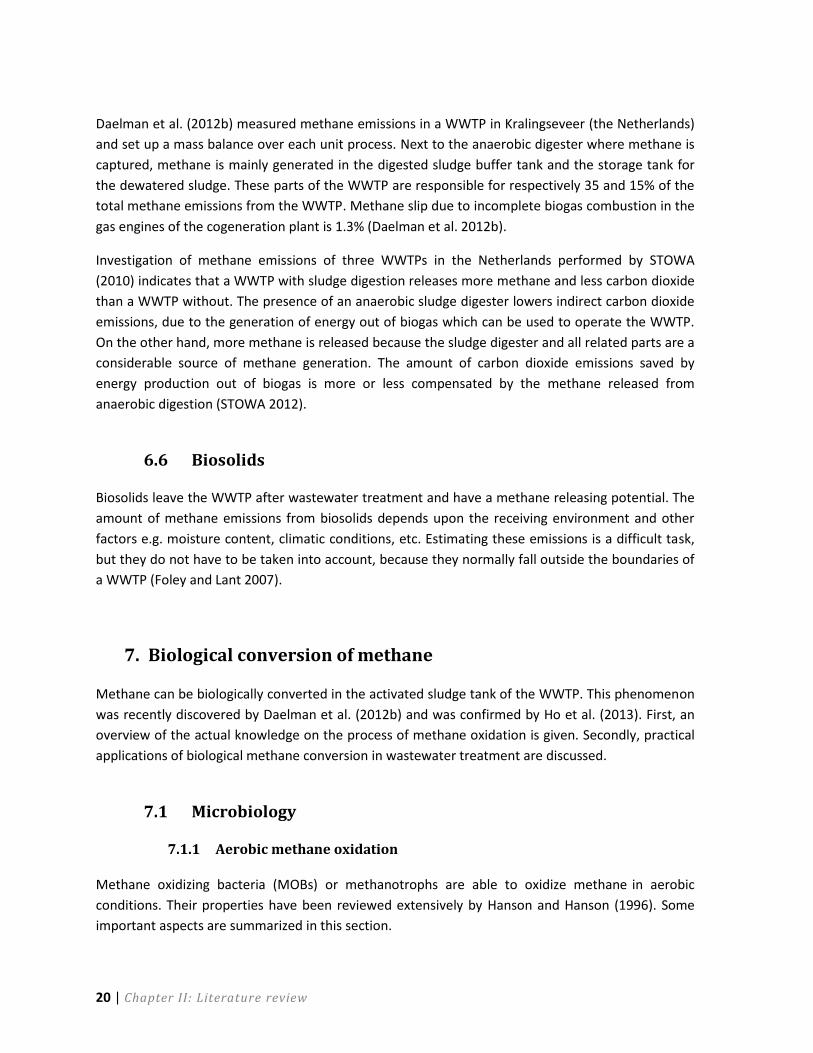
6.5 Sludge treatment
Together with sewer systems, sludge handling processes are mainly responsible for methane
generation during wastewater treatment (GWRC 2011). Methane emissions factors summarized by
Foley and Lant (2007) are given in Table 5. However, available scientific literature does not suffice to
provide good guidance on emission factors. Further research must be considered (Foley and Lant
2007).
Table 5: Methane emission factors for sludge treatment processes (Foley and Lant 2007)
Treatment process Emission factor Unit
Anaerobic digestion 0.20 g CH4. g COD removed-1 Sludge lagoons 0.20 g CH4. g COD removed-1 Drying beds N/A - Composting 0.01 g CH4. g dry waste-1 Vermicomposting Incineration Biogas combustion
N/A 4.85 x 10⁻⁵ 5
- g CH4. g dry waste-1
g CH4. TJ (net calorific basis) Note Methane emission factors from Australian Greenhouse Office (AGO) and IPCC (see section 5.1.1)
20 | Chapter II: Literature review
Daelman et al. (2012b) measured methane emissions in a WWTP in Kralingseveer (the Netherlands)
and set up a mass balance over each unit process. Next to the anaerobic digester where methane is
captured, methane is mainly generated in the digested sludge buffer tank and the storage tank for
the dewatered sludge. These parts of the WWTP are responsible for respectively 35 and 15% of the
total methane emissions from the WWTP. Methane slip due to incomplete biogas combustion in the
gas engines of the cogeneration plant is 1.3% (Daelman et al. 2012b).
Investigation of methane emissions of three WWTPs in the Netherlands performed by STOWA
(2010) indicates that a WWTP with sludge digestion releases more methane and less carbon dioxide
than a WWTP without. The presence of an anaerobic sludge digester lowers indirect carbon dioxide
emissions, due to the generation of energy out of biogas which can be used to operate the WWTP.
On the other hand, more methane is released because the sludge digester and all related parts are a
considerable source of methane generation. The amount of carbon dioxide emissions saved by
energy production out of biogas is more or less compensated by the methane released from
anaerobic digestion (STOWA 2012).
6.6 Biosolids
Biosolids leave the WWTP after wastewater treatment and have a methane releasing potential. The
amount of methane emissions from biosolids depends upon the receiving environment and other
factors e.g. moisture content, climatic conditions, etc. Estimating these emissions is a difficult task,
but they do not have to be taken into account, because they normally fall outside the boundaries of
a WWTP (Foley and Lant 2007).
7. Biological conversion of methane
Methane can be biologically converted in the activated sludge tank of the WWTP. This phenomenon
was recently discovered by Daelman et al. (2012b) and was confirmed by Ho et al. (2013). First, an
overview of the actual knowledge on the process of methane oxidation is given. Secondly, practical
applications of biological methane conversion in wastewater treatment are discussed.
7.1 Microbiology
7.1.1 Aerobic methane oxidation
Methane oxidizing bacteria (MOBs) or methanotrophs are able to oxidize methane in aerobic
conditions. Their properties have been reviewed extensively by Hanson and Hanson (1996). Some
important aspects are summarized in this section.

Chapter II: Literature review | 21
Methanotrophic bacteria
Methanotrophic bacteria can utilize methane as a sole carbon and energy source and this unique
characteristic distinguishes them from other bacteria. Methane is aerobically converted to carbon
dioxide (Equation (4)). Because carbon dioxide has a lower global warming potential than methane
(IPCC 2007), this process is important considering GHG emissions.
The reaction is catalyzed by the methane monooxygenase enzyme (MMO). This enzyme is not very
substrate specific. Consequently, methanotrophs can fortuitous metabolize also a large number of
other compounds. Two forms of MMOs can be found in methanotrophs, a soluble MMO (sMMO)
and a particulate or membrane bound MMO (pMMO). All methanotrophs are believed to be able of
expressing pMMO in the presence of copper, but only some types are capable to form sMMO. Cells
of MOBs containing pMMO have higher growth yields on methane and represent a greater affinity
for methane than cells containing sMMO. On the other hand, sMMO has a broader substrate
specificity than pMMO (Hanson and Hanson 1996).
Methanotrophic bacteria can be found in various environments like rivers, oceans, ponds, sewage
sludge, soils, muds, etc. (Hanson and Hanson 1996). At certain locations in WWTPs where aerobic or
quasi anaerobic-aerobic conditions occur, generated methane can be oxidized by methanotrophic
bacteria (Foley and Lant 2007).
Similarities and interaction with ammonia-oxidizing bacteria
Autotrophic ammonia-oxidizing bacteria (AOBs) oxidize ammonia (NH3) to nitrite(NO2
-). This reaction
is catalysed by the ammonia monooxygenase enzyme (AMO). They are a phylogenically diverse
group of microorganisms. However, similarities with MOBs in terms of methane and ammonia
oxidation are observed. Both groups of bacteria oxidize a variety of compounds and both are able to
oxidize methane and ammonia. However, methane oxidation by AOBs and ammonia oxidation by
MOBs progresses slower compared to their normal metabolism (Hanson and Hanson 1996). Bédard
and Knowles (1989) summarized the methane and ammonia oxidation rates and half saturation
constants (Km) for MOBs and AOBs (Table 6). The affinity for the substrate is inversely proportional
to the Km value.
(4)

22 | Chapter II: Literature review
Table 6: Methane and ammonium oxidation rates and half saturation constants for MOBs and AOBs (Bédard and
Knowles 1989)
Compound Max. oxidation rate (mmol C or N.g cells-1.h-1)
Half saturation constant Km (μM)
MOB AOB MOB AOB
Methane 10 - 31 0.065 - 1.960 1 - 66 6.6 - 2000
Ammonia 0.03 - 1.05 24 - 62 600 - 87000 2 - 2000
From Table 6 can be derived that the maximal methane oxidation rate is much higher (factor 5 - 500)
for MOBs than for AOBs. The opposite relation is observed for the maximal rate of ammonia
oxidation (factor 23 – 2000). Both bacteria represent a higher affinity for their own substrate. In
case both methane and ammonia are present, the affinity of MOBs for ammonia is a factor 9 to
87000 smaller than the affinity for methane.
Effect of ammonium on the methane oxidation rate
Very low ammonia concentrations have a stimulating effect on methane oxidation, because a
nitrogen source is required for bacterial growth (Bender and Conrad 1995). The effect of the
presence of higher ammonium concentrations on the rate of methane oxidation is not completely
understood on this moment.
Bender and Conrad (1995) investigated the effect of ammonium on methane oxidation in four
different soils, i. e. meadow cambisol, forest luvisol, cultivated cambisol and paddy soil (Figure 6).
Ammonium concentrations higher than 5 – 22 mM (70 – 308 mg N.L-1) inhibited methane oxidation.
The optimal ammonium concentration in the soils analysed in the experiment of Bender and Conrad
(1995) is ca. 2.5 mM (35 mg N.L-1). At lower concentrations, methane oxidation activity decreases
due to the limitation of available nitrogen for optimal bacterial growth (Bender and Conrad 1995).
Figure 6: Short-term effect of ammonium
concentration on the methane oxidation activity of four different induced soils
(Bender and Conrad 1995)

Chapter II: Literature review | 23
Also Whittenbury et al. (1970), Begonja and Dubravka (2001) and Nyerges and Stein (2009)
established that the presence of ammonium reduces methane oxidation. In their experiments, pure
cultures of methanotrophs were isolated and grown on a nitrate mineral salts medium (NMS).
Afterwards, ammonium was added. Whittenbury et al. (1970) indicated that the rate of methane
oxidation decreases with increasing ammonium concentration. Begonja and Dubravka (2001)
observed inhibition of the MMO enzyme and suppression of methanotrophic growth at an
ammonium concentration of 140 mg N.L-1. Nyerges and Stein (2009) already perceived inhibition of
methane oxidation at a concentration of 70 mg N.L-1.
Park et al. (2005) observed methane oxidation in land fill cover soil at ammonium concentrations of
0, 15.7, 78.4, 156.8 and 784.0 mg N. kg soil DW-1. The rate of methane oxidation decreases more for
soils amended with higher ammonium concentrations, except for the soil amended with 78.4 mg N.
kg soil DW-1. At this concentration, an enhanced methane oxidation activity was observed compared
with a non-amended soil. This data suggested a stimulatory effect on methane oxidation at
moderate ammonium concentrations. Two possible reasons are described in the article. The first
explanation implies that addition of ammonium stimulates the growth of ammonia oxidizing
bacteria, which will start oxidizing methane through the enhanced AMO activity. Secondly, it is also
plausible that an appropriate level of ammonia acts as a substrate for methanotrophic bacteria and
stimulates their activity (Park et al. 2005).
van der Ha et al. (2010) and van der Ha et al. (2011) did not observe an effect of the ammonium
concentration on methane oxidation. In both experiments, a methane oxidizing community was
grown on a NMS medium. The change of nitrogen source from 140 mg NO3--N.L-1 to 140 mg NH4
+-
N.L-1 had no influence on the methane oxidation rate (van der Ha et al. 2010, van der Ha et al. 2011).
This suggests that the specific effects of ammonium on methane oxidation in mixed culture
conditions are not fully understood.
Ho et al. (2013) suggests that addition of high ammonium concentrations (up to 1.0-1.1 mg N.L-1)
may be a strong selecting force for the methanotrophic community composition. This was
concluded out of performed experiments in oxygen-limited autotrophic nitrification/ denitrification
(OLAND) biological rotating contactors.
Environmental factors influencing methane oxidation
De rate of methane oxidation is highly affected by the temperature. The temperature influences the
MMO enzyme activity and the solubility of methane in water (Park et al. 2005). The optimal
temperature for methane oxidation in most peat soils is 25°C (Hanson and Hanson 1996). van der Ha
et al. (2010) did not observe a significant effect on methane oxidation when the temperature of the
NMS medium increased from 28 to 35°C. Hence, the effect of temperature is low at higher
temperatures, yet below 35°C. Suboptimal temperatures have a larger effect. At temperatures
between 0 and 10°C, methane oxidation occurs at 13 to 38% of the maximum oxidation rate
(Dunfield et al. 1993).

24 | Chapter II: Literature review
Addition of copper stimulates methanotrophic activity. Addition of 0.64 mg Cu2+.L-1 enhanced the
salt-resistance and increased the methane oxidation rate with a factor 1.5 and 1.7 in two tests
performed by van der Ha et al. (2010). Furthermore, an increase in copper availability leads to a
switch of sMMO enzyme domination to methane oxidation catalyzed by particularly pMMO (Hanson
and Hanson 1996, Hakemian and Rosenzweig 2007, van der Ha et al. 2010).
The optimum pH for methane oxidation is linked to the natural occurring pH. Maximal methane
oxidation rates in peats are observed in pH conditions of 2 units higher than the native pH for acid
peats and 0 to 1 units higher for alkaline peats. The native pH of the investigated peats ranged
between ca. 3.7 and 6.1. Methanotrophs do not well adapt to pH values lower than 4 (Dunfield et al.
1993).
The amount of methane oxidized during a certain period of time increases with a higher initial
methane concentration. A soil containing 5% (v/v) methane is sufficient to make substrate saturated
conditions, hence methane oxidation will not accelerate with higher concentrations. (Park et al.
2005).
A soil moisture content of 10% provides the highest methane oxidation rate. A small increase or decrease in humidity will delay methane oxidation in soils markedly (Park et al. 2005).
Numerous inhibitors of methane oxidation exist and the inhibitor effectiveness can differ (Chan and
Parkin 2000). Almost all agents that inhibit AOBs also inhibit MOBs (Bédard and Knowles 1989). Prior
and Dalton (1985) proposed that ethylene (C2H2) acts as a suicide substrate. Ethylene inhibits both
MMO enzymes that catalyse methane oxidation (sMMO and pMMO) and inactivation of the
enzymes by ethylene is irreversible (Prior and Dalton 1985).
7.1.2 Anaerobic methane oxidation
Methane can also be oxidized to carbon dioxide in anaerobic conditions including marine water,
sediments of soda lakes and freshwater sediments (Hanson and Hanson 1996). It was first thought
that anaerobic methane oxidation only occurs in the presence of sulphate as an electron acceptor
and acetate or lactate as carbon source (Equation (5)) (Hanson 1980). This reaction is mediated by a
consortium of methanogenic and sulphate-reducing bacteria (Jeppsson 1996)
On this moment, four mechanisms of anaerobic methane oxidation were identified (Stephanopoulos
et al. 1998). The second mechanism implies anaerobic methane oxidation coupled with reduction of
reactive metals, i.e. manganese (birnessite) and iron (ferrihydrite) (Flores-Alsina et al. 2011).
Research performed by Raghoebarsing et al. (2006) and Ettwig et al. (2010) established methane
oxidation coupled with denitirification. Remarkably, the bacteria Methoxymirabilis oxyfera is able to
oxidize methane in anoxic environments without the aid of another metabolic partner (Equation (8))
(Ettwig et al. 2010).
(5)

Chapter II: Literature review | 25
Recently, a fourth mechanism was discovered where an alternative unusual sulphate reducing
strategy was used by methanotrophic archaea (Ho et al. 2013).
In above mentioned experiments, anaerobic methane oxidation coupled to reduction of sulphate
and active metals was observed in marine sediments. Only methane oxidation coupled to
denitrification takes place in fresh sediments. It is not expected that anaerobic methane oxidation
occurs during wastewater treatment. Therefore, anaerobic methane oxidation is not further
considered in this master thesis.
7.2 Engineered systems
Biological conversion of methane can reduce the net GHG emissions from the wastewater treatment
sector. Methane can be removed during the treatment process or afterwards. These two options are
discussed in this section.
7.2.1 Biological methane oxidation in activated sludge tanks
In the aerated part of the activated sludge tank, generated methane can be oxidized by
methanotrophic bacteria. Daelman et al. (2012b) published the first study to describe this process
on a full scale WWTP. Research for methane oxidation by activated sludge is limited. An overview is
given in this section.
Investigations full-scale
Czepiel et al. (1993) measured methane and carbon dioxide emissions from primary and secondary
wastewater treatment processes in Durham (United States). The secondary treatment systems
consist of four aeration tanks and two clarification tanks. Average methane fluxes from the last
three aeration tanks amounted only 16% of the methane fluxes from the first tank and carbon
dioxide emissions increased with a factor 1.5. Czepiel et al. (1993) did not explain this phenomenon.
The increase in carbon dioxide emissions indicates a higher bacterial activity in the last three
aeration tanks. Because methane generation in activated sludge tanks is limited (section 6.4.2), it is
suggested that methane emitted from these parts originates from methane generation processes in
previous stages. Most of the dissolved methane is released from the first reactor, because the high
concentration gradient between the gas and liquid phase strongly favours methane stripping. No
conclusions could be made for methane oxidation.
Wang et al. (2011a) measured methane emissions released from an entire WWTP in Jinan, China. It
was concluded that a higher dissolved oxygen concentration in the aerated tank increases the rate
(6)

26 | Chapter II: Literature review
of methane stripping, but also reduces methane generation. Methane oxidation was not considered
in the study.
STOWA (2010) investigated methane emissions from three WWTPs. For the WWTP at Kralingseveer,
the amount of methane released from the entire WWTP is lower than the methane generated in the
anaerobic parts. Hence, methane was converted during wastewater treatment. It is very likely that
methane oxidation takes place in the compost filter and two aerobic tanks. In the aerobic tanks,
methane containing off-gases from anaerobic parts were used for aeration of the tank. The amount
of methane converted in the WWTPS is estimated to be 25% of the total produced quantity. It was
concluded that reinjection of exhaust air from other parts of the WWTP into the aerobic biological
reactor is an effective action to reduce a WWTP’s methane emissions (STOWA 2010).
Daelman et al. (2012b) observed a decrease of the methane concentration (about 80%) in the
aerated part of the activated sludge plug flow reactor at the WWTP at Kralingseveer (the
Netherlands). Though, methane conversion was not observed in the anoxic part (Daelman et al.
2012b).
STOWA (2012) investigated methane oxidation through online measurements at the WWTP at
Kralingseveer (the Netherlands). In the activated sludge tank, a methane conversion rate of 0.0048 g
CH4.g TSS-1.d-1 was observed.
Investigations lab-scale
Two studies report lab experiments for methane oxidation in activated sludge. STOWA (2012) added
methane to the headspace of gastight bottles filled with activated sludge. Methane oxidation was
measured for methane headspace concentrations of 1000 and 40000 ppm. Also the effect of
ammonia was tested, but ammonia concentrations between 1 to 50 mg N.L-1 did not affect methane
oxidation (STOWA 2012). Ho et al. (2013) investigated the methanotrophic potential in sewage
treatment. Wastewater sludges were sampled from compartments of different sewage treatment
plants. In the wastewater sludges, a fast growth of methanotrophs was observed after addition of
methane, which indicates their potential to mitigate methane emissions from WWTPs (Ho et al.
2013). Some other lab experiments measured the rate of methane oxidation in an environment
similar to activated sludge. All average methane oxidation rates are given in Table 7.
Regarding Table 7, it can be seen that the results vary strongly among the different experiments.
The medium is supposed to affect the methanotrophic activity. The highest methane oxidation rates
were observed at a nitrate mineral salts medium (NMS). Rates for methane oxidation in activated
sludge are a factor 12 to 600 lower. This is probably due to the high nutrient availability in the NMS
medium which stimulates bacterial growth. From the experiments of STOWA (2012), it could be
concluded that methane oxidation depends upon the concentration of methane (STOWA 2012).
Higher methane concentrations favour methane conversion. No methane oxidation was observed in
nitrifying activated sludge (Kennelly et al. 2012).

Chapter II: Literature review | 27
In short, methane oxidation is expected to depend on various factors. It is difficult to formulate a
general conclusion based on this data. More research for methane oxidation in activated sludge is
necessary to better understand the process kinetics and affecting parameters.

Table 7: Methane oxidation rates from experiments Resembling to aerobic methane oxidation in an activate sludge tank
Reference Medium Inoculation Average MOR (mg CH4.mg VSS-1.d-1)
Hatamoto et al. (2010) Down-flow hanging sponge reactor, fed with artificial wastewater
Diluted activated sludge from municipal WWTP
0.13a
Matsuura et al. (2010) Two-stage down-flow hanging sponge reactor, fed with effluent from an UASB reactor treating municipal sewage
Inoculated with bacteria of the feed stream
0.0273b
van der Ha et al. (2010) Nitrate mineral salts medium Enriched samples from sites expected to contain an active and abundant methanotrophic community
0.610c
0.603d
van der Ha et al. (2011) Nitrate mineral salts medium An enriched active methane oxidizing community
0.574
Kennelly et al. (2012) Horizontal flow biofilm reactor Nitrifying activated sludge No oxidation
STOWA (2012) Activated sludge - 0.001e,f
0.019e,g
Ho et al. (2013) Returned activated sludge - 0.046 a Maximum value, no average value available
b Expressed in mg CH4.mg VS
-1.d
-1.
c Average cycle 4 to 11
d Average cycle 11 to 16
e Calculated with a VSS:COD ratio of 1.48 g COD.g VSS
-1 (Henze et al. 2008) and a TSS:COD ratio of 0.75 g TSS. g COD
-1 (Copp 2002)
f Methane headspace concentration of 1000 ppm
g Methane headspace concentration of 40000 ppm

Chapter II: Literature review | 29
7.2.2 Methane removing biofilters
After wastewater treatment, methane in off-gases and effluent streams from anaerobic reactors can
be treated with methane removing biofilters. Treatment of gas and effluent streams are considered
separately.
Off-gas treatment
Methane removal during off-gas treatment by biofiltration is studied for different applications like
off gases from waste landfills (reviewed by Nikiema et al. (2007)), animal husbandry (Melse and van
der Werf 2005), manure storage (Girard et al. 2011) and coal mines (Sly et al. 1993). The biofilter can
be open or closed and consists of a supporting material - organic or inorganic - on which the biofilm
is formed. Parameters like oxygen supply, moisture content, temperature, nutrient supply, gas flow
rate and methane concentration of the treated gas stream affect the removal efficiency of the
biofilter. The optimal parameter ranges depend upon the type of biofilter. Removal efficiencies up
to 100% can be obtained (Nikiema et al. 2007). However, long-term performance of the methane
removing biofilter depends strongly upon environmental factors like temperature and precipitation
(Hettiarachchi et al. 2011). Moreover, operational problems like clogging, bacterial inhibition,
anaerobic conditions, etc. during biological off-gas treatment are not excluded (Scheutz et al. 2009).
The only study for the removal of methane in off gases from wastewater treatment is performed by
Daelman et al. (2012a).The removal efficiency of a compost filter, a lava filter and a combination of a
lava and active carbon filter was investigated for methane containing emissions from two WWTPs
(Kralingseveer and Kortenoord) and a sewage pumping station in the Netherlands. The removal
efficiency was in all cases less than 25% (Daelman et al. 2012a).
Treatment of effluent from anaerobic wastewater treatment
Hatamoto et al. (2010) and Matsuura et al. (2010) investigated biological removal of methane from
the effluent streams of an anaerobic reactor by using a down-flow hanging sponge reactor (DHS).
Within three weeks after start-up, an average removal efficiency of 95% is obtained. Also
ammonium can be oxidized, but methane oxidation occurs preferentially over ammonium oxidation.
This is due to the limited oxygen availability in the DHS reactor. AOBs and MOBs compete for oxygen
in the reactor, and because the affinity of MOBs for oxygen is higher, MOBs outcompete AOBs at
limited oxygen concentrations (Hatamoto et al. 2010). A two-stage closed DHS reactor eliminates
the dissolved methane concentration for more than 99% (Matsuura et al. 2010).
Kampman et al. (2012) investigated an application of anaerobic methane oxidation. The use of an
UASB reactor for simultaneous denitrification and methane oxidation after anaerobic sewage
treatment was investigated. The article rather focused on the removal of nitrogen than on the
reduction of methane emissions, no data for methane conversion were given.

30 | Chapter II: Literature review
8. Factors affecting methane emissions during wastewater
treatment
As mentioned in section 4.4, methane emissions from wastewater treatment contribute with ca.
1.6% to the global anthropogenic GHG emissions. Hence, the abatement of methane released during
wastewater treatment can reduce a region or country’s anthropogenic GHG emissions considerable.
Some factors affecting methane generation in sewers and the WWTP itself are summarized.
8.1 Management of the system
CH2MHill (2008) published that methane emissions can be controlled by good management of
WWTPs. In open anaerobic systems such as anaerobic lagoons and anaerobic reactors, where
generated methane is directly and untransformed released to the atmosphere, methane emissions
can rise to high levels. In Los Angeles, methane emissions from well controlled systems with
anaerobic digesters are estimated to be a factor 23 smaller than uncontrolled anaerobic systems
(CH2MHill 2008).
8.2 Anaerobic sludge digestion
As stated in § 6.5, the presence of an anaerobic sludge digester can rise the amount of methane
released by a WWTP considerably. Though, simply rejecting this application would be wrong,
because biogas production is a sustainable technique from the energy point of view and can
probably be optimized in terms of GHG emission by utilizing a better design and good housekeeping
(Daelman et al. 2012b). Hartley and Lant (2006) investigated energy recovery by biogas combustion
in an anaerobic migrating bed reactor pilot plant. The study showed that micro-aeration by mixing
the reactor with biogas containing air during methane generation in anaerobic environments can
reduce dissolved methane losses (Hartley and Lant 2006).
8.3 Environmental temperature
Seasonal temperature variations affects methane emissions during wastewater treatment
processes. Higher methane emission values are observed in October than in February in the WWTP
in Kralingseveer (the Netherlands) in the study performed by STOWA (2010). This can be explained
by the higher solubility and probably reduced generation of methane at lower temperatures.
However, the reduced amount of methane emission due to dissolution in the liquid phase is
removed from the WWTP with the effluent or sludge and can be released in other locations (STOWA
2010). Wang et al. (2011a) observed as well a positive correlation between the temperature and
methane emission in the WWTP in Jinan, China. The effect of temperature on methane oxidation is
already discussed in section 7.1.1.
Chapter II: Literature review | 31
8.4 Dissolved oxygen concentration in the aerobic parts of the
WWTP
The dissolved oxygen concentration (DO) in aerobic parts of the WWTP is also identified as a
parameter affecting methane emissions. The DO concentration is determined by the rate of
aeration. Wang et al. (2011a) concluded that higher DO concentrations in the aerobic parts of full
scale WWTPs reduce biological methane generation, but increase the rate of methane stripping. The
latter effect is the strongest - probably because methane generation in aerobic conditions is limited
- thus a higher DO content increases methane emissions from wastewater (Wang et al. 2011a).
However, lower methane stripping rates result in a higher dissolved methane concentration in the
effluent or sludge. Hence, less methane is released from the WWTP itself, but more methane is
emitted downstream.
Additionally, methane can also be converted in the aerated activated sludge tank by
methanotrophic bacteria (Daelman et al. 2012b, Ho et al. 2013). It can be expected that the DO
concentration in this part of the WWTP also affects the process of methane conversion, but research
for the effect of aeration has not yet been performed. Conversion of methane is an important
process, because this reduces overall methane emissions, from the WWTP itself as well as after
leaving the WWTP.
8.5 Addition of chemicals in sewers to reduce the influent methane
load
Methane generated in sewers contributes considerably in total methane emissions released from
WWTPs (GWRC 2011). Performed research for the effect of nitrite, nitrate and ferric iron addition
and pH elevation on methane generation in sewers is summarized below.
Nitrite (NO2-) and nitrate (NO3
-) are highly toxic to methanogenic bacteria and decreases methane
generation drastically, even at low concentrations (Banihani et al. 2009, Jiang et al. 2010). This effect
is due to the biocidal effect of free nitrous acid (FNA) on the microorganisms in the anaerobic sewer
biofilm (Jiang et al. 2011). Mohanakrishnan et al. (2008) indicated that addition of nitrite in sewer
systems can strongly decrease the activity of methane generating bacteria. Concentrations of 20 to
140 mg NO2-.L-1 in the laboratory scale sewer reactor reduced the methane production potential to
less than 10%. The study indicates that nitrite addition is an effective methane emission reducing
technique. However, nitrite can be converted to nitrous oxide, which is also an important
greenhouse gas (Mohanakrishnan et al. 2008). Yet, nitrate addition in a lab-scale rising main sewer
reactor caused only a negligible discharge of nitrous oxide. The presence of nitrous oxide after
nitrate addition was transient, it was further reduced by denitrifiers after nitrate depletion (Jiang et
al. 2013).

32 | Chapter II: Literature review
Long-term pH elevation in sewer systems to levels of 8.0-9.0 suppresses the growth of
methanogenic bacteria (Gutierrez et al. 2009). However, naturally occurring pH and nitrite
fluctuations do not affect a WWTP’s methane emissions (Wang et al. 2011a).
Also long-term addition of ferric iron (Fe3+) in sewer systems inhibits methanogenic activity of
anaerobic sewer biofilms with 52 to 80% (Zhang et al. 2009).
An elevated pH and ferric iron addition are not very cost-effective. Nitrate or nitrite addition seems
to be a promising methane reducing technology (GWRC 2011). Emissions of nitrous oxide due to
conversion of nitrate or nitrite can be avoided if the sewage retention time is high enough (Jiang et
al. 2013).
9. Conclusions
Globally, methane emissions from wastewater treatment account for ca. 1.6% of the total
anthropogenic GHG emissions. Considering the rising importance of the reduction of the global
warming effect, it would be useful to reduce methane emissions from wastewater treatment.
Methane can be formed in anaerobic conditions before and during wastewater treatment. Although
processes of methane generation are well understood, uncertainty exist about the amount of
methane emitted from WWTPs. Some estimation methodologies to estimate methane emissions at
national and facility are available, but these do not consider all important sources of methane, i.e.
sewers and sludge treatment processes.
Methane can also be converted in the activated sludge tank of the WWTP. Research for this process
is limited and process kinetics and affecting parameters are not clearly understood. Investigating
methane conversion in activated sludge would be useful to come to an adequate abatement of GHG
emissions from wastewater treatment.

Chapter III: Experimental research | 33
Chapter III: Experimental research
1. Introduction
Full-scale aerobic methane oxidation in activated sludge during municipal wastewater treatment
was firstly investigated by Daelman et al. (2012b). Lab-scale experiments for methane oxidation by
activated sludge have been performed by STOWA (2012) and Ho et al. (2013). However, the process
kinetics and affecting parameters are not clearly defined. The aim of this experimental research was
to measure the rate of methane oxidation by activated sludge and to investigate the effects of
temperature and ammonium on the conversion rate.
This chapter describes the experimental research for methane oxidation in activated sludge. First,
the applied experimental set-ups and occurring problems are described. Secondly, the used
analytical methods are given. Conclusions are made in the last section.
2. Experimental set-up
Methane was added to a gastight activated sludge reactor and the methane concentration in the
reactor was tracked in time. A micro gas chromatograph (micro-GC) was used to analyse the reactor
headspace composition.
2.1 General
A glass reactor with a volume of 3.45L was used in this study. The reactor was filled with 1L of fresh
activated sludge. Activated sludge was taken from the outflow of the aeration tank at the WWTP in
Evergem (Belgium) and was collected in the morning to perform the experiments of the coming day.
The reactor was aerated during 30 minutes to convert all readily biodegradable COD (RBCOD). Then,
the reactor was closed with a plastic cover. The system was made gastight by making use of versatile
sealing medium (sealing compound Q; Apiezon) and a metal occlusion. Because gas exchange with
the environment was not allowed, the gas-tightness of the reactor was investigated before every
experiment. The experimental set-ups and arising problems are discussed in this section.
2.2 Experimental set-up no. 1
Experimental set-up no. 1 is illustrated in Figure 7. Methane and ammonia could be added at the top
of the reactor at any time in desired volumes (1). Methane was added in a gaseous form (Methane
puriss., ≥ 99.995%,(GC); Sigma-Aldrich), ammonia was brought into the reactor through addition of
ammonium carbonate (CH6N2O2*CH5NO3; EMSURE®). During the experiments, liquid samples could

34 | Chapter III:Experimental research
be taken at the top of the reactor to analyse the ammonium concentration in the liquid phase (2).
The air into the headspace of the lab-scale reactor was recycled to obtain an aerated and well-mixed
reactor (3, 4). A membrane pump was used to move the air from the headspace through the liquid
phase. Air samples (100 mL) could be taken manually at the top of the reactor with a gastight
syringe (5). A recycle was made from the micro-GC to the reactor to bring the air back into the
system (6). A constant operation temperature was obtained by using a thermostatic water bath that
sent water at a constant temperature through the jacket of the reactor (7,8).
Figure 7: Experimental set-up no. 1
A problem occurred with the air recycle stream from the GC. The volume of air that was injected
into the GC is not the same as the volume of air returned from the GC to the reactor. Hence,
recycling air samples from the GC to the reactor caused a loss of air in the system. This failing was
detected by injecting manually 100 mL into the GC and measuring the volume of outcoming air.
2.3 Experimental set-up no.2
As explained in section 2.2, recycling air used for analysis of the headspace composition is no option.
Because the micro-GC needs air samples of 100 mL, the pressure inside the reactor will change while
Liquid samples
(6)
1
(5)
1
(7)
1
(8)
1
(4)
1
(3)
1
Addition of methane
and ammonia
Membrane
pump
Thermostatic
water bath
Micro GC
(1)
1
(2)
1
Air samples
Activated sludge

Chapter III: Experimental research | 35
samples are taken. To reduce this pressure drop, samples of only 50 mL were taken from the
reactor. Hence, connection (6) in Figure 7 was removed for experimental set-up no. 2.
This experimental set-up has a few deficiencies. First, the volume of sample introduced into the
micro-GC is only half of the required volume. This probably caused a decrease in the accuracy of the
measurements. Secondly, only a limited amount of samples could be taken during one experiment.
Theoretically, the pressure in the reactor is already decreased with 10% after five samples. Hence,
investigating the effect of a temperature or ammonium concentration change in one experiment is
not possible without causing large pressure drops. This large pressure drop facilitates leakages and
complicates calculations.
2.3 Experimental set-up no.3
A possible solution for the problems with experimental set-up no. 2 could have been the use of a
reactor with variable volume. A PVDF gas bag 18x18 septum (LabPure®) with a maximal volume of
10 L was coupled to the plastic cover of the reactor to overcome pressure differences. The gas bag
was coupled to the reactor by connection (6) (Figure 7). In this way, the pressure in the system
remained constant.
Unfortunately, it was not possible to obtain sufficient air mixing in the system. The gas composition
in the gas bag and reactor were not the same. After addition of methane into the reactor, a
decrease in methane concentration was observed due to diffusion of methane from the reactor to
the bag. If methane was added into the gas bag, the inverse effect took place. The recycling stream
of air through the pump was without air release. Hence, using the membrane pump caused no
effect on the methane concentration in the headspace. This conclusion could be made after
performing the experiments with 1L of water instead of activated sludge. In this way, a change in
methane concentration could not be attributable to conversion processes, but only to practical
imperfections.
2.4 Practical limitations
Other possibilities to create an gastight reactor with a variable volume were not immediately
available for this master thesis. The GC available required a large sample volume (100 mL). Other
GCs exist requiring much smaller volumes of sample (less than 1 mL). However, such a GC was not
immediately available.

36 | Chapter III:Experimental research
3. Analytical methods
3.1 Analysis of the methane headspace concentration
A micro-GC, type Varian 490-GC was used to analyse the concentration of methane in the reactor
headspace. The gas samples were injected into the GC with a 100 mL gastight syringe. The micro-GC
was equipped with a universal Thermal conductivity detector (µ-TCD) and a differential mobility
detector (µ-DMD). This dual detection technology analysed the concentration of hydrogen (H2),
carbon monoxide (CO), carbon dioxide(CO2), methane (CH4), ethene (C2H4), ethane (C2H6),
propene/propane (C3H6/C3H8) and nitrogen gas (N2). The Varian GalaxieTM chromatography software
processed the signals given by both detectors. The GC had to be calibrated daily with two calibration
gases i.e. mix 1 (Composition (vol%): 6.5% H2, 40.1% CO, 39.7% CO2, 10.0% CH4, 2.02% C2H4, 1.01%
C2H6, 0.6966% C3H6, 0.3018% C3H8; Praixair) and mix 2 (Composition (vol%): 2.99% H2, 20.2% CO,
17.86% CO2, 4.98% CH4, 1.0% C2H4, 2.0% C2H6, 0.2978% C3H6, 0.7211% C3H8, 50.0N2; Praixair).
3.2 Soluble ammonia concentration
Liquid samples could be taken from the reactor through connection (2) (Figure 7) to analyse the
soluble ammonium concentration. The samples taken were first filtered with a 25 mm syringe filter
(VWR International). Then, the ammonium concentration was determined with the Ammonium test
kit Quantofix®( MACHEREY-NAGEL).
3.3 TSS and VSS concentration
The concentration of volatile suspended solids (VSS) and total suspended solids (TSS) in the
activated sludge were conducted in accordance with the standard methods (APHA 1995). For every
experiment, 100 mL of sludge was isolated for VSS and TSS determination.
4. Results
Deficiencies related to gas phase analysis hindered the performance of good experiments. The micro
Varian 490-GC required large samples volumes. Because the samples could not be brought back into
the reactor, only a limited amount of gas samples could be taken to not cause large pressure
changes inside the reactor.

Chapter III: Experimental research | 37
5. Conclusions
Regarding the limited research performed for methane oxidation by activated sludge, it would be
useful to observe the process kinetics and affecting parameters. Compared with online
measurements, lab-scale experiments are easier and allow to investigate the effect of temperature
and ammonium concentration. Though, practical limitations did not allow to measure methane
oxidation in activated sludge.
A GC requiring small sample volumes or a well-mixed reactor with variable volume is needed to
comply with the requirements of a good experimental performance. In that case, more samples can
be taken, which allows investigation of the effects of temperature and ammonium concentration.


Chapter IV: Modelling methane oxidation in activated sludge processes | 39
Chapter IV: Modelling methane oxidation in activated sludge processes
1. Introduction
Methane can be converted in the activated sludge tank during wastewater treatment (Daelman et
al. 2012b, STOWA 2012, Ho et al. 2013). The process kinetics and affecting parameters are not
completely understood. Modelling methane oxidation by activated sludge would be useful to better
understand the process.
In this master thesis, methane oxidation was implemented in existing activated sludge models. The
aim is to include dissolved methane and methanotrophic bacteria to make it possible to predict
methane conversion and methane emissions released from a WWTP. First, methane oxidation was
implemented in a ‘basic’ model, namely Activated Sludge Model no. 1 (ASM1). Afterwards, the
modified model was incorporated in a WWTP model, called Benchmark Simulation Model no. 1
(BSM1). The modified models are called ASM1m and BSM1m, where the ‘m’ refers to methane.
This chapter describes the inclusion of methane oxidation in this models. First, ASM1 is introduced
in short. Then, the state variables, conversion processes and mass balances are well described. Next,
the implementation of the model in Matlab is given. The incorporation of ASM1m in a WWTP model
is presented in the last section.
2. ASM1 with methane oxidation – ASM1m
Activated sludge models (ASMs) are used in design and control of WWTPs and for teaching and
research. Activated sludge model no. 1 (ASM1) was published by the International Association on
Water Pollution Research and Control (IAWPRC) in 1987 and is the first and most simplified model of
the activated sludge simulating models (Henze et al. 2000). More extended versions of this model
have been created, including also biological phosphorus removal. Nevertheless, ASM1 is probably
still mostly used for describing wastewater treatment processes and can be considered as a ‘state-
of-art’ model when biological phosphorous removal is not considered (Jeppsson 1996).
ASM1 describes activated sludge processes. The aim of the development of ASM1 was to create a
model with a minimum of complexity. Biological removal of biodegradable COD and nitrogen in the
reactor is described (Henze et al. 2000). The assumptions and constraints of ASM1 are summarized
in Appendix 1 and Appendix 2.
ASM1 was expanded with methane oxidation. The new model is called ASM1m.
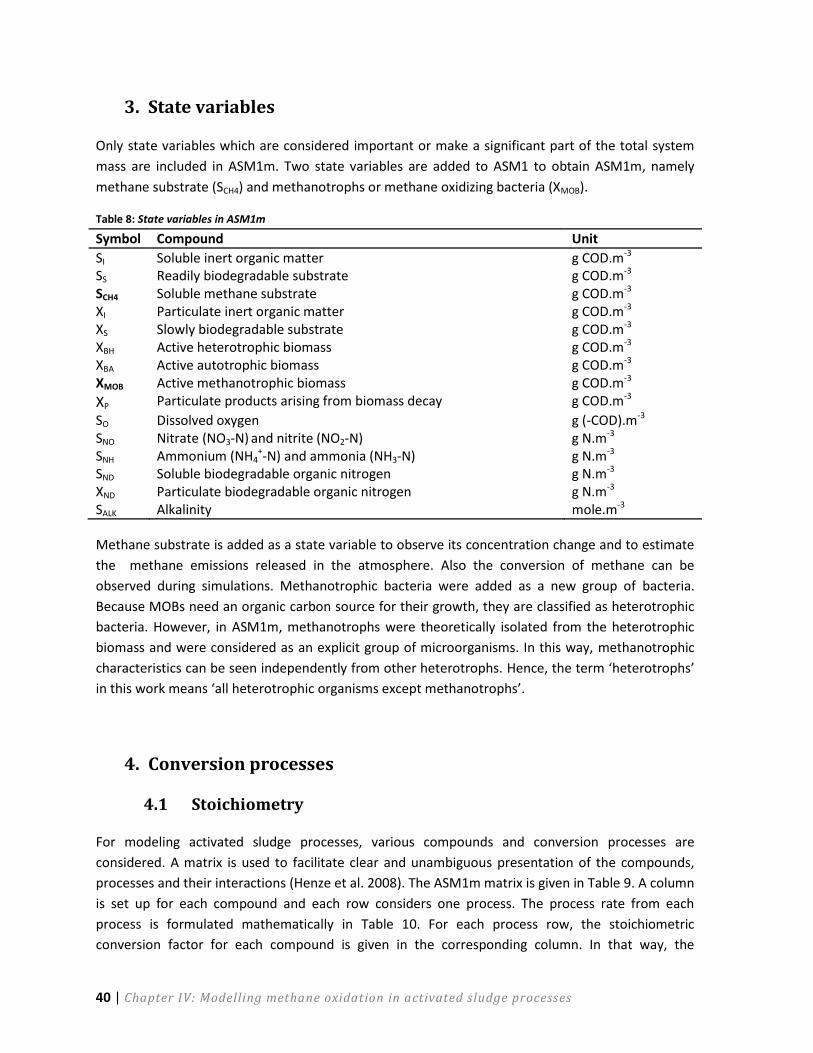
40 | Chapter IV: Modelling methane oxidation in activated sludge processes
3. State variables
Only state variables which are considered important or make a significant part of the total system
mass are included in ASM1m. Two state variables are added to ASM1 to obtain ASM1m, namely
methane substrate (SCH4) and methanotrophs or methane oxidizing bacteria (XMOB).
Table 8: State variables in ASM1m
Symbol Compound Unit
SI Soluble inert organic matter g COD.m-3 SS Readily biodegradable substrate g COD.m-3 SCH4 Soluble methane substrate g COD.m-3 XI Particulate inert organic matter g COD.m-3 XS Slowly biodegradable substrate g COD.m-3 XBH Active heterotrophic biomass g COD.m-3 XBA Active autotrophic biomass g COD.m-3 XMOB Active methanotrophic biomass g COD.m-3
XP Particulate products arising from biomass decay g COD.m-3
SO Dissolved oxygen g (-COD).m-3 SNO Nitrate (NO3-N) and nitrite (NO2-N) g N.m-3 SNH Ammonium (NH4
+-N) and ammonia (NH3-N) g N.m-3 SND Soluble biodegradable organic nitrogen g N.m-3 XND Particulate biodegradable organic nitrogen g N.m-3 SALK Alkalinity mole.m-3
Methane substrate is added as a state variable to observe its concentration change and to estimate
the methane emissions released in the atmosphere. Also the conversion of methane can be
observed during simulations. Methanotrophic bacteria were added as a new group of bacteria.
Because MOBs need an organic carbon source for their growth, they are classified as heterotrophic
bacteria. However, in ASM1m, methanotrophs were theoretically isolated from the heterotrophic
biomass and were considered as an explicit group of microorganisms. In this way, methanotrophic
characteristics can be seen independently from other heterotrophs. Hence, the term ‘heterotrophs’
in this work means ‘all heterotrophic organisms except methanotrophs’.
4. Conversion processes
4.1 Stoichiometry
For modeling activated sludge processes, various compounds and conversion processes are
considered. A matrix is used to facilitate clear and unambiguous presentation of the compounds,
processes and their interactions (Henze et al. 2008). The ASM1m matrix is given in Table 9. A column
is set up for each compound and each row considers one process. The process rate from each
process is formulated mathematically in Table 10. For each process row, the stoichiometric
conversion factor for each compound is given in the corresponding column. In that way, the

Chapter IV: Modelling methane oxidation in activated sludge processes | 41
processes that affect a certain compound can be determined by looking at the compound’s column.
The sign convention used in the matrix is negative for consumption and positive for production.
Oxygen accepts electrons when a substrate is converted, so oxygen is considered as negative COD
(Henze et al. 2008). The rows, columns and process rates added to ASM1 to obtain ASM1m are
marked.
The composition matrix is given below the stoichiometric matrix (Table 9). This matrix presents the
composition in terms of conserved balances, i.e. the COD, nitrogen and charge balance.
Multiplication of these two matrices gives zero as a result, because they contain all conserved
balances (Henze et al. 2008). An exception is the process of anoxic growth of heterotrophs, the COD
and nitrogen balance is incomplete for this process. During the nitrification process, nitrate is
converted to nitrogen gas and nitrite is formed as an intermediate product, but nor nitrite nor
nitrogen gas are considered in the matrix. Thence, the balance cannot be complete.
Nine stoichiometric coefficients were added to the ASM1m matrix to relate the added state
variables with the methanotrophic growth and decay processes. They are located in the marked
rows and columns in Table 9. Biological kinetics in ASM1m are based on growth. Hence, the
stoichiometric coefficient for aerobic methanotrophic growth and decay of methanotrophs are
respectively 1 and -1. The other stoichiometric coefficients can be derived from the COD, nitrogen
and charge balances in the composition matrix or through application of theoretical knowledge and
assumptions. The significance of all added stoichiometric coefficients are described in Appendix 3.
Assumptions made in ASM1 are summarized in Appendix 1. All these assumptions are also valid in
ASM1m. Stoichiometric factors and processes added or influenced by the implementation of
methane oxidation are subjected to analogous assumptions. Three of these assumptions are related
to stoichiometric factors: (1) methanotrophic decay transforms active methanotrophic biomass into
slowly biodegradable material and inert particulates, (2) oxygen is not required for decay of
methanotrophic biomass, oxygen is only necessary for regrowth on the released substrates and (3)
incorporation of nitrogen in methanotrophic biomass decreases alkalinity.

Table 9: ASM1m matrix, the marked rows and columns represents the added state variables and processes to include methane oxidation in ASM1
Aij SI [gCOD.m
-3]
SS [gCOD.m
-3]
SCH4 [gCOD.m
-3]
XI [gCOD.m
-3]
XS [gCOD.
m-3
]
XBH [gCOD.m
-3]
XBA
[gCOD.m
-3]
XMOB [gCOD.m
-3
]
XP
[gCOD.m-3
]
SO [gO2. m
-
3]
SNO [gN. m
-3
]
SNH [gN. m
-3
]
SND [gN. m
-3]
XND [gN. m
-3
]
SALK [mole HCO3
-.
m-3
]
PROCESS STOICHIOMETRIC MATRIX
1. Aerobic growth of heterotrophs
-1/YH 1 -(1-YH)
/YH -iXB -iXB/14
2. Anoxic growth of heterotrophs -1/YH 1
-(1-YH)/ (2.86YH)
-iXB (1-YH)
/(14*2.86*YH) -iXB/14
3. Aerobic growth of autotrophs
1 -(4.57-YA) /YA
1/YA -iXB -1/YA
-iXB/14-1/(7*YA)
4. Aerobic growth of methanotrophs
-1/
YMOB 1
-(1-YMOB) /YMOB
-iXB -iXB/14
5. Decay of heterotrophs
1-fP -1 fP iXB-fP* iXP
6. Decay of autotrophs
1-fP -1 fP iXB-fP* iXP
7. Decay of methanotrophs
1-fP -1 fP iXB-fP* iXP
8. Ammonific. of soluble organic nitrogen
1 -1 1/14
9. Hydrolysis of entrapped organics
1 -1
10. Hydrolysis of entrapped organic nitrogen
1 -1
CONSERVATIVES COMPOSITION MATRIX
COD 1 1 1 1 1 1 1 1 1 -1 -4.57 0
N iXB iXB iXB iXP 0 1 1 1 1
Charge -1/14 1/14 -1

Table 10: Process rates for ASM1m, the marked rows represent the added process rates to include methane oxidation in ASM1
j process ρj
1. Aerobic growth of heterotrophs
2. Anoxic growth of heterotrophs
3. Aerobic growth of autotrophs
4. Aerobic growth of methanotrophs
5. Decay of heterotrophs
6. Decay of autotrophs
7. Decay of methanotrophs
8. Ammonification of soluble organic nitrogen
9. Hydrolysis of entrapped organics
[
]
10. Hydrolysis of entrapped organic nitrogen
[
]

44 | Chapter IV: Modelling methane oxidation in activated sludge processes
4.2 Reaction kinetics
All process rates of the processes in the ASM1m matrix are given in Table 10. Two processes were
added to the ASM1 matrix, i.e. aerobic methanotrophic growth and decay of methanotrophs.
The composition of the mathematical expression for the aerobic growth rate of methanotrophs (ρ4)
can be explained as follows. The first term represents the maximal growth rate of methanotrophs at
20°C. Three saturation (Monod) terms were used to describe the opportunities for methanotrophic
growth; each term has a value between 0 and 1. The first Monod term includes substrate saturation.
This term decreases methanotrophic growth in case substrate limitation occurs. The second Monod
term is a switching term that can switch the methanotrophic growth process on and off. KO,MOB has
no ‘real’ value and is chosen small. Consequently, the switching term is near unity in aerobic
conditions and becomes zero in case no oxygen is present. The third Monod term is a switching term
for ammonium. As mentioned in literature, it is supposed that the presence of high ammonium
concentrations affects methane oxidation (Whittenbury et al. 1970, Begonja and Dubravka 2001,
Park et al. 2005, Nyerges and Stein 2009). However, the effects are disputed by van der Ha et al.
(2010). van der Ha et al. (2011) only observed an effect of the ammonium concentration during the
first two cycles (out of ten, one cycle lasted 72 hours) after ammonium addition. Ho et al. (2013)
suggests that high ammonium concentrations may be a strong selecting force for the
methanotrophic community composition in the reactor. Because the effect is not well known on this
moment, the value of KNH,MOB is chosen large. Hence, the switching term has only a minimal effect on
the methanotrophic growth rate for higher ammonium concentrations. In case more clearness exists
about this phenomena, a more appropriate value for the switching parameter can be used.
All assumptions made in ASM1 (Appendix 1) are still valid for ASM1m. Assumptions for
methanotrophic growth and decay of MOBs are analogous to assumptions made for other biomass
growth and decay processes. Consequently, it is assumed that methane substrate is removed
proportional to methanotrophic growth; storage of methane is assumed negligible. Growth of
methanotrophic bacteria is assumed to take place in aerobic conditions. Though, methane can also
be oxidized in anaerobic conditions, but this process is not considered in ASM1m. The process rate
for decay of methanotrophic biomass (ρ7) is approached by the death-regeneration model of Dold et
al. (1980), like all other biomass decay processes in ASM1. Methanotrophic biomass decay is not
dependent on the electron acceptor present. Only the conversion of formed slowly biodegradable
compounds into substrate available for growth depends upon the electron acceptor present.
4.3 Parameters
To describe the occurring processes, different parameters are used in the ASM1m (Appendix 1). The
stoichiometric parameters used are shown in Table 11, the kinetic parameters are given in Table 12.
The parameters related to methane oxidation are marked in bold. Values for stoichiometric and
kinetic parameters have to be selected to simulate the model. For activated sludge models,
parameter values are traditionally determined through specific and well-controlled experiments at

Chapter IV: Modelling methane oxidation in activated sludge processes | 45
pilot and bench-scale plants assuming constant operating conditions (Jeppsson 1996). Default
parameter values from ASM1 at 20°C are used in ASM1m. Values for added parameters were
obtained from the experiments from Arcangeli and Arvin (1999), who determined parameter values
to describe methane oxidation processes at 20°C. Values for new stoichiometric and kinetic
parameters that could not be found in literature were based on assumptions.
To allow conversion of COD to TSS units, a conversion factor is needed. The COD:TSS ratio for the
methanotrophic biomass (XMOB2TSS) is assumed equal to all other conversion factors, i.e. 0.75 g TSS. g
COD-1.
Table 11: Stoichiometric parameters in ASM1m
Symbol Parameter description ASM1m (at 20°C)
Unit
YH Yield for heterotrophic biomass 0.67 g COD.g COD-1 YA Yield for autotrophic biomass 0.24 g COD.g N-1 YMOB Yield for methanotrophic biomass 0.19a g COD.g COD-1 fP Fraction of biomass leading to particulate products 0.08 - iXB Mass of nitrogen per mass of COD in biomass 0.086 g N.g COD-1 iXP Mass of nitrogen per mass of COD in products from
biomass 0.06 g N.g COD-1
a Methanotrophic yield
at 20°C
is 0.57 g biomass. g CH4
-1 (Arcangeli and Arvin 1999). This value was converted to the
desired units using a conversion factor (XMOB2TSS) of 0.75 g biomass. g COD-1
.

Table 12: Kinetic parameters in ASM1m
Symbol Parameter description ASM1m (at 20°C)
Unit
μmax,H Maximum specific growth rate for heterotrophic biomass 6.0 d-1 Ks Half saturation concentration for heterotrophic biomass 20.0 g COD.m-3 KO,H Oxygen half saturation coefficient for heterotrophic biomass 0.20 g (-COD).m-3 KNO Nitrate half saturation coefficient for denitrifying heterotrophic biomass 0.50 g N.m-3 bH Decay coefficient for heterotrophic biomass 0.62 d-1 ηy,g Correction factor for μH under anoxic conditions 0.8 - ηy,h Correction factor for hydrolysis under anoxic conditions 0.4 - kh Maximum specific hydrolysis rate 3.0 g COD. g COD-1.d-1 KX Half saturation coefficient for hydrolysis of SBCOD 0.03 g COD. g COD-1 μmax,A Maximum specific growth rate for autotrophic biomass 0.80 d-1 KNH,A Ammonia half saturation coefficient for autotrophic biomass 1.0 g N.m-3 bA Decay coefficient for autotrophic biomass 0.20 d-1 KO,A Oxygen half saturation coefficient for autotrophic biomass 0.4 g (-COD).m-3 ka Ammonification rate 0.08 m³.g COD-1.d-1 μmax,MOB Maximum specific growth rate for methanotrophic biomass 1.5c d-1 KCH4 Half saturation concentration for methanotrophic biomass 0.24c g COD.m-3 KO,MOB Oxygen half saturation coefficient for methanotrophic biomass 0.2d g (-COD).m-3 KNH,MOB Ammonia half saturation coefficient for methanotrophic biomass 1000e g N.m-3 bMOB Decay coefficient for methanotrophic biomass 0.24c d-1 a
Default parameter values ASM1 (Henze et al. 2000)
b Parameter values in BSM1 (Alex et al. 2008)
c Parameter values at 20°C (Arcangeli and Arvin 1999)
d Assumed the same value as heterotrophs (KO,H)
e High value, the effect should be minimal

Chapter IV: Modelling methane oxidation in activated sludge processes | 47
5. Mass balances
The concentration of the components in the system can be affected by different processes. A
mass balance is set up for each compound considered in the system. The general mass balance is
given by equation (7). In this equation, a constant flow rate (Qin = Qout), a completely mixed
reactor tank (Cout = C) and a fixed reactor volume (dV/dt = 0) are assumed.
Where:
C Concentration of soluble (S) or particulate (X) material in bulk liquid [g COD.m-3]
C* Concentration of soluble (S) or particulate (X) material in bulk liquid
in equilibrium with the gas phase
[g COD.m-3]
Cin Influent soluble (S) or particulate (X) material concentration [g COD.m-3]
kLa External mass transfer coefficient [d-1]
r Conversion rate [g COD.m-3.d-1]
t Time [d]
Only compounds which are considered important or make a significant part of the total system
mass are included in the model. The balances are based on COD rather than on BOD, because
COD is defined as the number of electrons that are transferred to oxygen in order to oxidize
organic matter to carbon dioxide and water. Balances are also based on nitrogen and charge
(Henze et al. 2008).
The mass balance states that a compound entering the reactor is either leaving with the effluent,
converted in the reactor or exchanged with the gas phase. This three options are described
subsequently.
5.1 Advective transport
Compounds are transported in the liquid phase. A compound enters the reactor with the
influent in a certain concentration and leaves the reactor after a certain period of time. The
reactor operation can be a batch or continuous process.
Batch processes are very simple processes. To set up a batch activated sludge reactor, activated
sludge and wastewater are brought into a reactor for a certain period of time while the reactor
is mixed and aerated. Afterwards, the process is stopped and a new process can be started. For
implementation into the model, only the initial conditions should be determined, influent data
does not exist and could be set equal to zero. The reactor content is only changed by conversion
processes and interphase exchange.
( )
(
)
(7)

48 | Chapter IV: Modelling methane oxidation in activated sludge processes
Continuous processes operate without intermissions. Wastewater is brought into the reactor and
leaves the reactor at the other side. The sludge can be recycled after settling. For model
implementation, the initial reactor conditions and influent characteristics should be determined.
In ASM1m, COD (including methane), nitrogen and biomass enter the reactor with the influent
and are subjected to various conversion and interphase exchange processes. Not all
biodegradable material is utilized by microorganisms. A small fraction will leave the reactor with
the effluent. Wastewater treatment processes are mostly continuous operated.
5.2 Interphase transport
An activated sludge reactor is aerated. Consequently, transfer between the gas and liquid phase
had to be taken into account. In ASM1, oxygen is the only compound were interphase transport
is considered. Methane enters the reactor in the liquid phase and is very volatile, thus stripping
of methane need to be included in ASM1m. The net transport rate from the gas to the liquid
phase is given by the last part of equation (7). Two parameters are used to describe interphase
transport processes i.e. the mass transfer coefficient and the concentration of a component in
the liquid phase in equilibrium with the gas phase.
The mass transfer coefficient (kLa) represents the mass transport of a component per unit of
time. The kLa value for low water soluble components – thus for methane - is related to the kLa
for oxygen, in case the liquid is in a turbulent motion (De Heyder et al. 1997). The relationship is
given in equation (8).
kLa values are temperature dependent. DCH4 and DO2 represent the diffusion coefficient for
methane and oxygen in water at a certain temperature [cm².s-1].
Wise and Houghton (1966) measured the diffusion coefficient of ten slightly soluble gases in
water - including oxygen and methane - between 10 and 60°C. The ratio (DCH4/DO2)1/2 does not
vary significantly with the temperature (Table 13). An average value of 1.05 can be used for all
temperatures in the range of 10 to 60°C.
Table 13: Diffusion coefficients of methane and oxygen at 10 – 60°C
Temperature (°C) DCH4 (cm².s-1) DO2 (cm².s-1) (DCH4/DO2)1/2 (-)
10 1.9 1.7 1.1 20 2.4 2.3 1.0 30 3.0 2.8 1.0 40 4.2 3.8 1.1 50 4.7 4.2 1.1 60 6.7 5.7 1.1
The soluble methane concentration in equilibrium with the gas phase (C*) [mol.L-1]can be
calculated with Henry’s law (equation (9)).
√
(8)

Chapter IV: Modelling methane oxidation in activated sludge processes | 49
Where H is the Henry constant [mol.L-1.Pa-1], p is the partial pressure of the component in the
gas phase [Pa].
NIST (2011) summarized Henry constants resulting from different experiments. The average
value for the Henry constant for methane at standard conditions resulting from the experiments
performed from 1975 until now is 1.39 x 10⁻⁸ mol.L-1.Pa-1. The activated sludge reactor in ASM1m
is an open system. Hence, stripped methane will be mixed with the environmental air to a
negligible concentration. Applying Henry’s law, the saturated dissolved methane concentration
should be set as zero.
5.3 Conversion processes
Various conversion processes take place in ASM1m. In activated sludge models, the reaction rate
of a certain component [g COD.m-3.d-1] is given by equation (10). A positive value for ri indicates
production of component i, a negative ri means that the component is consumed (Henze et al.
2000).
∑
(10)
νij is the stoichiometric coefficient component i for process j (-) and ρj is the process rate
expression for process j [g COD.m-3.d-1]. In ASM1m, all conversion processes are considered to
take place in the liquid phase. The ASM1m matrix represents all conversion processes
schematically (Table 9 and Table 10).
6. Implementation of ASM1m in Matlab - Simulink
6.1 Simulink model
ASM1m is simulated in Matlab - Simulink. The Simulink model is given in Figure 8.
(9)

50 | Chapter IV: Modelling methane oxidation in activated sludge processes
Figure 8: ASM1m – Matlab Simulink
The inputs of the activated sludge reactor are the influent characteristics and the mass transfer
coefficients of oxygen and methane. The influent wastewater is characterized by 17 state
variables and varies in time. Vanhooren and Nguyen (1996) proposed influent data for dry,
storm and rain weather. Each file consists of two weeks of dynamic weather influent data. Also a
constant influent file exists. This file contains flow-weighted average influent concentrations of
the dry weather file (Vanhooren and Nguyen 1996). Of course, these four influent files do not
contain the state variables related to methane oxidation. A concentration for SCH4 and XMOB can
be introduced through Addstatevariables. Influentcombiner combines these state variables with
all other state variables from the influent files.
The kLa-block contains the kLa for oxygen and methane. Their values depend upon the aeration
of the reactor and are considered to be constant. The simulation time is often chosen 14 days.
After simulation, the reactor output can be found in Store_reac. A detail of the bioreactor is
given in Figure 9.
Figure 9: Bioreactor ASM1m – Matlab Simulink
The mux-block combines the inputs and send them to the activated sludge reactor. Within the
reactor, the activated sludge processes are simulated by ASM1m. All mass balances discussed in
section 5 were introduced in asm1m.m to simulate the conversion processes taking place in the
activated sludge reactor. The output of the bioreactor is split into two parts. The first 17 outputs
represent the effluent concentrations of all state variables after passing the ASM1m reactor.
These outputs can eventually be send to another treatment stage of the WWTP. The three other
outputs are no real outputs; they describe the interphase transport, i.e. oxygen uptake and
Chapter IV: Modelling methane oxidation in activated sludge processes | 51
methane emissions and methane conversion. The derivative of the outputs are multiplied by the
reactor volume to get the interphase transport in g.d-1.
6.2 Evaluation of the reactor performance
Control strategies of WWTPs are traditionally evaluated based on the effluent quality index
(EQI), operational cost index (OCI) and time in violation (TIV) (Alex et al. 2008). In ASM1m,
methane emission and conversion were added to evaluate the performance of the activated
sludge reactor. Flores-Alsina et al. (2011) already proposed a strategy to include GHG emissions
for wastewater treatment plant control strategies. For simplification, only methane emissions
were considered to evaluate the reactor performance in ASM1m. Values for average methane
conversion and emissions are presented when the reactor performance is evaluated. Also a
figure represents graphically the methane conversion, emission and effluent methane
concentration in function of time.
Methane substrate and methanotrophic biomass were considered in the calculation of BOD5,
COD and TSS. The fraction of nitrogen incorporated in methanotrophic biomass was also taken
into account to determine the concentration of ammonia and total nitrogen. The equations for
the effluent BOD5, COD, TSS, ammonia and total nitrogen concentration are given in Equation
(11) - (15), the influent equations are analogous.
( ) ( ) (11)
( ) (12)
( ( ) ( )) (13)
(14)
(15)
In this way, methane substrate and methanotrophic biomass are included in the determination
of EQI and TIV. The EQI is related to levies or fines that have to be paid due to the discharge of
pollution in the receiving water bodies (Alex et al. 2008). The index is based on a weighting of
the effluent loads of compounds that have a major influence on the quality of the receiving
water and that are usually included in regional legislation (Equation (16)). The TIV represents the
percentage of time that the effluent limits are not set. The effluent quality limits are given in
Appendix 4.
∫( ( ) ( ) ( )
( ) ( )) ( ) (16)

52 | Chapter IV: Modelling methane oxidation in activated sludge processes
Where:
BBOD5 Weighting factor of BOD5 effluent load (BBOD5 = 2) [g pollution unit. g-1]
BCOD Weighting factor of BOD5 effluent load (BCOD = 1) [g pollution unit. g-1]
BNHj Weighting factor of Kjeldahl nitrogen effluent load (BNKj = 30) [g pollution unit. g-1]
BNO Weighting factor of nitrate effluent load (BNO = 10) [g pollution unit. g-1]
BTSS Weighting factor of TSS effluent load (BTSS = 2) [g pollution unit. g-1]
Qe Effluent flow rate [m3.d-1]
tobs Period of observation [d]
Because only one reactor is simulated and not an entire wastewater treatment plant, the values
of the performance indices EQI, OCI and TIV are not relevant to evaluate the process. Only one
stage of the wastewater treatment process was simulated. This does not suffice to get a good
effluent quality. The OCI is lower than that of an entire WWTP, because ASM1m only includes
costs for reactor mixing and aeration. Cost for recycling, sludge treatment and carbon addition
were not considered. This model and the evaluation of process performance must be seen in a
broader context; as part of a wastewater treatment process or to compare different process
configurations. For this reason, the performance indices are not considered further during
simulations of ASM1m.
7. Incorporation of ASM1m in a wastewater treatment plant
model – BSM1m
7.1 Simulation benchmark
Simulation Benchmark is a standardized simulation protocol which was created to allow
evaluation and comparison of control strategies for activated sludge processes. Because many
confounding influences have an impact on the activated sludge system, control strategies for
activated sludge processes are often very location specific. Hence, literature cannot provide a
clear basis to develop a how-to-do procedure for control strategies in full scale. The creation of a
standardised procedure made it possible to efficiently evaluate numerous strategies through
realistic/dynamic computer simulations (Tchobanglous and Burton 1991).
Simulation Benchmark was firstly developed by the IAWQ (NIST 2011) and was modified by the
European Co-operation in the field of Scientific and Technical Research (COST) 682/624 Action
(van der Lans 2000). On this moment, this work is continued under the umbrella of the IWA Task
Group on Benchmarking of Control Strategies for WWTPs (Alex et al. 2008). The benchmark can
be implemented into various simulation platforms, direct coding as well as commercial WWTP
simulation software packages can be used. The first Benchmark layout is called Benchmark
Simulation Model no. 1 (BSM1) (Tchobanglous and Burton 1991). This model is used to simulate
methane oxidation in a wastewater treatment plant model.

Chapter IV: Modelling methane oxidation in activated sludge processes | 53
7.2 BSM1 with methane oxidation – BSM1m
BSM1 simulates an entire WWTP, but has a relatively simple layout. Nitrogen removal process
are described by combination of nitrification and predenitrification. The simulation benchmark
plant is composed of a five-compartment activated sludge reactor consisting of two anoxic tanks
followed by three aerobic tanks. The five reactors are positioned in series and are followed by a
10 layer secondary settling tank.
Figure 10: Schematic representation of the Simulation Benchmark configuration
A basic control strategy is included in BSM1. The nitrate concentration in reactor 2 is controlled
by manipulation of the internal recycle flow rate and the dissolved oxygen concentration in
reactor 5 is controlled by changing the kLa value of the last reactor. ASM1 is used to describe the
biological phenomena taking place in the biological reactor situated in BSM1 (Alex et al. 2008).
After the development of ASM1m, it was relatively simple to implement methane oxidation also
in BSM1. The new model is called Benchmark Simulation Model no. 1m (BSM1m).
BSM1 introduces active noise and delay on sensors and actuators. Because this is not relevant
for the investigation of methane emissions from WWTPs, only ideal sensors and actuators are
used in BSM1m.
Benchmark models can be implemented in various simulation platforms. BSM1m was
implemented into Matlab/ Simulink. The Simulink model is completely analogous with the
original BSM1, except for the influentcombiner block (Appendix 5). This block was added to
introduce methane substrate in the influent stream. All ASM1 reactors were replaced by ASM1m
reactors to describe the biological conversion processes. Methane conversion and emissions are
considered in each reactor, but not in de settling tank.
7.3 Evaluation of the plant performance
After simulation, the performance of the plant and risk for settling problems can be evaluated.
Analogous to ASM1m, methane emissions and conversion were included in the evaluation of the
process performance (section 6.2). Additionally, methanotrophic biomass is also included in the
sludge production (SP) (Equation (17)).
(∫( ( ) ( ))
∫( ) ( ) )
(17)
54 | Chapter IV: Modelling methane oxidation in activated sludge processes
With:
∑ ( )
(18)
∑ ( )
(19)
Where:
m Number of layers of the secondary clarifier (m = 10) [-]
n Number of activated sludge tanks (n = 5) [-]
Qw Waste flow rate [m3.d-1]
Qe Effluent flow rate [m3.d-1]
SP Sludge production [kg TSS.d-1]
TSSas Total amount of suspended solids present in the activated sludge
reactors
[g TSS]
TSSsc Total amount of suspended solids present in the secondary clarifier [g TSS]
zj Height of layer j [m]
Since the methanotrophic biomass is included in the amount of sludge that has to be disposed
(SP) and the SP is included in the OCI, methanotrophic biomass is also included in the OCI
(Equation (20)).
(20)
The OCI is determined by the costs for aeration energy (AE) [kWh.d-1], pumping energy (PE)
[kWh.d-1], sludge production (SP) [kg TSS.d-1], consumption of external carbon source (EC)
[kg COD.d-1] and mixing energy (ME) [kWh.d-1]. Only the value for sludge production was
affected by the implementation of methane oxidation.
8. Conclusions
Methane conversion was implemented in two activated sludge models. Two state variables, one
stoichiometric and five kinetic parameters were added to describe this process. The modified
models, ASM1m and BSM1m, allow to consider methane emission and conversion in the
evaluation of the process performance. The amount of methane emitted, converted and
removed with the effluent are presented when the process performance is evaluated.
Methane emission and conversion were only considered in the bioreactors and not in de
secondary settling tank. It was assumed that the amount of methane converted and emitted in
this part of the WWTP is negligible. This assumption is acceptable. The tank is not aerated, the
soluble methane concentration is very low and nutrients are limited.

Chapter IV: Modelling methane oxidation in activated sludge processes | 55
Methane substrate and methanotrophic biomass were also included in the performance
parameters, i.e. EQI, OCI and TIV. The OCI and EQI are both related to costs. The OCI represents
operational costs, the EQI is related to levies or fines that have to be paid due to the discharge of
pollution in the receiving water bodies (Alex et al. 2008). Yet, an index considering GHG
emissions does not exist. Considering the importance of the abatement of GHG emissions, it
would be useful to create a new dimension dealing with GHG emissions from wastewater
treatment. The interest in the abatement of greenhouse gas emissions is increasing, and it is
suspected that WWTPs will be necessitated to compensate their greenhouse gas emissions in
future. Wang et al. (2011b) already estimated the economic incentive obtained when a crediting
system for greenhouse gases would be created in the United States. Probably, implementing an
index for greenhouse gas emissions will change the operational tradeoffs in wastewater
treatment systems.


Chapter V: Simulation study | 57
Chapter V: Simulation study
1. Introduction
ASM1m allows to simulate removal of COD, nitrogen and methane in activated sludge processes.
ASM1m was incorporated into BSM1m to simulate an entire WWTPS. In Chapter V, a simulation
study is performed. The aim of this simulation study is to perform a first evaluation of the
process behaviour of the models.
First, the set-up of the simulation study is described. Secondly, the effects of some parameters
on methane conversion and emissions are examined. The last section considers a simulation
study of methane conversion in a WWTP with BSM1m. Like already mentioned in Chapter IV,
methanotrophs are considered separately from the heterotrophs. Consequently, the term
‘heterotrophs’ includes all types of heterotrophic organisms, except methane oxidizers.
2. Set-up of simulation study
To perform simulations with ASM1m and BSM1m, the user should determine the reactor
configuration, influent characteristics and initial conditions. This section describes the default
values used for the simulation study.
2.1 Initialization of ASM1m
2.1.1 Reactor configuration
The reactor parameters describing the reactor configuration in ASM1m are given in Table 14.
The choice for the different parameter values are explained below the table.
Table 14: Reactor parameters ASM1m
Symbol Description ASM1m Unit
V Volume reactor 166014a m³ SCH4,sat Saturated methane concentration 0b g COD.m-3 SO,sat Saturated oxygen concentration 8c g O2.m
-3 kLaCH4 Methane mass transfer coefficient 8.4d d-1 kLaO Oxygen mass transfer coefficient 8e d-1 a
Reactor volume for an HRT of 9 days b
Open system, soluble methane concentration in equilibrium with the gas phase is set as zero (Chapter IV, section 5.2) c Soluble saturated oxygen concentration is assumed the same as in BSM1
d kLaCH4 = 1.05. kLaO (Chapter IV, section 5.2)
e Small kLaO was chosen to allow methanotrophic growth
Because there is no sludge recycle, the SRT of the system is equal to the HRT. The reactor
volume need to be chosen large, otherwise the bacteria do not have the time to grow. A HRT of
9 days enables heterotrophic, autotrophic and methanotrophic growth.

58 | Chapter V: Simulation study
2.1.2 Influent conditions
The input of the activated sludge system is the influent wastewater stream. Three types of
influent data can be used: dry weather, storm weather and rain weather. Because the difference
between the influent files are not relevant in this study, the dry weather file was used to set the
influent conditions for all simulations. Determination of the influent methane concentration and
methanotrophic biomass is discussed below.
Determination of the influent methane concentration (SCH4,infl) is based on an observation from
Daelman et al. (2012b). The methane concentration in the influent and effluent stream of the
activated sludge reactor at the WWTP at Kralingseveer (the Netherlands) was measured during
one year. The influent stream has an average methane concentration of 8 kg CH4.h-1 and an
average flow rate of 5000 m3.h-1(Daelman et al. 2012b). Considering that 1 g of methane
corresponds to 4 g of COD, the influent methane concentration is set as 6.4 g COD.m-³.
Methanotrophs are assumed to not be present in the influent stream. The influent
methanotrophic biomass concentration (XMOB,infl) is set as zero, methanotrophs are introduced
into the system with the initial conditions. This is also valid for autotrophic biomass.
2.1.3 Initial conditions
The initial values for the state variables are determined using the procedure described in
Tchobanglous and Burton (1991). First, a 150 days simulation need to be performed with the
constant influent file to obtain stabilization. A period of 10 times the sludge age normally
suffices to reach steady state or a stabilized system. The final output values for the state
variables are set as initial conditions (Table 15). Then, a 14 days simulation of dry influent is
performed. The reactor output after 14 days is used as initial conditions.
Table 15: Steady state conditions ASM1m
State variable Initial value Unit
SI,init 30 g COD.m-³ SS,init 2.6185 g COD.m-³ SCH4,init 0.080509 g COD.m-³ XI,init 51.2 g COD.m-³ XS,init 0.93904 g COD.m-³ XBH,init 67.4711 g COD.m-³ XBA,init 3.576 g COD.m-³ XMOB,init 0.014015 g COD.m-³
XP,init 30.6365 g COD.m-³
SO,init 2.7596 g COD.m-³ SNO,init 37.8447 g COD.m-³ SNH,init 0.80264 g N.m-³ SND,init 0.97955 g N.m-³ XND,init 0.070577 g N.m-³ SALK,init 2.0999 mole.m-³ TSSinit 115.3775 g SS.m-³ Qi, init 18446 m3.d-1
Chapter V: Simulation study | 59
2.2 Initialization of BSM1m
2.2.1 Reactor parameters
The reactor parameters used in each bioreactor of BSM1m are summarized in Table 16. The
choice for the different parameter values are explained below the table.
Table 16: Reactor parameters varying among the different reactors
Symbol Reactor 1 (anoxic)
Reactor 2 (anoxic)
Reactor 3 (aerated)
Reactor 4 (aerated)
Reactor 5 (aerated)
Unit
Va 1000 1000 1333 1333 1333 m³ SCH4,sat
b 0 0 0 0 0 g COD.m-
3 SO,sat
a 8 8 8 8 8 g O2.m-3
kLaCH4c 0 0 189 189 1.05 x kLaO d-1
kLaOd 0 0 180 180 Variablee d-1
a Analogous to BSM1
b Open system, soluble methane concentration in equilibrium with the gas phase is set as zero (Chapter IV, section 5.2)
c kLaCH4 = 1.05. kLaO (Chapter IV, section 5.2)
d A kLaO value of 180 d
-1 allows autotrophic, heterotrophic and methanotrophic growth
e kLaO in reactor 5 is varied by the actuator related to dissolved oxygen control
2.2.2 Influent conditions
Analogous to ASM1m, the influent files of Vanhooren and Nguyen (1996) are used to describe
the conditions of the influent wastewater. The difference between the influent files are also not
relevant in the study of BSM1m, the dry weather file was used to set the influent conditions for
all simulations.
The influent methane concentration used in ASM1m (6.4 g COD.m-3) is also applied for BSM1m.
The influent methanotrophic biomass concentration in ASM1m was set as zero, but
methanotrophic growth cannot take place in the BSM1m plant if this is also applied for BSM1m.
Hence, an influent methanotrophic biomass concentration of 0.5 g COD.m-3 was used to
overcome this problem. This value ensures a good methanotrophic growth rate without
affecting other processes. Changing the influent methanotrophic biomass concentration from 0
to 0.5 g COD.m-3 affects the EQ, OCI, TIV and biomass concentration in all bioreactors not more
than 0.8%. This method was also applied by for the implementation of the Anaerobic Digester
Model no. 1 (ADM1) in Benchmark Simulation Model no. 2 (BSM2) (Rosén and Jeppsson 2006).
2.2.3 Initial conditions
The initial values for the state variables are determined using the procedure described in
Tchobanglous and Burton (1991). The steady state values for the biological reactors and
secondary settler are given in Table 17 and Table 18. For an influent flow rate of 18466 m3.d-1,
the SRT is equal to 9.07 days, the HRT is 15.61 hours.

60 | Chapter V: Simulation study
Table 17: Steady state conditions biological reactors BSM1m
Reactor 1 Reactor 2 Reactor 3 Reactor 4 Reactor 5 Unit
SI,as 30 30 30 30 30 g COD.m-³ SS,as 5.3078 2.8035 3.7367 2.9934 2.307 g COD.m-³ SCH4,as 2.0276 2.0272 0.26991 0.027897 0.00238557 g COD.m-³ XI,as 1138.4547 1138.4547 1138.4547 1138.4547 1138.4547 g COD.m-³ XS,as 85.2913 87.5674 57.1189 36.3304 23.8054 g COD.m-³ XBH,as 1724.6795 1717.8629 1728.2915 1733.3446 1732.8276 g COD.m-³ XBA,as 79.3641 79.0871 79.5666 80.1208 80.7922 g COD.m-³ XMOB,as 7.6114 7.5796 7.6442 7.624 7.5839 g COD.m-³
XP,as 622.4824 624.0004 626.0361 628.0779 630.1193 g COD.m-³
SO,as 0.0096883 9.1192e-05 0.65741 0.90229 2 g COD.m-³ SNO,as 3.0378 1 3.4755 6.6094 10.6792 g COD.m-³ SNH,as 14.2005 14.7964 11.6254 8.5268 5.01 g N.m-³ SND,as 1.2437 0.67094 1.0861 1.0637 0.94427 g N.m-³ XND,as 5.5197 6.0173 4.1605 2.8095 1.943 g N.m-³ SALK,as 5.543 5.7312 5.3278 4.8827 4.3408 mole.m-³ TSSas 2743.4125 2740.914 2727.834 2717.9642 2710.1873 g SS.m-³ Qas 57061.61 57061.61 57061.61 57061.61 57061.61 m3.d-1
Table 18: Steady state conditions secondary clarifier BSM1m (in g COD.m-³, except TSS in g SS.m-³)
Layer TSSsc SI,sc SS,sc SCH4,sc SO,sc SNO,sc SNH,sc SND,sc SALK,sc
1 11.5381 30 2.307 0.0023857 2 10.67 5.01 0.94427 4.3408 2 17.0466 30 2.307 0.0023857 2 10.67 5.01 0.94427 4.3408 3 27.8870 30 2.307 0.0023857 2 10.67 5.01 0.94427 4.3408 4 63.9814 30 2.307 0.0023857 2 10.67 5.01 0.94427 4.3408 5 312.8457 30 2.307 0.0023857 2 10.67 5.01 0.94427 4.3408 6 312.9069 30 2.307 0.0023857 2 10.67 5.01 0.94427 4.3408 7 312.9069 30 2.307 0.0023857 2 10.67 5.01 0.94427 4.3408 8 312.9069 30 2.307 0.0023857 2 10.67 5.01 0.94427 4.3408 9 312.9069 30 2.307 0.0023857 2 10.67 5.01 0.94427 4.3408 10 5295.5 30 2.307 0.0023857 2 10.67 5.01 0.94427 4.3408
The methanotrophic biomass concentration in all biological reactors is about 7.6 g COD.m-3.
Methanotrophic growth occurs in all reactors, but at a lower rate than autotophic and
heterotophic growth.
3. Behaviour of ASM1m
The behaviour of ASM1m is investigated in this section. First, the reference scenario is described.
Next, the effect of the reaction aeration and methane saturation concentration is investigated.

Chapter V: Simulation study | 61
3.1 Reference scenario
After setting the influent and initial conditions, simulations can be started. The dynamics of the
soluble methane concentration and methanotrophic biomass in the system from day 7 to day 14
for dry weather influent is shown in Figure 11.
a
b
Figure 11: Reference scenario ASM1m for dry weather influent
(a: Soluble methane concentration, b: Methanotrophic biomass concentration)
The soluble methane concentration in the system (average 0.08 g COD.m-3) is much lower than
the influent methane concentration (6.4 g COD.m-3) (Figure 11a). Methanotrophic growth
occurs, but the amount of methanotrophic biomass in the system is low compared to
autotrophic and methanotrophic biomass (Figure 11b). Methane emission, conversion and the
amount of methane removed with the effluent were included into the evaluation of the process
performance. The results for the reference scenario related to methane oxidation for dry
weather influent (day 7 to 14) is given in Table 19 and Figure 12.
Table 19: Performance reference scenario ASM1m related to methane oxidation
Average per volume influent (mg CO2 eq.L-1)
Average load (kg CO2 eq.d-1)
Fraction of the incoming
methane (%)
Methane conversion 1.4097 26.0043 3.52 Methane emission 38.0802 702.4407 95.17 Methane removed with effluent 0.52058 9.6027 1.30
Table 19 presents the average methane concentrations and loads in the influent and effluent,
and methane conversion and emissions are presented when the process performance is
evaluated. Also the percentage of methane conversion, methane emissions and methane leaving
with the effluent of the total methane in the influent are given. The dynamics of methane
conversion and emission can be seen in Figure 12. Regarding the process performance outputs,
the amount of methane converted by methanotrophs is limited. More than 95% of the incoming
methane is released to the environmental air, only 3.5% is converted.
7 8 9 10 11 12 13 140.05
0.06
0.07
0.08
0.09
0.1
0.11
time (d)
SC
H4 (
g C
OD
/ m
3)
7 8 9 10 11 12 13 140.0133
0.0134
0.0135
0.0136
0.0137
0.0138
0.0139
time (d)
XM
OB
(g C
OD
/ m
3)

62 | Chapter V: Simulation study
Figure 12: Performance reference scenario ASM1m related to methane oxidation
The methane effluent concentration is considered in the process performance because methane
can also be stripped to the environment after leaving the wastewater treatment process with
the effluent. Hence, total emissions from wastewater are the sum of methane released during
wastewater treatment and methane stripped from the effluent. Consequently, it is
recommended to rather assume methane conversion than methane emissions while evaluating
the performance of a WWTP. However, the methane concentration in the effluent is very low,
most of the emissions are released from the WWTP itself (Table 19 and Figure 12).
3.2 Scenario analysis
Two scenarios were performed with ASM1m. In the first scenario, the effect of aeration intensity
was investigated. A large part of methane that enters the system with the influent is stripped to
the gas phase. Methane stripping can be reduced by decreasing the aeration intensity. However,
very low kLa values delay aerobic growth processes because of oxygen limitations. The kLa was
varied between 0 and 50 d-1, higher values does not allow methanotrophic growth, because of
methane substrate limitation.
The effect of the methane saturation concentration was investigated in the second scenario. If
the system is aerated with a gas containing methane, the gradient between methane in the
liquid and gas phase is lowered. Hence, methane stripping will be delayed. In practice, this can
be obtained by using gas streams from other stages in the WWTP to aerate the system. Daelman
et al. (2012b) observed the methane concentration in all liquid and gas streams of all stages
from the WWTP at Kralingseveer (the Netherlands). The stream coming from the anaerobic
digester tank contained the highest methane concentration, but cannot supply oxygen to the
system. The gas from the digested sludge buffer tank had a methane concentration of 0.7% and
contains sufficient oxygen to aerate the activated sludge system (Daelman et al. 2012b). Using
the Henry constant, the soluble methane concentration in equilibrium with this gas phase
concentration is 0.69 g COD.m-3. The methane saturation concentration in equilibrium with the
gas phase was varied in a range between 0 and 5 g COD.m-3. The concentration of 5 g COD.m-3
7 8 9 10 11 12 13 140
2
4
6
8
10
12
time (days)
Meth
ane (
mg C
OD
/L)
Methane
CH4 emission
CH4 conversion
SCH4
effluent

Chapter V: Simulation study | 63
corresponds to the lower explosion limit of methane (5%). Oxygen containing gas streams with
methane concentrations higher than 5% methane would cause flammable gas mixtures. This
does not occur at WWTPs.
The examined scenarios are summarized in Table 20.
Table 20: Scenario analysis ASM1m
Description Parameter Range Step size
Scenario 1 Effect of the aeration intensity kLaO 0 - 50 d-1 0.1 Scenario 2 Effect of the use of a methane
containing gas to aerate the system SCH4,sat 0 - 5 g COD.m-3 0.01
3.2.1 Scenario 1: Effect of the reactor aeration
The effect of the aeration intensity or kLa value for oxygen (kLaO) on the biological processes in
steady state conditions was investigated. The kLao was varied between 0 and 50 d-1. Because the
kLa ratio between methane and oxygen (kLaCH4:kLaO) is equal to 1.05, the methane kLa varies
proportionally. The effect of the kLaO on the dissolved oxygen concentration is given in Figure 13.
The oxygen concentration in the system varies between 0 and 7.14 g (-COD).m-3.
Figure 13: Effect of kLaO on the dissolved oxygen concentration in ASM1m under steady state
The soluble methane concentration in the activated sludge system in function of the kLaO is
shown in Figure 14a. An strong decrease was observed. The effect of the kLaO on the
methanotrophic biomass in the system is illustrated in Figure 14b. Methanotrophic growth starts
at a kLaO of 2.8 d-1. Two optima in methanotrophic growth are observed, the according kLaO
values in these points are 2.9 and 5.7 d-1. The first optima is slightly higher than the second
(0.01%). At a kLaO value of 9 d-1, the methanotrophic biomass concentration has declined below
0.001 g COD.m-3 or 1% of the optimum value.
In Figure 14c, the methanotrophic biomass concentration is compared with the autotrophic and
heterotrophic biomass concentration. Even at the optimal methanotrophic growth, the fraction
0 5 10 15 20 25 30 35 40 45 500
1
2
3
4
5
6
7
8
Oxygen kLa (d-1)
Dis
solv
ed o
xygen c
oncentr
ation(g
CO
D/m
3)
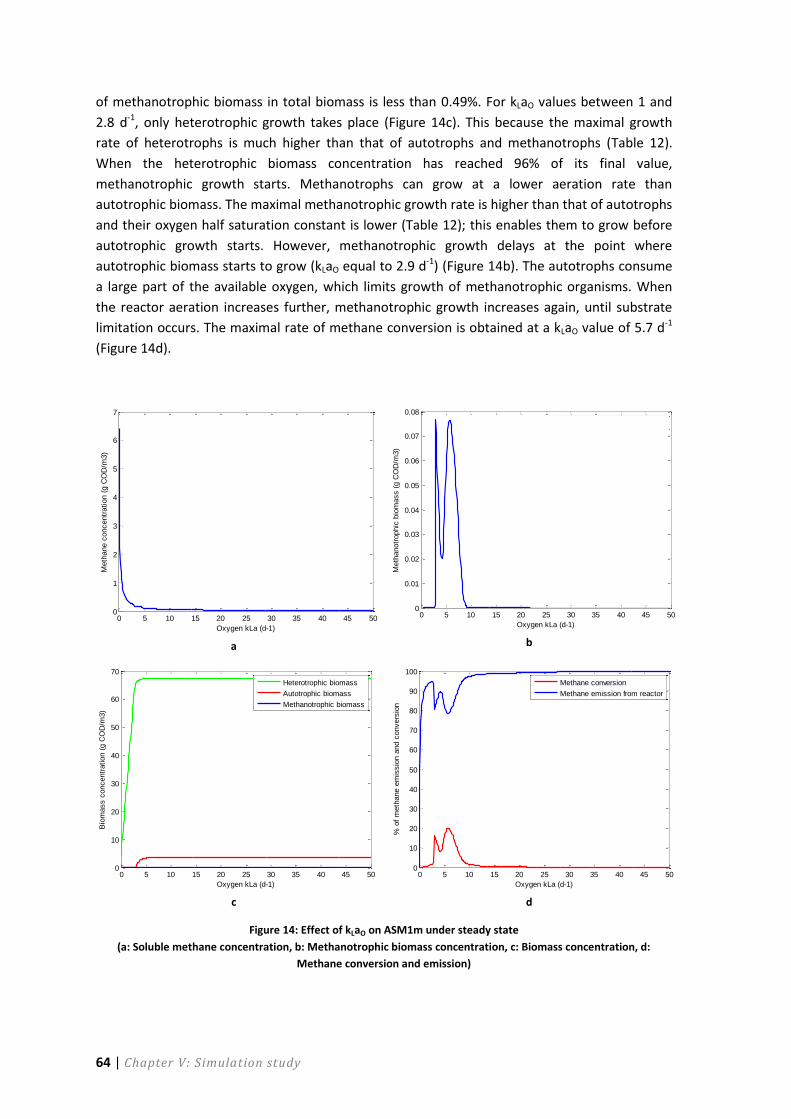
64 | Chapter V: Simulation study
of methanotrophic biomass in total biomass is less than 0.49%. For kLaO values between 1 and
2.8 d-1, only heterotrophic growth takes place (Figure 14c). This because the maximal growth
rate of heterotrophs is much higher than that of autotrophs and methanotrophs (Table 12).
When the heterotrophic biomass concentration has reached 96% of its final value,
methanotrophic growth starts. Methanotrophs can grow at a lower aeration rate than
autotrophic biomass. The maximal methanotrophic growth rate is higher than that of autotrophs
and their oxygen half saturation constant is lower (Table 12); this enables them to grow before
autotrophic growth starts. However, methanotrophic growth delays at the point where
autotrophic biomass starts to grow (kLaO equal to 2.9 d-1) (Figure 14b). The autotrophs consume
a large part of the available oxygen, which limits growth of methanotrophic organisms. When
the reactor aeration increases further, methanotrophic growth increases again, until substrate
limitation occurs. The maximal rate of methane conversion is obtained at a kLaO value of 5.7 d-1
(Figure 14d).
a
b
c
d
Figure 14: Effect of kLaO on ASM1m under steady state
(a: Soluble methane concentration, b: Methanotrophic biomass concentration, c: Biomass concentration, d:
Methane conversion and emission)
0 5 10 15 20 25 30 35 40 45 500
1
2
3
4
5
6
7
Oxygen kLa (d-1)
Meth
ane c
oncentr
ation (
g C
OD
/m3)
0 5 10 15 20 25 30 35 40 45 500
0.01
0.02
0.03
0.04
0.05
0.06
0.07
0.08
Oxygen kLa (d-1)
Meth
anotr
ophic
bio
mass (
g C
OD
/m3)
Methanotrophic biomass
0 5 10 15 20 25 30 35 40 45 500
10
20
30
40
50
60
70
Oxygen kLa (d-1)
Bio
mass c
oncentr
ation (
g C
OD
/m3)
Heterotrophic biomass
Autotrophic biomass
Methanotrophic biomass
0 5 10 15 20 25 30 35 40 45 500
10
20
30
40
50
60
70
80
90
100
Oxygen kLa (d-1)
% o
f m
eth
ane e
mis
sio
n a
nd c
onvers
ion
Methane conversion
Methane emission from reactor

Chapter V: Simulation study | 65
The effect on methane conversion and emission from the system is shown in Figure 14d.
Methane oxidation and emissions are expressed in percentage of total incoming methane. The
curve of methane conversion has more or less the same shape as the methanotrophic biomass
concentration curve. Though, the first optima in methane conversion (kLaO 3 d-1) was reached a
bit later than the first optimum of methanotrophic growth (kLaO 2.9 d-1) and the second optimum
for methane conversion is higher than the first (18%). Starting at a kLaO value of 0 d-1, emission of
methane increases strongly until methane conversion starts. After reaching the first optimum in
methane oxidation, the curve has approximately the opposite progress of the methane
conversion curve. The fraction of methane oxidized in de first and second optimum is 16.5 and
20.1% respectively, the corresponding fraction of methane emitted is 80.7 and 78.4%. The
fraction of methane that is not converted or emitted leaves the reactor with the effluent.
3.2.2 Scenario 2: Effect of the methane saturation concentration
The effect of the saturated methane concentration on the biological processes in the ASM1m
reactor under steady state conditions was investigated. The increase of the soluble methane
concentration in function of the methane saturation concentration is not linear, the graph is
shown in Appendix 6. The percentage of methane conversion in total incoming methane is given
in Figure 15a. Methane conversion increases linearly with the methane saturation concentration.
Methanotrophic biomass shows the same progress, the methane emission curve has the
opposite shape. The percentage of incoming methane converted in the reactor becomes higher
than 100% for a methane saturation concentration of 0.09 g COD.m-3 (Figure 15a). Hence,
methane from the aeration gas is transferred to the liquid phase and is converted.
a
b
Figure 15: Effect of the saturated methane concentration on ASM1m under steady state
(a: Methane conversion, b: Biomass concentration)
Heterotrophic growth increases with the methane saturation concentration, autotrophic growth
decreases (Figure 15b). At a saturation concentration of 2.5 g COD.m-3, the autotrophic biomass
concentration is 5% lower compared with a saturated methane concentration of 0 g COD.m-3.
0 0.5 1 1.5 2 2.5 3 3.5 4 4.5 50
1000
2000
3000
4000
5000
6000
Saturated methane concentration (g COD/m3)
% o
f m
eth
ane c
onvers
ion
0 0.5 1 1.5 2 2.5 3 3.5 4 4.5 50
10
20
30
40
50
60
70
80
Saturated methane concentration (g COD/m3)
Bio
mass c
oncentr
ation (
g C
OD
/m3)
Heterotrophic biomass
Autotrophic biomass
Methanotrophic biomass

66 | Chapter V: Simulation study
Scenario 3 suggests that methane emissions from activated sludge processes can be lowered by
increasing the saturated methane concentration. This can be realized in practice by using a
methane containing gas stream to aerate the reactor. ASM1m simulations suggest a quasi linear
relationship between the saturated methane concentration and methane conversion in the
reactor. If the gas stream from the digested sludge buffer tank at the WWTP at Kralingseveer
(the Netherlands) is used for aeration, the saturated methane concentration in the reactor is
about 0.69 g COD.m-3. This increases methane conversion in the reactor with more than a factor
100. All influent methane in biologically oxidized plus a large amount of methane in the aeration
gas.
4. Simulation of methane conversion in a wastewater treatment
plant with BSM1m
4.1 Reference scenario
After setting the influent and initial conditions, simulations can be performed. The soluble
methane concentration and methanotrophic biomass in the different compartments of the
WWTP from day 7 to day 14 for dry weather influent is shown in Figure 16 and Figure 17.
Regarding Figure 16, it can be seen that the soluble methane concentration in the anoxic
reactors (reactor 1 and 2) is high. From reactor 3 on, the methane concentration decreases with
almost a factor 10 in each reactor. Figure 17 shows that the methanotrophic biomass is more or
less the same in all biological reactors.
Figure 16: Soluble methane concentration (g COD.m
-3) in the different compartments of the WWTP
for dry weather influent (day 7 – 14)
6 8 10 12 141
2
3
4SCH4, reactor 1
6 8 10 12 141
1.5
2
2.5
3SCH4, reactor 2
6 8 10 12 140
0.2
0.4
0.6
0.8SCH4, reactor 3
6 8 10 12 140
0.05
0.1SCH4, reactor 4
6 8 10 12 140
0.005
0.01
0.015SCH4, reactor 5
6 8 10 12 141
2
3
4SCH4, input to AS
6 8 10 12 140
2
4
6
8x 10
-3 SCH4, underflow
6 8 10 12 140
0.005
0.01SCH4, effluent
6 8 10 12 145
6
7
8SCH4, influent

Chapter V: Simulation study | 67
Figure 17: Methanotrohic biomass concentration (g COD.m
-3) in the different compartments of the WWTP
for dry weather influent (day 7 – 14)
Methane emission, conversion and the amount of methane removed with the effluent were
included into the evaluation of the plant performance. The performance of the BSM1m
reference scenario is given in Table 21, Table 22 and Figure 18.
Table 21: Performance reference scenario related to methane oxidation
Average per volume influent (mg CO2 eq.L-1)
Average load (kg CO2 eq.d-1)
Fraction of the incoming
methane (%)
Methane conversion 14.7783 266.916 36.1647 Methane emission 26.0607 470.916 63.7743 Methane removed with effluent 0.024944 0.45051 0.061
Figure 18: Plant performance related to methane emissions for dry weather influent (day 7 – 14)
6 8 10 12 146.5
7
7.5
8
8.5XMOB, reactor 1
6 8 10 12 146.5
7
7.5
8
8.5XMOB, reactor 2
6 8 10 12 146.5
7
7.5
8
8.5XMOB, reactor 3
6 8 10 12 146.5
7
7.5
8
8.5XMOB, reactor 4
6 8 10 12 146.5
7
7.5
8
8.5XMOB, reactor 5
6 8 10 12 146
7
8
9XMOB, input to AS
6 8 10 12 1412
14
16
18
20XMOB, underflow
6 8 10 12 140.02
0.03
0.04
0.05XMOB, effluent
6 8 10 12 14-0.5
0
0.5
1
1.5XMOB, influent
7 8 9 10 11 12 13 140
1
2
3
4
5
6
time (days)
Meth
ane (
mg C
OD
/L)
Methane emission and conversion
CH4 emission
CH4 conversion
SCH4
effluent

68 | Chapter V: Simulation study
Table 22: Contribution of each reactor in total methane conversion or emission
Contribution of reactor in total methane conversion/ emission (%)
Reactor 1 Reactor 2 Reactor 3 Reactor 4 Reactor 5 Methane conversion 6.8857 0.0828 73.2986 17.3867 2.3463 Methane emission 0 0 87.5957 10.8958 1.5085
About 36% of methane that enters the reactor with the influent is converted by methanotrophic
activity (Figure 18). Methane oxidation occurs in the anoxic reactors, but at a low rate. Emission
of methane takes place in the three aerobic reactors. The first aerated reactor is responsible for
more than 73.3% of the total methane converted and 17.4% of the total methane emissions. A
considerable amount of methane is released and converted in reactor 4. The contribution of
reactor 5 in total methane emissions and conversion is much lower. A small amount of methane
leaves the WWTP with the effluent.
4.2 Scenario analysis
Three scenarios were investigated. Analogous to the scenario examined in ASM1m, the effect of
the kLa value for oxygen in the aerated reactors at steady state conditions was investigated in
scenario 1. Also the operational costs, violation of limits etc. were considered. The effect of the
influent methane concentration was investigated in scenario 2. The default value for the
methane influent concentration was based on the observation of Daelman et al. (2012b).
Though, it is presumed that this value can vary strongly among different WWTP and sewer
systems. It is suspected that higher methane concentrations would lead to higher methane
emissions, however the relation is not expected to be proportional. Scenario 3 investigates the
effect of the SRT at steady state conditions. This could be obtained by varying the recycle flow
rate. A high SRT increases the biomass in the system. Hence, it is expected that more methane
would be converted in case more methanotrophs are present. However, a higher SRT also
decreases the soluble methane concentration in the system.
The examined scenarios are summarized in Table 23.
Table 23: Scenario analysis BSM1m
Description Parameter Range Step size
Scenario 1 Effect of the reactor aeration kLaO 0 - 400 d-1 1 Scenario 2 Effect of the influent methane
concentration SCH4,infl 0 - 50 g COD.m-3 0.25
Scenario 3 Effect of the SRT QR 0 - 40000 m3.d-1 100
4.2.1 Scenario 1: Effect of reactor aeration in the aerobic reactors
The effect of the kLaO value on the biological processes occurring in the BSM1m plant under
steady state conditions was investigated. Because reactor 1 and 2 are anoxic, the kLaO was not
changed in these reactors. The kLaO in the last reactor was not changed, because the aeration
intensity in the last reactor was varied by the actuator to keep the dissolved oxygen at a
constant value. Hence, only the kLaO in reactor 3 and 4 were changed. The kLaO was varied from 0

Chapter V: Simulation study | 69
to 400 d-1 in both reactors. The dissolved oxygen concentration is all bioreactors in function of
the kLaO value is given in Appendix 6. The concentration ranged between 0 and 3.17 g (-COD).m-3
in reactor 3 and between 0 and 4.17 g (-COD).m-3 in reactor 4.
The effect on the methane concentration and biomass growth in each reactor is given in
Appendix 7. In the Benchmark plant, methanotrophs grow already at very low kLaO values. The
heterotrophic biomass concentration is very low if reactor 3 and 4 are not aerated, but
heterotrophic growth increases strongly when aeration starts. When the kLaO value changes
between 0 to 52 d-1, the methanotrophic growth decreases when the aeration rate increases.
The increase in heterotrophic growth delays methane oxidation, because a large part of the
available oxygen is consumed by the heterotrophs and the amount of substrate shrinks due to
methane stripping. When the heterotrophic biomass has reached 86% of its final value, more
oxygen becomes available and methanotrophic growth starts rising again. Autotrophic biomass
starts growing at a kLaO higher than 100 d-1, when the heterotrophic and methanotrophic
biomass concentration is ca. 95% of the optimum value. At a kLaO equal to 400 d-1, the average
fraction of heterotrophs, autotrophs and methanotrophs in total average biomass concentration
over the five bioreactors is 94.8%, 4.9% and 0.4% respectively. For this kLaO, autotrophic and
heterotrophic growth is more or less stable, the methanotrophic biomass is still decreasing with
the kLaO.
The total methane conversion and emission in the WWTP is given in Figure 19.
a
b
Figure 19: Effect of kLaO on BSM1m under steady state
(a: Methane conversion, b: Methane emission)
Methane oxidation represents an optimum at a kLaO value of 126 d-1. At this kLaO, 48.4% of the
total methane entering the reactor was converted in the WWTP, 51.5% was released from the
WWTP. Before this optimum, a local minimum occurs for a kLaO value of 51 d-1, where only 31.1%
of the methane was converted in the BSM1m plant. The effect of the kLaO on the percentage of
total methane conversion and emission in each bioreactor is also given in Appendix 7. At low
kLaO values for reactor 3 and 4, methane emissions and conversion predominantly take place in
the last reactor. At higher kLaO values, most of the methane is converted and emitted in reactor
3. The effect of the reactor aeration on the EQ and OCI are given in Figure 20.
0 50 100 150 200 250 300 350 40020
25
30
35
40
45
50
Oxygen kLa (d-1)
% m
eth
ane c
onvers
ion
Methane conversion in WWTP
0 50 100 150 200 250 300 350 40050
55
60
65
70
75
80
Oxygen kLa (d-1)
% m
eth
ane e
mis
sio
n
Methane emission from WWTP

70 | Chapter V: Simulation study
Figure 20: Effect of kLaO on the plant performance in BSM1m under steady state
The worst effluent quality was observed for a kLaO of 68 d-1. After this maximal value, the EQ
decreases strongly to a minimum at a kLaO value equal to 176 d-1. Beyond this kLaO, the EQI only
increases slowly. The OCI has two minima at a kLaO of 100 and 177 d-1. Between this two minima,
a strong increase in operational cost occur, with a maximal value for a kLaO of 138 d-1. Table 24
presents the kLaO values for which the effluent limit was not violated. The COD, TSS and BOD5
limit were not violated during the entire treatment process. The total nitrogen limit was not
violated for kLaO values between 163 and 187 d-1. The ammonium limit was violated for all kLaO
values.
Table 24: kLaO ranges for which the effluent limit was not violated during the entire treatment process
Effluent limita Unit kLaO range were the limit was not violated
Total nitrogen 18 g N.m-3 163 - 187 COD 100 g COD.m-3 0 - 400 Ammonium 4 g N.m-3 - TSS 30 g SS.m-3 0 - 400 BOD5 10 g BOD5.m
-3 0 - 400
The kLaO values for which the effluent limit was violated during maximum 5% of the operation
time are given in Table 25. For a kLaO value between 190 and 194 d-1, the effluent limits for
ammonium and total nitrogen were not violated during at least 95% of time. The COD, TSS and
BOD5 limit were not violated during the entire treatment process.
Table 25: kLaO ranges for which the effluent limit was violated during maximum 5% of the operation time
Effluent limit Unit kLaO range were the limit was violated less than 5% of the operation time
Total nitrogen 18 g N.m-3 163 - 193 COD 100 g COD.m-3 0 - 400 Ammonium 4 g N.m-3 190 - 400 TSS 30 g SS.m-3 0 - 400 BOD5 10 g BOD5.m
-3 0 - 400
0 50 100 150 200 250 300 350 4000.6
0.8
1
1.2
1.4
1.6
1.8
2
2.2
2.4
2.6x 10
4
Oxygen kLa (d-1)
Plant performance
Effluent quality (EQ)
Operational cost index (OCI)

Chapter V: Simulation study | 71
Regarding the entire plant performance, it is not recommended to operate at the optimal kLaO
(kLaO equal to 126 d-1). In this point, the OCI is close to its (local) maximal value and also the
effluent quality is almost 40% higher than its optimal value (Figure 20). Nitrogen and ammonium
effluent limits are both violated during more than 98% of the operation time. Operation costs
are high in this optimum, because the high methanotrophic growth rate increases costs for
sludge treatment. The EQI is steeply decreasing in at the optimal kLaO value. Autotrophic growth
is increasing strongly, but has not reached half of its final value. Hence, a large part of the
influent ammonia could not be converted to nitrate.
A kLaO value between 190 and 194 d-1 violates the effluent limits during less than 5 % of the time
(Table 25). At this aeration efficiency, autotrophic growth is ensured and the EQI and OCI are
close to their lowest value. Though, the amount of methane emitted is almost 30% higher than
at the observed optimum. Nevertheless, it is more recommended to operate at this aeration
rate. Finally, it is important that the main objective of a WWTP is pursued. However,
implementation of an index for greenhouse gas emissions can change operation choices.
4.2.2 Scenario 2: Effect of the influent methane concentration
The effect of the influent methane concentration on the BSM1m plant performance under
steady state conditions was investigated. The relation between the influent methane
concentration and the soluble methane concentration in the reactors of BSM1m is given in
Appendix 8. Heterotrophic and autotrophic biomass were reduced with about 0.5 and 7% in all
parts of the Benchmark plant when the influent methane concentration increased between 0
and 50 g COD.m-3. Like expected, methanotrophic growth and the absolute amount of methane
converted increases if more methane enters the WWTP. Nevertheless, this relation is not linear.
The percentage of methane conversion and emission in total incoming methane is given in
Figure 21. For concentrations lower than 17 g COD.m-3, the fraction of the incoming methane
that is converted during wastewater treatment decreases when the influent concentration rises
(Figure 21a). A minimum in methane conversion is reached for an influent concentration of 17 g
COD.m-3, where 34.9% of the methane entering the wastewater treatment is converted, the
other 65.1% is released from the WWTP. After this minimum, the fraction of methane converted
increases again. This can be explained as follows. The internal recycle stream provides a small
amount oxygen in the anoxic reactors. This oxygen availability allows methane oxidation,
however at a slow rate. At very low methane influent concentrations, a large part of methane
can already be converted in the first anoxic reactors. After passing these reactors, wastewater is
brought in contact with the aeration gas and methane stripping occurs. The higher the amount
of methane in the influent, the lower the fraction that can be oxidized in the anoxic reactor and
the more methane is tripped. At a soluble methane concentration of 17 g COD.m-3, the fraction
of methane converted in reactor 1 and 2 becomes negligible and the rate of methane conversion
in the aerobic reactors increases to higher levels compared to methane stripping. Hence, higher
influent concentration increases the fraction of methane converted.

72 | Chapter V: Simulation study
a
b
Figure 21: Effect of the influent methane concentration on BSM1m under steady state
(a: Methane conversion, b: Methane emission)
The effect of the methane concentration in the influent stream on the reactor performance is
also shown in Appendix 8. The TIV is not affected, the EQI is affected slightly (less than 0.1%).
The OCI increases for higher influent methane concentrations, because a higher methanotrophic
growth rate raises the costs for sludge treatment. The contribution of each bioreactor in total
methane emissions and conversion is also given in Appendix 8. For lower influent methane
concentrations, almost all methane conversion occurs in reactor 1 and 3. At higher
concentrations, the contribution of reactor 4 and 5 becomes more important.
It should be mentioned that the soluble methane concentration cannot be controlled in practice.
It is a disturbance variable. The influent methane concentration depends on processes taking
place in the sewer system prior to the WWTP itself (Guisasola et al. 2008). Fortunately,
heterotrophic and autotrophic growth are only slightly affected by the influent methane
concentration as well as the effluent quality. Hence, the influent methane concentration only
affects methane emissions and not the wastewater treatment process.
4.2.3 Scenario 3: Effect of sludge age
The effect of the SRT on the BSM1m plant at steady state conditions was investigated. The
recycle flow rate (QR) was varied between 0 and 40 000 m3.d-1. The relation between the SRT and
the recycle stream is given in Figure 22. The biomass SRT was considered, this is the SRT based
on the total amount of biomass present in the system. This parameter varied between 1.87 and
11.68 d. Figure 22 shows that the effect of the recycle flow rate diminishes for higher SRT values.
0 5 10 15 20 25 30 35 40 45 5034
35
36
37
38
39
40
41
42
43
SCH4infl (g COD/m3)
% m
eth
ane c
onvers
ion
0 5 10 15 20 25 30 35 40 45 5057
58
59
60
61
62
63
64
65
66
SCH4infl (g COD/m3)
% m
eth
ane e
mis
sio
n

Chapter V: Simulation study | 73
Figure 22: Relation between recycle flow rate and biomass SRT under steady state
All results are given in function of the biomass SRT. The heterotrophic, autotrophic and
methanotrophic biomass concentrations in function the SRT are given in Appendix 9. Obviously,
the biomass concentration in the entire system increases with the biomass SRT. More sludge is
recycled, thus more biomass enters the reactors. Heterotrophic growth increases when the
sludge age increases, but not linearly. The curve becomes flatter for higher SRT values.
Autotrophic growth starts at an SRT of about 5 days. Figure 23 represents the methanotrophic
biomass concentration more in detail. Methanotrophic growth occurs in two phases. Below a
biomass SRT of 6 days, methanotrophic growth increases steeply in all reactors. A small decrease
in methanotrophic biomass concentration was observed for a SRT between 6 and 6.3 days. This
is also the zone where the increase in autotrophic biomass growth delays. It is suspected that
oxygen limitation occurs. The dissolved oxygen concentration is very low (about 1.5 and 2.1 g (-
COD).m-3) in reactor 3 and 4 at a sludge age of 6.2 days. When the SRT rises further, the entire
biomass concentration rises, but at a lower gradient. The same pattern is observed in all
reactors.
0 0.5 1 1.5 2 2.5 3 3.5 4
x 104
0
2
4
6
8
10
12
Bio
mass S
RT
(d)
Recycle flow rate (m3/d)
Relation with biomass SRT

74 | Chapter V: Simulation study
Figure 23: Effect of biomass SRT (d) on the methanotrophic biomass concentration (g COD.m
-3) in bioreactors of
BSM1m plant under steady state
The effect of the SRT on methane conversion and emission in the entire BSM1m plant is given in
Figure 24. Methane conversion increases strongly for SRT values lower than 6 days. The
maximum methane oxidation rate was observed for an SRT of 6 days, where 39.5% of the
incoming methane is oxidized and 60.4% is released in the atmosphere. Behind this optimum,
methane conversion decreases, but the fraction of methane converted remains higher than
35.2%.
a
b
Figure 24: Effect of the biomass SRT on BSM1m under steady state
(a: Methane conversion, b: Methane emission)
The contribution of all bioreactors in total methane emission and conversion is given in
Appendix 9. At very low SRT values (< 2 days), the contribution of each reactor in total methane
conversion is between 11 and 27%. For SRTs between 2 and 6 days, methane oxidation
predominantly occurs in reactors 1, 3 and 4. For higher sludge ages, the contribution of reactor 1
and 4 are lower, more than 60% of the methane conversion takes place in reactor 3. Reactor 3 is
2 4 6 8 10 120
2
4
6
8
10XMOB reactor 1
2 4 6 8 10 120
2
4
6
8
10XMOB reactor 2
2 4 6 8 10 120
2
4
6
8
10XMOB reactor 3
2 4 6 8 10 120
2
4
6
8
10XMOB reactor 4
2 4 6 8 10 120
2
4
6
8
10XMOB reactor 5
2 3 4 5 6 7 8 9 10 11 1210
15
20
25
30
35
40
Biomass SRT (d)
% m
eth
ane c
onvers
ion
2 3 4 5 6 7 8 9 10 11 1260
65
70
75
80
85
90
Biomass SRT (d)
% m
eth
ane e
mis
sio
n

Chapter V: Simulation study | 75
responsible for more than 77% of the methane emissions for all sludge ages. The oxygen
concentration in each bioreactor of the BSM1m plant is also given in Appendix 9. The dissolved
oxygen concentration in first and second aerated reactors decreases with the sludge age. At an
SRT of 11 days, the oxygen concentration in reactor 3 and 4 are reduced to 0.5 and 0.7 g (-
COD.m-3), respectively.
The plant performance in function of the biomass SRT is given in Figure 25. At low sludge ages,
the EQI increases slightly with the biomass SRT. The biomass concentration rises in the system,
thus also the effluent concentration increases. The EQI reaches a maximum value for an SRT of
4.3 days. The effluent quality strongly improves between SRTs of 4.3 and 6 days. This is due to
the start of nitrification by autotrophs. For higher sludge ages, the effluent quality improves
further, but slowly. The OCI generally decreases when the SRT increases. The higher recycle flow
rate increases pumping costs, but costs for sludge treatment are lower. A higher sludge age
increases endogenous respiration of biomass, which reduces the amount of biomass created.
The local maximum can be explained by the short increase in methanotrophic biomass
concentration.
Figure 25: Effect of the biomass SRT on the reactor performance in BSM1m under steady state
The TIV is given schematically in Table 26. For all sludge ages between 1.9 and 11.7 days, the
COD, TSS and BOD5 effluent limits were not violated during the entire plant operation time. The
total nitrogen limit was not violated for SRT values higher than 8.8 days. For all applied sludge
ages, the effluent ammonium limit was violated at least one time during the treatment process.
Table 26: Biomass SRT ranges for which the effluent limit was not violated during the entire treatment process
Effluent limit Unit SRT range were the limit was not violated
Total nitrogen 18 g N.m-3 8.8 - 11.7 COD 100 g COD.m-3 1.9 - 11.7 Ammonium 4 g N.m-3 - TSS 30 g SS.m-3 1.9 - 11.7 BOD5 10 g BOD5.m
-3 1.9 - 11.7
It was not possible to keep the effluent concentration below all effluent limits during the entire
treatment process. In Table 27, the SRT ranges for which the effluent limit was violated during
2 3 4 5 6 7 8 9 10 11 120
0.5
1
1.5
2
2.5
3x 10
4
Biomass SRT (d)
Effluent quality (EQ)
Operational cost index (OCI)
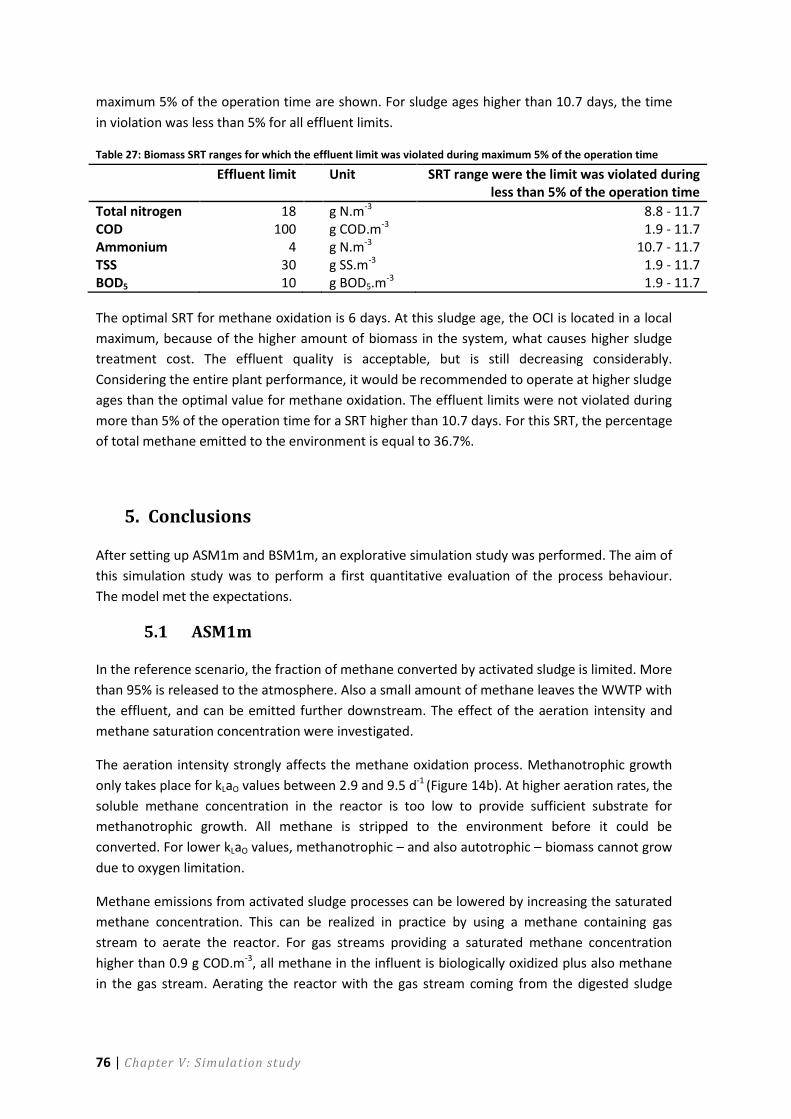
76 | Chapter V: Simulation study
maximum 5% of the operation time are shown. For sludge ages higher than 10.7 days, the time
in violation was less than 5% for all effluent limits.
Table 27: Biomass SRT ranges for which the effluent limit was violated during maximum 5% of the operation time
Effluent limit Unit SRT range were the limit was violated during less than 5% of the operation time
Total nitrogen 18 g N.m-3 8.8 - 11.7 COD 100 g COD.m-3 1.9 - 11.7 Ammonium 4 g N.m-3 10.7 - 11.7 TSS 30 g SS.m-3 1.9 - 11.7 BOD5 10 g BOD5.m
-3 1.9 - 11.7
The optimal SRT for methane oxidation is 6 days. At this sludge age, the OCI is located in a local
maximum, because of the higher amount of biomass in the system, what causes higher sludge
treatment cost. The effluent quality is acceptable, but is still decreasing considerably.
Considering the entire plant performance, it would be recommended to operate at higher sludge
ages than the optimal value for methane oxidation. The effluent limits were not violated during
more than 5% of the operation time for a SRT higher than 10.7 days. For this SRT, the percentage
of total methane emitted to the environment is equal to 36.7%.
5. Conclusions
After setting up ASM1m and BSM1m, an explorative simulation study was performed. The aim of
this simulation study was to perform a first quantitative evaluation of the process behaviour.
The model met the expectations.
5.1 ASM1m
In the reference scenario, the fraction of methane converted by activated sludge is limited. More
than 95% is released to the atmosphere. Also a small amount of methane leaves the WWTP with
the effluent, and can be emitted further downstream. The effect of the aeration intensity and
methane saturation concentration were investigated.
The aeration intensity strongly affects the methane oxidation process. Methanotrophic growth
only takes place for kLaO values between 2.9 and 9.5 d-1 (Figure 14b). At higher aeration rates, the
soluble methane concentration in the reactor is too low to provide sufficient substrate for
methanotrophic growth. All methane is stripped to the environment before it could be
converted. For lower kLaO values, methanotrophic – and also autotrophic – biomass cannot grow
due to oxygen limitation.
Methane emissions from activated sludge processes can be lowered by increasing the saturated
methane concentration. This can be realized in practice by using a methane containing gas
stream to aerate the reactor. For gas streams providing a saturated methane concentration
higher than 0.9 g COD.m-3, all methane in the influent is biologically oxidized plus also methane
in the gas stream. Aerating the reactor with the gas stream coming from the digested sludge

Chapter V: Simulation study | 77
buffer tank from the WWTP at Kralingseveer increases methane conversion with more than a
factor 100.
5.2 BSM1m
In the reference scenario of BSM1m, the average fraction of methane converted by activated
sludge is 36%; 64 % is released to the atmosphere and less than 0.1% leaves the WWTP with the
effluent. Interphase transport does not occur in the anoxic reactors, all incoming methane
remains in the liquid phase. Nevertheless, the internal and sludge recycle stream contain
dissolved oxygen that allow methane conversion in reactor 1 and 2. Methane is only emitted
from the aerated reactors. The largest part of the emissions and conversion occur in reactor 3. In
the second and last aerobic reactor, the soluble methane concentration is already reduced to
lower levels. Hence, also the methane conversion and stripping diminishes. In the simulation
study, the effect of the aeration intensity of the aerobic reactors, the influent methane
concentration and the sludge age were investigated.
The aeration in reactor 3 and 4 strongly affects methanotrophic growth and methane oxidation.
The choice of a good kLaO value in both reactors can almost double the amount of methane
converted in the BSM1m plant. The highest oxidation rate was observed for a kLaO value of
126 d-1. At this optimum almost half of the methane that entered the reactor could be
converted.
Higher influent methane concentrations increase methane conversion. The effect of the influent
concentration on the amount of methane converted in the Benchmark plant is not directly
proportional. However, the soluble methane concentration in the influent stream cannot be
controlled in practice, it is rather a disturbance variable.
The sludge age seems to be an important parameter in the control of methane emissions. The
optimal SRT for methane oxidation is 6 days. At this SRT, almost 40% of the incoming methane is
converted by activated sludge processes.
Regarding the three scenarios, the percentage of the incoming methane converted in the reactor
is about 45% near the optimal methane conversion rates. This is in the same order of magnitude
as the observations of Daelman et al. (2012b), where 80% of the incoming methane was
converted. Especially when it is considered that the activated sludge tank at Kralingseveer (the
Netherlands) is a plug flow reactor. The conversion rate in a plug flow reactor is always higher
than in a CSTR reactor. In BSM1m, five bioreactors are set in series. Hence, the model simulates
a very simplified layout of a plug flow reactor is. The anoxic part is split into two parts, the
aerobic part into three. A better approach of a plug flow reactor can be obtained if more
reactors are set in series. An activated sludge plug-flow model will probably result in higher
methane conversion rates.


Chapter IV: General conclusions and further perspectives | 79
Chapter VI: General conclusions and further perspectives The dynamics of methane emissions from wastewater treatment were investigated. Methane
emissions from wastewater treatment account for almost 1.6% of the global anthropogenic GHG
emissions. Considering the rising importance of the reduction of the global warming effect, it is
important to reduce methane emissions from wastewater treatment. Methane is formed in
anaerobic conditions before and during wastewater treatment. Methane can also be converted
in the activated sludge tank of the WWTP. Investigation of methane conversion in activated
sludge would is interesting in view of the abatement of GHG emissions from wastewater
treatment. However, research on this process is limited and process kinetics and affecting
parameters are not clearly understood. In this master thesis work, experiments were performed
to determine the process kinetics and to examine the effect of ammonium concentration and
temperature. A model was set up to include methane oxidation by activated sludge. It was
hypothesised that the process of methane conversion is affected by the SRT and aeration
intensity. This was investigated through a simulation study.
Experiments were conducted to measure the rate of methane oxidation in a lab-scale activated
sludge reactor. However, deficiencies related to gas phase analysis hindered the performance of
good experiments. A GC requiring small sample volumes or a well-mixed reactor with variable
volume is needed to comply with the requirements of a good experimental performance. In that
case, more samples can be taken, which allows investigation of the effects of temperature and
ammonium concentration. Because a suitable GC was not immediately available and the
experiments were time-consuming, it was decided to focus on modelling and simulation of
methane oxidation by activated sludge.
A model was set up to include methane oxidation by activated sludge, and termed ASM1m. This
model was subsequently incorporated into a complete WWTP model (BSM1m). The model
allows to consider methane emission and conversion in the evaluation of the process
performance. Simulation results for methane oxidation rates are in accordance with
observations at full scale WWTPs. Also the hypotheses on the influence of the aeration intensity
and SRT were confirmed in an explorative simulation study. Methane conversion took place at a
maximal rate for an oxygen kLa of 126 d-1 and an SRT of 6 days. Working at these conditions can
increase methane conversion with more than 50 and 70%, respectively. Furthermore, utilizing
methane containing gases to aerate the activated sludge reactor seems to be a promising
technique to reduce methane emissions from wastewater treatment.
A model that was adequate for studying methane emissions during wastewater treatment was
set up. However, it should not be seen as a final model, further improvement is recommended.
At this moment, the effect of ammonium is not well described in ASM1m and BSM1m. It is
suggested in literature that methane oxidation is inhibited in presence of ammonium
concentration, but recent research indicates that the effect is only limited. Experimental
research and full scale observations for methane oxidation rates and affecting parameters are
necessary to better describe the biological processes.

80 | Chapter IV: General conclusions and further perspectives
At this moment, evaluation of the process performance is based on the effluent quality and
operational costs. Considering the importance of the abatement of GHG emissions, it would be
useful to create a new dimension dealing with methane emissions from wastewater treatment.
Ideally, it would be interesting to set up a model that simulates methane, nitrous oxide and
carbon dioxide emissions by activated sludge processes. This would allow to consider all
anthropogenic GHG emissions from activated sludge processes. Carbon dioxide emissions
include indirect emissions by fossil fuel use. Nitrous oxide is released from biological nitrification
– denitrification processes. However, the mechanisms of nitrous oxide from wastewater
treatment are currently highly debated.
Overall, it can be concluded that a model was obtained that is capable of qualitatively and
quantitatively simulating methane conversion and emission from activated sludge processes.
The model is ready for validation with data from specific WWTPs.

References| 81
References Alex, J., Benedetti, L., Copp, J., Gernaey, K.V., Jeppsson, U., Nopens, I., Pons, M.N., Steyer, J.P. and Vanrolleghem, P. (2008) Benchmark simulation model no.1 (BSM1), Lund University.
APHA, A.P.H.A. (1995) Standard methods for examination of public water and wastewater, Washington, DC.
Arcangeli, J.P. and Arvin, E. (1999) Modelling the growth of a methanotrophic biofilm: Estimation of parameters and variability. Biodegradation 10(3), 177-191.
Banihani, Q., Sierra-Alvarez, R. and Field, J. (2009) Nitrate and nitrite inhibition of methanogenesis during denitrification in granular biofilms and digested domestic sludges. Biodegradation 20(6), 801-812.
Bédard, C. and Knowles, R. (1989) Physiology, biochemistry, and specific inhibitors of CH4, NH4+, and CO oxidation by methanotrophs and nitrifiers. Microbiological Reviews 53(1), 68-84.
Begonja, A. and Dubravka, H. (2001) Effect of growth conditions on the expression of soluble methane monooxygenase. Food Technology and Biotechnology 39 (1) 29 - 35.
Bender, M. and Conrad, R. (1995) Effect of CH4 concentrations and soil conditions on the induction of CH4 oxidation activity. Soil Biology and Biochemistry 27(12), 1517-1527.
CBS (2012) Bevolkingsteller, Centraal Bureau voor de Statistiek, the Netherlands.
CH2MHill (2008) Discussion paper for a wastewater treatment plant sector Greenhouse gas emissions Reporting protocol, p. 39, Oakland, CA.
Chan, A.S.K. and Parkin, T.B. (2000) Evaluation of potential inhibitors of methanogenesis and methane oxidation in a landfill cover soil. Soil Biology and Biochemistry 32(11–12), 1581-1590.
Clauwaert, P., Roels, J., Thoeye, C., Gueldre, G. and Van de Steene, B. (2010) Evaluatie van de milieuimpact van rioolafvalwaterzuivering met nutriëntverwijdering met behulp van levenscyclusanalyse (LCA). WT-afvalwater 10(3), 178-185.
Copp, J. (2002) The COST simulation benchmark. Description and simulator manual, Office for official publications of the European Communities, Luxembourg.
Czepiel, P.M., Crill, P.M. and Harriss, R.C. (1993) Methane emissions from municipal wastewater treatment processes. Environmental Science & Technology 27(12), 2472-2477.
Daelman, M.R.J., van Voorthuizen, E.M., van Dongen, L.G.J.M., Volcke, E.I.P. and van Loosdrecht, M.C.M. (2012a) Methane and nitrous oxide emissions from municipal wastewater treatment - results from a long-term study, 9th IWA Leading-Edge Conference on Water and Wastewater Technologies, 3 - 7 June 2012, Brisbane, Australia.

82 | References
Daelman, M.R.J., van Voorthuizen, E.M., van Dongen, U., Volcke, E.I.P. and van Loosdrecht, M.C.M. (2012b) Methane emission during municipal wastewater treatment. Water Research 46(11), 3657-3670.
Damgaard, L.R., Nielsen, L.P. and Revsbech, N.P. (2001) Methane microprofiles in a sewage biofilm determined with a microscale biosensor. Water Research 35(6), 1379-1386.
De Heyder, B., Vanrolleghem, P., Van Langenhove, H. and Verstraete, W. (1997) Kinetic characterization of mass transfer limited biodegradation of a low water soluble gas in batch experiments--necessity for multiresponse fitting. Biotechnol Bioeng 55(3), 511-519.
Dold, P.L., Ekama, G.A. and Marais, G.v.R. (1980) A general model for the activated sludge process. Progress in Water Technology 12, 47-77.
Doorn, M.R.J. and Liles, D. (1999) Global methane emissions, quantification of methane emissions and discussion of nitrous oxide, and ammonia emissions from septic tanks, latrines and stagnant open sewers in the world., Durham, North Carolina.
Dunfield, P., Knowles, R., Dumont, R. and Moore, T.R. (1993) Methane production and consumption in temperate and subarctic peat soils: response to temperature and pH. Soil biology & biochemistry 25(3), 321-326.
El-Fadel, M. and Massoud, M. (2001) Methane emissions from wastewater management. Environmental Pollution 114(2), 177-185.
EPA (2013) Inventory of U.S. greenhouse gas emissions and sinks 1990-2011, Environmental Protection Agency, Washington, United States.
Ettwig, K.F., Butler, M.K., Le Paslier, D., Pelletier, E., Mangenot, S., Kuypers, M.M.M., Schreiber, F., Dutilh, B.E., Zedelius, J., de Beer, D., Gloerich, J., Wessels, H.J.C.T., van Alen, T., Luesken, F., Wu, M.L., van de Pas-Schoonen, K.T., Op den Camp, H.J.M., Janssen-Megens, E.M., Francoijs, K.-J., Stunnenberg, H., Weissenbach, J., Jetten, M.S.M. and Strous, M. (2010) Nitrite-driven anaerobic methane oxidation by oxygenic bacteria. Nature 464(7288), 543-548.
Flores-Alsina, X., Corominas, L., Snip, L. and Vanrolleghem, P.A. (2011) Including greenhouse gas emissions during benchmarking of wastewater treatment plant control strategies. Water Research 45(16), 4700-4710.
Foley, J. and Lant, P. (2007) Fugitive greenhouse gas emissions from wastewater systems, Water Services Association of Australia, Melbourne, Vic., Australia.
Foley, J. and Lant, P.A. (2009) Direct methane and nitrous oxide emissions from full-scale wastewater treatment systems, Water Services Association of Australia, Australia.
Foley, J., Yuan, Z. and Lant, P. (2009) Dissolved methane in rising main sewer systems: field measurements and simple model development for estimating greenhouse gas emissions. Water science and technology : a journal of the International Association on Water Pollution Research 60(11), 2963-2971.

References| 83
Frijns, J. (2012) Towards a common carbon footprint assessment methodology for the water sector. Water and Environment Journal 26(1), 63-69.
Girard, M., Ramirez, A.A., Buelna, G. and Heitz, M. (2011) Biofiltration of methane at low concentrations representative of the piggery industry—Influence of the methane and nitrogen concentrations. Chemical Engineering Journal 168(1), 151-158.
Gray, N.D., Miskin, I.P., Kornilova, O., Curtis, T.P. and Head, I.M. (2002) Occurrence and activity of Archaea in aerated activated sludge wastewater treatment plants. Environmental Microbiology 4(3), 158-168.
Griggs, D.J. and Noguer, M. (2002) Climate change 2001: The scientific basis. Contribution of Working Group I to the Third Assessment Report of the Intergovernmental Panel on Climate Change. Weather 57(8), 267-269.
Guisasola, A., de Haas, D., Keller, J. and Yuan, Z. (2008) Methane formation in sewer systems. Water Research 42(6–7), 1421-1430.
Guisasola, A., Sharma, K.R., Keller, J. and Yuan, Z. (2009) Development of a model for assessing methane formation in rising main sewers. Water Research 43(11), 2874-2884.
Gustavsson, D.J.I. and Tumlin, S. (2012) Carbon footprints of scandinavian wastewater treatment plants.
Gutierrez, O., Park, D., Sharma, K.R. and Yuan, Z. (2009) Effects of long-term pH elevation on the sulfate-reducing and methanogenic activities of anaerobic sewer biofilms. Water Research 43(9), 2549-2557.
GWRC (2011) N2O and CH4 emission from wastewater collection and treatment systems Technical Report Global Water Research Coalition, London, United Kingdom.
Hakemian, A.S. and Rosenzweig, A.C. (2007) The Biochemistry of Methane Oxidation. Annual Review of Biochemistry 76(1), 223-241.
Hanson, R.S. (1980) Ecology and diversity of methylotrophic organisms, Academic Press, Inc., New York.
Hanson, R.S. and Hanson, T.E. (1996) Methanotrophic bacteria. Microbiological Reviews 60(2), 439-471.
Hartley, K. and Lant, P. (2006) Elimination non-renewable CO2 emissions from sewage treatment: An anaerobic migrating bed reactor pilot plant study. Wiley InterScience.
Hatamoto, M., Yamamoto, H., Kindaichi, T., Ozaki, N. and Ohashi, A. (2010) Biological oxidation of dissolved methane in effluents from anaerobic reactors using a down-flow hanging sponge reactor. Water Research 44(5), 1409-1418.
Henze, M., Gujer, W., Mino, T. and van Loosdrecht, M. (2000) Activated sludge models ASM1, ASM2, ASM2d and ASM3, IWA Publishing

84 | References
Henze, M., Van Loosdrecht, M., Ekama, G. and Brdjanovic, D. (2008) Biological wastewater treatment - Principles, modelling and design, IWA Publishing, London, UK.
Hettiarachchi, V.C., Hettiaratchi, P.J., Mehrotra, A.K. and Kumar, S. (2011) Field-scale operation of methane biofiltration systems to mitigate point source methane emissions. Environmental Pollution 159(6), 1715-1720.
Ho, A., Vlaeminck, S.E., Ettwig, K.F., Schneider, B., Frenzel, P. and Boon, N. (2013) Revisiting methanotrophic communities in sewage treatment plants. Applied and Environmental Microbiology.
Hofman, J., Hofman-Caris, R., Nederlof, M., Frijns, J. and Van Loosdrecht, M. (2011) Water and energy as inseparable twins for sustainable solutions. Water Science and technology.
House, S.J. and Evison, L.M. (1997) Hazards of Industrial Anaerobic Digester Effluent Discharges to Sewer. Water and Environment Journal 11(4), 282-288.
IPCC (2006) Guidelines for National Greenhouse Gas Inventories, p. 28, Hayama, Japan.
IPCC (2007) Climate change 2007: Synthesis report, Valencia, Spain.
Jeppsson, U. (1996) A general description of the activated sludge model no. 1. Lund institute of technology.
Jiang, G., Gutierrez, O., Sharma, K.R. and Yuan, Z. (2010) Effects of nitrite concentration and exposure time on sulfide and methane production in sewer systems. Water Research 44(14), 4241-4251.
Jiang, G., Gutierrez, O. and Yuan, Z. (2011) The strong biocidal effect of free nitrous acid on anaerobic sewer biofilms. Water Research 45(12), 3735-3743.
Jiang, G., Sharma, K.R. and Yuan, Z. (2013) Effects of nitrate dosing on methanogenic activity in a sulfide-producing sewer biofilm reactor. Water Res 47(5), 1783-1792.
Kampman, C., Hendrickx, T.L.G., Luesken, F.A., van Alen, T.A., Op den Camp, H.J.M., Jetten, M.S.M., Zeeman, G., Buisman, C.J.N. and Temmink, H. (2012) Enrichment of denitrifying methanotrophic bacteria for application after direct low-temperature anaerobic sewage treatment. Journal of Hazardous Materials 227–228(0), 164-171.
Kennelly, C., Clifford, E., Gerrity, S., Walsh, R., Rodgers, M. and Collins, G. (2012) A horizontal flow biofilm reactor (HFBR) technology for the removal of the methane and hydrogen sulphide at low temperatures. Water Science and technology.
Keppler, F., Boros, M., Frankenberg, C., Lelieveld, J., McLeod, A., Pirttilä, A.M., Röckmann, T. and Schnitzler, J. (2009) Methane formation in aerobic environments. Environmental Chemistry 6(6), 459-465.
Matsuura, N., Hatamoto, M., Sumino, H., Syutsubo, K., Yamaguchi, T. and Ohashi, A. (2010) Closed DHS system to prevent dissolved methane emissions as greenhouse gas in anaerobic

References| 85
wastewater treatment by its recovery and biological oxidation. Water Science and technology 61(9), 2407.
Melse, R.W. and van der Werf, A.W. (2005) Biofiltration for Mitigation of Methane Emission from Animal Husbandry. Environmental Science & Technology 39(14), 5460-5468.
Mohanakrishnan, J., Gutierrez, O., Meyer, R.L. and Yuan, Z. (2008) Nitrite effectively inhibits sulfide and methane production in a laboratory scale sewer reactor. Water Research 42(14), 3961-3971.
Nikiema, J., Brzezinski, R. and Heitz, M. (2007) Elimination of methane generated from landfills by biofiltration: a review. Reviews in Environmental Science and Bio/Technology 6(4), 261-284.
NIST (2011) Methane, National Institute of Standards and Technology, USA.
Nyerges, G. and Stein, L.Y. (2009) Ammonia cometabolism and product inhibition vary considerably among species of methanotrophic bacteria. FEMS Microbiology Letters 297(1), 131-136.
Park, J.R., Moon, S., Ahn, Y.M., Kim, J.Y. and Nam, K. (2005) Determination of Environmental Factors Influencing Methane Oxidation in a Sandy Landfill Cover Soil. Environmental Technology 26(1), 93-102.
Prior, S.D. and Dalton, H. (1985) Acetylene as a suicide substrate and active site probe for methane monooxygenase from Methylococcus capsulatus (Bath). FEMS Microbiology Letters 29(1–2), 105-109.
Reay, D., Smith, P. and van Amstel, A. (2010) Methane and Climate Change, London - Washington, DC.
Rosén, C. and Jeppsson, U. (2006) Aspects on ADM1 Implementation within the BSM2 Framework, Dept. of Industrial Electrical Engineering and Automation, Lund University.
Scheutz, C., Kjeldsen, P., Bogner, J.E., De Visscher, A., Gebert, J., Hilger, H.A., Huber-Humer, M. and Spokas, K. (2009) Microbial methane oxidation processes and technologies for mitigation of landfill gas emissions. Waste Management & Research 27(5), 409-455.
Schmidt, G.A., Ruedy, R.A., Miller, R.L. and Lacis, A.A. (2010) Attribution of the present-day total greenhouse effect. Journal of Geophysical Research: Atmospheres 115(D20), D20106.
Sly, L.I., Bryant, L.J., Cox, J.M. and Anderson, J.M. (1993) Development of a biofilter for the removal of methane from coal mine ventilation atmospheres. Applied Microbiology and Biotechnology 39(3), 400-404.
Solomon, S., D. Qin, M. Manning, Z. Chen, M. Marquis, K.B. and Averyt, M.T.a.H.L.M.e. (2007) Climate Change 2007: The Physical Science Basis. Milieu, K.N.M.I.M.v.I.e. (ed), IPCC, Cambridge University Press, Cambridge, United Kingdom and New York, NY, USA, .
Stephanopoulos, G.N., Aristidou, A.A. and Nielsen, J. (1998) Metabolic engineering - Principles and methodologies, Elsevier.

86 | References
STOWA (2010) Emissies van broeikasgassen van RWZI's, Amersfoort, the Netherlands.
STOWA (2012) Emissie broeikasgassen vauit RWZI's. Rapportnummer 2012 - 10.
Tchobanglous, G. and Burton, F.L. (1991) Metcalf & Eddy wastewater engineering - treatment, disposal and reuse. Series in Water resources and environmental engineering. McGraw-Hil.
UNFCCC (2012) United Nations Framework Convention on Climate Change.
van der Ha, D., Bundervoet, B., Verstraete, W. and Boon, N. (2011) A sustainable, carbon neutral methane oxidation by a partnership of methane oxidizing communities and microalgae. Water Research 45(9), 2845-2854.
van der Ha, D., Hoefman, S., Boeckx, P., Verstraete, W. and Boon, N. (2010) Copper enhances the activity and salt resistance of mixed methane-oxidizing communities. Applied Microbiology and Biotechnology 87(6), 2355-2363.
van der Lans, R. (ed) (2000) Advanced course on environmental biotechnology. Chapter 21: Gas-liquid interphase transport, Biotechnological sciences, Delft Leiden.
Vanhooren, H. and Nguyen, K. (1996) Development of a simulation protocol for evaluation of respirometry-based control strategies Report University of Ghent and University of Ottawa.
VROM (2008) CH4 en N2O uit afvalwater, The Hague, Netherlands.
Wang, J., Zhang, J., Xie, H., Qi, P., Ren, Y. and Hu, Z. (2011a) Methane emissions from a full-scale A/A/O wastewater treatment plant. Bioresource Technology 102(9), 5479-5485.
Wang, J.S., Hamburg, S.P., Pryor, D.E., Chandran, K. and Daigger, G.T. (2011b) Emissions credits: opportunity to promote integrated nitrogen management in the wastewater sector. Environ Sci Technol 45(15), 6239-6246.
Whittenbury, R., Phillips, K.C. and Wilkinson, J.F. (1970) Enrichment, Isolation and Some Properties of Methane-utilizing Bacteria. Journal of General Microbiology 61(2), 205-218.
Wise, D.L. and Houghton, G. (1966) The diffusion coefficients of ten slightly soluble gases in water at 10–60°C. Chemical Engineering Science 21(11), 999-1010.
Zhang, L., Keller, J. and Yuan, Z. (2009) Inhibition of sulfate-reducing and methanogenic activities of anaerobic sewer biofilms by ferric iron dosing. Water Research 43(17), 4123-4132.

Appendices | 87
Appendices
Appendix 1: Assumptions and simplifications in ASM1
Various assumptions and simplifications are made to set up the ASM1 matrix. All assumptions and
simplifications described in Henze et al. (2000) are summarized.
State variables, parameters and factors
- All readily biodegradable substrate is treated as if it was soluble (SS) and all slowly
biodegradable substrate is treated as if it was particulate (XS). However, some soluble
biodegradable organic matter will be slowly biodegradable.
- Non-biodegradable particulate nitrogen is that associated with the unbiodegradable
particulate COD (XI). Non-biodegradable soluble nitrogen is considered as negligibly small
and is not included in the model.
- No nitrite is considered in the model, although it is an intermediate product formed during
denitrification. Nitrate is assumed as the only oxidized form of nitrogen in the system.
- Both reduction factors for anoxic conditions (ηy,h and ηy,g) are fixed and constant for a given
wastewater.
- Changes in the nature of organic matter within a given fraction are not considered.
- The heterotrophic biomass (XBH) is considered homogenous and does not undergo changes in
species diversity with time. Hence, the kinetic parameters can be considered constant.
Biomass growth
‐ Removal of readily biodegradable substrate is considered to be proportional to growth.
Storage of soluble substrate is assumed negligible.
‐ Readily biodegradable substrate is considered as the only substrate for growth of
heterotrophic biomass. Slowly biodegradable substrate can only be used for bacterial growth
after conversion into readily biodegradable substrate, this process is called hydrolysis.
‐ Heterotrophic biomass is generated by growth on readily biodegradable substrate and
happens in aerobic and anoxic conditions. However, the specific growth rate is lower in the
latter case. This phenomena can be explained in two ways: (1) only a fraction of the
heterotrophic biomass can make use of the substrate in anoxic conditions or (2) all
heterotrophic biomass is able to function with nitrate as terminal electron acceptor, but
growth occurs at a lower rate. It is difficult to differentiate between these two possibilities.
Both have the same result and the easiest way to implement the lower rate of substrate
removal in anoxic conditions is to use a reduction factor ηy,g. Growth is assumed to stop
under anaerobic conditions.
‐ The conversion of ammonium to nitrate by autotrophic nitrifying bacteria is considered as a
single step process which requires oxygen.

88 | Appendices
‐ No consideration has been given to the effect of limitations of nitrogen, phosphor and other
inorganic nutrients on the removal of organic matter and on biomass growth.
‐ The coefficients for nitrification are assumed to be constant and to incorporate any inhibitory
effects that other waste constituents are likely to have on them.
‐ The influence of the sludge retention time or SRT on the observed growth yield of
heterotrophs is not included in the model. However, it is established that this yield decreases
if the SRT increases.
Biomass decay
‐ Decay of heterotrophic biomass is approached by the death-regeneration model of Dold et
al. (1980). Decay of autotrophic biomass (XBA) is handled in the same way.
‐ Decay is assumed to be a process transforming active biomass into slowly biodegradable
material and inert particulates (XP).
‐ Biomass decay is not dependent on the electron acceptor present. Only the conversion of
the formed slowly biodegradable compounds into substrate available for growth depends
upon the electron acceptor present.
‐ No oxygen is required for biomass decay, oxygen is only necessary for regrowth on the
released substrates.
‐ The decay coefficients (bH and bA) used in ASM1 are larger than the more usually
encountered constants, because of the substrate recycle processes.
In the more usual processes, the loss of one unit of cell mass results in the utilization of 1
unit of oxygen minus the COD of inert particulates formed. In this model, the decay of 1 unit
of COD cell mass results ultimately in the formation of 1 unit of readily biodegradable COD
minus the fraction of inert particulates. If growth on this readily biodegradable COD takes
place, only a fraction of the oxygen will be required because a large part of the COD will be
converted in biomass. This formed cell mass must in turn undergo decay to consume the
considered unit of oxygen. Consequently, the decay coefficient need to be higher to obtain
the same amount of oxygen required per unit of time due to decay. This results in an
increased turnover rate of cell mass and an increased actual biomass growth rate.
Hydrolysis
‐ Hydrolysis of slowly biodegradable substrate into readily biodegradable substrate is assumed
to involve no energy utilization. Consequently, no electron acceptor is used for this process.
‐ The specific rate of hydrolysis of slowly biodegradable material is considerably lower than
the specific rate of the utilization of readily biodegradable material by biomass. Hence,
hydrolysis is considered as the rate limiting step for biomass growth if only slowly
biodegradable material is present.
‐ The rate of hydrolysis of both entrapped organics and entrapped organic nitrogen is lower
under anoxic conditions compared to aerobic conditions and will stop in anaerobic
conditions. The lower rate of hydrolysis in case only nitrate is available as terminal electron
acceptor is implemented in the model by using a reduction factor ηy,h.
Appendices | 89
‐ For hydrolysis of entrapped organic nitrogen, it is assumed that organic nitrogen is equally
distributed throughout the slowly biodegradable substrate, hence the rate of this process is
proportional to the rate of hydrolysis of entrapped organics. The two hydrolysis processes
are considered to be coupled and to occur simultaneously with equal rates.
General assumptions and simplifications
- The influence of the pH on the occurring processes is not considered in the model.
Consequently, the pH is assumed to be constant and near neutrality. An alkalinity term (SALK)
is added to check to be sure that the assumption not violated. If this term is too low, the pH
can become unstable and affect the considered processes.
- Also the temperature is assumed to be constant. Parameters like μH and bH need to be
chosen for a certain temperature.
- Effects of substrate concentration gradients, reactor configuration, etc. on sludge
settleability are not considered.

90 | Appendices
Appendix 2: Constraints ASM1
The constraints upon the application of the model as described in Henze et al. (2000) are all related
to sludge settling. The model does not include sludge settling, hence problems with sludge
settleablility are not considered. The user must ensure that all conditions employed will result in a
sludge with good settling properties:
‐ The net growth rate or SRT of the biomass must be within the range that allows a
flocculent biomass to develop (ca. 3-30 days).
‐ The concentration of solids entering the final settler should be adequate to ensure
proper sludge settling. As a rough guideline, the activated sludge concentration
should be in a range of 750 to 7500 g COD.m-3.
‐ The unaerated fraction of the reactor volume should not exceed 50%, this will
deteriorate sludge settling characteristics.
‐ The mixing intensity in an aerated reactor may not exceed 240 s-1, because excessive
floc shear is likely to cause poor sludge settling.
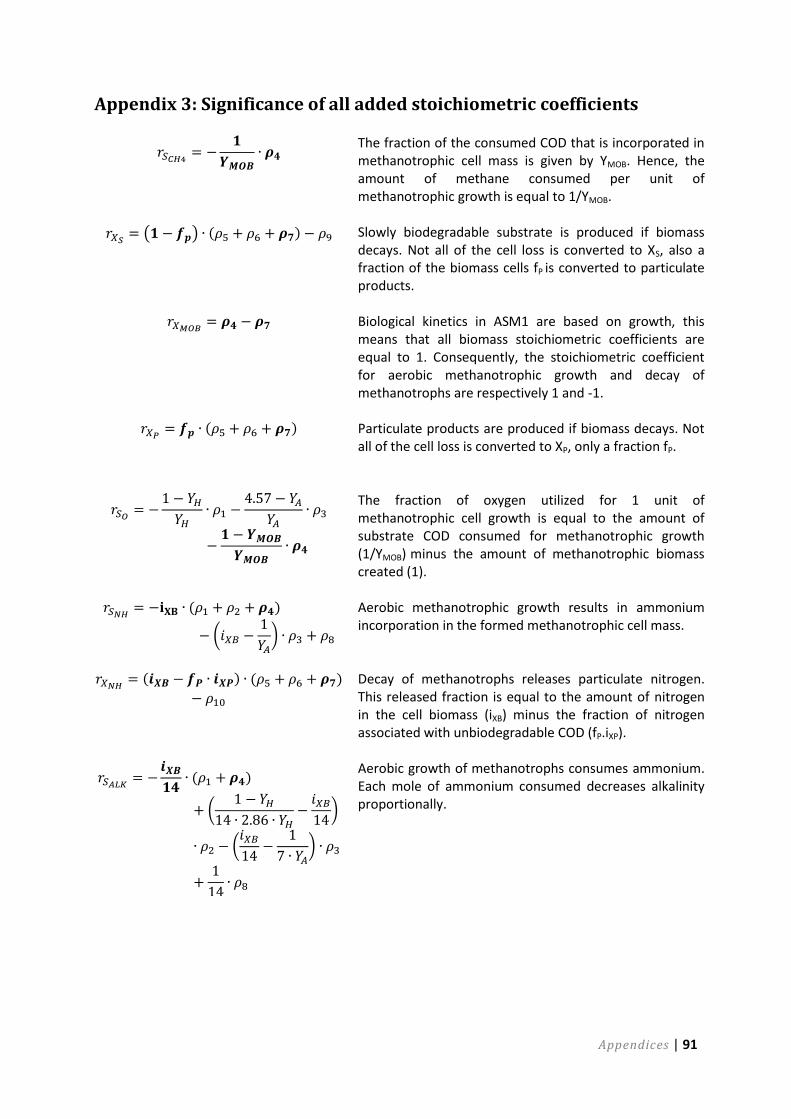
Appendices | 91
Appendix 3: Significance of all added stoichiometric coefficients
The fraction of the consumed COD that is incorporated in methanotrophic cell mass is given by YMOB. Hence, the amount of methane consumed per unit of methanotrophic growth is equal to 1/YMOB.
( ) ( )
Slowly biodegradable substrate is produced if biomass decays. Not all of the cell loss is converted to XS, also a fraction of the biomass cells fP is converted to particulate products.
Biological kinetics in ASM1 are based on growth, this means that all biomass stoichiometric coefficients are equal to 1. Consequently, the stoichiometric coefficient for aerobic methanotrophic growth and decay of methanotrophs are respectively 1 and -1.
( ) Particulate products are produced if biomass decays. Not all of the cell loss is converted to XP, only a fraction fP.
The fraction of oxygen utilized for 1 unit of methanotrophic cell growth is equal to the amount of substrate COD consumed for methanotrophic growth (1/YMOB) minus the amount of methanotrophic biomass created (1).
( )
(
)
Aerobic methanotrophic growth results in ammonium incorporation in the formed methanotrophic cell mass.
( ) ( )
Decay of methanotrophs releases particulate nitrogen. This released fraction is equal to the amount of nitrogen in the cell biomass (iXB) minus the fraction of nitrogen associated with unbiodegradable COD (fP.iXP).
( )
(
)
(
)
Aerobic growth of methanotrophs consumes ammonium. Each mole of ammonium consumed decreases alkalinity proportionally.

92 | Appendices
Appendix 4: Effluent quality limits
Table 28: Effluent quality limits activated sludge models
Variable Effluent quality limitsa Unit
Ntot,e 18 g N.m-3 CODe 100 g COD.m-3 SNHe 4 g N.m-3 TSSe 30 g SS.m-3 BOD5,e 10 g BOD.m-3 a Effluent limits copied from the original BSM1 (Alex et al. 2008)

Appendix 5: BSM1m in Matlab - Simulink
Figure 26: BSM1m –Matlab/Simulink

94 | Appendices
Appendix 6: Effect of the methane saturation concentration in ASM1m
Figure 27: Effect of the saturatated methane concentration on the soluble methane concentration in the reactor under
steady state conditions
0 0.5 1 1.5 2 2.5 3 3.5 4 4.5 50.08
0.09
0.1
0.11
0.12
0.13
0.14
0.15
0.16
0.17
0.18
Saturated methane concentration (g COD/m3)
Meth
ane c
oncentr
ation (
g C
OD
/m3)

Appendices | 95
Appendix 7: Effect of reactor aeration in the BSM1m plant
Figure 28: Effect of kLaO on the dissolved oxygen concentration in all bioreactors of BSM1m plant under steady state
Figure 29: Effect of kLaO on the methane concentration in all bioreactors of BSM1m plant under steady state
0 100 200 300 4000
0.01
0.02
0.03
0.04
0.05SO reactor 1 (g COD/m3)
0 100 200 300 4000
0.2
0.4
0.6
0.8
1
1.2x 10
-3 SO reactor 2 (g COD/m3)
0 100 200 300 4000
0.5
1
1.5
2
2.5
3
3.5SO reactor 3 (g COD/m3)
0 100 200 300 4000
1
2
3
4
5S0 reactor 4 (g COD/m3)
0 100 200 300 4002
2
2
2
2
2
S0 reactor 5 (g COD/m3)
0 100 200 300 4000.5
1
1.5
2
2.5
3SCH4 reactor 1 (g COD/m3)
0 100 200 300 4000.5
1
1.5
2
2.5
3SCH4 reactor 2 (g COD/m3)
0 100 200 300 4000
0.2
0.4
0.6
0.8
1
1.2
1.4SCH4 reactor 3 (g COD/m3)
0 100 200 300 4000
0.2
0.4
0.6
0.8
1
1.2
1.4SCH4 reactor 4 (g COD/m3)
0 100 200 300 4000
0.05
0.1
0.15
0.2
0.25
0.3
0.35SCH4 reactor 5 (g COD/m3)
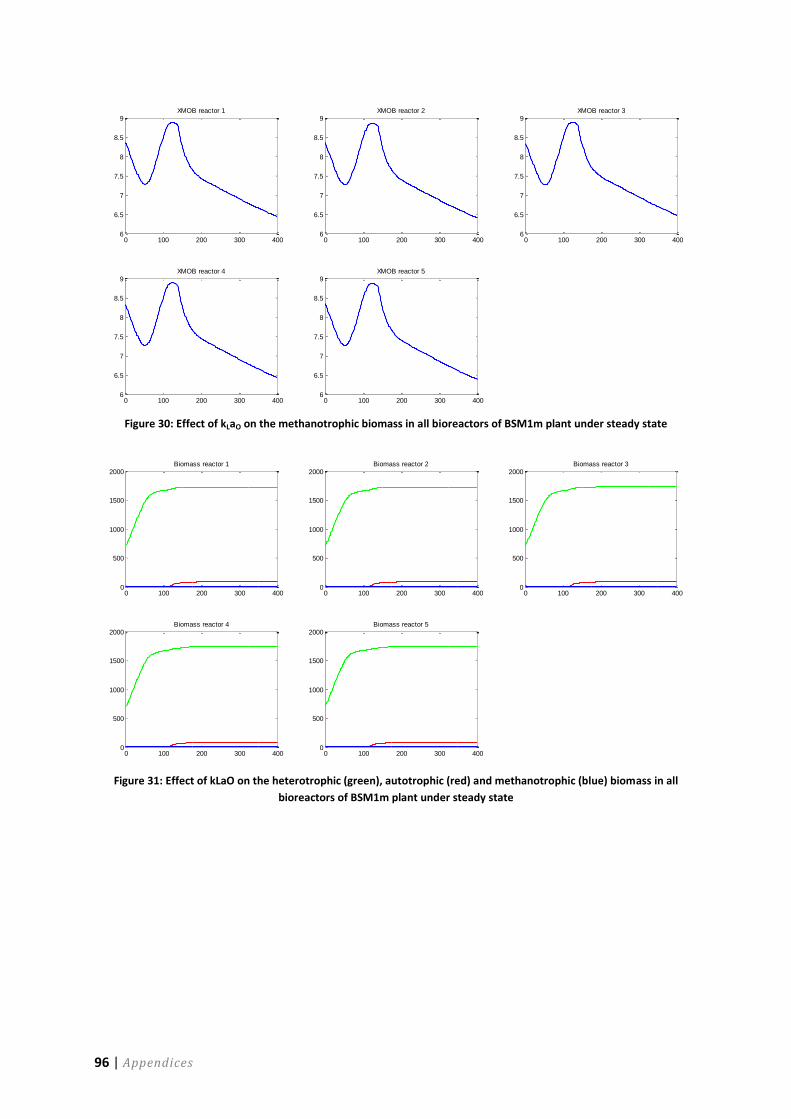
96 | Appendices
Figure 30: Effect of kLaO on the methanotrophic biomass in all bioreactors of BSM1m plant under steady state
Figure 31: Effect of kLaO on the heterotrophic (green), autotrophic (red) and methanotrophic (blue) biomass in all
bioreactors of BSM1m plant under steady state
0 100 200 300 4006
6.5
7
7.5
8
8.5
9XMOB reactor 1
0 100 200 300 4006
6.5
7
7.5
8
8.5
9XMOB reactor 2
0 100 200 300 4006
6.5
7
7.5
8
8.5
9XMOB reactor 3
0 100 200 300 4006
6.5
7
7.5
8
8.5
9XMOB reactor 4
0 100 200 300 4006
6.5
7
7.5
8
8.5
9XMOB reactor 5
0 100 200 300 4000
500
1000
1500
2000Biomass reactor 1
0 100 200 300 4000
500
1000
1500
2000Biomass reactor 2
0 100 200 300 4000
500
1000
1500
2000Biomass reactor 3
0 100 200 300 4000
500
1000
1500
2000Biomass reactor 4
0 100 200 300 4000
500
1000
1500
2000Biomass reactor 5

Appendices | 97
Figure 32: The percentage of total methane conversion (blue line) and emission (red line) in each bioreactor at different
values of kLaO under steady state
0 100 200 300 4000
5
10
15
20Emission and conversion reactor 1
0 100 200 300 4000
0.1
0.2
0.3
0.4
0.5
0.6
0.7Emission and conversion reactor 2
0 100 200 300 4000
20
40
60
80
100Emission and conversion reactorr 3
0 100 200 300 4000
5
10
15
20
25
30
35Emission and conversion reactor 4
0 100 200 300 4000
20
40
60
80
100Emission and conversion reactor 5

98 | Appendices
Appendix 8: Effect of methane influent concentration in the BSM1m
plant
Figure 33: Plant performance for different methane influent concentrations under steady state
Table 29: SCH4, infl ranges for which the effluent limit was not violated during the entire treatment process
Effluent limit Unit SCH4, infl range were the limit was not violated
Total nitrogen 18 g N.m-3 0 - 400 COD 100 g COD.m-3 0 - 400 Ammonium 4 g N.m-3 - TSS 30 g SS.m-3 0 - 400 BOD5 10 g BOD5.m
-3 0 - 400
Figure 34: Percentage of total methane conversion (blue line) and emission (red line) in each bioreactor at different
methane influent concentrations under steady state
0 5 10 15 20 25 30 35 40 45 500.6
0.8
1
1.2
1.4
1.6
1.8
2x 10
4
SCH4infl (g COD/m3)
Effluent quality (EQ)
Operational cost index (OCI)
0 10 20 30 40 500
5
10
15
20Emission and conversion reactor 1
0 10 20 30 40 500
0.05
0.1
0.15
0.2Emission and conversion reactor 2
0 10 20 30 40 5065
70
75
80
85
90
95Emission and conversion reactorr 3
0 10 20 30 40 505
10
15
20
25
30Emission and conversion reactor 4
0 10 20 30 40 500
0.5
1
1.5
2
2.5Emission and conversion reactor 5

Appendices | 99
Appendix 9: Effect of the biomass SRT in the BSM1m plant
Figure 35: Effect of SRT on the heterotrophic (green), autotrophic (red) and methanotrophic (blue) biomass in bioreactors
of BSM1m under steady state
Figure 36: Percentage of total methane conversion (blue line) and emission (red line) in each bioreactor for different
biomass SRTs under steady state
2 4 6 8 10 120
500
1000
1500
2000Biomass reactor 1
2 4 6 8 10 120
500
1000
1500
2000Biomass reactor 2
2 4 6 8 10 120
500
1000
1500
2000Biomass reactor 3
2 4 6 8 10 120
500
1000
1500
2000Biomass reactor 4
2 4 6 8 10 120
500
1000
1500
2000Biomass reactor 5
2 4 6 8 10 120
5
10
15
20
25
30Emission and conversion reactor 1
2 4 6 8 10 120
5
10
15
20
25
30Emission and conversion reactor 2
2 4 6 8 10 1220
40
60
80
100Emission and conversion reactorr 3
2 4 6 8 10 125
10
15
20
25Emission and conversion reactor 4
2 4 6 8 10 120
5
10
15
20Emission and conversion reactor 5

100 | Appendices
Figure 37: Dissolved oxygen concentration in each bioreactor of BSM1m for different biomass SRTs under steady state
2 4 6 8 10 120
0.5
1
1.5
2
2.5
3SO reactor 1 (g COD/m3)
2 4 6 8 10 120
0.5
1
1.5
2SO reactor 2 (g COD/m3)
2 4 6 8 10 120
1
2
3
4
5
6SO reactor 3 (g COD/m3)
2 4 6 8 10 120
2
4
6
8S0 reactor 4 (g COD/m3)
2 4 6 8 10 121
2
3
4
5S0 reactor 5 (g COD/m3)