dynamics of the brazil-malvinas confluence: energy conversions
TRANSCRIPT

Journal of Physics Conference Series
OPEN ACCESS
Dynamics of the Brazil-Malvinas ConfluenceEnergy ConversionsTo cite this article C P F Francisco et al 2011 J Phys Conf Ser 285 012045
View the article online for updates and enhancements
You may also likeA hybrid technique for intelligent banksecurity system based on blink gesturerecognitionRaed Awadh Bakunah and SaeedMohammed Baneamoon
-
Confluence singularities of therenormalised coupling constant at D=3C Bagnuls and C Bervillier
-
Application of Mathematical Model inWater Conservancy Project at ConfluenceSectionChun-yan Deng Jun-qiang Xia Hua Ge etal
-
Recent citationsEnergetics of eddy-mean flow interactionsin the Brazil current between 20degS and36degSF C Magalhatildees et al
-
Uma Revisatildeo dos Processos de InteraccedilatildeoOceano-Atmosfera em Regiotildees de IntensoGradiente Termal do Oceano Atlacircntico SulBaseada em Dados ObservacionaisLuciano Ponzi Pezzi et al
-
The roles of vertical shear and topographyon the eddy formation near the site oforigin of the Brazil CurrentRG Soutelino et al
-
This content was downloaded from IP address 1112427471 on 22012022 at 0656
Dynamics of the Brazil-Malvinas Confluence Energy
Conversions
C P F Francisco1 I C A da Silveira2 and E J D Campos2
1Universidade Federal do ABC Avenida dos Estados 5001 Santo Andre Sao Paulo Brazil2Universidade de Sao Paulo Praca do Oceanografico 191 Sao Paulo Sao Paulo Brazil
E-mail cayofranciscoufabcedubr
Abstract In this work we investigated the mesoscale dynamics of the Brazil-MalvinasConfluence (BMC) region Particularly we were interested in the role of geophysical instabilityin the formation and development of the mesoscale features commonly observed in this region
We dynamically analyzed the results of numerical simulations of the BMC region conductedwith lsquoHybrid Coordinate Ocean Modelrdquo (HYCOM) We quantified the effect of barotropic andbaroclinic energy conversions in the modeled flow and showed the dominance of the latter inthe region
1 Introduction
The confluence of the warm waters of the Brazil Current (BC) flowing S-SW with the cold watersof the Malvinas Current (MC) flowing N-NE generates a region of strong potential vorticitygradient around 36S in the Atlantic Basin as can be seen from AVHRR images obtainedby [1] containing meanders eddies and filaments known as the Brazil-Malvinas Confluence(BMC)
Figure 1 shows a series of sea surface temperature images from the BMC region obtained by[3] We can clearly observe the signature of the confluence region in the thermal front as alsothe formation of coherent structures in the flow
The processes that lead to the formation of the retroflection and eddy-shedding patternsare akin to occur via geophysical instability processes Moreover analytical contour dynamicsmodels constructed by [2] allowing only the baroclinic instability mechanism exhibited thedevelopment of both retroflection pattern and baroclinic vortical dipole formation
These authors verified that dipoles were pinched off from either the retroflection lobe (iethe primary crest of the wave train) or the primary trough when the baroclinically unstablecurrent system was perturbed Particularly their results showed that dipole formation occursat the vicinities of the continental boundary when unstable waves propagate phase westward
The processes responsible for the formation and development of these instabilities althoughare not yet fully understood
2 Model formulation
As the theoretical results obtained by [2] pointed that the baroclinic instability effect could bethe main source of meander growing in the BMC region we performed in this study an energyconversion analysis of the flow using the numerical simulation outputs of HYCOM Our aim was
Dynamic Days South America 2010 IOP PublishingJournal of Physics Conference Series 285 (2011) 012045 doi1010881742-65962851012045
Published under licence by IOP Publishing Ltd 1
Figure 1 Images obtained by [3] showing weekly sea surface temperature averages between 09-06-2002 and 12-10-2002 The red circle identifies a warm ring that was generated and absorbedby the current
to account for the effects of both baroclinic and barotropic instability not possible in [2] moreidealized study
The implementation of HYCOM for the BMC region followed [4] First a 21-layers coarserresolution (13-degree) version for the entire Atlantic Basin from 65S to 60N was forcedwith monthly mean winds obtained from COADS base and initialized with climatologicalhydrography from [5] This initial configuration was run for 25 years After such period a one-way nesting with 112-degree resolution and 21 layers was implemented for the western SouthAtlantic region delimited by the latitudes 30S and 45S and the longitudes 60W and 45Was showed in figure 2
The nested model was run for one full year forced with the same COADS climatological dataand lateral boundary conditions provided by the coarse resolution model using a 20 grid-pointsrelaxation
The BMC flow was obtained using the nested modeled year average and the corresponding26th year data of simulation of the whole domain generated by HYCOM for the fields of velocitytemperature and salinity Those fields compared well with observed data
Dynamic Days South America 2010 IOP PublishingJournal of Physics Conference Series 285 (2011) 012045 doi1010881742-65962851012045
2
Figure 2 High resolution domain delimited by the red square
The surface long-term velocity field is showed in figure 3 in IS units
Longitude
Latit
ude
60oW 56oW 52oW 48oW 44oW 45oS
42oS
39oS
36oS
33oS
30oS
60oW 56oW 52oW 48oW 44oW 45oS
42oS
39oS
36oS
33oS
30oS
01
02
03
04
05
06
07
08
Figure 3 Mean surface velocity field in IS units The color scale represents the absolute valuesof velocities
We clearly observe the BMC front located around 41S in accordance with observationsperformed by [6] as a result of the confluence between the BC flowing in the S-SW directionand the MC flowing N-NE We also identify the zonal current extension corresponding to the
Dynamic Days South America 2010 IOP PublishingJournal of Physics Conference Series 285 (2011) 012045 doi1010881742-65962851012045
3
South Atlantic Current (SAC)The maximum absolute value of the velocities in the BC flow occur around 055 msminus1
closely to the ones observed by [7] at 28S Maximum velocities associated with the MC floware approximately 03 msminus1 with mean velocity values around 017 msminus1 higher than thegeostrophic values measured by [8] at 365S
The flow associated with the BC weakens with increasing depth due to its baroclinicitywhile the MC flow dominated by the barotropic dynamics presents small variability Thesecharacteristics can be observed in figure 4 where we present the results for the velocity fieldaround 650m
Longitude
Latit
ude
60oW 56oW 52oW 48oW 44oW 45oS
42oS
39oS
36oS
33oS
30oS
60oW 56oW 52oW 48oW 44oW 45oS
42oS
39oS
36oS
33oS
30oS
005
01
015
02
025
03
Figure 4 Velocity field in IS units for the 650m depth The color scale represents the absolutevalues of velocities
Particularly the velocity field calculations clearly show the intense vortical activity associatedwith the BMC front showing the presence of two large anticyclonic structures in both sides ofthe confluence
With the dynamical fields of the modeled BMC we performed the energy conversioncalculations utilizing the method developed by [9] obtaining both baroclinic and barotropicenergy conversion maps for all depths of the flow
3 Energy conversions
To perform the energy conversion calculations we used the quasigeostrophic framework following[9] and decomposed the three-dimensional flow into a leading order geostrophic flow componentu = (uv0) and a small ageostrophic component ua = (uavaw)
In order to calculate the eddy energetics we need to decompose the instantaneous fields intomean and eddy fields which is done by defining the mean field as the long term average and theeddy field as the deviations from it
According to [9] we can define the barotropic energy conversion representing momentumadvection associated with the flow as
BT = minusuprimeuprimepartu
partxminus uprimevprime
(
partu
party+
partv
partx
)
minus vprimevprimepartv
party (1)
Dynamic Days South America 2010 IOP PublishingJournal of Physics Conference Series 285 (2011) 012045 doi1010881742-65962851012045
4
where the mean terms are denoted by an over bar and the eddy terms are denoted by primesThe baroclinic energy conversion which is relevant to baroclinic instability representing a
mechanism that lowers the center of mass of the fluid is defined as
BC =gα
θz
(
uprimeT primepartT
partx+ vprimeT prime
partT
party
)
(2)
with α being the specific volume and θ a z coordinate function representing a purely verticaltemperature field given by T = θ(z)+δT (x y z t) with δT (x y z t) = ∆T (x y z)+T prime(x y z t)and T = θ(z) + ∆T (x y z)
The energy conversion rates were calculated for all vertical levels of the simulation showingthe same dynamical characteristics being less effective with increasing depths Furthermoreit is important to note that only positive values of the conversion rates represent truly energyconversions
The surface barotropic and baroclinic energy conversion rates are showed in figure 5 andfigure 6 respectively
Longitude
Latit
ude
60oW 57oW 54oW 51oW 48oW 45oW 45oS
42oS
39oS
36oS
33oS
30oS
minus2
minus15
minus1
minus05
0
05
1
15
2
25
x 10minus6
Figure 5 Surface barotropic energy conversion rate in m2 sminus3
We can observe in figure 5 that regions where barotropic conversions occur are associated withthe retroflection region within the boundaries of the flow and the boundaries of the anticyclonesThe maximum values of the barotropic conversions reach 2 times 10minus6 m2 sminus3 located around 39Sand 51W
In figure 6 we observe that the baroclinic energy conversions are also more effective in theretroflection region Maximum values of baroclinic conversion are 14 times 10minus6 m2 sminus3 The zonalflow extension corresponding to the SAC also presents positive baroclinic energy conversionscorresponding due to the meandering formation in this current
The energy conversion rates associate with the BMC are of the same order of those calculatedfor the Gulf Stream by [9] although in the BMC the conversion process decays quickly withincreasing depth
Dynamic Days South America 2010 IOP PublishingJournal of Physics Conference Series 285 (2011) 012045 doi1010881742-65962851012045
5
Longitude
Latit
ude
60oW 56oW 52oW 48oW 44oW 45oS
42oS
39oS
36oS
33oS
30oS
minus6
minus4
minus2
0
2
4
6
8
10
12
14
x 10minus6
Figure 6 Surface baroclinic energy conversion rate in m2 sminus3
4 Conclusions
We reproduced in this work the dynamic flow patterns observed in the BMC region using anhybrid coordinate ocean model (HYCOM) to study the origin and development of the intenseeddy activity commonly observed in this region We were particularly interested in quantifyingthe importance of geophysical instability in the dynamics of the flow
This was achieved through the calculation of the energy conversion rates following [9]quasigeostrophic eddy energetic formulation using HYCOM output fields for the regiondelimited by the latitudes between 30S and 45S and the longitudes between 60W and 45W
The results of the energy conversion calculations showed the dominance of the baroclinicconversions over the barotropic ones although these process do not always occur at the samelocations
The dominance of baroclinic energy conversion mechanism suggest that heat fluxes are moreefficient to destabilize the flow than are the momentum fluxes The conversion of the availablepotential energy to kinetic energy in the BMC seems to be the main cause for the growing ofinstabilities while the barotropic conversions seems to be important in regions of intense shearflow particularly in the boundaries of the anticyclones
References[1] Olson D Podesta G P Evans R H and Brown O B 1988 Deep Sea Res 35 12[2] Francisco C P F and Silveira I C A 2004 Braz J Gephys 22 2[3] Buss R S Mata M M Garcia C A E Kampel M Oliveira E N and Lorenzetti J A 2006 Rem Sens Envir
100 52[4] Campos E J D 2006 Geophys Res Let 33
[5] Levitus S and Boyer T P 1998 World Ocean Atlas 1994 Technical Report National Oceanographic Data
Center 4 117[6] Boebel O Schmid C Podesta G and Zenk W 1999 J Geophys Res 104 (C9) 21[7] Muller T J Ikeda Y Zangenberg N and Nonato L V 1998 J Geophys Res 103 5429[8] Garzoli S L 1993 Deep Sea Res 40 1379[9] Cronin M and Watts D R 1996 J Phys Oceanogr 26 2107
Dynamic Days South America 2010 IOP PublishingJournal of Physics Conference Series 285 (2011) 012045 doi1010881742-65962851012045
6
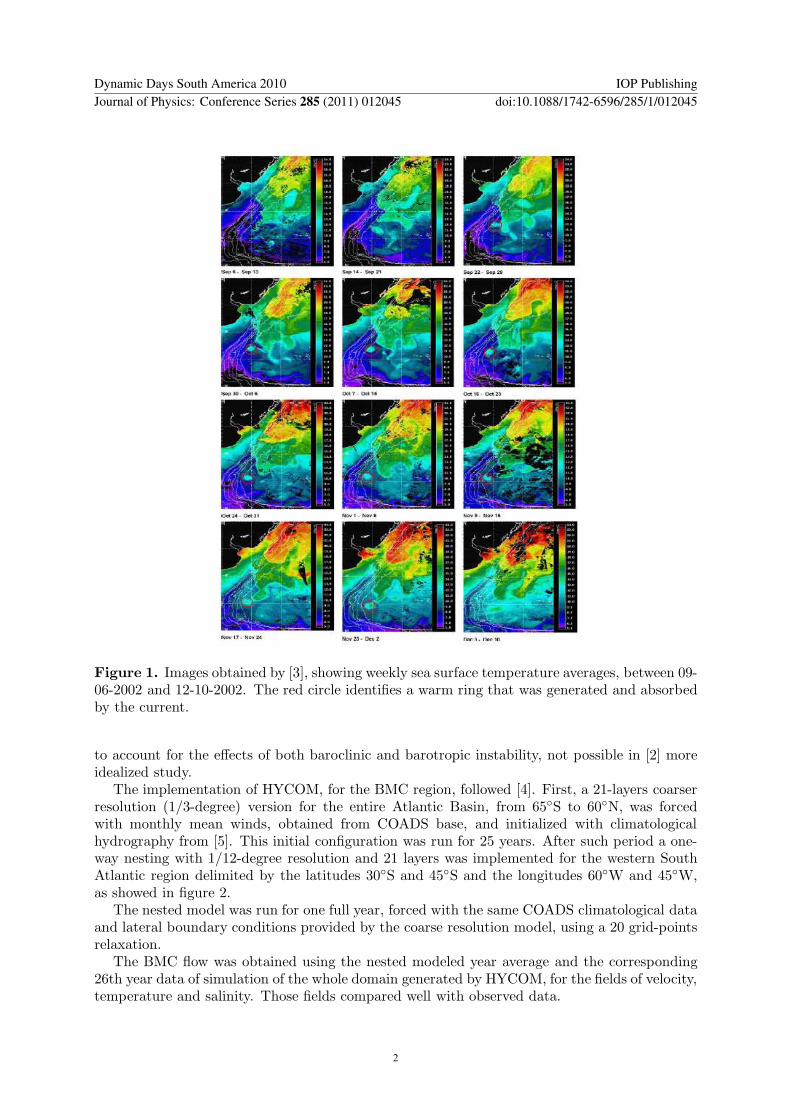