dynamics protein relaxation in site-specific mutants of ... · 10116 biochemistry 1993,32,...
TRANSCRIPT
10116 Biochemistry 1993,32, 10116-10124
Dynamics of Protein Relaxation in Site-Specific Mutants of Human Myoglobin+ David G. Lambright, Sriram Balasubramanian, and Steven G. Boxer'
Department of Chemistry, Stanford University, Stanford, California 94305-5080
Received February 22, 1993; Revised Manuscript Received June 29, 1993'
ABSTRACT: We have recently reported spectroscopic evidence for structural relaxation of myoglobin (Mb) following photodissociation of MbCO [Lambright, D. G., Balasubramanian, S., & Boxer, S. G. (1991) Chem. Phys. 158,249-2601, In this paper we report measurements for a series of single amino acid mutants of human myoglobin on the distal side of the heme pocket (positions 45, 64, and 68) in order to examine specific structural determinants involved in this conformational relaxation and to determine the nature of the coupling between relaxation and the functional process of ligand binding. The kinetics of ligand binding and conformational relaxation were monitored by transient absorption spectroscopy in the Soret spectral region, and the results are analyzed using a four-state ligand binding model. Two principal results emerge: (1) amino acid substitutions in the distal heme pocket affect the kinetics of the nonequilibrium conformational relaxation and (2) the rate of ligand escape from the protein matrix is not significantly perturbed by the distal heme pocket mutations.
Much of our knowledge regarding the mechanism of ligand binding to myoglobin (Mb)' comes from extensive studies of CO rebinding to photolyzed Mb in viscous glycero1:water solutions [see for example Austin et al. (1975), Beece et al. (1980), Hasinoff (1981), Ansari et al. (1986), and Campbell et al. (1987)j. In glycerol glasses below -200 K, the kinetics of CO rebinding to Mb are highly nonexponential, and this has been interpreted as reflecting a distribution of barrier heights for the iron-ligand bond formation step (process I; Austin et al., 1975). A variety of theoretical models have been developed to explain this basic observation (Agmon & Hopfield, 1983; Young & Bowne, 1984; Buhks & Jortner, 1985; Stein, 1985; Bialek & Goldstein, 1985; Srajer et al., 1988). In addition, several experiments indicate that the photolyzed protein is formed in a nonequilibrium distribution of conformational states (Iizuka, 1974; Ansari et al., 1985; Srajer et al., 1986; Campbell et al., 1987; Sassaroli & Rousseau, 1987; Steinbach et al., 1991). In the temperature range below the glycero1:water glass transition (Tg - 180- 200 K) the time scale for relaxation to an equilibrium distribution of conformational states is long compared to the time scale for ligand rebinding (Campbell et al., 1987; Agmon, 1988; Steinbach et al., 1991; Ahmed et al., 1992). At temperatures above the glass transition relaxation occurs on the time scale of ligand rebinding (Lambright et al., 1991; Srajer & Champion, 199 1; Steinbach et al., 199 1 ; Tian et al., 1992; Ansari et al., 1992). In the temperature range between 180 and 220 K, the rebinding kinetics appear to slow down with increasing temperature (Austin et al., 1975), an obser- vation which was originally attributed to the onset of a slower process (process 11).
Agmon and Hopfield (1983) have proposed a model based on the theory of bounded diffusion perpendicular to the reaction coordinate which accounts, at least qualitatively, for these observations, including the anomalous temperature depen- dence. Their model also predicts a transition from multiex-
t This work was supported in part by a grant from theNationa1 Institutes of Health (GM27738).
* Abstract published in Advance ACS Absrrucrs, September 1, 1993. Abbreviations: FTIR, Fourier transform infrared; Mb, myoglobin;
MbCO, carbon monoxymyoglobin; MEM, maximum entropy method; SVD, singular value decomposition.
0006-2960/93/0432- 101 16%04.00/0
ponential to single-exponential kinetics at temperatures above Tg where diffusive relaxation along the protein coordinate occurs on the time scale of ligand rebinding. The Agmon & Hopfield (AH) model uses a two-dimensional potential surface consisting of the iron-CO reaction coordinate, along which the motion is treated as Hamiltonian, and a generalized harmonic protein coordinate, along which the motion is treated as diffusive. Srajer, Reinisch, and Champion (1988; SRC model) have extended the concepts of the AH model by treating the iron-proximal histidine out-of-plane displacement as an independent coordinate, which is then coupled to a generalized protein coordinate that includes the remaining degrees of freedom.
Two additional processes are observed above 220 K. One of these is a bimolecular process of CO rebinding from bulk solvent (process IV; Austin et al., 1975), which is easily distinguished by its dependence on [CO]. The other is a geminate process (process 111) which is characterized by single- exponential kinetics and a strong dependence on solvent viscosity (Beece et al., 1980). While processes I and I1 can be accounted for in the AH and SRC models, the identity of process I11 remains an unresolved problem. One possibility is that it corresponds to the rebinding of ligands which have migrated out of the distal heme pocket and into the protein matrix (Austin et al., 1975). With this possibility in mind, it was suggested that CO binding to myoglobin could be described by a four-state sequential reaction scheme (DIott et al., 1983; Ansari et al., 1986):
kBC kcs
k~ A &CB ksc MbCO Mb:CO Mb::CO Mb + CO (1)
A B C S (bound) (distal pocket) (protein matrix) (solvent)
In this modification of the original reaction scheme, k B A ( f ) is a time-dependent rate for the iron-ligand bond formation step which incorporates the essential ideas of the AH model (Steinbach et al., 1991), and process I11 corresponds to rebinding from state C (Dlott et al., 1983; Ansari et a1.,1986). In the high-temperature limit, relaxation occurs on a time scale which is short compared to ligand rebinding, and k g ~ becomes a time-independent rate constant.
0 1993 American Chemical Society

Dynamics of Protein Relaxation Biochemistry, Vol. 32, No. 38, 1993 101 17
cyanide-binding properties of the protein (Varadarajan et al., 1989a,b). There is a small change in the isoelectric point from 7.20 to 7.27 (Varadarajan et al., 1989a), and the stability of the apoprotein to denaturation by guanidinium-HC1 increases by about 0.5 kcal/mol (Hughson & Baldwin, 1989). All of the mutants described in this work were prepared from a cDNA template containing the C110A substitution and, as a consequence, are double mutants. Hence, C110A replaces wild-type human Mb as the reference protein for these experiments and is referred to as WT in this paper.
The basic experimental apparatus has been described in detail (Lambright et al., 1991; Lambright, 1992). Samples of the CO derivatives of mutants in either 1-mm- or l-cm- path-length quartz cells were photolyzed at 532 nm with 8 4 s (fwhm) Q-switched pulses from the frequency-doubled output of a Nd:YAG laser (Quantel) operating at a repetition rate of 10 Hz. The energy density of the photolyzing pulses was typically 20 mJ/pulse at the sample, which produces -50% photolysis. A telescopic beam expander and aperture were used to improve the spatial homogeneity of the photolyzing light. Transmission changes were monitored with a CW probe beam (4.5 nm fwhm bandwidth) obtained by passing broad- band light from a 500-W xenon-arc lamp through a 0.22-m monochromator. In order to eliminate the effects of photo- selection, transient absorption measurements were made with the probe light polarized at the magic angle with respect to the linearly polarized excitation light. The power density of the probe beam at the sample was -20 pW/cm2. The probe beam was detected with a 200-MHz photodiode detector constructed in this laboratory (Lambright, 1992). Scattered laser light was rejected by placing two 80-nm fwhm inter- ference filters having a center wavelength of 400 nm (Melles Griot) in front of the detector. Transient signals were simultaneously digitized on the nanosecond and millisecond time scales using a dual time base Tektronix DSA602 digitizing oscilloscope equipped with a 600-MHz bandwidth plugin. A small reflection from the laser, detected with a <1-ns-rise- time photodiode directly terminated into 50 a, was used as a trigger. The instrument response, including the effect of timing jitter, had a roughly Gaussian temporal profile with a fwhm of - 10 ns.
Transient spectra were reconstructed from single-wave- length kinetics measured at 1-nm intervals in a random order. The data collection was fully automated by using an IBM PC and software written in this laboratory to control both the oscilloscope and the monochromator. Transmitted intensities, Z(X,t), were converted to AA according to
W h , t ) = -loglo[Z(X,t)/Z,*(X)I (2) where Zbas is the transmitted baseline intensity prior to the excitation pulse. Zero time was chosen to correspond to the midpoint of the trace with the highest signal to noise. In order to obtain computationally manageable data sets, the number of points in the time domain was reduced from 5 100 to 256 by selecting points on a logarithmic time scale.
Maximum Entropy Rate Distributions. The data for CO rebinding to Mb exhibit a multiexponential decay law, N(t), which reflects some underlying, but unknown, distribution of ratesp(k). The rate and time domains are related by a Laplace transform:
N(t) = g""p(k) exp(-kt)dk (3) The distribution function p(k) may be continuous, discrete, or both. Givenp(k), it is generally straightforward tocalculate N(r) numerically. In the present case, however, we begin with a discretely sampled N(t), which is corrupted with
1
t? - . Fe - - I His 93
/' FIGURE 1: Selected residues in the region surrounding the heme in the met form of SW Mb (Tanako, 1977). The stereochemistry of these residues is essentially identical in the human Mb mutant K45R (Hubbard et al., 1990). A water molecule is weakly coordinated to the iron in this form. A expanded diagram of the geometry of the bound CO molecule in the MbCO form is shown below.
We have recently demonstrated that CO rebinding to Mb in glycerokwater solution in the temperature range from 250 to 290 K is accompanied by a small but readily detectable change in the Soret region of the photoproduct deoxyMb absorption spectrum (Lambright et al., 1991). An important observation is that the spectrum becomes identical to the equilibrium deoxyMb minus MbCO difference spectrum on a time scale which is shorter than that for process 111. This spectral evolution reflects a change in the environment of the heme group due to structural relaxation of the protein. Subsequently, Ansari et al. (1992) have also observed this spectral evolution and have studied its dependence on solvent viscosity. It has also recently been suggested that thesechanges may be specifically associated with a relaxation in the distal heme pocket (Tian et al., 1992). Consequently, it would be interesting to know whether these changes are affected by amino acid substitutions in the distal heme pocket. In the following we present the kinetics of ligand binding and structural relaxation in several site-specific mutants of human Mb in 75% (v/v) glycero1:water solution at pH 7.0. The relevant residues are illustrated schematically in Figure 1.
EXPERIMENTAL PROCEDURES
The procedures used for preparation, expression, and purification of human Mb mutants have been described in detail (Varadarajan et al., 1989a). Wild-type human Mb contains a single Cys at position 110, in contrast with most other Mbs, which have Ala at this position. Because the presence of this Cys causes problems during purification, it has been replaced with Ala by site-specific mutagenesis. The C110A substitution does not affect the electronic absorption spectra, the NMR spectrum of the CO form, or the redox and

10118 Biochemistry, Vol. 32, No. 38, 1993
measurement noise, and we seek to recover an unknownp(k). It is well known that the numerical inversion of eq 3 is an ill-posed mathematical problem, particularly in the presence of noise. Consequently, there will be many feasible solutions which both satisfy the data and are physically reasonable.
It is possible, however, to select a solution from the feasible set which has no correlations in p(k) except those that are required by the data. This is done by maximizing the Lagrangian function Q = S- Axz, where x z = Zt(di- mt)z/ui2 is theusual misfit statistic andSis theShannon-Jaynes entropy (Jaynes, 1983):
= z#k (4) where mk is a prior model for the distribution and
( 5 ) J y P ( k ) d k
JOkWP (k)dk Pk =
In principle, the value of the Lagrange multiplier X is chosen such that x z E N , where N is the number of data pairs. This solution is defined as the maximum entropy (MEM) solution.
In the present application, the MEM solution for p(k) was found by using the general algorithm developed by Skilling and Bryan (1984). The transformvariable k was represented by 256 points which were equally spaced on a log scale. An "ignorant" prior distribution was established by setting mk equal to a constant, which corresponds to mk = k on a linear scale (Jaynes, 1986; Livesly et al., 1986). The progress of the algorithm was monitored by calculating
-0.02
Lambright et al.
- j h t A * + , w - J
- -
Convergence was determined by two criteria, xZ/N = 1.3 and TEST < 0.01. This choice for the final x 2 / N allows for some uncertainty in the estimate of ut and avoids the potential problem of overfitting the data.
RESULTS AND ANALYSIS Transient absorption kinetics on the nanosecond to milli-
second time scale were acquired at many wavelengths in the Soret spectral region following photolysis of the MbCO forms of WT and site-specific mutants at His 64 (Ala, Leu, Gln, Val), Val 68 (Ala, Am), and Lys 45 (Arg) in 75% (v/v) glycero1:water at 250, 270, 290, and 310 K. Each data set consists of a matrie, AA(X,t) , which can be viewed either as rows of transient absorption kinetics measured at different wavelengths or, equivalently, as columns of transient spectra at different times. Following the approach outlined in detail in Lambright et al. (1991), each AA(X,t) is decomposed by singular value decomposition (SVD) into a product of three matrices:
u ( X , t ) = U S V ~ (7) As shown in detail for WT (Lambright et al., 1991), for all the mutants the first two basis spectra (columns of U ) and their associated time courses (columns of V) contain essentially all of the signal as determined by several criteria, including the magnitude of the singular values (diagonal elements of S) and the autocorrelation of the columns of U and V. The remaining columns of U and V represent primarily measure- ment noise.
The first two basis spectra and their corresponding time courses for several mutants at 250 K are shown in Figures 2-5. These basis spectra are an orthogonal representation of the spectral changes which occur subsequent to photolysis. The major spectral change, represented by UI, can be identified
M- W"l I 1 1 1 1 1 1 1 1 I 1 1 " t " ' ~ ~ ~ " C 2 ' ' , ' , ,* ' S $ t ' , d ' " " " J ' 1 ' "
0.2 t-
0.1 -
Q) 3 0.0- c) ." 3 a 4 -0.1 -
-0.2 -
-0.3 \ d -
1 1 1 , 1 1 1 , 1 1
410 420 430 440 450 Wavelength (nm)
FIGURE 2: Basis spectra (columns of U) from the SVD of AA(X,r) at 250 K for WT, H64A, H64L, H64Q, and H64V. (A) Basis spectrum (VI) with the largest singular value. (B) Basis spectrum (U,) with the second-largest singular value.
0.0 -
s22v2 i
1 c h\
Dynamics of Protein Relaxation Biochemistry, Vol. 32, No. 38, 1993 10119
o.2[ 0.1 I
e, 2 'F 0.0
2 -O.l
-o.21 -0.3
-0.21 , I , I , *VI , I , ] 0 . .
-0.3 410 420 430 440 450
I - y. -0.3 I , I , I , I I I I 0 440 450
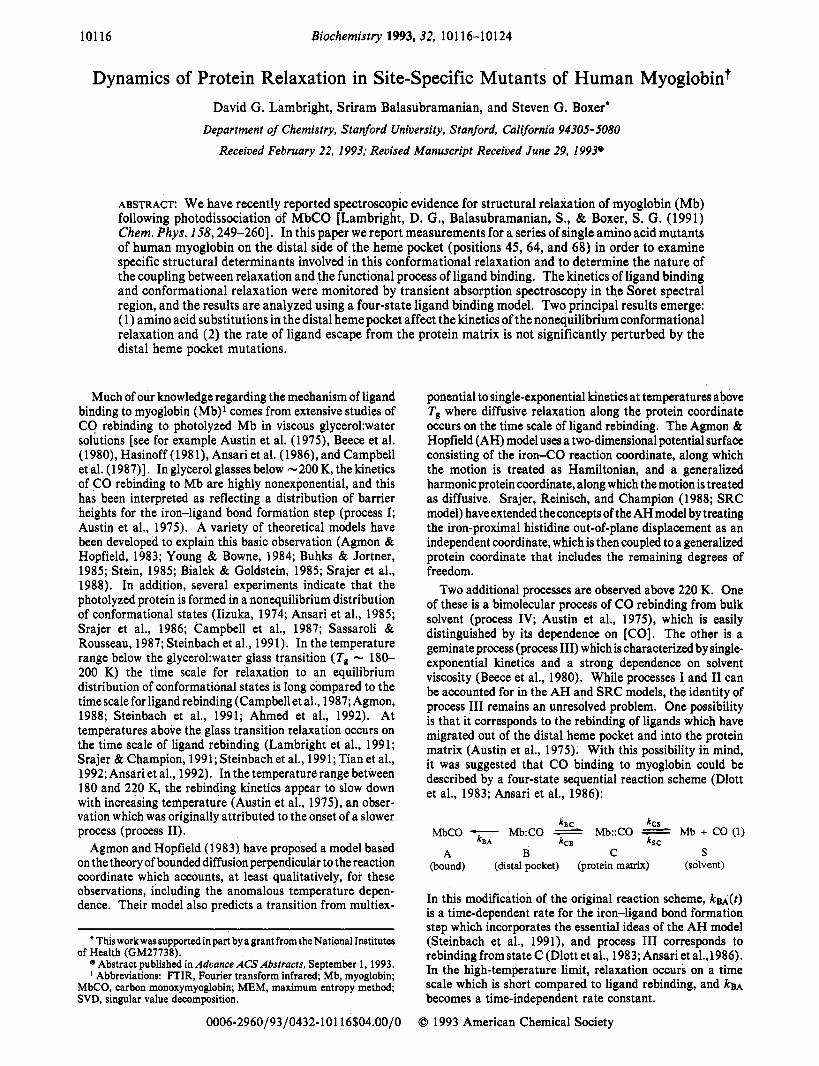
Wavelength (nm) FIGURE 4: Basis spectra (columns of U) from the SVD of AA(X,t) at 250 K for WT, K45R, V68A, and V68N. (A) Basis spectrum (VI) with the largest singular value. (B) Basis spectrum (U2) with the second-largest singular value.
0.8 -
2 0.6-
2 0.4-
e,
+ ._ 3 a
0.2
0.0
-
-
-0.02 - I I 1 1 1 1 1 1 1 1 I 1 1 1 1 , 1 1 1 I 1 1 1 1 1 1 1 1 I 1 1 1 1 1 1 1 1 I I,,
IO-1 Time (s)
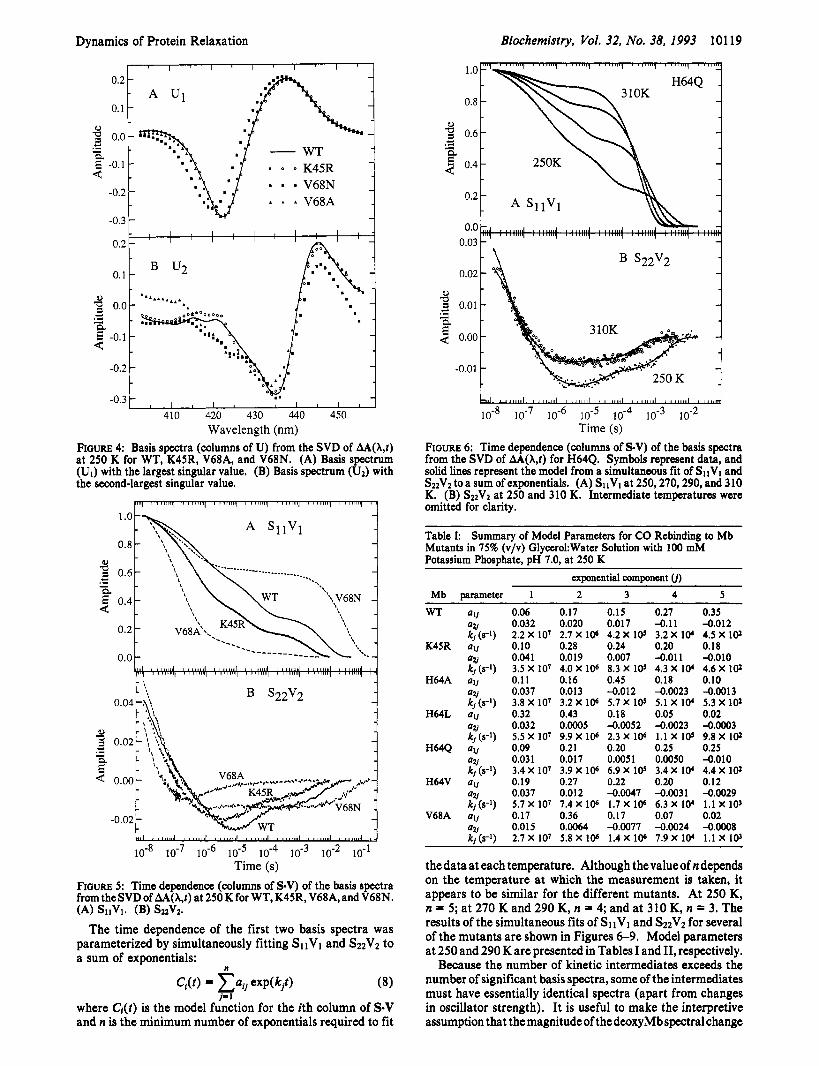
FIGURE 5: Time dependence (columns of S-V) of the basis spectra from the SVD of AA(x,r) at 250 K for WT, K45R, V68A, and V68N. (A) SiiVi. (B) S22V2.
The time dependence of the first two basis spectra was parameterized by simultaneously fitting SllVl and S2zV2 to a sum of exponentials:
where C,(t) is the model function for the ith column of S-V and n is the minimum number of exponentials required to fit
1 .o
0.8
2 0.6
4 0.4 0.2
0.0 0.03
e,
c) .e 1
a
0.02 I 3 0.01
P < : I 0.00
-0.01
IO-* Time (s)
FIGURE 6: Time dependence (columns of S.V) of the basis spectra from the SVD of AA(X,t) for H64Q. Symbols represent data, and solid lines represent the model from a simultaneous fit of SIIVI and S22V2 to a sum of exponentials. (A) SllVl at 250,270,290, and 310 K. (B) S22V2 at 250 and 310 K. Intermediate temperatures were omitted for clarity.
Table I: Summary of Model Parameters for CO Rebinding to Mb Mutants in 75% (v/v) GlycerokWater Solution with 100 mM Potassium Phosphate, pH 7.0, at 250 K
exponential component (/) Mb Darameter 1 2 3 4 5 WT
K45R
H64A
H64L
H64Q
H64V
V68A
-
0.06 0.032
0.10 0.041
0.1 1 0.037
0.32 0.032
0.09 0.03 1
0.19 0.037
0.17 0.015
2.2 x 10⁷
3.5 x 10⁷
3.8 x 10⁷
5.5 x 10⁷
3.4 x 10⁷
5.7 x 10⁷
2.7 x 10⁷
0.17 0.15 0.27 0.020 0.017 -0.11 2.7 X 10⁶ 4.2 X 10' 3.2 X 10, 0.28 0.24 0.20 0.019 0.007 -0.011 4.0 X 10⁶ 8.3 X 10' 4.3 X 10, 0.16 0.45 0.18 0.013 -0.012 -0.0023 3.2 X 10⁶ 5.7 X 10⁵ 5.1 X 10, 0.43 0.18 0.05 0.0005 -0.0052 -0.0023 9.9 X 10⁶ 2.3 X 10⁶ 1.1 X 10' 0.21 0.20 0.25 0.017 0.0051 0.0050
0.27 0.22 0.20 0.012 -0.0047 -0.0031 7.4 X 10⁶ 1.7 X 10⁶ 6.3 X 10, 0.36 0.17 0.07 0.0064 -0.0077 -0.0024 5.8 X 10⁶ 1.4 X 10⁶ 7.9 X 10,
3.9 x 10s 6.9 x 10⁵ 3.4 x iw
0.35 -0.012 4.5 x 10² 0.18 4.010 4.6 X 10² 0.10 -0.0013 5.3 x 10² 0.02 -0.0003 9.8 x 10² 0.25 -0.010 4.4 x 10² 0.12 -0.0029 1.1 x 10, 0.02 -0.0008 1.1 x lo,
thedata at each temperature. Although thevalueof n depends on the temperature at which the measurement is taken, it appears to be similar for the different mutants. At 250 K, n = 5; at 270 K and 290 K, n = 4; and at 310 K, n = 3. The results of the simultaneous fits of SllVl and S22V2 for several of the mutants are shown in Figures 6-9. Model parameters at 250 and 290 K are presented in Tables I and 11, respectively.
Because the number of kinetic intermediates exceeds the number of significant basis spectra, some of the intermediates must have essentially identical spectra (apart from changes in oscillator strength). It is useful to make the interpretive assumption that the magnitude of the deoxyMb spectral change

Biochemistry, Vol. 32, No. 38, 1993 Lambright et al. 10120
3 Y .* 3 a E d
i
i 1
0.0
Time (s) FIGURE 7: Time dependence (columns of S-V) of the basis spectra from the SVD of AA(A,t) for H64L. Symbols represent data, and solid lines represent the model from a simultaneous fit of SllVl and SzVz to a sum of exponentials. (A) SllVl at 250 K, 270 K, 290 K, and310K. (B)SzVzat 250Kand310K. Intermediatetemperatures were omitted for clarity.
0.8 l . O r i
T """"I ' """'I ' """'I " ~ " " ' 1 ' """'I ' ""1
V68A 4
L 0.0
0.021 \ c d l
s22v2
I I I , , , 111 I , , 1 , 1 1 1 1 I , 1,11111 I I I , , , , , I I , 1 1 1 1 1 1 1 I I,,,
IO-* Time (s)
FIGURE 8: Time dependence (columns of S-V) of the basis spectra from the SVD of AA(A,r) for V68A. Symbols represent data, and solid lines represent the model from a simultaneous fit of SllVl and S22V2 to a sum of exponentials. (A) SllVl at 250, 270, and 290 K. (B) S22V2at 250 and 290 K. Intermediate temperatures were omitted for clarity.
monitors the decay of population from a set of unrelaxed conformational states having a difference spectrumD1(X) into a set of relaxed conformational states having a difference
c 4 0.04 -
3 k? .= 0.02 - -
0.00-
250K -0.02 I , 1 1 1 , W I 1 1 1 1 1 1 1 1 I 1 , 1 1 1 1 1 1 , 1 1 1 1 1 1 1 1 , 1 1 1 1 1 1 1 1 I 1 1 , 1 1 1 1 1 I
Time (s) FIGURE 9: Time dependence (columns of S-V) of the basis spectra from the SVD of AA(X,t) for V68N. Symbols represent data, and solid lines represent the model from a simultaneous fit of SllVl and S22V2 to a sum of exponentials. (A) SllVl at 250,270,290, and 310 K. (B) S22V2 at 250 and 310 K. Intermediate temperatures were omitted for clarity.
Table 11: Summary of Model Parameters for CO Rebinding to Mb Mutants in 75% (v/v) Glycero1:Water Solution with 100 mM Potassium Phosphate, pH 7.0, at 290 K
exponential component (j) Mb
WT
K45R
H64A
H64L
H64Q
H64V
V68A
1 - 2 3 0.01 0.05 0.025 0.023 3.2 X lo7 0.05 0.09 0.029 0.024 2.9 X lo7 0.011 0.21 0.010 0.0090
0.21 0.35 0.016 0.011
0.03 0.09 0.013 0.018 3.7 X lo7 0.07 0.13 0.0061 0.015
0.06 0.32 0.023 0.0019
4.8 X lo6
6.1 X lo6
4.0 x 10⁷ 5.5 x io6
3.8 x 10⁷ 1.1 x 10⁷
6.6 X lo6
4.3 x 10⁷ 1.4 x 10⁷
4.8 x 10⁷ 1.0 x 10⁷
4 5
0.09 0.85 -0.002 -0.006
0.12 0.74 0.0028 -0.012 9.2 X 10' 0.14 0.64 0.0020 4,0054
0.18 0.26 -0.0005 -0.0056 1.8 X lo6 0.12 0.76 0.0073 -0.011
0.10 0.70 0.0045 -0.0063 1.4 X 10⁶ 0.24 0.38 0.0013 -0.0043 1.3 X lo6
8.3 x 10⁵ 1.4 x 10³
1.8 X lo3
1.1 x io6 3.6 x 10³
1.3 X 10'
8.5 x 10⁵ 2.1 x 10³
8.5 X 10³
9.2 X lo3 spectrumDz(X) which is identical to the equilibrium deoxyMb - MbCO difference spectrum. The experimental difference spectrum, AA(X,t), is then a linear combination of &(A) and Dz(X):
( 9 ) where a(r) is the population summed over unrelaxed states, and N(t ) is the population of photolyzed ligands which remain unbound. From the SVD of AA(x, t ) we have
W L t ) = 4 t ) D , ( M + [NO - a(t)lDz(N
= Cl(t)UI(X) + cz(t)U,(A) (10) where c,(t) = S,V,,(t). Furthermore, the {U,) are an
Dynamics of Protein Relaxation
orthogonal basis for the (Dn) which requires that
W) = X,Ul(X) + X2U,(V
D2(M = YlUl(X) + Y2U,(X)
(1 la )
(1 1b) where xn and yn are constant coefficients. Combining eqs 9-11 gives
and
Cl( t ) = X 1 4 t ) + Yl”d - 401 c2W = x 2 4 ) + Y,[N(t) - 4 t ) l
( 1 2 4
(12b) A useful property of SVD is that the (Un) basis has been rotated to maximize the overall contribution of U1 to AA(X,t) in the least-squares sense. In the limit that Dl(X) -&(A) , if follows from eqs 11 and 12 that XI - y l , x2 - y2 - 0, and cl(t) - Y l N W .
Assuming that all of the relaxation occurs on the time scale of our measurements, the spectrum Dl(X) can be calculated from
Dl(X) N Cl(t=O)Ul(x) + C2(t=O)U2(X) (13) where the C,(t=O) values are determined from eq 8 using the parameters obtained from the simultaneous fits. We have shown previously for WT that the conformational relaxation is complete prior to the end of the geminate phase of rebinding (Lambright et al., 1991). This allows the spectrum &(A) to be calculated from
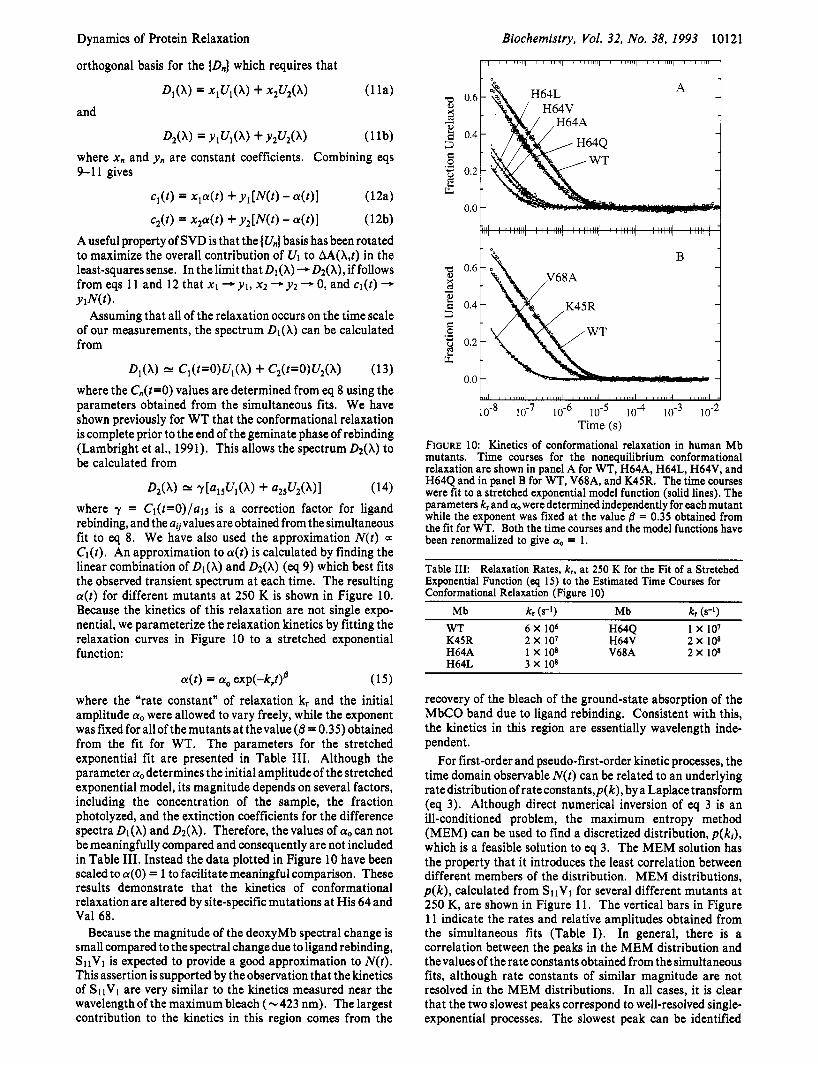
D2(X) r[a15u](x) + a,,U2(X>I (14) where y = Cl(t=O)/a15 is a correction factor for ligand rebinding, and the a,palues are obtained from the simultaneous fit to eq 8. We have also used the approximation N(t ) a Cl(t). An approximation to a(t) is calculated by finding the linear combination of & ( A ) and &(A) (eq 9) which best fits the observed transient spectrum at each time. The resulting a(t) for different mutants at 250 K is shown in Figure 10. Because the kinetics of this relaxation are not single expo- nential, we parameterize the relaxation kinetics by fitting the relaxation curves in Figure 10 to a stretched exponential function:
a(t) = a, exp(-k,t)@ (15) where the “rate constant” of relaxation k, and the initial amplitude a. were allowed to vary freely, while the exponent was fixed for all of the mutants at thevalue (0 = 0.35) obtained from the fit for WT. The parameters for the stretched exponential fit are presented in Table 111. Although the parameter a, determines the initial amplitudeof the stretched exponential model, its magnitude depends on several factors, including the concentration of the sample, the fraction photolyzed, and the extinction coefficients for the difference spectra Dl(X) and &(A). Therefore, the values of cyo can not be meaningfully compared and consequently are not included in Table 111. Instead the data plotted in Figure 10 have been scaled to a(0 ) = 1 to facilitate meaningful comparison. These results demonstrate that the kinetics of conformational relaxation are altered by site-specific mutations at His 64 and Val 68.
Because the magnitude of the deoxyMb spectral change is small compared to the spectral change due to ligand rebinding, SllVl is expected to provide a good approximation to N(t ) . This assertion is supported by the observation that the kinetics of SllVl are very similar to the kinetics measured near the wavelength of the maximum bleach (-423 nm). The largest contribution to the kinetics in this region comes from the
Biochemistry, Vol. 32, No. 38, 1993 10121
.3 s L E
c) 0
H64L A 1 H64V
/ ,H64A H64Q
t B
J I
IO-* Time (s)
FIGURE 10: Kinetics of conformational relaxation in human Mb mutants. Time courses for the nonequilibrium conformational relaxation are shown in panel A for WT, H64A, H64L, H64V, and H64Q and in panel B for WT, V68A, and K45R. The time courses were fit to a stretched exponential model function (solid lines). The parameters kr and a. were determined independently for each mutant while the exponent was fixed at the value 0 = 0.35 obtained from the fit for WT. Both the time courses and the model functions have been renormalized to give a. = 1.
~ _ _ _ _ _ _ _
Table 111: Relaxation Rates, k,, at 250 K for the Fit of a Stretched Exponential Function (eq 15) to the Estimated Time Courses for Conformational Relaxation (Figure 10)
Mb kr (s-’) Mb kr (s-l)
K45R 2 x 10⁷ H64V 2 x 10⁸ H64A 1 x 10⁸ V68A 2 x 10⁸ H64L 3 x 10⁸
WT 6 X lo6 H64Q 1 x 10⁷
recovery of the bleach of the ground-state absorption of the MbCO band due to ligand rebinding. Consistent with this, the kinetics in this region are essentially wavelength inde- pendent.
For first-order and pseudo-first-order kinetic processes, the time domain observable N ( t ) can be related to an underlying ratedistribution of rateconstants&), by a Laplace transform (eq 3). Although direct numerical inversion of eq 3 is an ill-conditioned problem, the maximum entropy method (MEM) can be used to find a discretized distribution, p(ki), which is a feasible solution to eq 3. The MEM solution has the property that it introduces the least correlation between different members of the distribution. MEM distributions, p ( k ) , calculated from SllVl for several different mutants at 250 K, are shown in Figure 1 1. The vertical bars in Figure 11 indicate the rates and relative amplitudes obtained from the simultaneous fits (Table I). In general, there is a correlation between the peaks in the MEM distribution and the values of the rate constants obtained from the simultaneous fits, although rate constants of similar magnitude are not resolved in the MEM distributions. In all cases, it is clear that the two slowest peaks correspond to well-resolved single- exponential processes. The slowest peak can be identified

10122 Biochemistry, Vol. 32, No. 38, 1993 Lambright et al.
A CllOA o.06L 'A ' 7 8 0.04 a
0.02
0.00 0.04
0.03 h 2 0.02
0.01
0.00 0.06 - 0.04
Y a 0.02
0.00 0.04
0.03 h
Y 0.02 a 0.01
0.00 lo2 lo3 104 lo5 lo6 10' IO*
k (s'l) FIGURE 11: MEM rate distributions,p(k), for CO rebinding at 250 K to (A) WT, (B) K45R, (C) H64L, and (D) H64V. The vertical lines represent the rate constants and relative amplitudes from the simultaneous fit of SllVl and S22V2 to a sum of exponentials.
Table IV: Activation Parameters for CO Rebinding to Mb Mutants in 75% (v/v) Glycero1:Water Solution with 100 mM Potassium Phosphate, pH 7.0
kca kcs ksc E, E. E*
WT 4x 10⁹ 26 1 x 10¹⁶ 56 4 x 10¹⁴ 40 Mb A (s-1) (kJ mol-[) A (s-I) (kJ mol-') A ( 8 1 ) (kJ mol-')
K45R 8 X lo9 26 8 X lo'$ 56 2 X 10'' 39 H64A 3 X lo9 24 2 X 10l6 57 2 X 10l6 49 H64L 3 X 10" 31 1 X 10l6 55 8 X lo1$ 45 H64Q 2 X 1Olo 29 8 X 10l5 56 5 X 10¹⁴ 40 H64V 5 X lo8 20 1 X 10l6 56 4 X 10'' 53 V68A 4 X 10'' 33 1 X 10l6 56 2 X 10¹⁵ 42
with bimolecular rebinding from the solvent (process IV), while the second-slowest peak can be identified with process 111.
Processes I11 and IV (exponential components 4 and 5, respectively, in Tables I and 11) correspond to ligand rebinding processes in the relaxed conformation (see Figures 7 and 10). Because these processes are relatively well resolved, the approximate relations
6 C = u14/('14 + a15) cy kCA/(kCA + kCS) (16a)
k4 kc, + kc, ( 16b)
k , = kscbc[COl ( 16c) arevalid and were used to calculate the rate constants kcs and ksc and the apparent rebinding rate constant kCA for the sequential reaction scheme (eq 1). Rate constants were determined from the data measured at 250,270,290, and 3 10 K. Activation parameters obtained from the linear least- squares fit to the Arrhenius law,
k = A exp(-E,/RT) (17) are presented in Table IV. An unexpected result is that the activation parameters for the rate constant of escape from the protein matrix (kcs) are identical for WT and all of the distal pocket mutants.
DISCUSSION
We have modeled the data by simultaneously fitting SllVl and S22V2 to a sum of exponentials (eq 8). Two of the exponential components (j = 4 a n d j = 5 in Tables I and 11) correspond to well-resolved processes in the time course for ligand rebinding (see Figures 3, 5, and 11). In particular, component 5 is easily identified as the bimolecular process on the basis of its dependence on [CO] (Austin et al., 1975; Balasubramanian et al., 1993a). Under the conditions of our experiments ([CO] >> [Mb]), the bimolecular processis pseudo first order. Component 4 is best resolved at the lowest temperature (250 K) and corresponds to process I11 in sperm whale Mb (Austin et al., 1975; Beece et al., 1980). The remaining one to three exponentials (the number depending on the temperature) account for the initial nonexponential phase of the geminate rebinding. Component 1 is observed at 250 K, but not at higher temperatures, and corresponds to apartiallyresolvedpeakin the MEM ratedistributions (Figure 11).
An evolution in the shape of the photoproduct deoxyMb absorption spectrum has been used to monitor the kinetics of a conformational relaxation. An unexpected but interesting result is that single amino acid substitutions on the distal side of the heme pocket alter the kinetics of this conformational relaxation (Figure 10 and Table 111). In particular, k, increases by about 1 order of magnitude for the substitutions H64A, H64V, H64L, and V68A and -2-fold for H64Q and K45R relative to WT. It is likely that the small effect produced by the K45R substitution reflects an interaction between Arg 45 and His 64 (Balasubramanian et al., 1993~). These results require that the conformational relaxation involve residues in the distal heme pocket.
Because the experimentally determined quantity a(t) represents the total population in unrelaxed conformational states, it is possible that ligand binding from unrelaxed states contributes to the observed decay of a(t). Although this mechanism has been shown to be responsible for the spectral evolution of a near-IR charge-transfer band in Hb at cryogenic temperatures (Campbell et al., 1987; Agmon, 1988), it appears that relaxation is the dominant mechanism for spectral evolution above about 220 K for both the near-IR band (Ahmed et al., 1991) and the Soret band (Tian et al., 1992). Consistent with this interpretation is our observation that the mutants H64A, H64L, H64V, and V68A have similar time scales for spectral evolution, despite having very different ligand binding kinetics. Thus, the available evidence favors relaxation as the dominant mechanism responsible for the decay of a(t) in the temperature range above about 220 K.
High-resolution X-ray crystal structures for MbCO (Kuriy- an et al., 1986) and deoxyMb (Takano, 1977b) reveal structural differences in the heme geometry as well as conformational differences involving residues on both the proximal and the distal side of the heme pocket. In MbCO, the heme ring has a planar geometry with the iron atom in the plane of the heme ring, whereas in deoxyMb the heme ring is domed, and the iron atom is displaced to the proximal sideofthe hemering by -0.5 A. The proximalconformational differences consist primarily of a tilting of the proximal histidine and a displacement of the F-helix which occurs in conjunction with the iron out-of-plane displacement. In addition to global changes, the differences on the distal side include the presence of an ordered water molecule in the distal heme pocket of deoxyMb, which is excluded from the distal heme pocket in MbCO, as well as the presence of a bound ligand in MbCO that exists in several distinct conformations.
Dynamics of Protein Relaxation
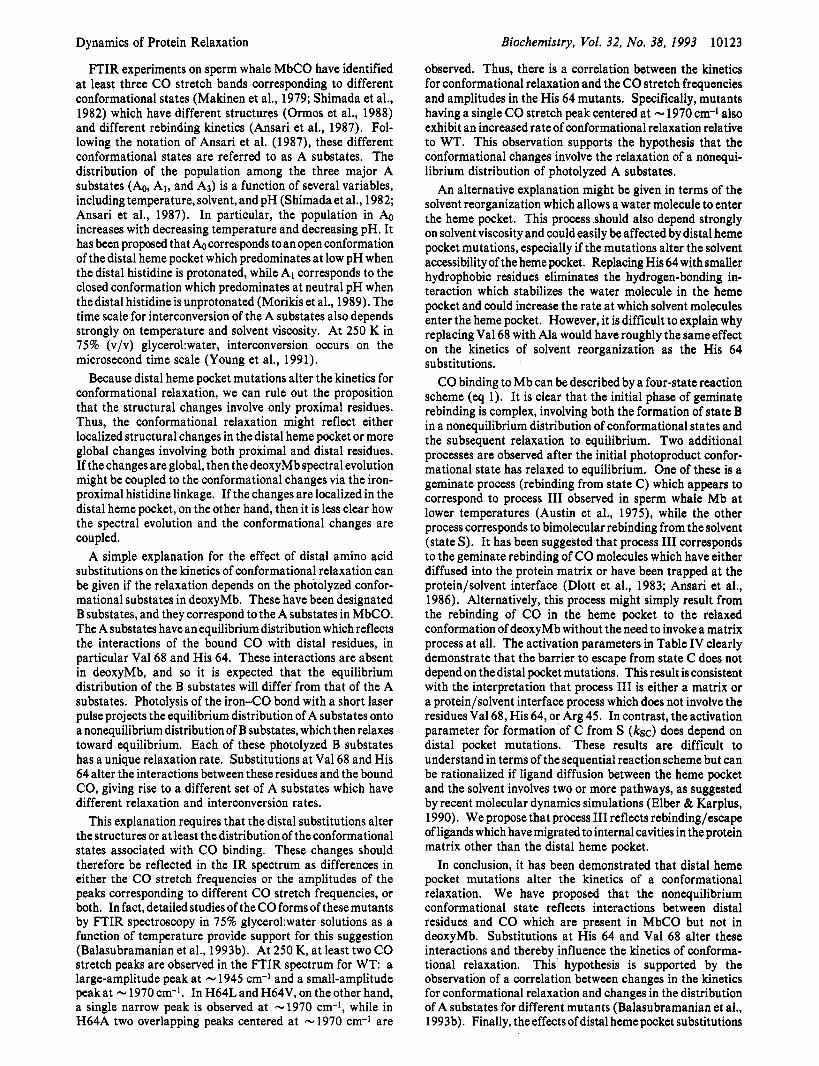
FTIR experiments on sperm whale MbCO have identified at least three CO stretch bands corresponding to different conformational states (Makinen et al., 1979; Shimada et al., 1982) which have different structures (Ormos et al., 1988) and different rebinding kinetics (Ansari et al., 1987). Fol- lowing the notation of Ansari et al. (1987), these different conformational states are referred to as A substates. The distribution of the population among the three major A substates (Ao, AI, and AS) is a function of several variables, including temperature, solvent, and pH (Shimada et al., 1982; Ansari et al., 1987). In particular, the population in A0 increases with decreasing temperature and decreasing pH. It has been proposed that A0 corresponds to an open conformation of the distal heme pocket which predominates at low pH when the distal histidine is protonated, while A, corresponds to the closed conformation which predominates at neutral pH when thedistal histidine is unprotonated (Morikis et al., 1989). The time scale for interconversion of the A substates also depends strongly on temperature and solvent viscosity. At 250 K in 75% (v/v) glycerol:water, interconversion occurs on the microsecond time scale (Young et al., 1991).
Because distal heme pocket mutations alter the kinetics for conformational relaxation, we can rule out the proposition that the structural changes involve only proximal residues. Thus, the conformational relaxation might reflect either localized structural changes in the distal heme pocket or more global changes involving both proximal and distal residues. If the changes are global, then the deoxyMb spectral evolution might be coupled to the conformational changes via the iron- proximal histidine linkage. If the changes are localized in the distal heme pocket, on the other hand, then it is less clear how the spectral evolution and the conformational changes are coupled.
A simple explanation for the effect of distal amino acid substitutions on the kinetics of conformational relaxation can be given if the relaxation depends on the photolyzed confor- mational substates in deoxyMb. These have been designated B substates, and they correspond to the A substates in MbCO. The A substates have an equilibrium distribution which reflects the interactions of the bound CO with distal residues, in particular Val 68 and His 64. These interactions are absent in deoxyMb, and so it is expected that the equilibrium distribution of the B substates will differ from that of the A substates. Photolysis of the iron-CO bond with a short laser pulse projects the equilibrium distribution of A substates onto a nonequilibrium distribution of B substates, which then relaxes toward equilibrium. Each of these photolyzed B substates has a unique relaxation rate. Substitutions at Val 68 and His 64 alter the interactions between these residues and the bound CO, giving rise to a different set of A substates which have different relaxation and interconversion rates.
This explanation requires that the distal substitutions alter the structures or at least the distribution of the conformational states associated with CO binding. These changes should therefore be reflected in the IR spectrum as differences in either the CO stretch frequencies or the amplitudes of the peaks corresponding to different CO stretch frequencies, or both. In fact, detailed studies of the CO forms of these mutants by FTIR spectroscopy in 75% glycero1:water solutions as a function of temperature provide support for this suggestion (Balasubramanian et al., 1993b). At 250 K, at least two CO stretch peaks are observed in the FTIR spectrum for WT: a large-amplitude peak at - 1945 cm-l and a small-amplitude peak at - 1970 cm-l. In H64L and H64V, on the other hand, a single narrow peak is observed at -1970 cm-l, while in H64A two overlapping peaks centered at -1970 cm-l are
Biochemistry, Vol. 32, No. 38, 1993 10123
observed. Thus, there is a correlation between the kinetics for conformational relaxation and the CO stretch frequencies and amplitudes in the His 64 mutants. Specifically, mutants having a single CO stretch peak centered at - 1970 cm-1 also exhibit an increased rate of conformational relaxation relative to WT. This observation supports the hypothesis that the conformational changes involve the relaxation of a nonequi- librium distribution of photolyzed A substates.
An alternative explanation might be given in terms of the solvent reorganization which allows a water molecule to enter the heme pocket. This process should also depend strongly on solvent viscosity and could easily be affected by distal heme pocket mutations, especially if the mutations alter the solvent accessibility of the heme pocket. Replacing His 64 with smaller hydrophobic residues eliminates the hydrogen-bonding in- teraction which stabilizes the water molecule in the heme pocket and could increase the rate a t which solvent molecules enter the heme pocket. However, it is difficult to explain why replacing Val 68 with Ala would have roughly the same effect on the kinetics of solvent reorganization as the His 64 substitutions.
CO binding to Mb can be described by a four-state reaction scheme (eq 1). It is clear that the initial phase of geminate rebinding is complex, involving both the formation of state B in a nonequilibrium distribution of conformational states and the subsequent relaxation to equilibrium. Two additional processes are observed after the initial photoproduct confor- mational state has relaxed to equilibrium. One of these is a geminate process (rebinding from state C) which appears to correspond to process I11 observed in sperm whale Mb at lower temperatures (Austin et al., 1975), while the other process corresponds to bimolecular rebinding from the solvent (state S). It has been suggested that process I11 corresponds to the geminate rebinding of CO molecules which have either diffused into the protein matrix or have been trapped at the protein/solvent interface (Dlott et al., 1983; Ansari et al., 1986). Alternatively, this process might simply result from the rebinding of CO in the heme pocket to the relaxed conformation of deoxyMb without the need to invoke a matrix process at all. The activation parameters in Table IV clearly demonstrate that the barrier to escape from state C does not depend on thedistal pocket mutations. This result isconsistent with the interpretation that process I11 is either a matrix or a protein/solvent interface process which does not involve the residues Val 68, His 64, or Arg 45. In contrast, the activation parameter for formation of C from S (ksc) does depend on distal pocket mutations. These results are difficult to understand in terms of the sequential reaction scheme but can be rationalized if ligand diffusion between the heme pocket and the solvent involves two or more pathways, as suggested by recent molecular dynamics simulations (Elber & Karplus, 1990). We propose that process I11 reflects rebinding/escape of ligands which have migrated to internal cavities in the protein matrix other than the distal heme pocket.
In conclusion, it has been demonstrated that distal heme pocket mutations alter the kinetics of a conformational relaxation. We have proposed that the nonequilibrium conformational state reflects interactions between distal residues and CO which are present in MbCO but not in deoxyMb. Substitutions at His 64 and Val 68 alter these interactions and thereby influence the kinetics of conforma- tional relaxation. This hypothesis is supported by the observation of a correlation between changes in the kinetics for conformational relaxation and changes in the distribution of A substates for different mutants (Balasubramanian et al., 1993b). Finally, the effects of distal heme pocket substitutions

10124 Biochemistry, Vol. 32, No. 38, 1993
on the escape kinetics are not easily interpreted in terms of a purely sequential reaction scheme but can be rationalized if ligand diffusion between the heme pocket and solvent involves multiple pathways.
REFERENCES Agmon, N. (1988) Biochemistry 27, 3507-351 1 . Agmon, N., Hopfield, J. J. (1983) J. Chem. Phys. 79, 2042-
2053. Ahmed, A. M., Campbell, B. F., Caruso, D., Chance, M. R.,
Chavez, M. D., Courtney, S. H., Friedman, J. M., Iben, I. E. T., Ondrias, M. R., & Yang, M. (1991) Chem. Phys. 158,
Ansari, A., Berendzen, J., Bowne, S. F., Frauenfelder, H., Iben, I. E. T., Sauke,T. B., Shyamsunder, E., & Young, R. D. (1985) Proc. Natl. Acad. Sci., U.S.A. 82, 5000-5004.
Ansari, A., DiIorio, E. E., Dlott, D. D., Frauenfelder, H., Iben, I. E. T., Langer, P., Roder, H., Sauke, T. B., & Shyamsunder, E. (1986) Biochemistry 25, 3139-3146.
Ansari, A., Berendzen, J., Braunstein, D., Cowen, B. R., Frauenfelder, H., Hong, M. K., Iben, I. E. T., Johnson, J. B., Ormos, P., Sauke, T. B., Scholl, R., Schulte, A., Steinbach, P. J., Vittitow, J., & Young, R. D. (1987) Biophys. Chem. 26, 337-355.
Ansari, A., Jones, C. M., Henry, E. R., Hofrichter, J., Eaton, W. A., & Szabo, A. (1991) Biophys. J. 59, 286a.
Ansari, A., Jones, C., Henry, E. R., Hofrichter, J., & Eaton, W. A. (1992) Science 256, 1796-1798.
Antonini, E., & Brunori, M. (197 1) Hemoglobin and Myoglobin and their Reactions with Ligands, North-Holland Publishing Co., Amsterdam.
Austin, R. H., Beeson, K. W., Eisenstein, L., Frauenfelder, H., & Gunsalus, I. C. (1975) Biochemistry 14, 5355-5373.
Balasubramanian, S., Lambright, D. G., Marden, M. C., & Boxer, S. G. (1993a) Biochemistry 32, 2202-2212.
Balasubramanian, S., Lambright, D. G., & Boxer, S. G. (1993b) Proc. Natl. Acad. Sci. U.S.A. 90, 4718-4722.
Balasubramanian, S., (1 993c) Ph.D. Thesis, Stanford University, Stanford, CA.
Beece, D., Eisenstein, L., Frauenfelder, H., Good, D., Marden, M. C., Reinisch, L., Reynolds, A. H., Sorensen, L. B., & Yue, K. T. (1980) Biochemistry 19, 5147-5157.
Bialek, W., & Goldstein, R. F. (1985) Biophys. J. 48, 1027- 1044.
Braunstein, D., Ansari, A,, Berendzen, J., Cowen, B. R., Egeberg, K. D., Frauenfelder, H., Hong, M. K., Ormos, P., Sauke, T. B., & Scholl, R. (1988) Proc. Natl. Acad. Sci. U.S.A. 85,
Buhks, E., & Jortner, J. (1985) J. Chem. Phys. 83,4456-4462. Campbell, B. F., Chance, M. R., & Friedman, J. M. (1987)
Science 238, 373-376. Carver, T. E., Olson, J. S., Smerdon, S. J., Krzywda,S., Wilkinson,
A. J., Gibson, Q. H., Blackmore, R. S., Dez Ropp, J., & Sligar, S. G. (1991) Biochemistry 30, 4697-4705.
Case, D. A., & Karplus, M. (1979) J. Mol. Biol. 132, 344-368. Case, D. A., & McCammon, J. A. (1986) Ann. N.Y. Acad. Sci.
Cheng, X., & Schoenborn, B. (1991) J. Mol. Biol. 220,381-399. Dlott, D. A., Frauenfelder, H., Langer, P., Roder, H., & DiIorio,
E. E. (1983) Proc. Natl. Acad. Sci. U.S.A. 80, 62394243.
329-351.
8497-8591.
482, 222.
Lambright et al.
Elber, R., & Karplus, M. (1990) J. Am. Chem. SOC. I1 2,9161-
Gibson, Q. JH. (1956) J. Physiol. 136, 112-122. Hasinoff, B. B. (1981) J. Phys. Chem. 85, 526-531. Henry, E. R., Sommer, J. H., Hofrichter, J., & Eaton, W. A.
(1983) J. Mol. Biol. 166, 443-451. Hofrichter, J., Sommer, J. H., Henry, E. R., & Eaton, W. A.
(1983) Proc. Natl. Acad. Sci. U.S.A. 80, 2235-2239. Hofrichter, J., Henry, E. R., Sommer, J. H., Deutsch, R., Ikeda-
Saito, M., Yonetani, T., & Eaton, W. A. (1985) Biochemistry
Hubbard,S. W., Hendrickson, W. A., Lambright, D. G., & Boxer,
Hughson, F. M., & Baldwin, R. L. (1989) Biochemistry 28,441 5- 4422.
Jaynes, E. T. (1986) Maximum Entropy and Bayesian Methods, in AppliedStatistics (Justice, J. H., Ed.) pp 26-58, Cambridge University Press, Cambridge.
Kottalam, J., & Case, D. A. (1988) J. Am. Chem. SOC. 110, 7690-7697.
Kuriyan, J., Wilz, S., Karplus, M., & Petsko, G. A. (1986) J.
Lambright, D. G., Balasubramanian, S., & Boxer, S. G. (1989)
Lambright, D. G., Balasubramanian, S., & Boxer, S. G. (1991)
9175.
24, 2667-2679.
S. G. (1990) J. Mol. Bi01. 213, 215-218.
Mol. Biol. 192, 133-154.
J . Mol. Bi01. 207, 289-299.
Chem. Phys. 158,249-260. Livesly, A. K., Licinio, P., & Delaye, M. (1986) J. Chem. Phys.
84, 5102-5107. Murray, L. P., Hofrichter, J., Henry, E. R., Ikeda-Saito, M.,
Kitagishi, K., Yonetani, T., & Eaton, W. A. (1988) Proc. Natl. Acad. Sci. U.S.A. 85, 2151-2155.
Skilling, J., & Bryan, R. K. )1984) Mon. Not. R . Astron. SOC.
Srajer, V., & Champion, P. M. (1991) Biochemistry 30,7390- 7402.
Srajer, V., Schomaker, K. T., & Champion, P. M. (1986) Phys. Rev. Lett. 57, 1267-1270.
Srajer,V., Reinisch, L., & Champion, P. M. (1988) J. Am. Chem. SOC. 110, 6656-6670.
Steinbach, P. J., Ansari, A., Berendzen, J., Braunstein, D., Chu, K., Cowen, B. R., Ehrenstein, D., Frauenfelder, H., Johnson, J. B., Lamb, D. C., Luck, S., Mourant, J. R., Nienhaus, G. U., Ormos, P., Philipp, R., Xie, A., & Young, R. D. (1991) Biochemistry 30, 3988-4001.
211, 111-124.
Takano, T. (1977a) J. Mol. Biol. 110, 537-568. Takano, T. (1977b), J. Mol. Biol. 110, 569-584. Tian, W. D., Sage, J. T., Srajer, V., & Champion, P. M. (1992)
Phys. Rev. Lett. 68, 408-41 1 . Tilton, R. F., Jr., Kuntz, I. D., Jr., & Petsko, G. A. (1984)
Biochemistry 23, 2849-2857. Varadarajan, R., Szabo, A., & Boxer, S. G. (1985) Proc. Natl.
Acad. Sci. U.S.A. 82, 5681-5684. Varadarajan, R., Lambright, D. G., & Boxer, S. G. (1989)
Biochemistry 28, 377 1-378 1 . Young, R. D., & Bowne, S. F. (1984) J. Chem. Phys. 81,3730-
3737. Young, R. D., Frauenfelder, H., Johnson, J. B., Lamb, D. C.,
Nienhaus, G. U., Philipp, R., & Scholl, R. (1991) Chem. Phys. 158, 315-327.