dysregulation of the mir-324-5p-cuedc2 axis leads to ... · leads to macrophage dysfunction and is...
TRANSCRIPT

Cell Reports, Volume 7
Supplemental Information
Dysregulation of the MiR-324-5p-CUEDC2 Axis
Leads to Macrophage Dysfunction
and Is Associated with Colon Cancer
Yuan Chen, Shao-Xin Wang, Rui Mu, Xue Luo, Zhao-Shan Liu, Bing Liang, Hai-
Long Zhuo, Xiao-Peng Hao, Qiong Wang, Di-Feng Fang, Zhao-Fang Bai, Qian-Yi
Wang, He-Mei Wang, Bao-Feng Jin, Wei-Li Gong, Tao Zhou, Xue-Min Zhang,
Qing Xia, and Tao Li
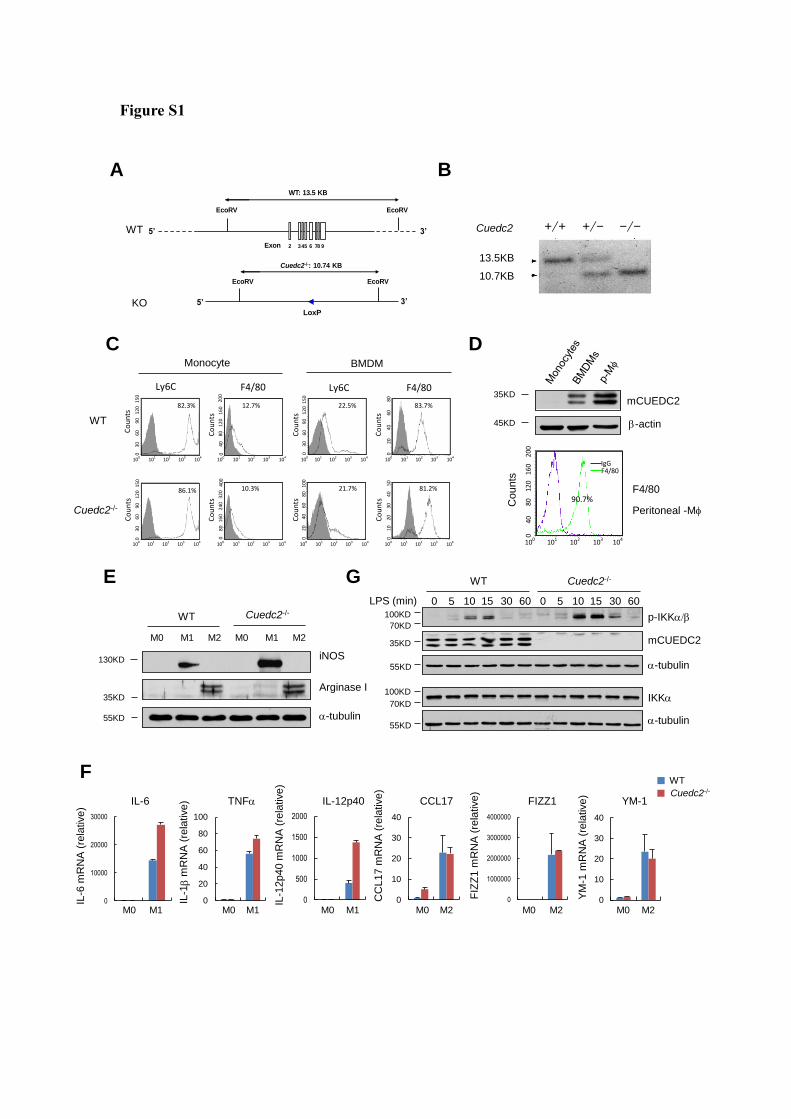
Figure S1
A
Cuedc2 +/+ +/- -/-
13.5KB
10.7KB
B
C
LoxP
mCUEDC2
b-actin45KD
35KD
D
10 0 10 1 10 2 10 3 10 4
FITC
Key Name Parameter Gat
DATA.005 FL1-H G1
DATA.006 FL1-H G1
10 0 10 1 10 2 10 3 10 4
FITC
Key Name Parameter Gat
DATA.005 FL1-H G1
DATA.006 FL1-H G1
Peritoneal -Mf
F4/8090.7%
100 102 103 104101
Counts
04
08
01
20
16
02
00
IgGF4/80
E
M0 M2M1
Arginase I
a-tubulin55KD
35KD
130KD iNOS
M0 M2M1
WT Cuedc2-/-
WT
KO
Exon 2 345 6 78 9
EcoRVEcoRV
WT: 13.5 KB
5’ 3’
Cuedc2-/-: 10.74 KB
EcoRVEcoRV
5’ 3’
WT
Monocyte BMDM
Cuedc2-/-
Ly6C
82.3%
Co
un
ts0
30
60
12
01
50
100 102 103 104101
90
104
F4/80
12.7%
100 102 103101
Co
un
ts
104
Ly6C
22.5%
100 102 103101
Co
un
ts
F4/80
83.7%
100 102 103 104101
Co
un
ts2
04
06
08
00
81.2%
100 102 103104101
Co
un
ts1
02
03
05
04
00
21.7%
100 102 103 104101
Co
un
ts0
104
10.3%
100 102 103101
Co
un
ts
86.1%
100 102 103 104101
Co
un
ts0
30
60
12
01
50
90
03
06
01
20
15
09
01
00
40
60
80
20
40
80
12
02
00
16
00
80
16
02
40
40
03
20
0
100KD
35KD
70KD
0 5 10 15 30 600 10LPS (min)
p-IKKa/b
mCUEDC2
a-tubulin
WT
5 15 30 60
IKKa
Cuedc2-/-
a-tubulin
55KD
100KD
70KD
55KD
0
20
40
60
80
100
0
10000
20000
30000
0
500
1000
1500
2000
IL-6
mR
NA
(re
lative)
IL-1
2p40 m
RN
A (
rela
tive)
IL-1b
mR
NA
(re
lative)
M0
IL-6 TNFa IL-12p40
0
10
20
30
40
0
1000000
2000000
3000000
4000000
0
10
20
30
40
CC
L17 m
RN
A (
rela
tive)
FIZ
Z1 m
RN
A (
rela
tive)
YM
-1 m
RN
A (
rela
tive)
CCL17 FIZZ1 YM-1
F
G
WT
Cuedc2-/-
Monocyte BMDM
Ly6C F4/80 Ly6C F4/80
WT
Cuedc2-/-
M1 M0 M1 M0 M1 M0 M2 M0 M2 M0 M2
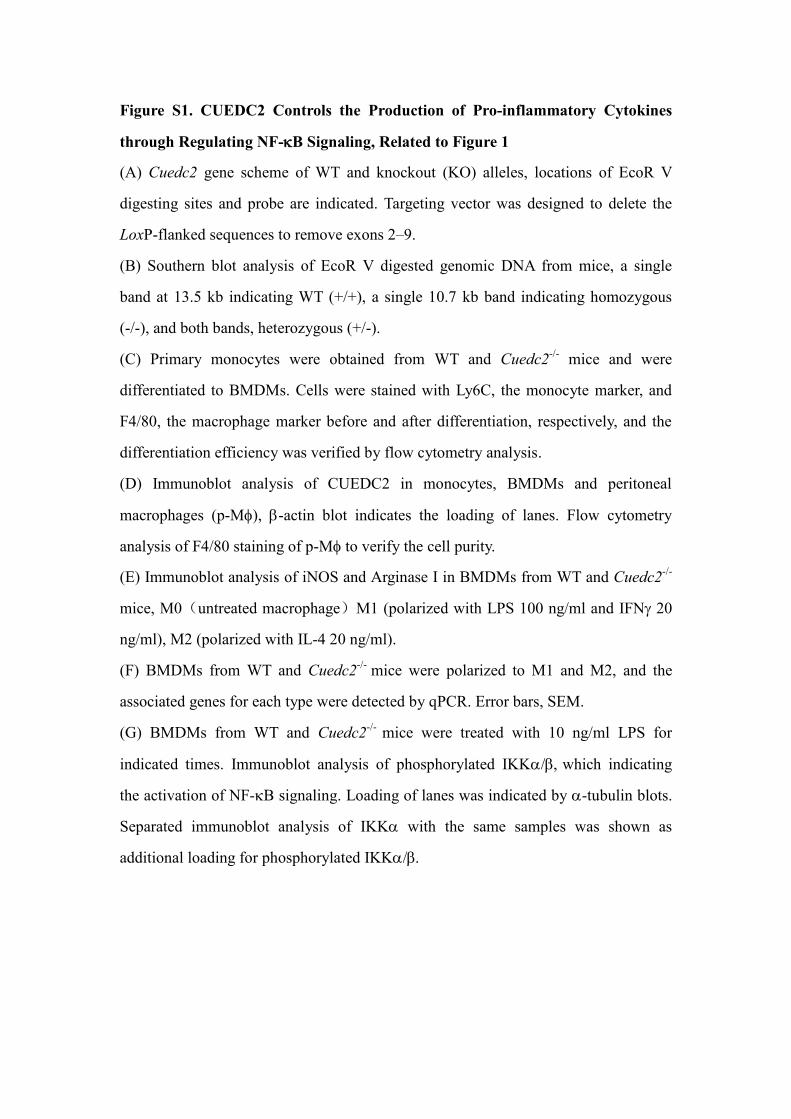
Figure S1. CUEDC2 Controls the Production of Pro-inflammatory Cytokines
through Regulating NF-B Signaling, Related to Figure 1
(A) Cuedc2 gene scheme of WT and knockout (KO) alleles, locations of EcoR V
digesting sites and probe are indicated. Targeting vector was designed to delete the
LoxP-flanked sequences to remove exons 2–9.
(B) Southern blot analysis of EcoR V digested genomic DNA from mice, a single
band at 13.5 kb indicating WT (+/+), a single 10.7 kb band indicating homozygous
(-/-), and both bands, heterozygous (+/-).
(C) Primary monocytes were obtained from WT and Cuedc2-/-
mice and were
differentiated to BMDMs. Cells were stained with Ly6C, the monocyte marker, and
F4/80, the macrophage marker before and after differentiation, respectively, and the
differentiation efficiency was verified by flow cytometry analysis.
(D) Immunoblot analysis of CUEDC2 in monocytes, BMDMs and peritoneal
macrophages (p-Mf), b-actin blot indicates the loading of lanes. Flow cytometry
analysis of F4/80 staining of p-Mf to verify the cell purity.
(E) Immunoblot analysis of iNOS and Arginase I in BMDMs from WT and Cuedc2-/-
mice, M0(untreated macrophage)M1 (polarized with LPS 100 ng/ml and IFN 20
ng/ml), M2 (polarized with IL-4 20 ng/ml).
(F) BMDMs from WT and Cuedc2-/-
mice were polarized to M1 and M2, and the
associated genes for each type were detected by qPCR. Error bars, SEM.
(G) BMDMs from WT and Cuedc2-/-
mice were treated with 10 ng/ml LPS for
indicated times. Immunoblot analysis of phosphorylated IKKa/bwhich indicating
the activation of NF-B signaling. Loading of lanes was indicated by a-tubulin blots.
Separated immunoblot analysis of IKKa with the same samples was shown as
additional loading for phosphorylated IKKa/b
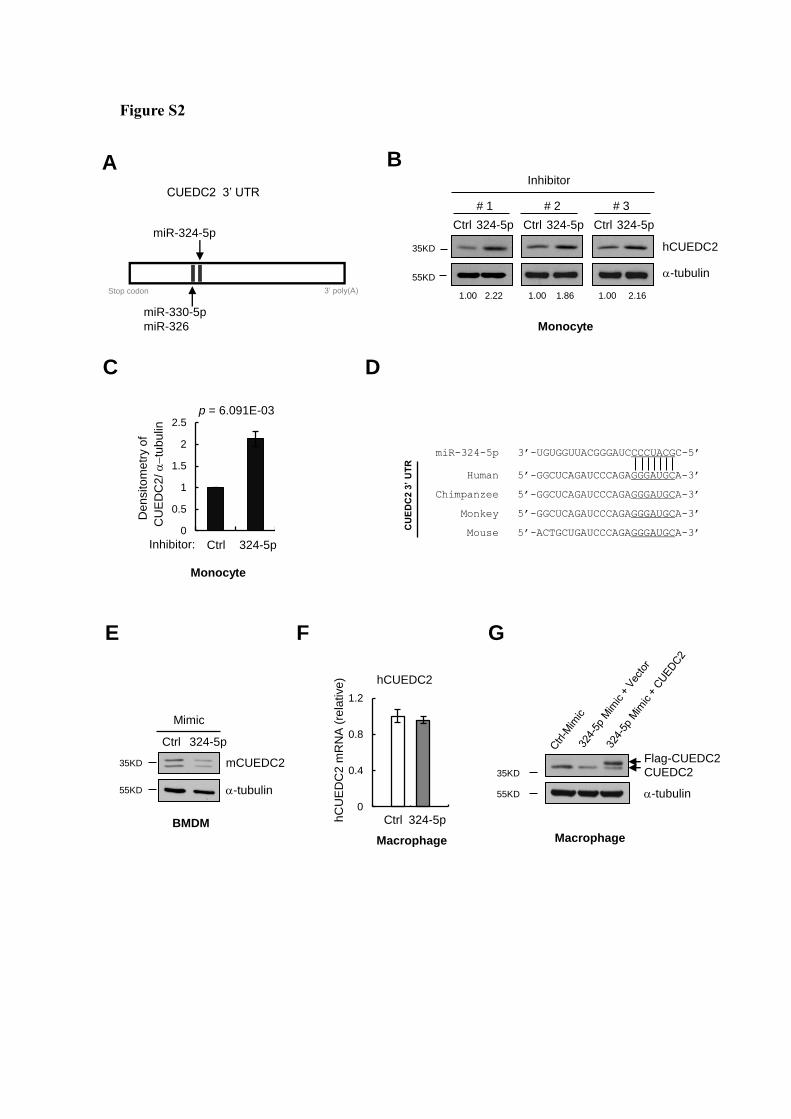
Figure S2
C
B
Human 5’-GGCUCAGAUCCCAGAGGGAUGCA-3’
Chimpanzee 5’-GGCUCAGAUCCCAGAGGGAUGCA-3’
Monkey 5’-GGCUCAGAUCCCAGAGGGAUGCA-3’
Mouse 5’-ACTGCUGAUCCCAGAGGGAUGCA-3’
miR-324-5p 3’-UGUGGUUACGGGAUCCCCUACGC-5’
CU
ED
C2
3’
UT
R
BMDM
mCUEDC2
a-tubulin
Ctrl 324-5p
Mimic
55KD
35KD
A
CUEDC2 3’ UTR
miR-324-5p
miR-330-5p
miR-326
3’ poly(A)Stop codon
D
E F
0
0.4
0.8
1.2
hC
UE
DC
2 m
RN
A (
rela
tive
)
Macrophage
hCUEDC2
324-5pCtrl
0
0.5
1
1.5
2
2.5
324-5pCtrl
De
nsito
me
try
of
CU
ED
C2
/a-tu
bu
lin
p = 6.091E-03
Inhibitor:
Inhibitor
Ctrl 324-5p Ctrl 324-5p 324-5pCtrl
55KD
35KD
1.00 2.22
hCUEDC2
a-tubulin
1.86 2.161.00 1.00
# 1 # 2 # 3
Monocyte
Monocyte
G
CUEDC2
a-tubulin55KD
35KD
Flag-CUEDC2
Macrophage

Figure S2. MiR-324-5p Regulates the Differential Expression of CUEDC2
between Monocytes and Macrophages, Related to Figure 3
(A) Distribution of predicted target sites for three relevant microRNAs in 3’UTR of
CUEDC2 mRNA as indicated.
(B) Immunoblot analysis of lysates of monocytes 24 hours after transfection of
miR-324-5p inhibitor or control inhibitor (Ctrl), numbers below lanes are
densitometry (hCUEDC2 relative to a-tubulin).
(C) Densitometric analysis of band intensity of CUEDC2 band relative to a-tubulin,
error bars, SEM.
(D) MiR-324-5p-binding sites in 3’UTR of CUEDC2 mRNAs is conserved in
mammals.
(E) Immunoblot analysis of CUEDC2 in miR-324-5p mimic or control (Ctrl) mimic
transfected mouse BMDMs, a-tubulin blots indicting loading of lanes.
(F) Human macrophages (Mf) were transfected with miR-324-5p mimic or control
(Ctrl) mimic, abundance of CUEDC2 mRNA was analyzed with qPCR. Data are
presented as relative quantification compared to GAPDH. Data represent three
independent experiments, error bars, SEM.
(G) Human macrophages were transfected with control or miR-324-5p mimics for 24
hours, and then the cells were infected with lenti-virus expressing Flag-tagged
CUEDC2 or Flag vector. Cell lysates were then collected for immunoblot analysis of
CUEDC2, a-tubulin blots indicting loading of lanes.
Figure S3
A
WT Cuedc2-/- WT Cuedc2-/-
-DSS +DSS
B
WT
Cuedc2-/-IL-1b
IL-1b
mR
NA
(re
lative
)
Colon
*
IL-6
IL-6
mR
NA
(re
lative
)
Colon
**
TNFa
TN
Fa
mR
NA
(re
lative
) *
Colon
0
0.5
1
1.5
2
2.5
3
Time (days)
1 2 3 4 5 6 7 8 9
**
**
Ble
ed
ing
Sco
re
WT
Cuedc2-/-
0
0.5
1
1.5
2
2.5
3
Time (days)
Sto
ol S
co
re
1 2 3 4 5 6 7 8 9
****WT
Cuedc2-/-
D
C
E
Mf transplantation
DSS
Sacrifice
D-1 D0 D1 D6 D10
Mf transplantation
0
2
4
6
8
0
1
2
3
0
5
10
15

Figure S3. CUEDC2 Expression in Macrophages is Critical for Protection
against Colitis, Related to Figure 4
WT and Cuedc2-/-
mice were subjected to oral administration of 2.5% DSS for 6 days,
followed by regular drinking water for 3 days.
(A-B) Rectal bleedingscore (A) and stool consistency scores (B) were scored daily,
Cuedc2-/-
mice (n = 11) and WT mice (n = 12), data represent means ± SEM.
(C) Colon length of WT and Cuedc2-/-
mice, untreated (left panel) and DSS treated
(right panel).
(D) 9 days after DSS administration, colon tissues from WT and Cuedc2-/-
mice were
obtained and subjected to qPCR analysis for mRNA levels of IL-6, TNFa and IL-1b.
Date represent three independent experiments, error bars, SEM.
(E) Schematic overview of macrophage transplantation regimen.
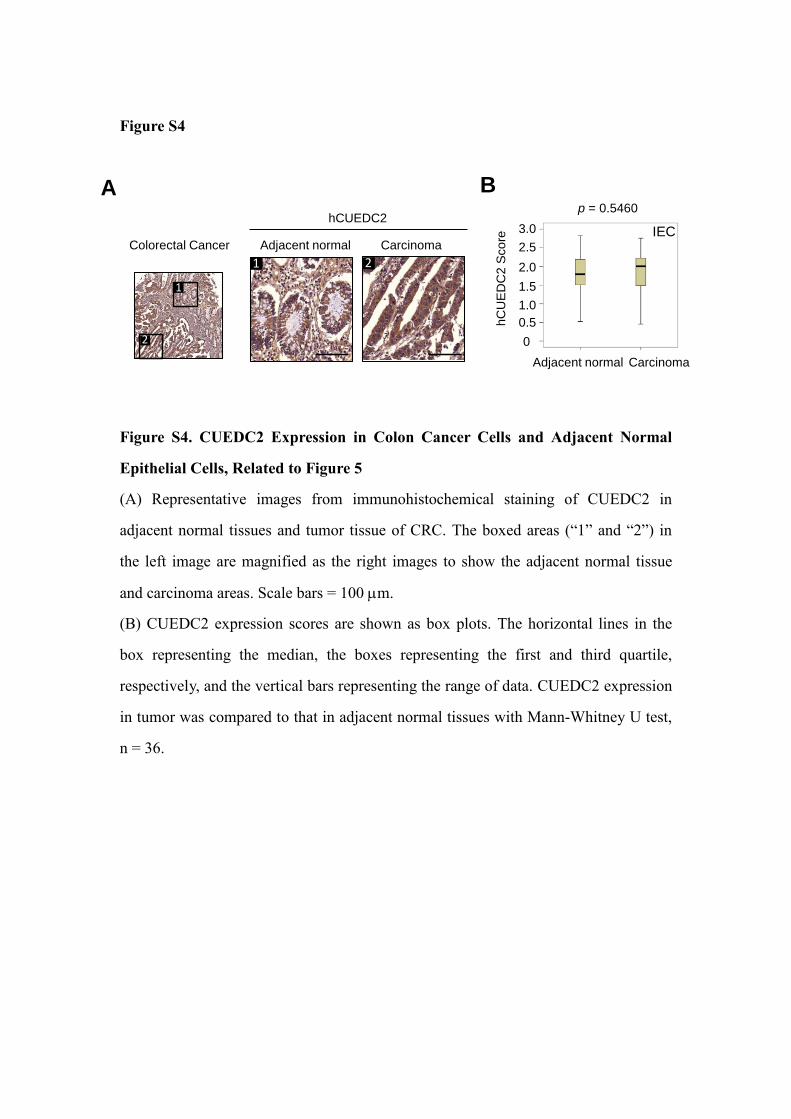
Figure S4
Figure S4. CUEDC2 Expression in Colon Cancer Cells and Adjacent Normal
Epithelial Cells, Related to Figure 5
(A) Representative images from immunohistochemical staining of CUEDC2 in
adjacent normal tissues and tumor tissue of CRC. The boxed areas (“1” and “2”) in
the left image are magnified as the right images to show the adjacent normal tissue
and carcinoma areas. Scale bars = 100 m.
(B) CUEDC2 expression scores are shown as box plots. The horizontal lines in the
box representing the median, the boxes representing the first and third quartile,
respectively, and the vertical bars representing the range of data. CUEDC2 expression
in tumor was compared to that in adjacent normal tissues with Mann-Whitney U test,
n = 36.
BA
hC
UE
DC
2 S
co
re IEC
0.5
1.0
1.5
2.0
2.5
3.0
p = 0.5460
0
CarcinomaAdjacent normal
hCUEDC2
Colorectal Cancer
1
1 2
2
CarcinomaAdjacent normal
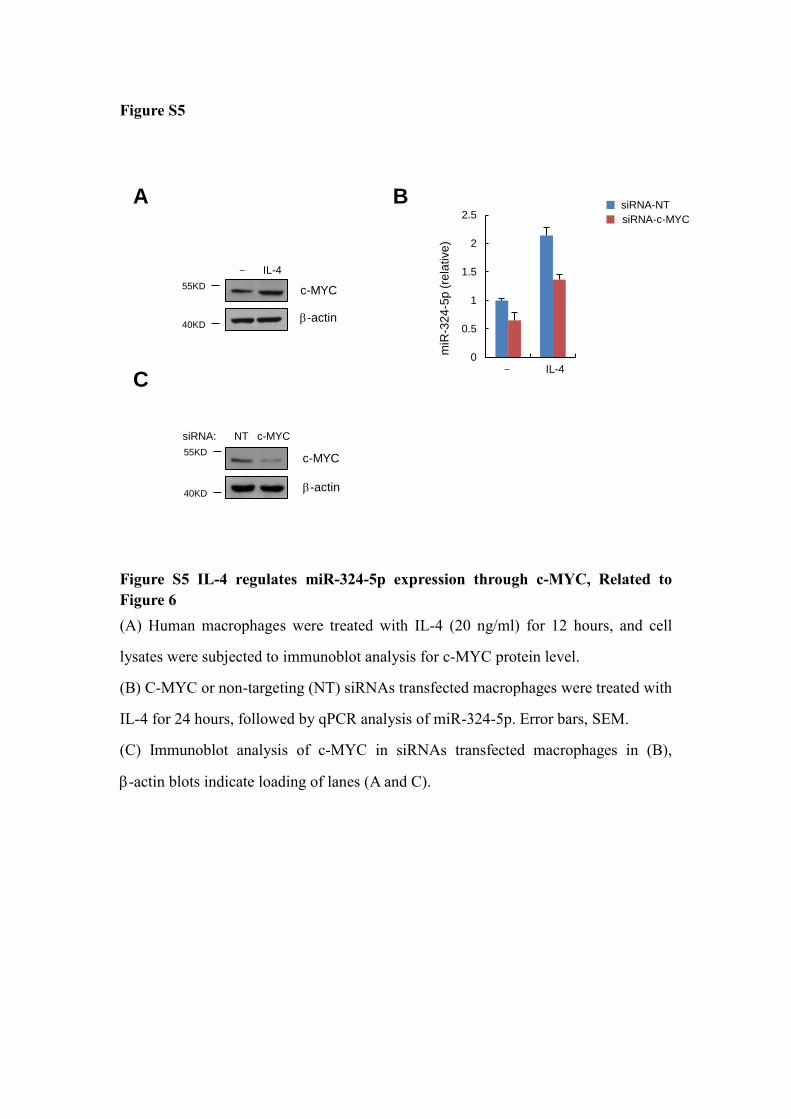
Figure S5
Figure S5 IL-4 regulates miR-324-5p expression through c-MYC, Related to
Figure 6
(A) Human macrophages were treated with IL-4 (20 ng/ml) for 12 hours, and cell
lysates were subjected to immunoblot analysis for c-MYC protein level.
(B) C-MYC or non-targeting (NT) siRNAs transfected macrophages were treated with
IL-4 for 24 hours, followed by qPCR analysis of miR-324-5p. Error bars, SEM.
(C) Immunoblot analysis of c-MYC in siRNAs transfected macrophages in (B),
b-actin blots indicate loading of lanes (A and C).
A
miR
-32
4-5
p (
rela
tive
)
IL-4-
B
IL-4-
c-MYC
b-actin40KD
55KD
siRNA:
c-MYC
b-actin40KD
55KD
c-MYCNT
C
0
0.5
1
1.5
2
2.5siRNA-NT
siRNA-c-MYC
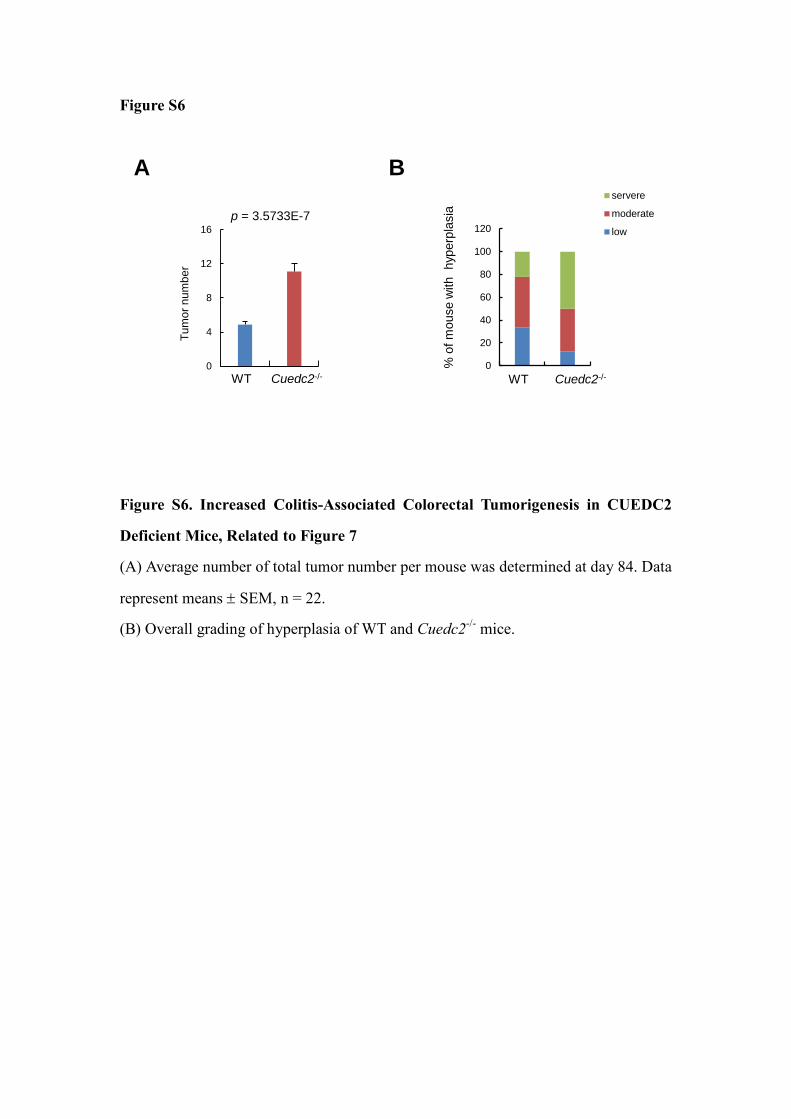
Figure S6
Figure S6. Increased Colitis-Associated Colorectal Tumorigenesis in CUEDC2
Deficient Mice, Related to Figure 7
(A) Average number of total tumor number per mouse was determined at day 84. Data
represent means SEM, n = 22.
(B) Overall grading of hyperplasia of WT and Cuedc2-/-
mice.
A
0
20
40
60
80
100
120
servere
moderate
low
% o
f m
ouse w
ith
hyp
erp
lasia
WT Cuedc2-/-
B
p = 3.5733E-7
WT Cuedc2-/-0
4
8
12
16
Tu
mo
r n
um
be
r

Supplemental Experimental Procedures
Reagents
FITC-anti-F4/80 (BM8), PE-anti-Ly6C (HK1.4), PE-anti-B220
(RA3-6B2) and FITC-anti-CD3 (17A) were from Biolegend.
PE-anti-Ly6G (RB6-8C5) was from eBioscience. Anti-mouse iNOS
(610430), rmIFN(554587) were from BD Biosciences.
Anti-mouse-Arginase I (sc-20150) and anti-b-actin (C-11) were from
Santa Cruz. Anti-pIKKa/b (2681), anti-IKKa (2682) and anti-a-tubulin
(2144) were from Cell Signaling Technology. Anti-c-MYC (A00172-200)
was from Genscript. RmIL-4 (404-ML) and rhIFN(215-IF) were from
R&D systems.
Generation of Cuedc2-/- Mice
The targeting construct was designed to flank Cuedc2 exon 2-9 (2.76 kb
fragment) with loxP sites. The long homology arm of 5.14 kb DNA
fragment 5’ to exon 2 of Cuedc2 and the short homology arm of 2.05 kb
fragment 3’ to exon 9 were sub-cloned into a targeting vector. A loxP site
was inserted 5’ to exon 2 and a loxP/FRT-flanked neomycin (neo)
resistance cassette was inserted 3’ to exon 9. 10 g of the targeting
constructs were linearized by NotI and then transfected by electroporation
to BA1 (C57BL/6 x 129/SvEv) hybrid embryonic stem cells. After

selection with G418 antibiotics, surviving clones were expanded for PCR
and Southern blot analysis to identify recombinant ES clones. Positive
clones were microinjected into C57BL/6 blastocysts and transferred into
CD-1 foster mothers. The resulting male chimeras were mated with
wild-type C57BL/6 females to test for germline transmission.
F1 agouti mice were genotyped by PCR, and the mice with
Cuedc2 fl-neo/+
genotype were crossed with FLP-deleter transgenic mice
(stock number 003946, Jackson Laboratory) to remove the Neo cassette
by the FLP-mediated recombination. The single floxed Cuedc2 allele was
converted to a null allele by Cre-mediated recombination (EIIa-Cre, stock
number 003724,Jackson Laboratory). Genotypes were analyzed by PCR
and confirmed by Southern blot analysis of EcoR V-digested tail genomic
DNA (10 μg), yielding 13.5- and 10.7-kb fragments for the Cuedc2+/+
and
Cuedc2-/-
alleles, respectively.
Flow Cytometry
Cells were washed in ice-cold flow-cytometry buffer (0.5% BSA and 2
mM EDTA in PBS, pH 7.2), and incubated with each antibody for 30
minutes followed by washing with flow-cytometry buffer. Data were
acquired on a FACSArial II flow cytometer and analyzed with CellQuest
Pro (BD Biosciences).