e automating entity matching model development
TRANSCRIPT

Automating Entity Matching Model DevelopmentPei Wang Weiling Zheng Jiannan Wang Jian Pei
Simon Fraser University{peiw, weiling zheng, jnwang, jpei}@sfu.ca
Abstract—This paper seeks to answer one important butunexplored question for Entity Matching (EM): can we developa good machine learning pipeline automatically for the EMtask? If yes, to what extent the process can be automated? Toanswer this question, we find that a general-purpose AutoMLtool cannot be directly applied to solve an EM problem, thuspropose AutoML-EM, an automated model pipeline developmentsolution tailored for EM. In reality, however, another bottleneckof EM problem is the insufficient labeled data. To mitigate thisissue, active learning based solutions are widely adopted. Underthis setting, we propose AutoML-EM-Active, investigating howto maximize the benefit of AutoML-EM with automatic datalabeling. We provide fundamental insights into our solutions andconduct extensive experiments to examine their performance onbenchmark datasets. The results suggest that AutoML-EM notonly avoids human involvement in model development processbut also reaches or exceeds the state-of-the-art EM performance,and AutoML-EM-Active improves the model performance underthe active learning setting effectively.
Index Terms—Entity Matching, AutoML, Data Integration,Active Learning
I. INTRODUCTION
Entity matching (EM) [12] is the task of finding differentrecords that refer to the same real-world entity. For example,consider two restaurant tables A and B in Figure 1. Althoughrecord a1 and record b1 do not match exactly, they refer tothe same real-world restaurant. EM has numerous applicationsin data science. Data scientists can clean a customer tableby detecting duplicate customers, to construct a 360-degreeview of customers by linking multiple customer tables, or toconduct a market analysis by comparing the same productacross different websites.
EM can be viewed as a Machine Learning (ML) problem,where the goal is to build an ML model which takes a recordpair as input and returns either a positive label (matching)or a negative label (non-matching). However, building an MLmodel that solves the problem well could take data scientists alot of time. They need to perform manual tuning and selectionat several steps, such as what features to include, how toprocess the features, which model to select, and how to sethyperparameters for the model. As will be shown in Section II,each of these decisions could have a big impact on the finalresults. There is a huge search space for data scientists to beexplored in order to find the optimal ML pipeline.
Automate Model Development for EM. Recently, the MLcommunity has put a significant amount of effort into au-tomating ML model development, including automated featureengineering, automated model selection, and automated hyper-parameter tuning (see a recent book [20] for a comprehensivesurvey). One crucial question but has not been answered yet
ID Name Address City Typea1 arnie mortons of chicago 435 s. la cienega blv. los angeles american
a2 arts delicatessen 12224 ventura blvd. studio city american
a3 fenix 8358 sunset blvd. west hollywood american
a4 restaurant katsu 1972 n. hillhurst ave. los angeles asian
ID Name Address City Typeb1 arnie mortons of chicago 435 s. la cienega blvd. los angeles steakhouses
b2 arts deli 12224 ventura blvd. studio city delis
b3 fenix at the argyle 8358 sunset blvd. w. hollywood french (new)
b4 katsu 1972 hillhurst ave. los feliz japanese
Table A: Restaurants in Data Source A
Table B: Restaurants in Data Source B
Fig. 1: An EM example for restaurant data (4 matching recordpairs: (a1, b1), (a2, b2), (a3, b3), (a4, b4).
is whether AutoML can be used to automatically develop anEM model which outperforms a human developed model.
We find that a general-purpose AutoML tool cannot bedirectly applied to solve an EM problem because it requires theinput to be feature vectors rather than raw record pairs. Weexplore the solution for extracting features and discuss howto use AutoML techniques effectively for EM. We call ourapproach AutoML-EM and compare the performance with twostate-of-the-art EM solutions, Magellan [31] and DeepMatcher[28]. Our study leads to two surprising findings.• Finding 1. AutoML-EM achieves an average improvement
of 5.8% in F1-score over human developed models ona variety of benchmark datasets. This finding is derivedfrom the comparison with Magellan, the state-of-the-artentity matching system. Both Magellan and AutoML-EMare based on non-deep-learning models. The differencebetween the two systems is that Magellan keeps humansin the loop and provides detailed how-to guides to helpdata scientists to build and tune an EM model stepby step, while AutoML-EM keeps humans out of theloop and leverages cutting-edge AutoML techniques toautomatically finds an optimal ML pipeline for EM.Finding 1 suggests that we need to rethink the role ofhuman in the EM model development stage.
• Finding 2. Non-deep-learning based EM models canachieve comparable or even better performance thandeep-learning based EM models [9], [28]. This findingis derived from the comparison between AutoML-EM andDeepMatcher, a state-of-the-art deep learning based EM
DataLabeling
Feature Engineering
Model Selection
Parameter Tuning
Model Development
Random SamplingActive Labeling...
Feature extractionValue imputationBalancingFeature selection…...
Random searchGrid searchBayesian optimization…...
SVMDecision treeRandom forestNaive bayes…...
Blocking Prediction
Candidate pairs Unlabeled data
ID_Left ID_Right Name_Left Name_Right ...1 1 arts delicatessen arts deli ...2 2 fenix fenix at the argyle ...3 3 restaurant katsu katsu ...... ... ... ... ...
ID_Left ID_Right Name_Space_Jaccard Name_ExactMatch label1 1 0.333 0 ?2 2 0.25 0 ?3 3 0.5 0 ?... ... ... ... ...
ID_Left ID_Right label1 1 12 2 13 3 1... ... ...
Output ResultsInput Data
ID Name Address ...1 arts delicatessen 12224 ventura blvd. ...
2 fenix 8358 sunset blvd. ...3 restaurant katsu 1972 n. Hillhurst ave. ...... ... ... ...
Table A Table B
ID Name Address ...1 arts deli 12224 ventura blvd ...
2 fenix at the argyle
8358 sunset blvd.,w. ...
3 katsu 1972 Hillhurst ave. ...... ... ... ...
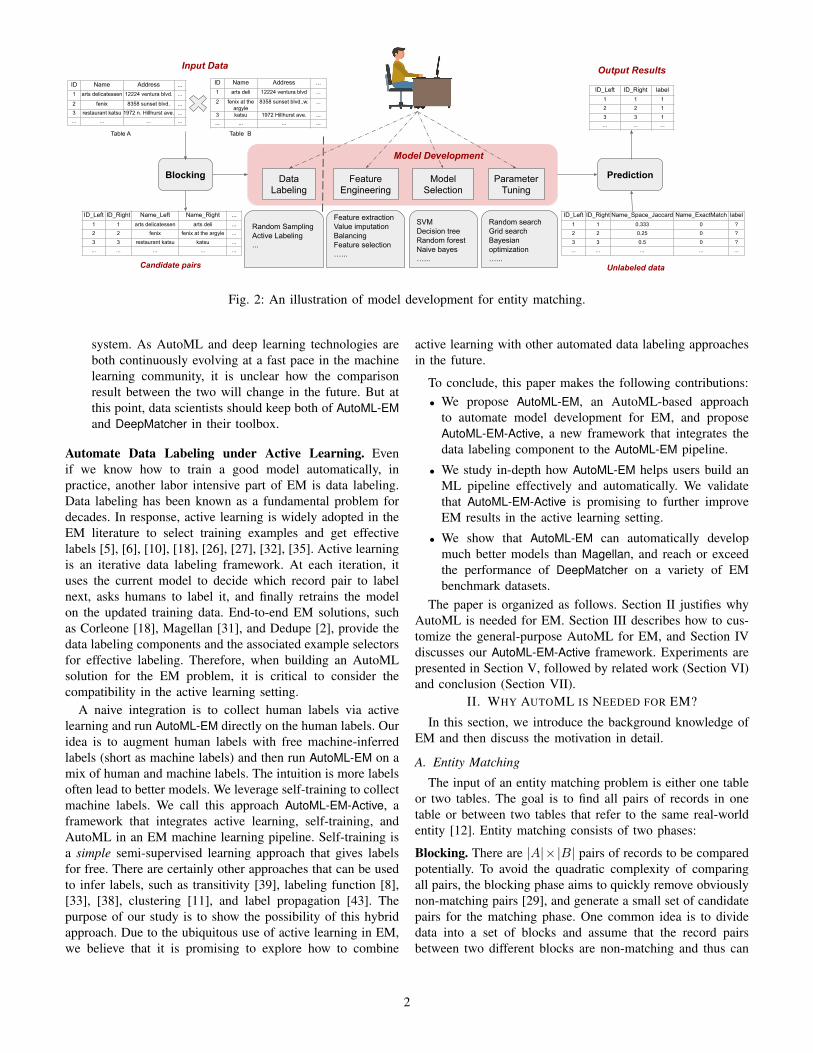
Fig. 2: An illustration of model development for entity matching.
system. As AutoML and deep learning technologies areboth continuously evolving at a fast pace in the machinelearning community, it is unclear how the comparisonresult between the two will change in the future. But atthis point, data scientists should keep both of AutoML-EMand DeepMatcher in their toolbox.
Automate Data Labeling under Active Learning. Evenif we know how to train a good model automatically, inpractice, another labor intensive part of EM is data labeling.Data labeling has been known as a fundamental problem fordecades. In response, active learning is widely adopted in theEM literature to select training examples and get effectivelabels [5], [6], [10], [18], [26], [27], [32], [35]. Active learningis an iterative data labeling framework. At each iteration, ituses the current model to decide which record pair to labelnext, asks humans to label it, and finally retrains the modelon the updated training data. End-to-end EM solutions, suchas Corleone [18], Magellan [31], and Dedupe [2], provide thedata labeling components and the associated example selectorsfor effective labeling. Therefore, when building an AutoMLsolution for the EM problem, it is critical to consider thecompatibility in the active learning setting.
A naive integration is to collect human labels via activelearning and run AutoML-EM directly on the human labels. Ouridea is to augment human labels with free machine-inferredlabels (short as machine labels) and then run AutoML-EM on amix of human and machine labels. The intuition is more labelsoften lead to better models. We leverage self-training to collectmachine labels. We call this approach AutoML-EM-Active, aframework that integrates active learning, self-training, andAutoML in an EM machine learning pipeline. Self-training isa simple semi-supervised learning approach that gives labelsfor free. There are certainly other approaches that can be usedto infer labels, such as transitivity [39], labeling function [8],[33], [38], clustering [11], and label propagation [43]. Thepurpose of our study is to show the possibility of this hybridapproach. Due to the ubiquitous use of active learning in EM,we believe that it is promising to explore how to combine
active learning with other automated data labeling approachesin the future.
To conclude, this paper makes the following contributions:• We propose AutoML-EM, an AutoML-based approach
to automate model development for EM, and proposeAutoML-EM-Active, a new framework that integrates thedata labeling component to the AutoML-EM pipeline.
• We study in-depth how AutoML-EM helps users build anML pipeline effectively and automatically. We validatethat AutoML-EM-Active is promising to further improveEM results in the active learning setting.
• We show that AutoML-EM can automatically developmuch better models than Magellan, and reach or exceedthe performance of DeepMatcher on a variety of EMbenchmark datasets.
The paper is organized as follows. Section II justifies whyAutoML is needed for EM. Section III describes how to cus-tomize the general-purpose AutoML for EM, and Section IVdiscusses our AutoML-EM-Active framework. Experiments arepresented in Section V, followed by related work (Section VI)and conclusion (Section VII).
II. WHY AUTOML IS NEEDED FOR EM?
In this section, we introduce the background knowledge ofEM and then discuss the motivation in detail.
A. Entity Matching
The input of an entity matching problem is either one tableor two tables. The goal is to find all pairs of records in onetable or between two tables that refer to the same real-worldentity [12]. Entity matching consists of two phases:
Blocking. There are |A|×|B| pairs of records to be comparedpotentially. To avoid the quadratic complexity of comparingall pairs, the blocking phase aims to quickly remove obviouslynon-matching pairs [29], and generate a small set of candidatepairs for the matching phase. One common idea is to dividedata into a set of blocks and assume that the record pairsbetween two different blocks are non-matching and thus can
2

ΔF1 = 10.08%
(a) Tuning Random Forest
ΔF1 = 13.99%
(b) Tuning Feature Selection
ΔF1 = 1.17%
(c) Tuning Data Scaling
Fig. 3: The effect of tuning parameters for ML pipeline components.
be safely pruned. For example, we can put the restaurants withthe same city attribute into the same block, and generate thecandidate restaurant pairs by enumerating every pair of recordswithin each block.
Matching. The matching phase aims to develop the predictionmodel, which takes a candidate pair as input and predictswhether they are matching or non-matching. Figure 2 illus-trates the model development process. Data scientists typicallyneed to go through four steps. First, they need to constructa training dataset using active learning or random sampling.In feature engineering, they need to extract features from arecord pair, perform data preprocessing like imputing missingvalues, handling imbalanced data, and feature preprocessinglike feature selection, etc. In model selection, they need todecide which model is most suitable for her EM task. Andfinally, they need to tune hyper-parameters (e.g., the numberof trees in a random forest, the kernel in SVM) in order toget the best model performance.
In this paper, we focus on the matching phase and treatblocking as an orthogonal problem.
Evaluation Function. The evaluation function takes an MLpipeline as input and outputs an evaluation score on the testdataset. The higher the score, the better the pipeline. F1 Scoreis a standard evaluation metric for EM. It is defined as theharmonic mean of Precision and Recall:
F1 Score = 2 · Precision · RecallPrecision + Recall
,
where Precision is the ratio of correctly identified matchesto all identified matches and Recall is the ratio of correctlyidentified matches to all true matches in the data. We use F1Score for evaluation throughout the paper.
B. Why AutoML?
Finding a good ML pipeline is challenging due to the largesearch space, i.e. the possible ways to assemble an ML pipeline.For example, for the feature preprocessing component alone,scikit-learn [30] provides tens of methods, where each has sev-eral parameters to tune. On the other hand, a good selection ofmethods and parameters can help improve prediction results.In the following, we first examine whether parameter tuningmatters for EM scenario and then show that the search spaceis too large for humans to tune manually, which justifies theneed of using AutoML for EM.
Parameter Tuning Matters for EM. We chose an EM bench-mark dataset, called Abt-buy, which is a product matchingdataset described in Sec V. We trained with 4/5 data, evaluatedwith the rest 1/5 data, and reported F1 Score. We use the sameinput feature vectors for the three experiments, explained inlater sections.
• Tuning Random Forest. We trained a random forestmodel using Scikit-learn [30]. We set other parameters tothe default value and tune the max features parameter,which represents the maximum number of features tocheck when searching for the best split. If it is set alarge (small) value, the model will have an overfitting(underfitting) issue. We varied max features from 5to 70, and computed the F1 Score of the model w.r,t,each max features value. Figure 3a shows the result. Wecan see that max features affects the model perfor-mance a lot. The F1 Score difference between the bestmax features and the worst max features is 10.08%.
• Tuning Feature Selection. We next examine how fea-ture selection may affect model prediction accuracy. Weadopted the SelectPercentile function in scikit-learnfor tuning. This function ranks features based on theANOVA F-value score and selects the top features withthe highest scores. We varied the number of selectedfeatures from 5 to 70, and computed the F1 Score of therandom forest model using default settings. The result isshown in Figure 3b. Like the previous experiment, wecan see that the number of selected features had a bigimpact on the F1 Score, resulting in a F1 Score gap ashigh as 13.99%.
• Tuning Feature Scaling. Standardization, which rescalesfeatures with statistics, is a common data preprocessingstep in machine learning. We chose the RobustScalerfunction [3] in scikit-learn to scale data since it is robustto outliers. It has a parameter called q min, representingthe first quantile in the interquartile range. Having a dif-ferent q min value leads to a different distribution of therescaled feature. We varied q min for RobustScalerfrom 0 to 50, and trained a random forest with rescaledfeatures. The result is shown in Figure 3c. While theimpact of this parameter is not as big as the previoustwo, it can still lead to ∆F1 Score = 1.17%.
In practice, data scientists have to tune the model manually
3

AutoML Components and Search Space
Data Preprocessing Feature Preprocessing Classification Models
compute_class_weight(...) SelectPercentile(...) AdaBoost(...)SimpleImputer(...) SelectRates(...) DecisionTree(...)
OneHotEncoder(...) ExtraTreePreprocessing(...) RandomForest(...)
RobustScaler(...) pca(...) GradientBoosting(...)
MinMaxScaler(...) FeatureAgglomeration(...) KNeighborsClassifier(...)... ... ...
Fig. 4: Search space of AutoML.in order to achieve the best EM model.Search Space is Too Large to Tune Manually. It is nothard to understand that it is impossible to find out the optimalpipeline manually given the huge number of possible pipelines(i.e., the search space). Figure 3 only shows three componentswith three parameters. It has already had a big search space,i.e., |max features|∗|k|∗|q min| = 70∗70∗50 = 245000. Ifwe consider all the components in a typical AutoML system asshown in Figure 4, the search space will get much bigger. Forexample, there are nearly twenty functions in the single featurepreprocessing module. There are over ten different models inthe model selection module. Each model can be associatedwith more than ten parameters. Tuning these parameters notonly requires high expertise for ML models, but also carefulexamination through the model documentation and setting upa parameter tuning algorithm like random search.
III. ENABLING AUTOML FOR EMIn this section, we present how to enable AutoML for the
EM problem. We starts with an introduction of the AutoMLprocess, and then discuss how to effectively extend AutoMLto solve the EM problem specifically. We call our approachAutoML-EM.
A. AutoML Process
The key idea of AutoML is to treat model development asa search problem. Given a training dataset and a validationdataset, AutoML aims to automatically find an ML pipelinethat is executed on the training dataset and produces a modelthat achieves the highest performance on the validation dataset.To achieve this, AutoML first constructs a search space thatcontains a large number of ML pipelines, then defines anevaluation metric (e.g., F1 Score) to measure how good anML pipeline is, and finally applies a search algorithm to findthe best ML pipeline automatically.
Search Space. An ML pipeline is a set of steps of howto process the data and train the model. For example, auto-sklearn [1], [15] defines an ML pipeline as a sequence offour parts: data preprocessing → feature preprocessing →model selection → associated hyperparameter settings for theselected methods. Figure 5 shows a toy auto-sklearn pipelineexample. We can see that two functions are applied in datapreprocessing, where the associated parameters are ‘weighting’and ‘mean’, respectively.
Search Algorithm. Given a search space, an evaluation metric,and a time budget, the goal of the search process is to find thebest pipeline (e.g., with the highest F1 Score on the validationset) in the search space within the time budget.
'balancing:strategy': 'weighting','imputation:strategy': 'mean',......'preprocessor:select_rates:mode': 'fdr','preprocessor:select_rates:score_func': 'chi2',...........'classifier:__choice__': 'random_forest',...'random_forest:bootstrap': false,'random_forest:criterion': 'gini','random_forest:max_features': 0.377,'random_forest:min_samples_leaf': 7,'random_forest:min_samples_split': 17,'random_forest:n_estimators': 100,
Example ML Pipeline
Data Preprocessing
ML PipelineComponents
Feature Preprocessing
Model Selection
Hyperparameter Tuning
Fig. 5: An example ML pipeline generated by auto-sklearn.
The pipeline searching is the most challenging part ofAutoML. A lot of research efforts have been devoted to solvingthis problem [7], [20], [40]. TPE [7] and SMAC [19] arethe state-of-the-art search algorithms. Their basic idea is toiteratively build a surrogate model and use it to guide thesearch process. For example, SMAC builds a random forest topredict the F1 Score for a given ML pipeline. At each iteration,it uses the random forest model to predict the F1 Scores fora sample of pipelines and selects the most promising pipeline(i.e., the one with the highest expected F1 Score). After that,it executes the selected pipeline to get the actual F1 Score andupdates the surrogate model accordingly. This process will berepeated until the time is used up.
B. AutoML-EM Feature Generation
We find that existing AutoML tools cannot be directlyapplied to EM because they require the input to be numericalfeature vectors rather than textual record pairs.
Let r denote a record with m attributes A1, A2, · · · , Am.Let r[Ai] denote the value of the record on attribute Ai. Givena record pair (r1, r2), the goal is to convert it to a numericalfeature vector [f1, f2, · · · , fn]1. Magellan proposes an idea tosolve the problem (Table I). In the following, we will explainhow it works, then identify the issue of using it for AutoML,and finally present our approach AutoML-EM.
Similarity Function. A similarity function quantifies thesimilarity between two strings (or numbers or boolean values).There are two types of similarity functions.
A token-based similarity function, denoted by (simfunc,tokenizer), applies a tokenizer to split each string into a tokenset and computes the similarity between the two token sets.For example, consider a similarity function (Jaccard, space).To compute the similarity between “new york” and “new yorkcity”, we split each string by space and get two token sets,T1 = {new, york} and T2 = {new, york, city}. We thencompute their jaccard similarity as |T1∩T2|
|T1∪T2| = 23 .
A non-token-based similarity function, denoted by (simfunc,N/A), directly computes the similarity between two strings,
1Similarity joins convert each record (rather than each record pair) to avector and then compute vector similarity to find matching record pairs.However, as shown in prior work, they are not as effective as model-basedmethods [22].
4
ID Data Type Similarity Function1
Single-Word String
(Levenshtein Distance, N/A)2 (Levenshtein Similarity, N/A)3 (Jaro Distance, N/A)4 (Exact Match, N/A)5 (Jaro-Winkler Distance, N/A)6 (Jaccard Similarity, 3-gram)7
1-to-5-Word String
(Levenshtein Distance, N/A)8 (Levenshtein Similarity, N/A)9 (Needleman-Wunsch Algorithm, N/A)10 (Smith-Waterman Algorithm, N/A)11 (Monge-Elkan Algorithm, N/A)12 (Cosine Similarity, Space)13 (Jaccard Similarity, Space)14 (Jaccard Similarity, 3-gram)15
5-to-10-Word String
(Levenshtein Distance, N/A)16 (Levenshtein Similarity, N/A)17 (Monge-Elkan Algorithm, N/A)18 (Cosine Similarity, Space)19 (Jaccard Similarity, 3-gram)20 Long String (>10 words) (Cosine Similarity, Space)21 (Jaccard Similarity, 3-gram)22
Numeric(Levenshtein Distance, N/A)
23 (Levenshtein Similarity, N/A)24 (Exact Match, N/A)25 (Absolute Norm, N/A)26 Boolean (ExactMatch, N/A)
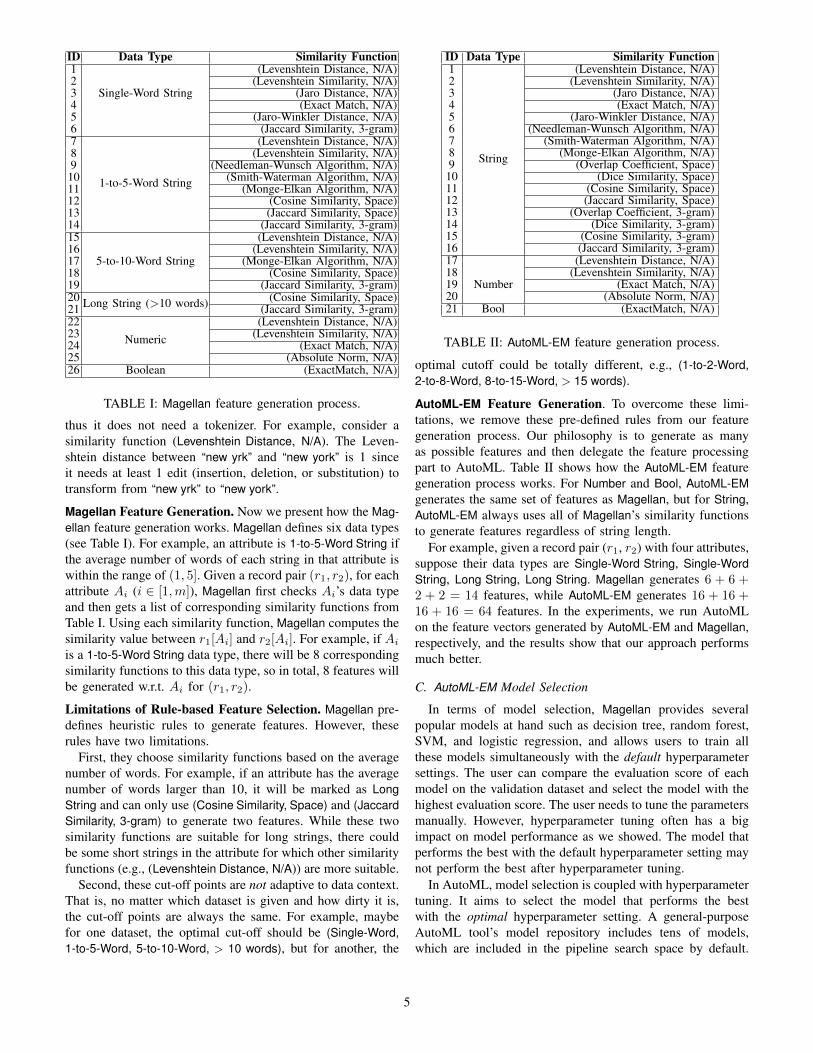
TABLE I: Magellan feature generation process.
thus it does not need a tokenizer. For example, consider asimilarity function (Levenshtein Distance, N/A). The Leven-shtein distance between “new yrk” and “new york” is 1 sinceit needs at least 1 edit (insertion, deletion, or substitution) totransform from “new yrk” to “new york”.
Magellan Feature Generation. Now we present how the Mag-ellan feature generation works. Magellan defines six data types(see Table I). For example, an attribute is 1-to-5-Word String ifthe average number of words of each string in that attribute iswithin the range of (1, 5]. Given a record pair (r1, r2), for eachattribute Ai (i ∈ [1,m]), Magellan first checks Ai’s data typeand then gets a list of corresponding similarity functions fromTable I. Using each similarity function, Magellan computes thesimilarity value between r1[Ai] and r2[Ai]. For example, if Ai
is a 1-to-5-Word String data type, there will be 8 correspondingsimilarity functions to this data type, so in total, 8 features willbe generated w.r.t. Ai for (r1, r2).
Limitations of Rule-based Feature Selection. Magellan pre-defines heuristic rules to generate features. However, theserules have two limitations.
First, they choose similarity functions based on the averagenumber of words. For example, if an attribute has the averagenumber of words larger than 10, it will be marked as LongString and can only use (Cosine Similarity, Space) and (JaccardSimilarity, 3-gram) to generate two features. While these twosimilarity functions are suitable for long strings, there couldbe some short strings in the attribute for which other similarityfunctions (e.g., (Levenshtein Distance, N/A)) are more suitable.
Second, these cut-off points are not adaptive to data context.That is, no matter which dataset is given and how dirty it is,the cut-off points are always the same. For example, maybefor one dataset, the optimal cut-off should be (Single-Word,1-to-5-Word, 5-to-10-Word, > 10 words), but for another, the
ID Data Type Similarity Function1
String
(Levenshtein Distance, N/A)2 (Levenshtein Similarity, N/A)3 (Jaro Distance, N/A)4 (Exact Match, N/A)5 (Jaro-Winkler Distance, N/A)6 (Needleman-Wunsch Algorithm, N/A)7 (Smith-Waterman Algorithm, N/A)8 (Monge-Elkan Algorithm, N/A)9 (Overlap Coefficient, Space)
10 (Dice Similarity, Space)11 (Cosine Similarity, Space)12 (Jaccard Similarity, Space)13 (Overlap Coefficient, 3-gram)14 (Dice Similarity, 3-gram)15 (Cosine Similarity, 3-gram)16 (Jaccard Similarity, 3-gram)17
Number
(Levenshtein Distance, N/A)18 (Levenshtein Similarity, N/A)19 (Exact Match, N/A)20 (Absolute Norm, N/A)21 Bool (ExactMatch, N/A)
TABLE II: AutoML-EM feature generation process.
optimal cutoff could be totally different, e.g., (1-to-2-Word,2-to-8-Word, 8-to-15-Word, > 15 words).
AutoML-EM Feature Generation. To overcome these limi-tations, we remove these pre-defined rules from our featuregeneration process. Our philosophy is to generate as manyas possible features and then delegate the feature processingpart to AutoML. Table II shows how the AutoML-EM featuregeneration process works. For Number and Bool, AutoML-EMgenerates the same set of features as Magellan, but for String,AutoML-EM always uses all of Magellan’s similarity functionsto generate features regardless of string length.
For example, given a record pair (r1, r2) with four attributes,suppose their data types are Single-Word String, Single-WordString, Long String, Long String. Magellan generates 6 + 6 +2 + 2 = 14 features, while AutoML-EM generates 16 + 16 +16 + 16 = 64 features. In the experiments, we run AutoMLon the feature vectors generated by AutoML-EM and Magellan,respectively, and the results show that our approach performsmuch better.
C. AutoML-EM Model Selection
In terms of model selection, Magellan provides severalpopular models at hand such as decision tree, random forest,SVM, and logistic regression, and allows users to train allthese models simultaneously with the default hyperparametersettings. The user can compare the evaluation score of eachmodel on the validation dataset and select the model with thehighest evaluation score. The user needs to tune the parametersmanually. However, hyperparameter tuning often has a bigimpact on model performance as we showed. The model thatperforms the best with the default hyperparameter setting maynot perform the best after hyperparameter tuning.
In AutoML, model selection is coupled with hyperparametertuning. It aims to select the model that performs the bestwith the optimal hyperparameter setting. A general-purposeAutoML tool’s model repository includes tens of models,which are included in the pipeline search space by default.
5

Labeled Data Only
Model 1
?
?
?
?
?
?
?
?
??
?
Labeled Data + Inferred Labeled Data
Model 2
?
?
?
?
?
?
—
+
+?
—
Fig. 6: An illustration of self-training.
AutoML-EM is motivated by the consideration that not all theavailable models are necessary to be equipped for solving theEM problem. The more unnecessary models we include, themore deceleration of the optimization speed. Should we onlyinclude a few promising models to shrink search space andaccelerate convergence or include as many models as possiblefor the best possible performance?
In our AutoML-EM solution, we only include the randomforest in the model repository. The reason is that random foresthas been consistently observed as the most performing onefor structured data [13]. We conduct an experimental studyto understand the effectiveness of this idea under differentsettings. So far, we have customized an AutoML solution forEM.
IV. ENABLING DATA LABELING FOR AUTOML-EM
In this section, we first illustrate why it is a good idea tocombine self-training and active learning for random forestmodel, and then describe how AutoML-EM-Active works.Self-Training. As mentioned previously, we consider how tomake the AutoML solution works better under active learningand integrate the data labeling to the AutoML-EM pipeline aswell. Our idea is to get free labels with self-training. Self-training is a semi-supervised learning algorithm. It leveragesboth labeled and unlabeled data to train a model. The followingshows its procedures:1) Train a model on labeled data2) Use the model to predict unlabeled data3) Add a sample of unlabeled data with high confidence to
the labeled data4) Retrain a model on the new labeled data
Figure 6 illustrates an example. The left sub-figure showsthe initial model built using labeled data (a positive point anda negative point). Self-training uses the model to predict eachunlabeled point. The right sub-figure shows that self-trainingselects two new positive/negative points, respectively. Unlikeactive learning which selects the points close to the decisionboundary, the points selected by self-training are far away fromthe decision boundary to ensure high confidence. A new modelis retrained using a mix of two given labeled points and fournewly inferred labeled points.Active Learning vs Self-Training. A random forest modelconsists of a collection of decision trees, where each tree istrained using a sample of training data and a sample of fea-tures. To make a prediction on an unlabeled pair, the random
Fig. 7: An illustration of active learning vs self-training usinga random forest model.
Algorithm 1: AutoML-EM-ActiveInput: Unlabeled record pairs U , labeling budget BOutput: A model M
1 T = Initial training data randomly drawn from U ;2 Ask humans to label T and set b = |T |;3 Remove T from U ;4 M = Train a model on T ;5 while b ≤ B and U 6= φ do6 Apply M to each record pair in U and get the label
confidence score of each pair;7 ac batch = Select a batch of record pairs from U with
the lowest label confidence scores;8 Ask humans to label ac batch and set b + =
|ac batch|;9 st batch = Select a batch of record pairs from U with
the highest label confidence scores and trust theirpredicted labels;
10 Add ac batch and st batch to T ;11 Remove ac batch and st batch from U ;12 M = Retrain a model on T ;13 return AutoML-EM model trained with collected labels
forest model first obtains the prediction of each decision treeand then combines them (e.g., using majority vote) to get thefinal prediction.
Figure 7(a) illustrates a simple random forest model, whichconsists of two decision trees, Tree1 and Tree2. Given arecord pair, Tree1 (Tree2) predicts it as matching if the jaccardsimilarity of their name (address) attribute values is largerthan 0.7 (0.8); otherwise, it is non-matching.
As shown in Figure 7(b), Tree1 and Tree2 divide all possiblerecord pairs into four regions. For each record pair,
• if it falls into R1 (f1 > 0.7 and f2 > 0.8), then Tree1
and Tree2 both predict it as matching;• if it falls into R2 (f1 ≤ 0.7 and f2 > 0.8), then Tree1
(Tree2) predicts it as matching (non-matching);• if it falls into R3 (f1 > 0.7 and f2 ≤ 0.8), then Tree1
(Tree2) predicts it as non-matching (matching);• if it falls into R4 (f1 < 0.7 and f2 < 0.8), then Tree1
and Tree2 both predict is as non-matching.
R1 and R4 are high-confidence regions since Tree1 andTree2 make consistent decisions while R2 and R3 are low-confidence regions since the decisions made by Tree1 andTree2 are inconsistent. Therefore, self-training selects unla-beled record pairs from R1∪R4, while active learning selectsunlabeled record pairs from R2 ∪R3.
6

Type Dataset Training Size Test Size # Attr.
Easy & SmallBeerAdvo-RateBeer 359 91 4
Fodors-Zagats 757 189 6iTunes-Amazon 430 109 8
Easy & Large DBLP-ACM 9890 2473 4DBLP-Scholar 22965 5742 4
Hard & LargeAmazon-Google 9167 2293 3Walmart-Amazon 8193 2049 5
Abt-Buy 7659 1916 3
TABLE III: EM datasets.
AutoML-EM-Active. Algorithm 1 shows the pseudo-code ofour hybrid active learning and self-training approach. Initially,AutoML-EM-Active asks humans to label a sample of recordpairs and trains an initial model. Then, it gets into theiteration stage. At each iteration, AutoML-EM-Active appliesthe current model to the unlabeled data and gets the labelconfidence score of each unlabeled record pair. The larger thescore, the more confident the inferred label. Let |ac batch|(|st batch|) denote the batch size of active learning (self-training), respectively. Like active learning, AutoML-EM-Activeselects a set of |ac batch| unlabeled record pairs that havethe lowest confidence scores and asks humans to label them.Like self-training, AutoML-EM-Active selects a set of |st batch|unlabeled record pairs that have the highest confidence scoresand add these record pairs along with their inferred labels tothe training data. AutoML-EM-Active retrains a model usingthe new training data. This iteration process repeats until thebudget is exhausted or the unlabeled data is empty.
Remarks. (1) AutoML-EM-Active is more general than activelearning. This is because active learning can be seen as aspecial case of AutoML-EM-Active when the self-training batchsize is set to zero, i.e., |st batch| = 0. (2) Let α denotethe percentage of the number of matching pairs in the initialtraining data T . To avoid the concept drift issue [17], we needto ensure that α keeps roughly the same between before andafter adding st batch to T . This can be achieved by choosingα · |st batch| matching pairs and (1 − α) · |st batch| non-matching pairs at each iteration of self-training.
V. EXPERIMENTS
We conduct extensive experiments on real-world benchmarkEM datasets to evaluate the performance of AutoML-EM. In thefollowing, we first describe the datasets and settings in Sec-tion V-A, followed by an end-to-end performance evaluationin Section V-B and a detailed performance analysis of AutoML-EM in Section V-C. In the end, we investigate whether AutoML-EM-Active outperforms the case where the self-labeling processis absent in Section V-D.
A. Datasets and Settings
Datasets. All of the benchmark datasets we use have beenevaluated in previous work [23], [28]. We categorize theminto three types: easy and small, easy and large, hard and large.Following the setting of [28], we further split the training set to
4:1, using the 80% for training and the rest 20% for validation.Table III shows a summary of the datasets.• BeerAdvo-RateBeer is a beer dataset with 450 record
pairs (68 positive) and four attributes: beer name, brewfactory name, style, ABV (Alcohol by Volume).
• Fodors-Zagats is a restaurant dataset with 946 recordpairs (110 positive) and six attributes: name, address, city,phone, type, and category code.
• iTunes-Amazon dataset includes 539 record pairs ofsongs (132 positive) with song name, artist name, albumname, genre, price, copyright, time, released attributes.
• DBLP-ACM is a publication dataset with 12363 recordpairs (2220 positive), including paper title, author andvenue attributes.
• DBLP-Scholar is also a publication dataset with 28707record pairs (5347 positive) and attributes: title, authors,venue, and year.
• Amazon-Google is a software product dataset with 11460record pairs (1167 positive) and three attributes: producttitle, manufacturer, and price.
• Walmart-Amazon is an electronic product dataset with10242 record (962 positive) and product name, category,brand, model number, and price attributes.
• Abt-Buy is also a product dataset with 9575 record pairs(1028 positive) and three attributes: product name, price,and long text descriptions.
AutoML-EM is our AutoML solution customized for EM. It isequipped with our feature generation approach (see Table II)and random forest as the selected model. AutoML-EM is builtupon an existing general-purpose AutoML tool, which iscapable of searching for the optimized ML pipeline given asearch space. In our experiments, we use auto-sklearn [1], [16],a popular open-sourced automated machine learning pythontoolkit, as our default tool and for evaluating our techniques.There are alternative tools written in other programming lan-guages or based on other algorithms, such as Auto-Weka [36],TPOT [4]. A data scientist can easily tailor these tools forAutoML-EM configurations.
Experimental Settings. Our experiments were run on aUbuntu 16.04 server with Intel Xeon E7-4830 v4 (2.00GHz)CPU and 960GB memory. For the training process, exceptotherwise stated, we set the default running time of auto-sklearn to 3600s. We use one hold-out method for modelvalidation. We choose F1 Score as the evaluation metric asdefined in Section II-B.
B. End-to-end Performance
We compare the end-to-end performance of AutoML-EMwith the state-of-the-art EM approaches.
Magellan [31] is the state-of-the-art learning-based end-to-end EM system on structured data. It keeps the developer inthe loop in every step and provides guidance for developingan end-to-end EM solution, including blocking algorithms,feature manipulation, and matching models. As we focus on
7

Dataset Magellan AutoML-EM ∆ F1 ScoreBeerAdvo-RateBeer 78.8 82.3 +3.5
Fodors-Zagats 100 100 +0iTunes-Amazon 91.2 96.3 +5.1
DBLP-ACM 98.4 98.4 +0DBLP-Scholar 92.3 94.6 +2.3
Amazon-Google 49.1 66.4 +17.3Walmart-Amazon 71.9 78.5 +6.6
Abt-Buy 43.6 59.2 +5.3Average 78.1 83.9 +5.8
TABLE IV: An end-to-end comparison between Magellan andAutoML-EM. The performance numbers of Magellan are copiedfrom [28].
the matching step, we assume that the blocking step is thesame for all methods and chose the matching benchmarkdatasets to compare the matching components of differentmethods.
DeepMatcher [28] is the state-of-the-art deep learning-basedsolution customized for EM problem. It processes the textcontent with NLP techniques like word embeddings andsummarizations, and trains RNN model for prediction. Dueto the use of deep learning, it performs better on textual data.
We compared the F1 Scores of AutoML-EM, Magellan, andDeepMatcher on eight EM datasets. Our goal is to answer thefollowing two questions.
Can AutoML-EM beat human? To answer this question, wecompare the models generated by AutoML-EM with the onesmanually developed by Magellan. Table IV shows the result.Note that the F1 Scores of Magellan was copied from [28].We can see that AutoML-EM improved human-developed mod-els by an average F1 Score of 5.7%. On some datasets,the performance gain is quite significant. For example, the∆F1 Scores between AutoML-EM and Magellan on iTunes-Amazon, Amazon-Google, Abt-Buy datasets are 8.8%, 17.3%,and 14%, respectively. The gain mainly comes from automatedfeature engineering and hyper-parameter tuning. These resultsvalidated the point that AutoML-EM can automatically developa much better model than the model developed by humansusing Magellan.
Can AutoML-EM beat deep learning? To answer this ques-tion, we compare the models automatically generated byAutoML-EM with the deep learning models generated by Deep-Matcher. Figure 8 shows the result. Note that the F1 Scores ofDeepMatcher were copied from [28]. We can see that AutoML-EM outperformed or was competitive with DeepMatcher ondatasets like BeerAdvo-RateBee, DBLP-ACM, DBLP-Scholar,Fodors-Zagats, Walmart-Amazon, and iTunes-Amazon. Theseresults were consistent with the results in the previous pa-per [28] that traditional machine learning models performbetter on structured data.
A surprising new finding is that AutoML-EM (with ran-dom forest models) achieved comparable performance withDeepMatcher (with deep learning models) on text data. For
0 20 40 60 80 100F1 Score on Test Data (%)
BeerAdvo-RateBeer
Fodors-Zagats
iTunes-Amazon
DBLP-ACM
DBLP-Scholar
Amazon-Google
Walmart-Amazon
Abt-Buy
72.7
100.0
88.0
98.4
94.7
69.3
66.9
62.8
80.9
100.0
95.7
98.1
94.6
63.8
79.9
58.1 DeepMatcherAutoML-EM
Fig. 8: Comparison of AutoML-EM with DeepMatcher. Theperformance numbers of DeepMatcher are copied from [28].
example, Amazon-Google and Abt-Buy are product datasetsthat contain very long text description attributes. Unlike Mag-ellan which performed much worse on these two datasets,we can see that AutoML-EM performed only slightly worsethan DeepMatcher even if DeepMatcher used complex NLPmodels and captured semantic synonyms. It is worth notingthat AutoML-EM had this major improvement over Magellanon textual data because it produced more features for longstrings (please compare Table I and Table II) and then leverageAutoML techniques to process and select features.
Takeaways. AutoML-EM can beat human-developed modelsby an average F1 Score of 5.7% and reach or exceed theperformance of deep learning models not only on structureddata but also on textual data.
C. AutoML-EM AnalysisIn this section, we decompose and analyze the benefits of
AutoML-EM by answering three questions:• Does the AutoML-EM feature generation approach lead to
better results? (§V-C1)• Does AutoML-EM with the random forest model selected
produce comparable results with all models selected?(§V-C2)
• In the resulting pipeline of AutoML-EM, does module,such as data preprocessing and feature preprocessing,contribute to the improved models? (§V-C3)
1) Effectiveness of Feature Vector Generation: We com-pared our feature generation process against the features gen-erated by Magellan library, i.e., Table I vs Table II. Specifically,we leveraged Magellan and AutoML-EM to convert record pairsto feature vectors, respectively, and then ran AutoML (nomodel selection) on both feature-vector tables and comparedthe results.
Figure 9 shows the number of generated features, F1 Scoreon test data, and the improvement achieved by the AutoML-EM feature generation approach. We can see that the AutoML-EM feature generation approach performed better on all thedatasets. The reason is that the AutoML-EM feature genera-tion approach conveyed more information and its AutoML
8

DatasetMagellan AutoML-EM ΔF1
Score# Feature Fscore #Feature Fscore
BeerAdvo-RateBeer 36 81.3 87 82.3 +1.0
Fodors-Zagats 37 100 123 100 +0
iTunes-Amazon 30 88.1 155 96.3 +8.2
DBLP-ACM 18 98.3 89 98.4 +0.1
DBLP-Scholar 18 92.6 89 94.6 +2.0
Amazon-Google 21 62.9 72 66.4 +3.5
Walmart-Amazon 32 66.2 106 78.5 +2.3
Abt-Buy 15 48.1 72 59.2 +11.1
Fig. 9: Comparing the F1 Scores of AutoML with Magellanvs AutoML-EM feature generation methods.
component can automatically select good features and processthem in a reasonable way. It is worth noting that Magellan’sperformance got improved after applying AutoML by compar-ing with Table IV. Thus, there is no need to use Magellan’smanually pre-defined rules for these datasets.Takeaways. It is recommended to use all similarity functions(rather than manually select them based on string length) togenerate feature vectors.
2) Effectiveness of Model Selection: Our second idea ofoptimizing a general-purpose AutoML tool for EM is to shrinkthe model selection space. We hope to accelerate convergencespeed and consequently allow the search algorithm to finda good ML pipeline in a shorter time. For comparison, werun two methods. i) all-model represents AutoML with theoriginal model repository provided by the library. Auto-sklearnbuilds in tens of common models such as AdaBoost, NaiveBayes, and Decision Trees. ii) Random Forest representsAutoML with only the random forest model selected.
Figure 10 shows how both validation and test scoreschanged as the time constraint increased. To compare all-modeland random forest, our main focus is on the validation scorebecause this is what AutoML tries to optimize. The test scoreis shown for reference purpose only.
We have the following observations. 1) For all the datasetsand both methods, the longer the running time, the betterthe validation score (there were small variations due to therandomness of auto-sklearn over different trials). For example,for the Amazon-Google dataset, AutoML-EM only has an F1Score of 56.1% when running for 60s, but achieved 62% with2400s running time. 2) random forest converged faster andachieved better validation scores when time constraints wereshorter. For example, for the Abt-Buy dataset, including all-models takes 6000s to achieve 62% F1 Score but it only takes1200s to achieve 62% F1 Score for AutoML-EM with randomforest model. all-model ended up with higher validation scoresbecause of the larger search space. This indicated that therewere other better models for each dataset. For example,Takeaways. The model selection customization should be
considered if the model is not running hours long, otherwiseAutoML with full model space is preferable.
3) AutoML-EM Pipeline Ablation Analysis: It is well rec-ognized that hyperparameter tuning is an effective way toimprove the model performance. Thus, in this experiment, weput our focus on the other two modules (data preprocessingand feature preprocessing).
To verify whether a module truly contributes to the finalresult, we did ablation experiments on the resulting pipelineof AutoML-EM. We selected the two most difficult datasetsbecause there is a big performance gap between using andnot using AutoML techniques. We followed the same settingas before: 3/5 for training, 1/5 for validation, and 1/5 fortesting, and trained AutoML-EM for one hour to get a resultingpipeline. We reported the F1 score on the validation set afterdisabling data preprocessing and feature processing for therandom forest model, respectively.
For example, consider an example pipeline gener-ated by AutoML-EM in Figure 11. To disable its pre-processing module, we set rescaling:__choice__,balancing:strategy to none. Similarly, we can setpreprocessor:__choice__ to no_preprocessingto disable data preprocessing module.
Figure 12 shows the result. We can see that AutoML-EM withall modules performed the best on both datasets. Excludingdata preprocessing and feature preprocessing modules leadsto model performance degrading. For example, after excludingdata preprocessing, the F1 Score dropped from 63.7 to 60.1on the Amazon-Google dataset, and dropped from 63.9 to56 on the Abt-Buy dataset. This result indicates that datapreprocessing is an effective module for the two datasets.The F1 Score continued to drop after excluding the featurepreprocessing module but not as dramatic as excluding datapreprocessing. Please note that the purpose of this experimentis not to show that data preprocessing is more effective thanfeature preprocessing. We are sure that there will be caseswhere feature preprocessing plays a more important role.Takeaways. In the resulting pipeline of AutoML-EM, both datapreprocessing and feature preprocessing modules contribute tothe improved models.
D. AutoML-EM-Active Evaluation
In this section, we aim to validate if AutoML-EM-Active iseffective in the active learning setting for EM. Specifically, wecompare the case where self-training is added as described inV-D2 and the case where only active learning is performed. Wecompare the two approaches under different parameter settingsas described below. AutoML-EM-Active targets to improvemodel performance by labeling more data points with no extrahuman cost.
1) Parameters: Initial training data size: Initial trainingdata is a random sample from the whole dataset. It is essentialto have a good initial model for both active learning and self-training. We experiment on three values for initial data size,i.e., 30, 100, and 500, standing for small, medium, and largeinitial training data.
9

Dataset Model Space Validation Score on Time Constraint Test Score on Time Constraint60 300 600 1200 2400 3600 6000 8400 60 300 600 1200 2400 3600 6000 8400
BeerAdvo-RateBeerall-model 93.6 95.9 97.2 97.9 100 100 100 100 80 80.3 76.5 80.8 72.8 79.3 77.5 78.8
random forest 92.9 98.6 98.6 99.3 100 100 100 100 78.8 81.4 81.5 78.3 79.5 80.9 79.8 78.9
Fodors-Zagatsall-model 100 100 100 100 100 100 100 100 100 100 100 100 100 100 100 100
random forest 100 100 100 100 100 100 100 100 100 100 100 100 100 100 100 100
iTunes-Amazonall-model 96.4 96 99.2 100 100 100 100 100 96 96.1 97.9 94.9 95.1 96.4 96.5 94.5
random forest 97.2 98.4 99.2 100 100 100 100 100 95.3 95.5 94.9 96.9 96.5 95.7 96.4 97.8
DBLP-ACMall-model 98.5 98.5 98.6 98.7 98.9 98.9 98.9 98.9 98.4 98.4 98.4 98.4 98.5 98.4 98.5 98.4
random forest 98.7 98.7 98.7 98.7 98.9 98.8 99 99 98 98.2 97.9 98.1 98.3 98.1 98.2 97.9
DBLP-Scholarall-model 94.5 94.5 94.6 95 95.1 95.2 95.4 95.5 94.2 94.2 94.4 94.8 95 95 95.3 95.2
random forest 94.5 94.6 94.6 94.7 94.9 94.9 94.9 95.0 94.2 94.3 94.5 94.3 94.6 94.6 94.4 94.5
Amazon-Googleall-model 56.0 56.3 56.3 57.4 61.5 60.2 62.2 63.4 60.4 60.7 58.1 60.0 64.0 63.2 63.6 63.4
random forest 56.1 57.1 59.7 61.7 62 61.8 62.6 63.1 60.1 61.5 61.9 65 64.9 63.8 64.7 64.6
Walmart-Amazonall-model 78.2 78.2 78.8 79.2 82.1 83.5 83.6 83.9 78.2 78.2 78.6 77.2 79.1 78.6 79.8 80
random forest 78.2 78.9 79.2 79.3 81.4 80.3 80.5 81.3 78.2 79.2 78.6 78.6 79 79.9 78.9 79.6
Abt-Buyall-model 53.9 54.2 55.2 58 60.5 60.9 62.1 61.8 54.6 54.6 55.3 57.5 59 56.5 57.7 58.5
random forest 55 59.1 60.8 62.2 62.8 62.6 63.5 63.2 55.9 56.1 56.9 58.9 58.8 58.1 58.7 57.8
Fig. 10: Model Selection for AutoML-EM. The darker the cell color, the higher the F1 Score.
Pipeline{ 'balancing:strategy': 'weighting', 'rescaling:__choice__': 'robust_scaler', 'rescaling:robust_scaler:q_min': 0.19454891546620004,
'rescaling:robust_scaler:q_max': 0.9194022794180152,
'preprocessor:__choice__': 'select_percentile_classification', 'preprocessor:select_percentile_classification:percentile': 55.84285592896699, 'preprocessor:select_percentile_classification:score_func': 'f_classif', 'classifier:__choice__': 'random_forest', 'classifier:random_forest:bootstrap': 'True', 'classifier:random_forest:criterion': 'gini', 'classifier:random_forest:max_depth': 'None', 'classifier:random_forest:max_features': 0.9008519355763185, 'classifier:random_forest:max_leaf_nodes': 'None', 'classifier:random_forest:min_impurity_decrease': 0.0, 'classifier:random_forest:min_samples_leaf': 2, 'classifier:random_forest:min_samples_split': 6, 'classifier:random_forest:min_weight_fraction_leaf': 0.0, 'classifier:random_forest:n_estimators': 100, }
Fig. 11: Example AutoML-EM pipeline.
Dataset AutoML-EM (Excluding DP and FP)
AutoML-EM (Excluding DP) AutoML-EM
Amazon-Google 59.3 60.1 63.7
Abt-Buy 55.7 56.0 63.9
Fig. 12: AutoML-EM validation F1 Score by excluding modules(DP = Data Preprocessing, FP = Feature Preprocessing).
Dataset Method# of Active Learning Labels
40 160 400
Amazon-GoogleAC + AutoML-EM 32.8 41.6 48.3
AutoML-EM-Active 50.1 56.5 54.8
Abt-BuyAC + AutoML-EM 34.0 39.7 45.2
AutoML-EM-Active 42.8 45.1 52.9
Fig. 13: Comparing the test F1 Score between AutoML-EM andAC + AutoML-EM under different labeling budgets (init = 500and st batch = 200)
Active-learning batch size (ac batch): Active learning batchsize is the uncertain examples labeled at each iteration. Thisis the only human cost. We experiment on three values: 2, 8,and 20.Self-training batch size (st batch): We select a fixed batchof confident data examples for label inference. We experimenton four values: 0, 20, 50, and 200. Note that when st batchis 0, it is equivalent to AC. We run both approaches for 20iterations. A data scientist can customize the cut-off conditionbased on the labeling budget.
2) Evaluations: Recall that there are three types of datasetshere: easy & small, easy & large, hard & large. For theeasy datasets, a few iterations of active learning can alreadyreturn a very good model. We show the evaluation on the twomost difficult datasets (Amazon-Google and Abt-Buy). Ourapproach AutoML-EM-Active runs AutoML-EM on both activelearning and self-training labels. We call the baseline approachAC + AutoML-EM, which is to run AutoML-EM on the activelearning labels only.
We first examine how effective self-training is to AutoML-EM. We varied the number of active learning labels and com-pared the test F1 Score between AutoML-EM-Active and AC +AutoML-EM (init = 500 and st batch = 200). Figure 13 showsthe comparison results. We can see that AutoML-EM-Activesignificantly outperformed AC + AutoML-EM. For instance,
10
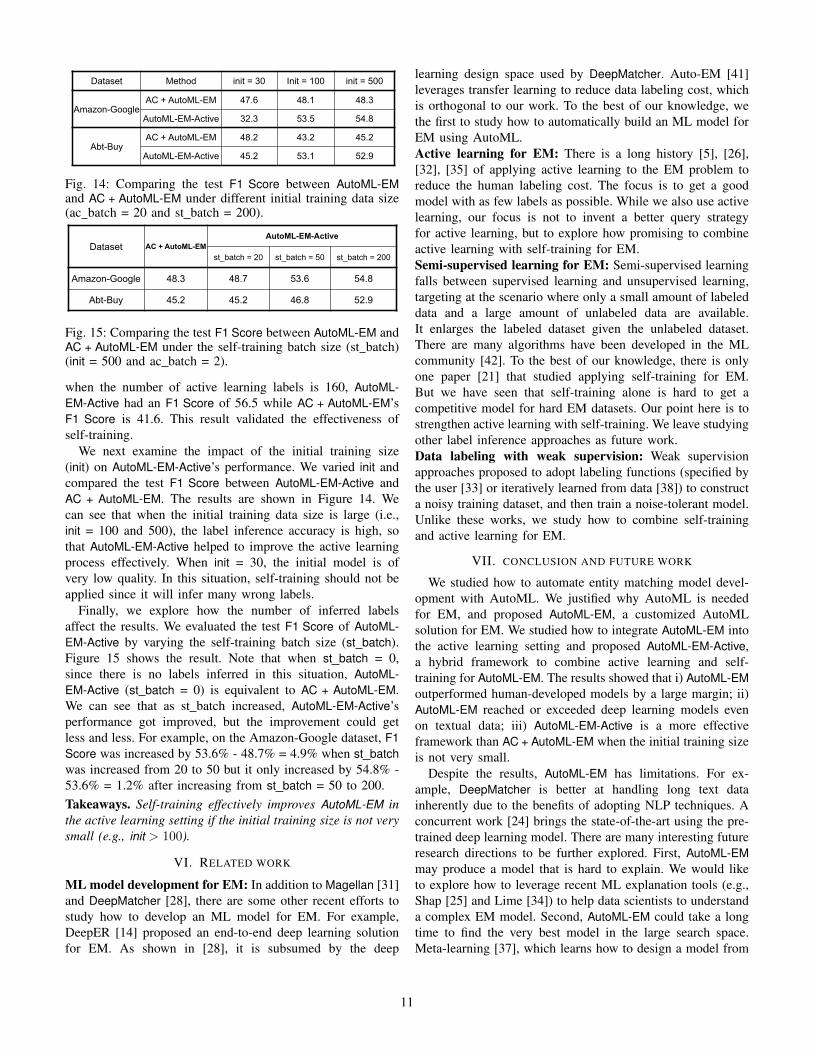
Dataset Method init = 30 Init = 100 init = 500
Amazon-GoogleAC + AutoML-EM 47.6 48.1 48.3
AutoML-EM-Active 32.3 53.5 54.8
Abt-BuyAC + AutoML-EM 48.2 43.2 45.2
AutoML-EM-Active 45.2 53.1 52.9
Fig. 14: Comparing the test F1 Score between AutoML-EMand AC + AutoML-EM under different initial training data size(ac batch = 20 and st batch = 200).
Dataset AC + AutoML-EMAutoML-EM-Active
st_batch = 20 st_batch = 50 st_batch = 200
Amazon-Google 48.3 48.7 53.6 54.8
Abt-Buy 45.2 45.2 46.8 52.9
Fig. 15: Comparing the test F1 Score between AutoML-EM andAC + AutoML-EM under the self-training batch size (st batch)(init = 500 and ac batch = 2).
when the number of active learning labels is 160, AutoML-EM-Active had an F1 Score of 56.5 while AC + AutoML-EM’sF1 Score is 41.6. This result validated the effectiveness ofself-training.
We next examine the impact of the initial training size(init) on AutoML-EM-Active’s performance. We varied init andcompared the test F1 Score between AutoML-EM-Active andAC + AutoML-EM. The results are shown in Figure 14. Wecan see that when the initial training data size is large (i.e.,init = 100 and 500), the label inference accuracy is high, sothat AutoML-EM-Active helped to improve the active learningprocess effectively. When init = 30, the initial model is ofvery low quality. In this situation, self-training should not beapplied since it will infer many wrong labels.
Finally, we explore how the number of inferred labelsaffect the results. We evaluated the test F1 Score of AutoML-EM-Active by varying the self-training batch size (st batch).Figure 15 shows the result. Note that when st batch = 0,since there is no labels inferred in this situation, AutoML-EM-Active (st batch = 0) is equivalent to AC + AutoML-EM.We can see that as st batch increased, AutoML-EM-Active’sperformance got improved, but the improvement could getless and less. For example, on the Amazon-Google dataset, F1Score was increased by 53.6% - 48.7% = 4.9% when st batchwas increased from 20 to 50 but it only increased by 54.8% -53.6% = 1.2% after increasing from st batch = 50 to 200.Takeaways. Self-training effectively improves AutoML-EM inthe active learning setting if the initial training size is not verysmall (e.g., init > 100).
VI. RELATED WORK
ML model development for EM: In addition to Magellan [31]and DeepMatcher [28], there are some other recent efforts tostudy how to develop an ML model for EM. For example,DeepER [14] proposed an end-to-end deep learning solutionfor EM. As shown in [28], it is subsumed by the deep
learning design space used by DeepMatcher. Auto-EM [41]leverages transfer learning to reduce data labeling cost, whichis orthogonal to our work. To the best of our knowledge, wethe first to study how to automatically build an ML model forEM using AutoML.Active learning for EM: There is a long history [5], [26],[32], [35] of applying active learning to the EM problem toreduce the human labeling cost. The focus is to get a goodmodel with as few labels as possible. While we also use activelearning, our focus is not to invent a better query strategyfor active learning, but to explore how promising to combineactive learning with self-training for EM.Semi-supervised learning for EM: Semi-supervised learningfalls between supervised learning and unsupervised learning,targeting at the scenario where only a small amount of labeleddata and a large amount of unlabeled data are available.It enlarges the labeled dataset given the unlabeled dataset.There are many algorithms have been developed in the MLcommunity [42]. To the best of our knowledge, there is onlyone paper [21] that studied applying self-training for EM.But we have seen that self-training alone is hard to get acompetitive model for hard EM datasets. Our point here is tostrengthen active learning with self-training. We leave studyingother label inference approaches as future work.Data labeling with weak supervision: Weak supervisionapproaches proposed to adopt labeling functions (specified bythe user [33] or iteratively learned from data [38]) to constructa noisy training dataset, and then train a noise-tolerant model.Unlike these works, we study how to combine self-trainingand active learning for EM.
VII. CONCLUSION AND FUTURE WORK
We studied how to automate entity matching model devel-opment with AutoML. We justified why AutoML is neededfor EM, and proposed AutoML-EM, a customized AutoMLsolution for EM. We studied how to integrate AutoML-EM intothe active learning setting and proposed AutoML-EM-Active,a hybrid framework to combine active learning and self-training for AutoML-EM. The results showed that i) AutoML-EMoutperformed human-developed models by a large margin; ii)AutoML-EM reached or exceeded deep learning models evenon textual data; iii) AutoML-EM-Active is a more effectiveframework than AC + AutoML-EM when the initial training sizeis not very small.
Despite the results, AutoML-EM has limitations. For ex-ample, DeepMatcher is better at handling long text datainherently due to the benefits of adopting NLP techniques. Aconcurrent work [24] brings the state-of-the-art using the pre-trained deep learning model. There are many interesting futureresearch directions to be further explored. First, AutoML-EMmay produce a model that is hard to explain. We would liketo explore how to leverage recent ML explanation tools (e.g.,Shap [25] and Lime [34]) to help data scientists to understanda complex EM model. Second, AutoML-EM could take a longtime to find the very best model in the large search space.Meta-learning [37], which learns how to design a model from
11

historical ML tasks, is a promising idea. We plan to investigatewhether it can be applied to speed up AutoML-EM. Third,AutoML-EM-Active is a general idea to combine active learningand self-training for AutoML-EM. This paper shows the greatpotential of this idea. We would like to extend it to otheractive learning algorithms, such as query by committee andmaximum margin, in the future.
VIII. ACKNOWLEDGMENT
This work was supported in part by Mitacs through anAccelerate Grant, NSERC through discovery grants and aCRD grant. All opinions, findings, conclusions and recom-mendations in this paper are those of the authors and do notnecessarily reflect the views of the funding agencies.
REFERENCES
[1][2] Dedupe.io. https://dedupe.io/.[3] sklearn.preprocessing.RobustScaler. https://scikit-learn.org/stable/
modules/generated/sklearn.preprocessing.RobustScaler.html.[4] TPOT. https://epistasislab.github.io/tpot/.[5] A. Arasu, M. Gotz, and R. Kaushik. On active learning of record match-
ing packages. In Proceedings of the 2010 ACM SIGMOD InternationalConference on Management of data, pages 783–794, 2010.
[6] K. Bellare, S. Iyengar, A. G. Parameswaran, and V. Rastogi. Activesampling for entity matching. In Proceedings of the 18th ACM SIGKDDinternational conference on Knowledge discovery and data mining,pages 1131–1139, 2012.
[7] J. S. Bergstra, R. Bardenet, Y. Bengio, and B. Kegl. Algorithmsfor hyper-parameter optimization. In Advances in neural informationprocessing systems, pages 2546–2554, 2011.
[8] E. Bringer, A. Israeli, A. Ratner, and C. Re. Osprey: Weak supervisionof imbalanced extraction problems without code. In Proceedings ofthe 3rd International Workshop on Data Management for End-to-EndMachine Learning, page 4. ACM, 2019.
[9] R. Cappuzzo, P. Papotti, and S. Thirumuruganathan. Creating embed-dings of heterogeneous relational datasets for data integration tasks. InProceedings of the 2020 ACM SIGMOD International Conference onManagement of Data, pages 1335–1349, 2020.
[10] X. Chen, Y. Xu, D. Broneske, G. C. Durand, R. Zoun, and G. Saake.Heterogeneous committee-based active learning for entity resolution(healer). In European Conference on Advances in Databases andInformation Systems, pages 69–85. Springer, 2019.
[11] P. Christen. Automatic record linkage using seeded nearest neighbourand support vector machine classification. In Proceedings of the 14thACM SIGKDD international conference on Knowledge discovery anddata mining, pages 151–159. ACM, 2008.
[12] P. Christen. The data matching process. In Data Matching, pages 23–35.Springer, 2012.
[13] X. L. Dong and T. Rekatsinas. Data integration and machine learning:A natural synergy. In Proceedings of the 2018 International Conferenceon Management of Data, pages 1645–1650. ACM, 2018.
[14] M. Ebraheem, S. Thirumuruganathan, S. Joty, M. Ouzzani, and N. Tang.Distributed representations of tuples for entity resolution. Proceedingsof the VLDB Endowment, 11(11):1454–1467, 2018.
[15] M. Feurer, A. Klein, K. Eggensperger, J. Springenberg, M. Blum, andF. Hutter. Efficient and robust automated machine learning. In C. Cortes,N. D. Lawrence, D. D. Lee, M. Sugiyama, and R. Garnett, editors,Advances in Neural Information Processing Systems 28, pages 2962–2970. Curran Associates, Inc., 2015.
[16] M. Feurer, A. Klein, K. Eggensperger, J. Springenberg, M. Blum, andF. Hutter. Efficient and robust automated machine learning. In Advancesin neural information processing systems, pages 2962–2970, 2015.
[17] J. Gama, I. Zliobaite, A. Bifet, M. Pechenizkiy, and A. Bouchachia. Asurvey on concept drift adaptation. ACM computing surveys (CSUR),46(4):1–37, 2014.
[18] C. Gokhale, S. Das, A. Doan, J. F. Naughton, N. Rampalli, J. Shavlik,and X. Zhu. Corleone: hands-off crowdsourcing for entity matching.In Proceedings of the 2014 ACM SIGMOD international conference onManagement of data, pages 601–612. ACM, 2014.
[19] F. Hutter, H. H. Hoos, and K. Leyton-Brown. Sequential model-based optimization for general algorithm configuration. In Internationalconference on learning and intelligent optimization, pages 507–523.Springer, 2011.
[20] F. Hutter, L. Kotthoff, and J. Vanschoren. Automated Machine Learning.Springer, 2019.
[21] M. Kejriwal and D. P. Miranker. Semi-supervised instance matchingusing boosted classifiers. In European semantic web conference, pages388–402. Springer, 2015.
[22] H. Kopcke and E. Rahm. Frameworks for entity matching: A compari-son. Data & Knowledge Engineering, 69(2):197–210, 2010.
[23] H. Kopcke, A. Thor, and E. Rahm. Evaluation of entity resolutionapproaches on real-world match problems. Proceedings of the VLDBEndowment, 3(1-2):484–493, 2010.
[24] Y. Li, J. Li, Y. Suhara, A. Doan, and W.-C. Tan. Deep entitymatching with pre-trained language models. Proceedings of the VLDBEndowment, 14(1):50–60, 2020.
[25] S. M. Lundberg and S.-I. Lee. A unified approach to interpreting modelpredictions. In Advances in neural information processing systems, pages4765–4774, 2017.
[26] V. V. Meduri, L. Popa, P. Sen, and M. Sarwat. A comprehensivebenchmark framework for active learning methods in entity matching.In Proceedings of the 2020 ACM SIGMOD International Conference onManagement of Data, pages 1133–1147, 2020.
[27] B. Mozafari, P. Sarkar, M. Franklin, M. Jordan, and S. Madden. Scalingup crowd-sourcing to very large datasets: a case for active learning.Proceedings of the VLDB Endowment, 8(2):125–136, 2014.
[28] S. Mudgal, H. Li, T. Rekatsinas, A. Doan, Y. Park, G. Krishnan, R. Deep,E. Arcaute, and V. Raghavendra. Deep learning for entity matching:A design space exploration. In Proceedings of the 2018 InternationalConference on Management of Data, pages 19–34. ACM, 2018.
[29] G. Papadakis, J. Svirsky, A. Gal, and T. Palpanas. Comparative analysisof approximate blocking techniques for entity resolution. Proceedingsof the VLDB Endowment, 9(9):684–695, 2016.
[30] F. Pedregosa, G. Varoquaux, A. Gramfort, V. Michel, B. Thirion,O. Grisel, M. Blondel, P. Prettenhofer, R. Weiss, V. Dubourg, J. Vander-plas, A. Passos, D. Cournapeau, M. Brucher, M. Perrot, and E. Duch-esnay. Scikit-learn: Machine learning in Python. Journal of MachineLearning Research, 12:2825–2830, 2011.
[31] S. D. Pradap Konda, P. S. GC, A. Doan, A. Ardalan, J. R. Ballard,H. Li, F. Panahi, H. Zhang, J. Naughton, S. Prasad, et al. Magellan:Toward building entity matching management systems. Proceedings ofthe VLDB Endowment, 9(12), 2016.
[32] K. Qian, L. Popa, and P. Sen. Active learning for large-scale entityresolution. In Proceedings of the 2017 ACM on Conference onInformation and Knowledge Management, pages 1379–1388, 2017.
[33] A. Ratner, S. H. Bach, H. Ehrenberg, J. Fries, S. Wu, and C. Re. Snorkel:Rapid training data creation with weak supervision. Proceedings of theVLDB Endowment, 11(3):269–282, 2017.
[34] M. T. Ribeiro, S. Singh, and C. Guestrin. ”why should i trust you?”explaining the predictions of any classifier. In Proceedings of the 22ndACM SIGKDD international conference on knowledge discovery anddata mining, pages 1135–1144, 2016.
[35] S. Sarawagi and A. Bhamidipaty. Interactive deduplication using activelearning. In Proceedings of the eighth ACM SIGKDD internationalconference on Knowledge discovery and data mining, pages 269–278,2002.
[36] C. Thornton, F. Hutter, H. H. Hoos, and K. Leyton-Brown. Auto-weka:Combined selection and hyperparameter optimization of classificationalgorithms. In Proceedings of the 19th ACM SIGKDD internationalconference on Knowledge discovery and data mining, pages 847–855.ACM, 2013.
[37] J. Vanschoren. Meta-learning: A survey. arXiv preprintarXiv:1810.03548, 2018.
[38] P. Varma and C. Re. Snuba: automating weak supervision to labeltraining data. Proceedings of the VLDB Endowment, 12(3):223–236,2018.
[39] J. Wang, G. Li, T. Kraska, M. J. Franklin, and J. Feng. Leveragingtransitive relations for crowdsourced joins. In Proceedings of the 2013ACM SIGMOD International Conference on Management of Data, pages229–240, 2013.
[40] Q. Yao, M. Wang, Y. Chen, W. Dai, H. Yi-Qi, L. Yu-Feng, T. Wei-Wei,Y. Qiang, and Y. Yang. Taking human out of learning applications: A sur-vey on automated machine learning. arXiv preprint arXiv:1810.13306,2018.
[41] C. Zhao and Y. He. Auto-em: End-to-end fuzzy entity-matching usingpre-trained deep models and transfer learning. In The World Wide WebConference, pages 2413–2424. ACM, 2019.
[42] X. J. Zhu. Semi-supervised learning literature survey. Technical report,University of Wisconsin-Madison Department of Computer Sciences,2005.
[43] X. Zhu and Z. Ghahramani. Learning from labeled and unlabeled datawith label propagation. 2002.
12