e lab 080 user guide eng
TRANSCRIPT
ELAB-080
User Guide


Ing. David Prevorovsky Na brevnovske plani 67, 169 00 , Prague 6
Czech Republic tel : +420 777 594 295
e-mail : [email protected]
DYNON INSTRUMENTS Woodinville, WA 98072, USA
www.dynoninstruments.com
Manufacturer Distributor & Service
Guitariano s.r.o.Krajníkova 141, 252 29 , Dobřichovice
Czech Republic tel/fax : +420 318 593 433 e-mail : [email protected]
www.guitariano.com
Content 1 Safety precautions............................................................................................................5
1.1.1 Using AC/DC adaptor.........................................................................................5 1.1.2 Using ELAB-080 instrument...............................................................................5
2 Warranty conditions..........................................................................................................5 3 ELAB-080 Specifications..................................................................................................6 4 Minimal host computer requirements...............................................................................7 5 Package Content..............................................................................................................7 6 Short ELAB-080 description.............................................................................................8 7 Introduction.......................................................................................................................9 8 Connecting of ELAB-080 instrument to host PC..............................................................9 9 Installing the Elab-080 Software.......................................................................................9 10 Using the Elab-080 ......................................................................................................12
10.1 Description of application main window................................................................13 11 Using of the Digital Oscilloscope, Logic Analyzer, and Spectrum Analyzer..................14
11.1 Tab control "Data Capture"....................................................................................14 11.1.1 Using the Data Sampling Settings..................................................................15 11.1.2 Using the Trigger Settings..............................................................................16 11.1.3 Using the Digital Oscilloscope Settings..........................................................17 11.1.4 Using the Logic Analyzer Settings..................................................................18
The "LA" tab...........................................................................................................18The "Buses" tab.....................................................................................................19
11.1.5 Using the Spectrum Analyzer Settings...........................................................20 11.2 The Digital Oscilloscope Display Window .............................................................21
11.2.1 DSO window context menu............................................................................24 11.3 The Logic Analyzer Display Window......................................................................26
11.3.1 LA window trace label context menu..............................................................27 11.3.2 LA window display area context Menu...........................................................27
11.4 The Spectrum Analyzer Display Window ..............................................................28 11.4.1 SA window context menu...............................................................................29
12 Using the Arbitrary Waveform Generator......................................................................30 12.1 Tab control "AWG".................................................................................................30
12.1.1 Using "Analog" tab.........................................................................................31 12.1.2 Using "Digital" tab..........................................................................................33
12.2 The AWG Display Window....................................................................................34 12.2.1 AWG window context menu...........................................................................35
12.3 Using Preset Waveforms.......................................................................................35 12.4 Creating and using custom waveforms.................................................................36
12.4.1 Creating a Waveform Based on a Preset Waveform......................................37 12.4.2 Editing a Waveform by Drawing with the Mouse............................................37 12.4.3 Editing a Waveform by Using an External Editor...........................................37 12.4.4 Using a Custom Waveform............................................................................38
13 Using the Programmable Clock Generator...................................................................39 14 Using the Programmable Power Supply.......................................................................40 15 Technical Support.........................................................................................................41
15.1 Software Upgrades ...............................................................................................41 15.2 Troubleshooting Elab Problems............................................................................41
1
1 Safety precautionsBefore using the instrument be sure to read carefully next instructions and You will ensure long and trouble-free operation of the instrument. Please keep this guide for future reference.
1.1.1 Using AC/DC adaptor Use only the specified adapter, which is distributed within the ELAB-080 instrument Take care to avoid any damage to or breakage of the power cord. Never place any heavy
objects on the power cord or expose it to direct heat. Doing so creates the danger of power cord damage, fire, and electrical shock.
For safety sake, be sure to unplug the AC/DC adapter from the wall outlet whenever leaving the device for a long time.
1.1.2 Using ELAB-080 instrument Do not open the device or attempt to disassemble the internal parts or modify them in any way.
The instrument contains no user-serviceable parts. If it should appear to be malfunctioning, discontinue use immediately and have it inspected by service personnel (noted on title page)
Do not expose the device to excessive dust or vibrations, or extreme cold or heat (such as direct sunlight, near a heater, or in a car during the day) to prevent the possibility of damage to the internal components.
Never place any heavy objects on the device to avoid any damage of it. Do not place the device in an unstable position where it might accidentally fall over.
2 Warranty conditionsThe OSCILOSKOPY.COM and Guitariano s.r.o. company (further distributor) and manufacture Dynon Instruments guarantees reliable operation of the ELAB-080 oscilloscope in compliance with this documentation during a period of 24 months from the date of purchase. Should a malfunction occur during the warranty period, excluding errors for which distributor can not be held responsible (mechanical damage, attrition, natural disaster, non-standard effect influence e.g. overvoltage in power grid) distributor guarantees the repair of the product or its replacement with a new or repaired one free of charge. The distributor and manufacture company shall not be responsible for malfunctions on the device caused by an accident, incorrect manipulation, unauthorized interventions or similar. When requesting the warranty service, the customer should send the device in its original package to the distributor from whom it was purchased or directly to the manufacturer's company. The customer agrees that a new or repaired product to be shipped would be insured against damage or loss during the transport and that he will cover the costs for the shipment and insurance.
2
3 ELAB-080 SpecificationsA) Digital oscilloscope and Logic AnalyzerNumber of Analog Channels: 2Number of Digital Channels: 16Maximum Sample Rate: 80 MS/sAvailable Sample Rates: (1, 2, 5, 10, 20, 50, 100, 200, 500)KHz
(1, 2, 5, 10, 20, 40, 80)MHz 1KHz-80Mhz arbitrary sample rates
DSO and LA sample synchronouslyMaximum Memory Depth: 32K samplesAvailable Capture Depths: 1K, 2K, 4K, 8K, 16K, or 32K samplesHorizontal Range: 2 nS/div to 5 S/div in 1, 2, 5 stepsTrigger Types: Analog Rising, Analog Falling, Bits 0-3 of Logic AnalyzerTrigger Delay Range: +/- 100% of full capture lengthAnalog Channels:
Vertical Resolution: 8 bitsInput Impedance: 1 M # || 11pFMaximum Input (no damage): 130 Vrms at BNC connectorMaximum Measureable Signal: 5V peak-peak-3dB analog BW: DC coupled: DC to 60MHz
AC coupled: 1Hz to 60MHzVertical Range: 1X probe: 5mV/div to 500mV/div
10X probe: 20mV/div to 10V/divOffset Range: +/- 4 divisions (Full screen)Trigger Range: +/- 4 divisions (Full screen)
Digital Channels:Vertical Resolution: 1 bitInput Impedance: 100KΩ || typically 4.5pF, max 6pFInput Threshold: Vhigh = 2.0V, Vlow = 0.8VMaximum Input: -0.5 to +7.0VVirtual Bus Display: Binary, Decimal, Hex, Octal
B) Arbitrary Waveform GeneratorNumber of Analog Channels: 1Number of Digital Channels: 5Max Sample Rate: 100MHzAvailable Sample Rates: 1KHz to 100MHz, Arbitrary, ~.036% stepsMax number of samples: 64KsamplesAvailable Playback Depths: 10 - 65,536 Samples, inclusivePlayback types: Single Shot, Repeating, TriggeredTrigger Voltage: 2.6VMaximum Trigger Input: -0.5V to +6.5VTrigger Delay: typically 7 sample clock cyclesArbitrary Waveform Input: Built-in, GUI, or FileAnalog Channel:
Vertical Resolution: 10 bitsMaximum Output Voltage: +/- 3V (waveform + DC offset) Maximum Waveform Amplitude: +/- 1.1V (1x mode) , +/- 3.0V (4x mode)Minimum Output Step Size: 2.5mV typ. (1x mode), 10mV typ. (4x mode)DC Offset Range: +/- 3V (3)Output Impedance: 50Ω-3dB Analog Bandwidth: 20 MHzInternal Waveform Generation: Sine, Triangle, Square, Sawtooth
Digital Channels:Vertical Resolution: 1 bitOutput Voltages: 0V, 3.3VMaximum Output Current : +/- 24mA (per channel)
3 ELAB-080 User Guide

C) Programmable Clock Generator Number of Digital Channels: 2Maximum Clock Frequency: 150MHzAvailable Clock Frequencies: 1KHz to 150MHz, Arbitrary, ~.036% stepsOutput Voltage: 0V, 3.3VMaximum Output Current: +/- 24mA (per clock)
D) Programmable Power SupplyNumber of Independent Outputs: 2Maximum Output Voltage: +/- 10VVoltage Adjustment Steps: +/- 100mVVoltage Accuracy: +/- 5mV @ 50mA loadMaximum Output Current: +/- 60mA , Typically 100mA @ 3VE) General SpecificationsPower Supply Input Voltage: 105-130VAC/50-60Hz or 230VAC/50HzOperating Temperature Range: 0 – 104 Degrees F , 0 - 40 Degrees C (Non-Condensing)Dimensions: 7.25” X 4.92” X 1.65” (W X D X H), 184mm X 125mm X 42mmWeight: 22.4oz , 635g (Elab unit) , 25.4oz, 720g (Power Supply)Time base accuracy +/- 0.2%
4 Minimal host computer requirementsPC : Pentium 133MHz
32MB operational memoryUSB interface(type 1.1. or higher)
OS: Windows 98SE, ME, 2000 or XP
5 Package Content• The Elab-080 unit • The Elab-080 power supply • A USB cable (for connecting the Elab to your PC) • (2) 60 Mhz oscilloscope probes (for use with the digital oscilloscope and arbitrary waveform
generator) • (3) multi-wire color-coded breakout cables (two 16-wire cables and one 20-wire cable - for
use with the logic analyzer, programmable clocks, and programmable power supplies)
4 ELAB-080 User Guide
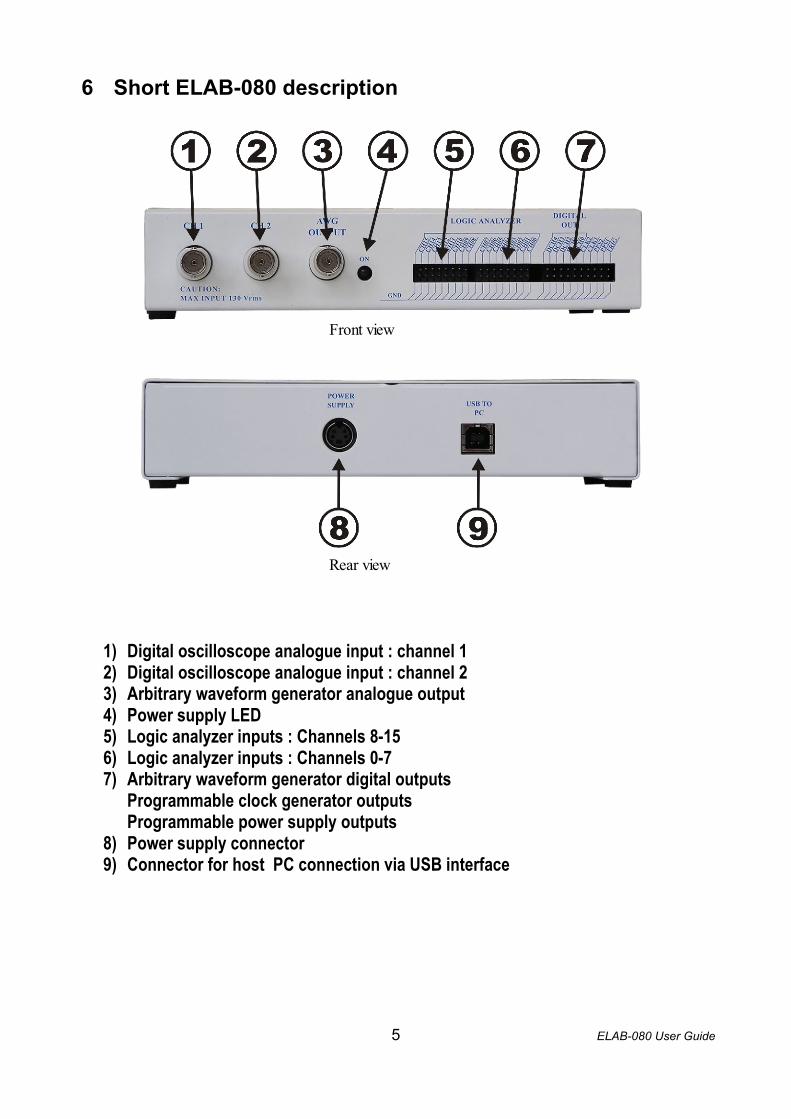
6 Short ELAB-080 description
1) Digital oscilloscope analogue input : channel 1 2) Digital oscilloscope analogue input : channel 2 3) Arbitrary waveform generator analogue output4) Power supply LED 5) Logic analyzer inputs : Channels 8-156) Logic analyzer inputs : Channels 0-77) Arbitrary waveform generator digital outputs
Programmable clock generator outputsProgrammable power supply outputs
8) Power supply connector9) Connector for host PC connection via USB interface
5 ELAB-080 User Guide
Front view
Rear view
7 IntroductionWe would like to thank You for purchasing the ELAB-080 instrument. We believe it will meet your expectations. If You have any question about the ELAB-080 instruments, please do not hesitate contact us by email, phone or fax or preferably by e-mail (contact address is noted in title page of this guide). If You are interested in out other products, please visit our websites : www.osciloskopy.com or www.guitariano.com
8 Connecting of ELAB-080 instrument to host PCThe Elab-080 is easy to get up and running, just follow these simple steps:
1) Unpack the USB cable. Notice that one end of the cable has a mostly square connector and the other end has a rectangular connector.
2) Plug the rectangular end of the USB cable into an open USB port on your PC. 3) Plug the mostly square end of the USB cable into the "USB to PC" input on the Elab-080. 4) Unpack and plug the power supply into a wall outlet. 5) Plug the round power supply connector into the Elab-080's "Power Supply" input. 6) Note: When the USB cable is plugged in to both the PC and the Elab-080, a dialog box
should appear on your PC, informing you that a new device was detected. Follow the instructions in the dialog box, restarting your PC if necessary.
9 Installing the Elab-080 SoftwareSoftware for ELAB-080 is available from 2 sources :
1) CD-ROM shipped with ELAB-080 instrument2) Download from web sites : www.osciloskopy.com or www.dynoninstruments.com.
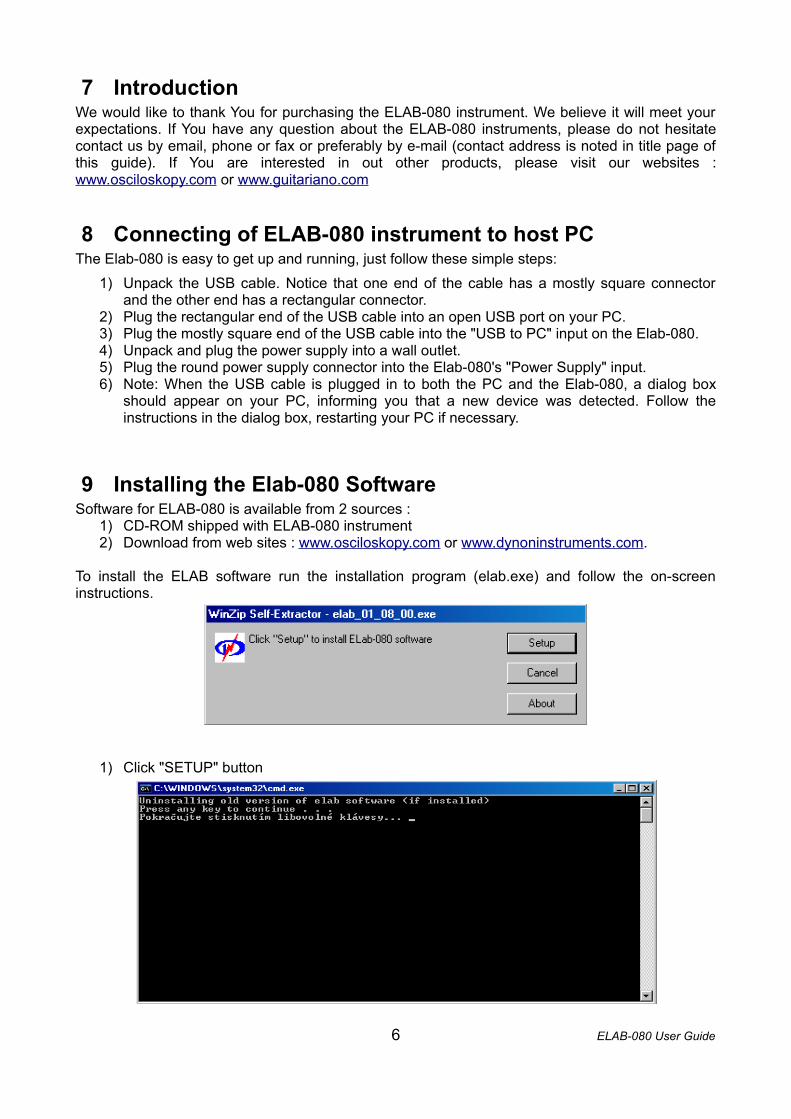
To install the ELAB software run the installation program (elab.exe) and follow the on-screen instructions.
1) Click "SETUP" button
6 ELAB-080 User Guide
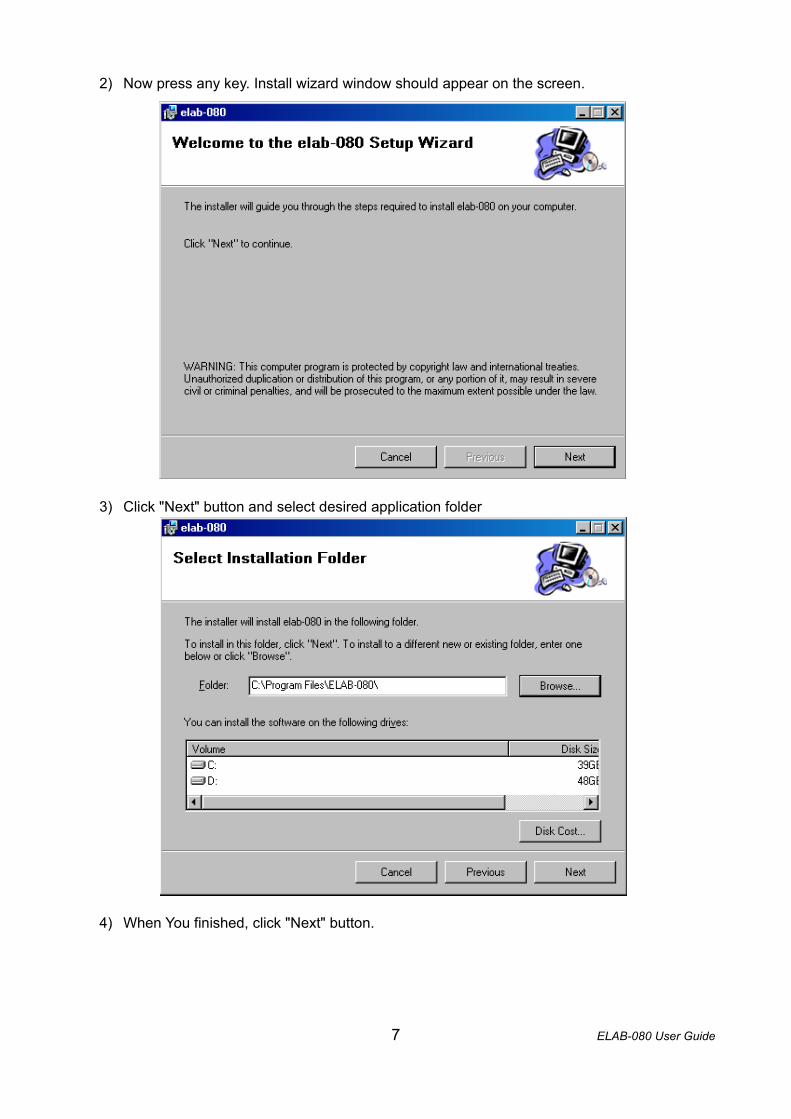
2) Now press any key. Install wizard window should appear on the screen.
3) Click "Next" button and select desired application folder
4) When You finished, click "Next" button.
7 ELAB-080 User Guide
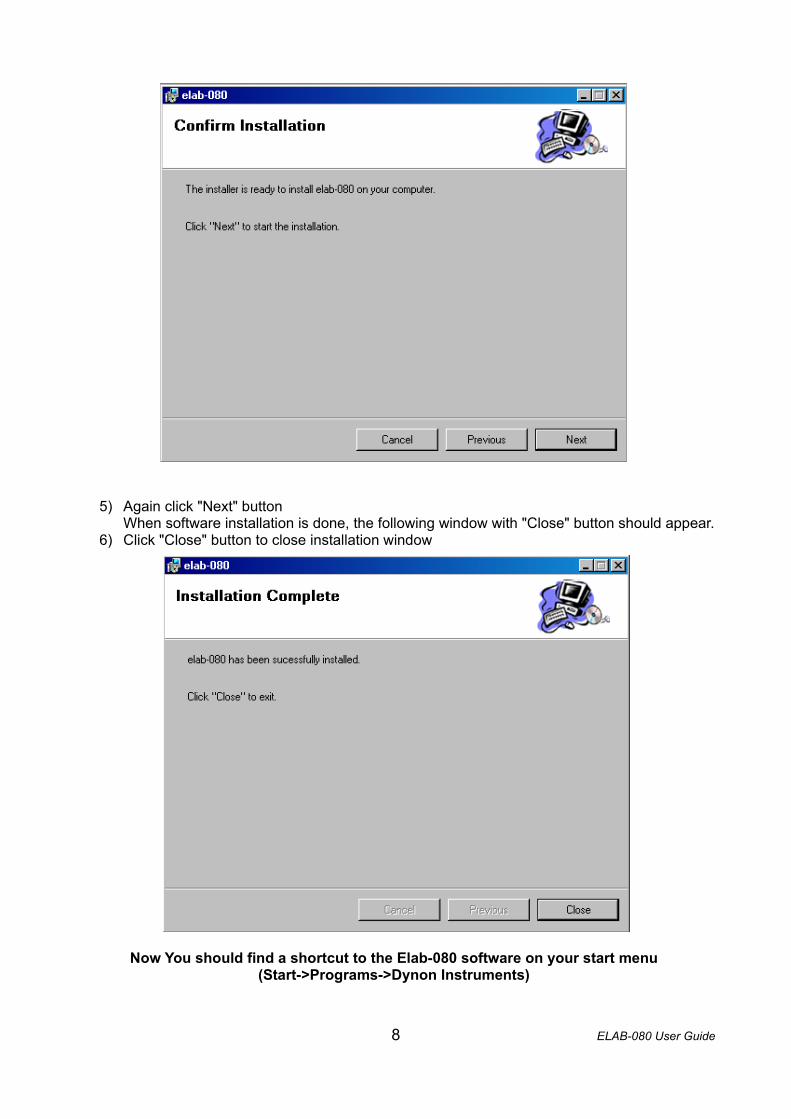
5) Again click "Next" buttonWhen software installation is done, the following window with "Close" button should appear.
6) Click "Close" button to close installation window
Now You should find a shortcut to the Elab-080 software on your start menu (Start->Programs->Dynon Instruments)
8 ELAB-080 User Guide
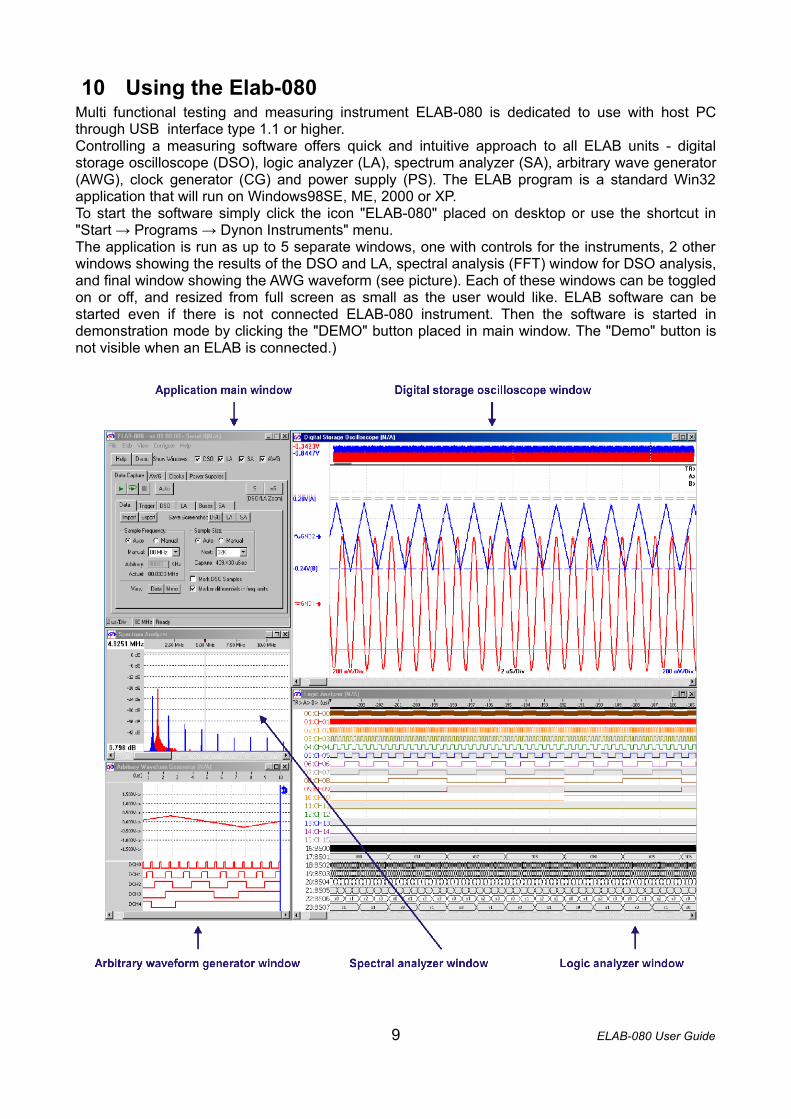
10 Using the Elab-080 Multi functional testing and measuring instrument ELAB-080 is dedicated to use with host PC through USB interface type 1.1 or higher. Controlling a measuring software offers quick and intuitive approach to all ELAB units - digital storage oscilloscope (DSO), logic analyzer (LA), spectrum analyzer (SA), arbitrary wave generator (AWG), clock generator (CG) and power supply (PS). The ELAB program is a standard Win32 application that will run on Windows98SE, ME, 2000 or XP. To start the software simply click the icon "ELAB-080" placed on desktop or use the shortcut in "Start → Programs → Dynon Instruments" menu. The application is run as up to 5 separate windows, one with controls for the instruments, 2 other windows showing the results of the DSO and LA, spectral analysis (FFT) window for DSO analysis, and final window showing the AWG waveform (see picture). Each of these windows can be toggled on or off, and resized from full screen as small as the user would like. ELAB software can be started even if there is not connected ELAB-080 instrument. Then the software is started in demonstration mode by clicking the "DEMO" button placed in main window. The "Demo" button is not visible when an ELAB is connected.)
9 ELAB-080 User Guide

10.1 Description of application main windowMain application window is used for adjusting parameters of particular units and controlling progress of ELAB instrument. Main window is displayed on next picture. Beneath that you will find a description of each of these features.
A) MenuSome of the most commonly used functions of the ELAB-080 software are also accessible through the menu at the top of the main form.
B) "Help" ButtonThis button opens up a window that displays this Elab help documentation.
C) "Demo" ButtonThis button is visible only when no Elab connection is detected. Clicking it will simulate the capture of DSO, LA, and FFT data, so that you can try out the user interface without an Elab connection
D) "Show Windows" CheckboxesThese checkboxes allow you to show or hide the DSO, LA, SA, and AWG display windows individually. If the box is checked, the display window will be shown. Clicking the checkbox or its label will toggle the display window's visibility.
E) Tab control panel for function and parameter setting of ELAB-080 instrumentThis tab control contains 4 tabs :
Data Capture - Parameters and function settings for DSO, LA and SA unitAWG - Parameters settings for AWG unitClocks - Parameters settings for CG unitPower Supply - Parameters settings for PS unit
Usage off all particular controls is described in next chapters.
10 ELAB-080 User Guide
11 Using of the Digital Oscilloscope, Logic Analyzer, and Spectrum Analyzer
The digital oscilloscope (DSO), logic analyzer (LA), and spectrum analyzer (SA) are used to measure analog signals, digital signals, and frequency on analog signals, respectively. Their displays are linked and the DSO shares the same timing settings and cursors with the LA. This section explains how to use all the DSO, LA, and SA features, which are found on the "Data Capture" Tab.
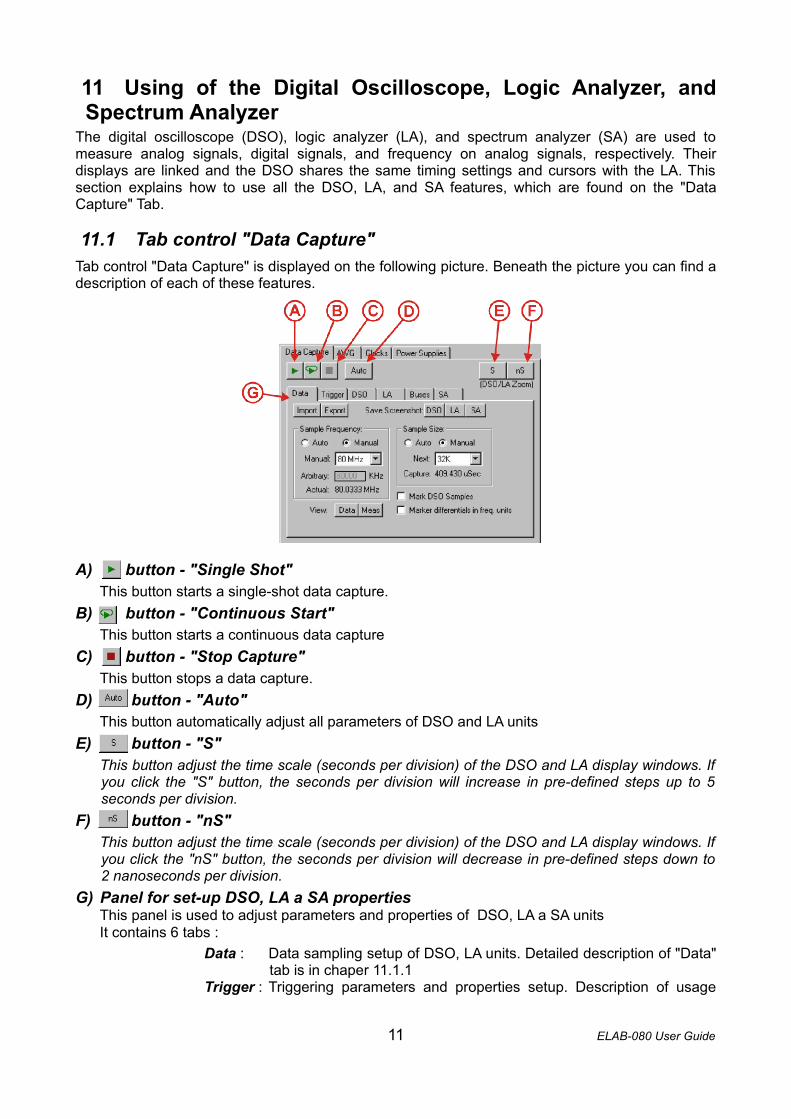
11.1 Tab control "Data Capture"Tab control "Data Capture" is displayed on the following picture. Beneath the picture you can find a description of each of these features.
A) button - "Single Shot" This button starts a single-shot data capture.
B) button - "Continuous Start" This button starts a continuous data capture
C) button - "Stop Capture" This button stops a data capture.
D) button - "Auto"This button automatically adjust all parameters of DSO and LA units
E) button - "S" This button adjust the time scale (seconds per division) of the DSO and LA display windows. If you click the "S" button, the seconds per division will increase in pre-defined steps up to 5 seconds per division.
F) button - "nS" This button adjust the time scale (seconds per division) of the DSO and LA display windows. If you click the "nS" button, the seconds per division will decrease in pre-defined steps down to 2 nanoseconds per division.
G) Panel for set-up DSO, LA a SA propertiesThis panel is used to adjust parameters and properties of DSO, LA a SA unitsIt contains 6 tabs :
Data : Data sampling setup of DSO, LA units. Detailed description of "Data" tab is in chaper 11.1.1
Trigger : Triggering parameters and properties setup. Description of usage
11 ELAB-080 User Guide
"Trigger" tab is in chapter 11.1.2DSO : DSO properties setup. To detailed description see chapter 11.1.3LA : LA properties setup. Detailed description of "LA" tab can be found in
chapter 11.1.4.1Buses : Logic analyzer buses properties setup. Description of "Buses" tab is
in chapter 11.1.4.2SA : SA parameters and properties setup. Description of "SA" tab is in
chapter 11.1.5
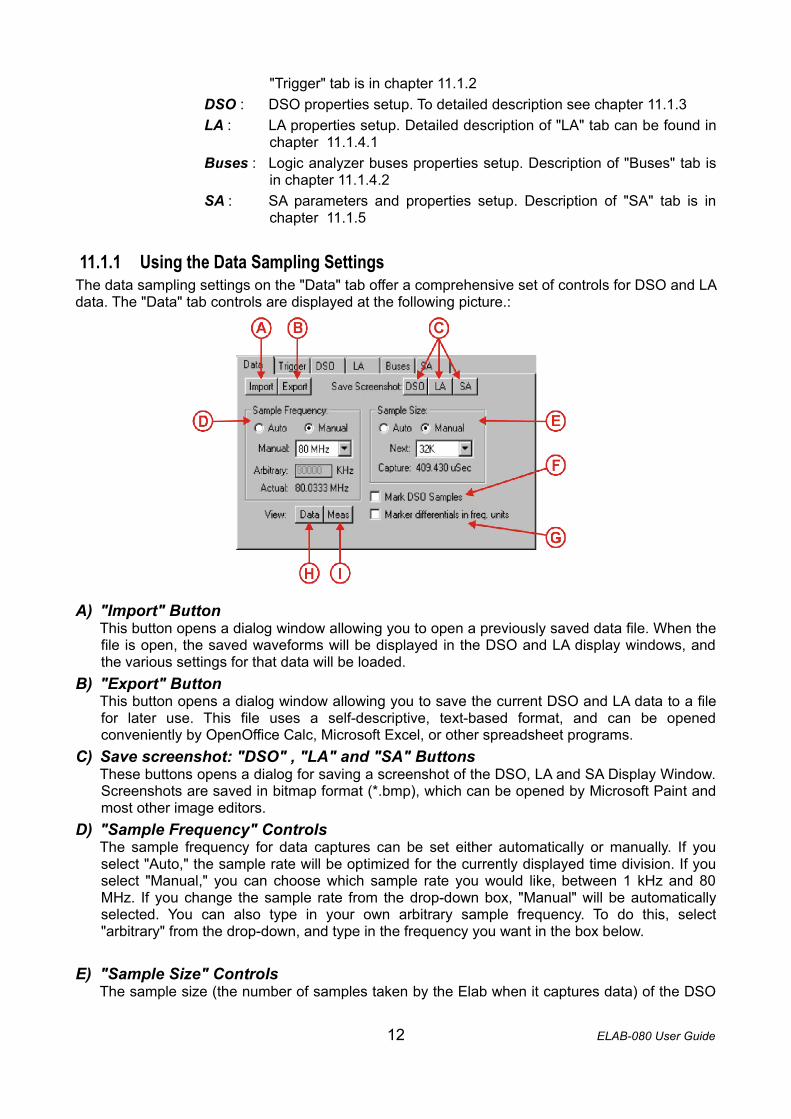
11.1.1 Using the Data Sampling SettingsThe data sampling settings on the "Data" tab offer a comprehensive set of controls for DSO and LA data. The "Data" tab controls are displayed at the following picture.:
A) "Import" ButtonThis button opens a dialog window allowing you to open a previously saved data file. When the file is open, the saved waveforms will be displayed in the DSO and LA display windows, and the various settings for that data will be loaded.
B) "Export" ButtonThis button opens a dialog window allowing you to save the current DSO and LA data to a file for later use. This file uses a self-descriptive, text-based format, and can be opened conveniently by OpenOffice Calc, Microsoft Excel, or other spreadsheet programs.
C) Save screenshot: "DSO" , "LA" and "SA" ButtonsThese buttons opens a dialog for saving a screenshot of the DSO, LA and SA Display Window. Screenshots are saved in bitmap format (*.bmp), which can be opened by Microsoft Paint and most other image editors.
D) "Sample Frequency" Controls The sample frequency for data captures can be set either automatically or manually. If you select "Auto," the sample rate will be optimized for the currently displayed time division. If you select "Manual," you can choose which sample rate you would like, between 1 kHz and 80 MHz. If you change the sample rate from the drop-down box, "Manual" will be automatically selected. You can also type in your own arbitrary sample frequency. To do this, select "arbitrary" from the drop-down, and type in the frequency you want in the box below.
E) "Sample Size" ControlsThe sample size (the number of samples taken by the Elab when it captures data) of the DSO
12 ELAB-080 User Guide

and LA can be set either automatically or manually. If you select "Auto," the sample size will be optimized for the current sample mode (single-shot or continuous). If you select "Manual," you can choose which sample size you would like, between 1K and 32K. If you change the sample size from the drop-down box, "Manual" will be automatically selected.
F) "Mark DSO Samples" CheckboxWhen this checkbox is checked, DSO samples are marked with "dots" and connected to each other with lines. When unchecked, your waveform will be drawn with lines, but without dots marking individual samples.
G) "Marker differentials in freq units" Checkbox When this checkbox is checked, DSO timing cursors are labeled with frequency (when both timing cursors are set). If unchecked, the time difference between the two cursors is shown.
H) "View Data" Button This button opens a window which shows all of the current DSO and LA data in a table. Each row of the table contains the timestamp, the voltage of each DSO channel, and the value of each LA bank in binary and hexadecimal representations.
I) "View Measurements" Buttonhis button opens a pop-up which shows statistics regarding the data currently visible in the DSO Display Window. Statistics are for both DSO channels, and consist of the following measurements: highest voltage, lowest voltage, and average voltage.
11.1.2 Using the Trigger SettingsFor trigger properties and parameters setting the "Trigger" tab is used. This tab offers a comprehensive set of controls for DSO and LA triggers. The "Trigger" tab screenshot is on following picture and description is below the picture :
A) "Enable Trigger" CheckboxThis checkbox turns the triggering feature of the DSO and LA on and off. If the trigger is not enabled, you will not see the controls used to modify the trigger settings. To enable or disable the trigger, simply click on the checkbox or its label.
B) "Auto roll" Checkbox This checkbox turns the auto-roll feature of the DSO and LA on and off. If auto-roll is enabled, a continuous data capture will still capture and display data even if no trigger is found. To enable or disable auto-roll, simply click on the checkbox or its label.
C) "Data After Trigger" Setting This setting controls the placement of the sampled data around the trigger. It is specified by choosing the percentage of the data in your next data capture that you would like to see after the trigger. To change the value, you can select the value in the setting box by dragging the mouse or double-clicking inside the box, then typing in the desired value between 0 and 100.
13 ELAB-080 User Guide
D) "Trigger Source" Selection This selection controls which data source will be triggered upon. The source options include the two DSO channels and the LA. To select the source, simply click the desired source.
E) "DSO Trigger" Controls The DSO Trigger has two parameters: trigger edge and trigger level. The trigger edge can be either the rising or falling edge, selectable by clicking the desired edge. The trigger level can be set by typing in the desired value in millivolts or by increasing or decreasing the trigger level using the up and down arrow buttons. You can click the up and down buttons to adjust the trigger level in small increments or hold the buttons down to adjust the trigger level more quickly. As you adjust the trigger level, the trigger symbol in the DSO display window will move accordingly.
F) "LA Trigger" ControlsThe LA trigger occurs on a specified bus value including the first four LA channels, with channel 3 being the most significant bit and channel 0 being the least significant bit. Because of this, it is often desirable to not use all of the first LA channels available. The trigger bus value can be set either by selecting the desired trigger level on each channel, or by typing the the desired bus value (in hexadecimal). Because of hardware limitations, it is not possible to set the data capture to trigger on zero (all four trigger lines low). All other permutations of the four trigger lines can be set up as a trigger.
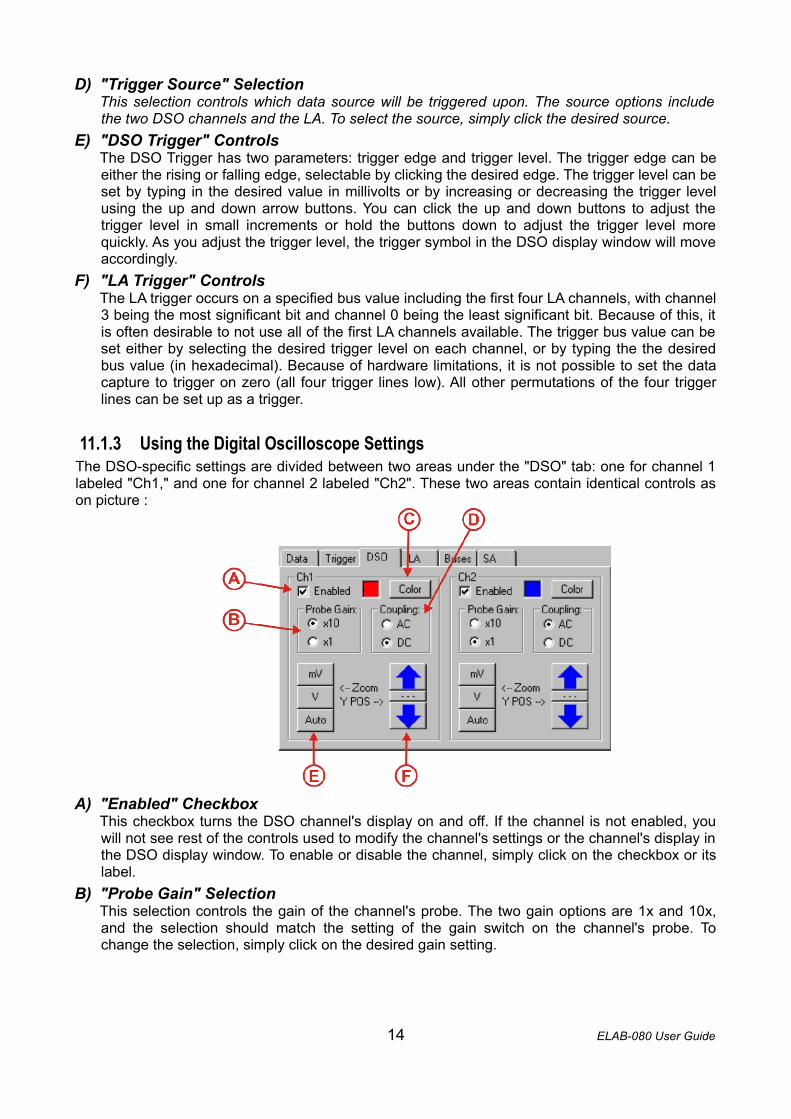
11.1.3 Using the Digital Oscilloscope SettingsThe DSO-specific settings are divided between two areas under the "DSO" tab: one for channel 1 labeled "Ch1," and one for channel 2 labeled "Ch2". These two areas contain identical controls as on picture :
A) "Enabled" CheckboxThis checkbox turns the DSO channel's display on and off. If the channel is not enabled, you will not see rest of the controls used to modify the channel's settings or the channel's display in the DSO display window. To enable or disable the channel, simply click on the checkbox or its label.
B) "Probe Gain" SelectionThis selection controls the gain of the channel's probe. The two gain options are 1x and 10x, and the selection should match the setting of the gain switch on the channel's probe. To change the selection, simply click on the desired gain setting.
14 ELAB-080 User Guide
C) "Color" ButtonThis button allows you to change the display color of the channel in the DSO display window. The current color is displayed in the box adjacent to the button. Clicking on the button will open a window that allows you to choose from a set of predefined colors as well as define custom colors.
D) "Coupling" Selection This selection controls the coupling mode of the DSO channel. Use DC coupling when you want to see the DC offset with the time-varying portion of the signal. Use AC coupling when you want to view only the time-varying portion of the signal.
E) "Zoom" (mV/V) Buttons The zoom buttons allow you to adjust how much vertical space the DSO channel's waveform will take up in the DSO display window. The current zoom settings are shown in the bottom corners of the DSO display window, with channel 1 in the bottom-left left corner, and channel 2 in the bottom-right corner. Clicking the "V" button will increase the volts per division in pre-defined steps up to 10 V per division. Clicking the "mV" button will decrease the volts per division in pre-defined steps down to 20 mV per division.
E) "Y POS" (Up and Down Arrow) Buttons This set of three buttons moves the DSO channel vertically in the DSO display window. The up and down arrow buttons move the display of the DSO channel up and down. You can click the up and down buttons to adjust the position in small increments or hold the buttons down to adjust the position more quickly. Clicking the button between the two arrows will reset the display of the DSO channel such that 0V (ground) will be centered in the DSO display window.
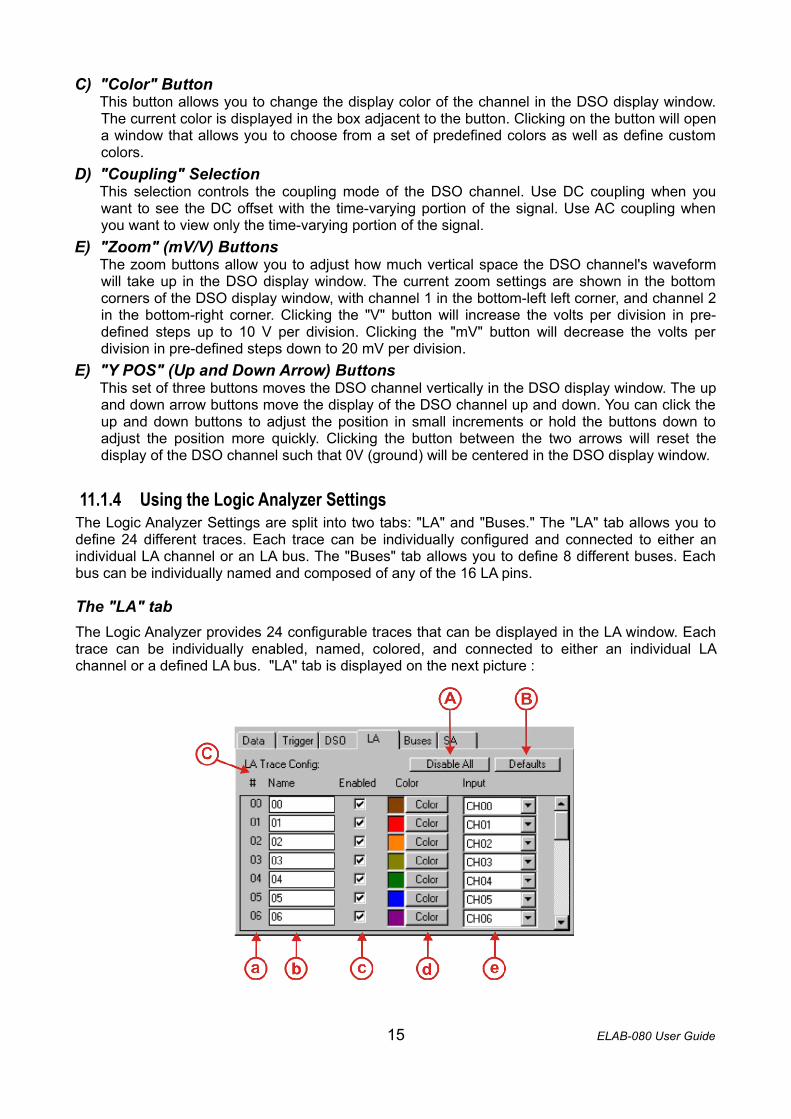
11.1.4 Using the Logic Analyzer SettingsThe Logic Analyzer Settings are split into two tabs: "LA" and "Buses." The "LA" tab allows you to define 24 different traces. Each trace can be individually configured and connected to either an individual LA channel or an LA bus. The "Buses" tab allows you to define 8 different buses. Each bus can be individually named and composed of any of the 16 LA pins.
The "LA" tabThe Logic Analyzer provides 24 configurable traces that can be displayed in the LA window. Each trace can be individually enabled, named, colored, and connected to either an individual LA channel or a defined LA bus. "LA" tab is displayed on the next picture :
15 ELAB-080 User Guide

A) "Disable All" Button This button unchecks the "enabled" checkbox for all LA traces.
B) "Defaults" Button This button resets the LA trace settings to their default state.
C) Individual Trace Configuration Controls These controls allow you to configure the individual settings for each trace. Each row of controls contains the settings for one trace :
a) "#" Column This column shows the number of each trace.
b) "Name" ColumnThis column allows you to re-name each trace individually. This name will appear in the LA display window next to the trace.
c) "Enabled" ColumnThis column allows you to enabled each trace individually. If a trace is enabled, it will be displayed in the LA window.
d) "Color" Column This column allows you to set the color each trace individually. The current color is reflected in a small box. Next to the colored box, the "Color" button opens a window that allows you to choose the desired color for the trace.
e) "Input" Column This column allows you to connect each trace to the desired LA channel or bus (configured in the "Buses" tab). Clicking on the box for a trace allows you to select from the list of LA channels and buses. The names that you set in your bus configuration will be reflected in this list.
The "Buses" tabThe Logic Analyzer provides 8 configurable buses. Each of these buses can contain up to 16 channels. Each channel is displayed as a labeled bar, narrowing at each point in time that the bus value changes. Each bus can be named as you like and configured to contain any combination of the 16 LA channels. "Buses" tab is displayed on the next picture :
A) "Format" Selection This selection chooses the number representation for LA buses in the display window. There are four possible representations: bin (binary), oct (octal), dec (decimal), and hex
16 ELAB-080 User Guide
(hexadecimal). For example, on an 8-bit bus, the four following representations have the same value:
• Binary: b01011010 • Octal: o132 • Decimal: d90 • Hexadecimal: x5A
B) "Defaults" Button This button resets the LA bus settings to their default state.
C) Individual Bus Configuration Controls These controls allow you to configure the individual settings for each bus. Each row of controls contains the settings for one bus :
a) "#" Column This column shows the number of each bus.
b) "Name" Column This column allows you to re-name each bus individually. The bus name will be displayed to the right of the trace number or name in the LA window next to the bus display.
c) "00" - "15" Columns These columns are a grid of LA channel checkboxes. Each column of the grid represents an LA channel. If the checkbox is selected, then the corresponding LA channel will be included in that bus.
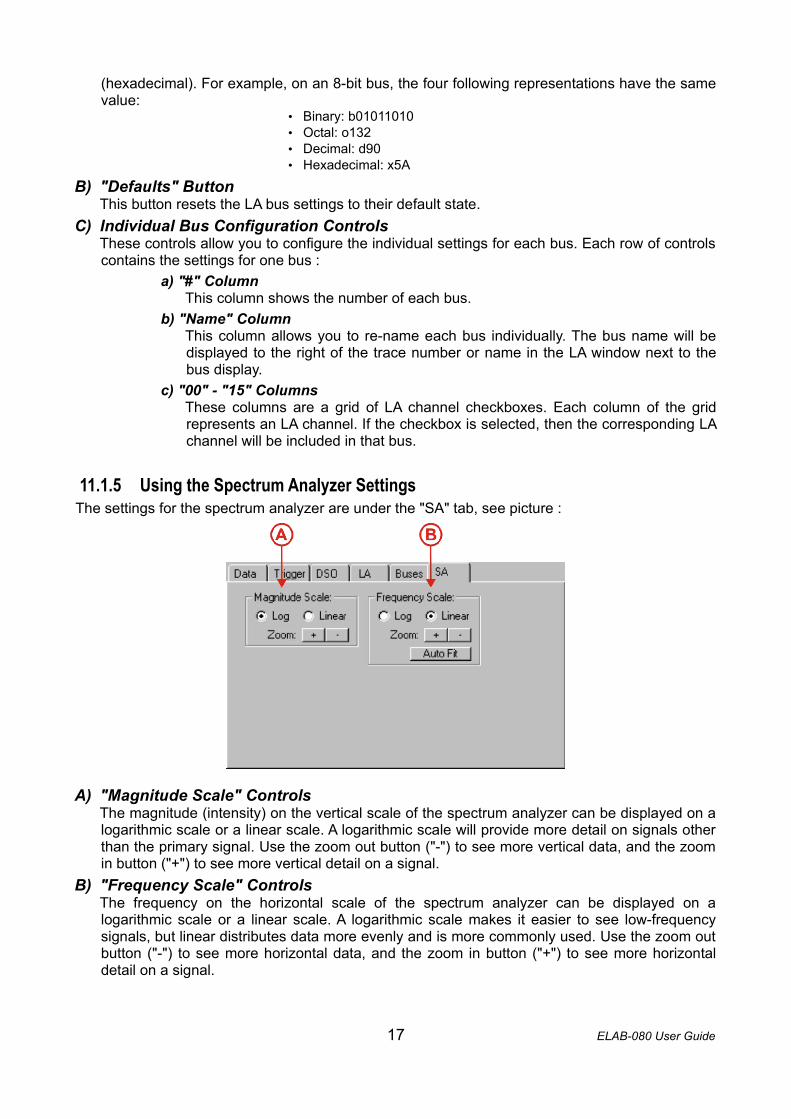
11.1.5 Using the Spectrum Analyzer SettingsThe settings for the spectrum analyzer are under the "SA" tab, see picture :
A) "Magnitude Scale" Controls The magnitude (intensity) on the vertical scale of the spectrum analyzer can be displayed on a logarithmic scale or a linear scale. A logarithmic scale will provide more detail on signals other than the primary signal. Use the zoom out button ("-") to see more vertical data, and the zoom in button ("+") to see more vertical detail on a signal.
B) "Frequency Scale" Controls The frequency on the horizontal scale of the spectrum analyzer can be displayed on a logarithmic scale or a linear scale. A logarithmic scale makes it easier to see low-frequency signals, but linear distributes data more evenly and is more commonly used. Use the zoom out button ("-") to see more horizontal data, and the zoom in button ("+") to see more horizontal detail on a signal.
17 ELAB-080 User Guide
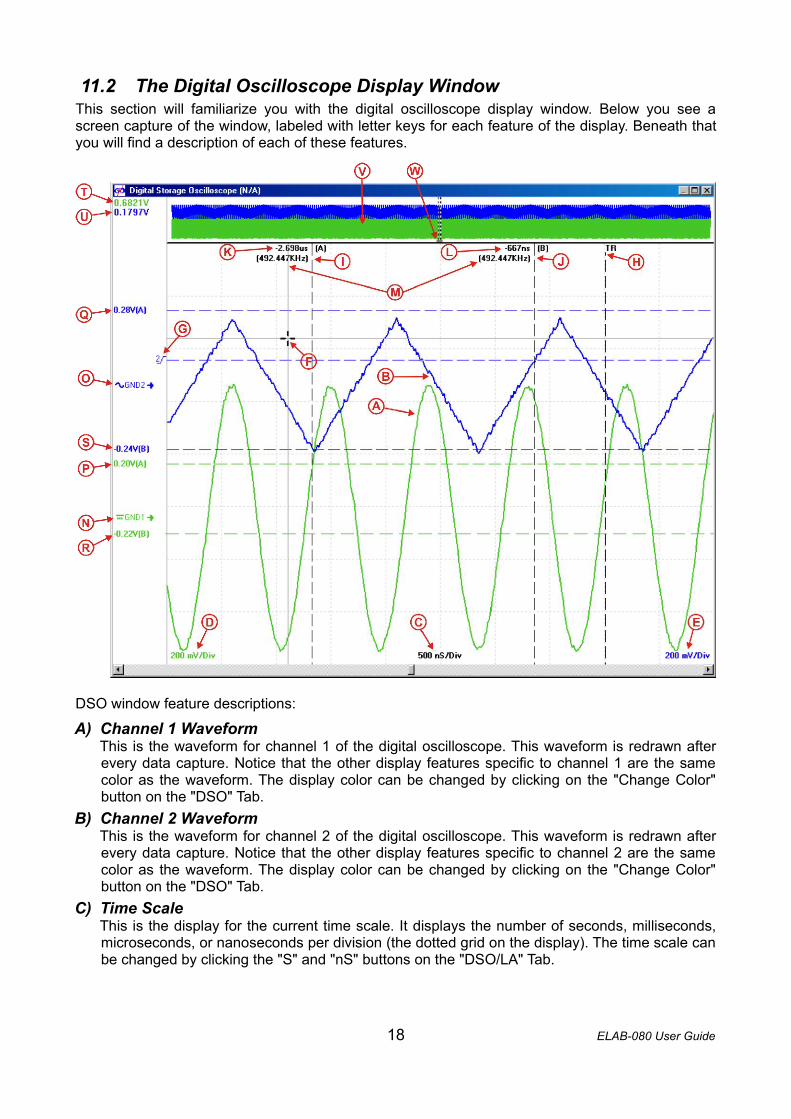
11.2 The Digital Oscilloscope Display Window This section will familiarize you with the digital oscilloscope display window. Below you see a screen capture of the window, labeled with letter keys for each feature of the display. Beneath that you will find a description of each of these features.
DSO window feature descriptions:
A) Channel 1 WaveformThis is the waveform for channel 1 of the digital oscilloscope. This waveform is redrawn after every data capture. Notice that the other display features specific to channel 1 are the same color as the waveform. The display color can be changed by clicking on the "Change Color" button on the "DSO" Tab.
B) Channel 2 WaveformThis is the waveform for channel 2 of the digital oscilloscope. This waveform is redrawn after every data capture. Notice that the other display features specific to channel 2 are the same color as the waveform. The display color can be changed by clicking on the "Change Color" button on the "DSO" Tab.
C) Time ScaleThis is the display for the current time scale. It displays the number of seconds, milliseconds, microseconds, or nanoseconds per division (the dotted grid on the display). The time scale can be changed by clicking the "S" and "nS" buttons on the "DSO/LA" Tab.
18 ELAB-080 User Guide
D) Channel 1 Voltage ScaleThis is the display for the current time scale. It displays the number of seconds, milliseconds, microseconds, or nanoseconds per division (the dotted grid on the display). The time scale can be changed by clicking the "S" and "nS" buttons on the "DSO/LA" Tab.
E) Channel 2 Voltage ScaleThis is the display for the channel 2 voltage scale. It displays the number of volts or millivolts per division (the dotted grid on the display). The voltage scale can be changed by clicking the "Zoom" ("V" and "mV") buttons on the "DSO" Tab.
F) Mouse CursorWhen over the digital oscilloscope display, the mouse cursor appears as in this screenshot. Notice that a vertical line tracks the time position of the mouse cursor. Notice also that as you move the mouse cursor, a similar vertical line moves across the LA display window. Notice that a horizontal line tracks the voltage position of the mouse cursor, and this voltage is displayed for channel 1 and channel 2 in the top left corner of the screen.
G) Trigger Level IndicatorThis indicator shows the trigger level visually on the display. This indicator stays on the left side of the screen and follows the current trigger level vertically. The indicator's number and color reflect the channel of the trigger source. The indicator's shape reflects whether the trigger is sensitive to the rising or falling edge of the signal. These trigger settings can be changed on the "Trigger" Tab. You can also change the trigger level by clicking on it and dragging it up and down.
H) Trigger Time MarkerThis line marks the time position where the trigger occurred. If the trigger occurred at a time that isn't currently displayed, you will see a "<TR" in the top-left corner of the display if the trigger occurred before the displayed time or a "TR>" in the top-right corner of the display if the trigger occurred after the displayed time.
I) Timing Cursor A MarkerThis line marks a user-selected time in the display window. The "(A)" next to it indicates that it is timing cursor A. The position of this marker is set by clicking "Set Timing Cursor A" in the context menu (see description of context menu bellow), when you have positioned the mouse cursor at the desired time position. If the cursor was set at a time that isn't currently displayed, you will see a "<A" in the top-left corner of the display if the cursor is positioned before the displayed time or a "A>" in the top-right corner of the display if the cursor is positioned after the displayed time. You can also change timing cursors by clicking on them and dragging them left or right.
J) Timing Cursor B MarkerThis line marks a user-selected time in the display window. The "(B)" next to it indicates that it is timing cursor B. The position of this marker is set by clicking "Set Timing Cursor B" in the context menu (see description of context menu bellow), when you have positioned the mouse cursor at the desired time position. If the cursor was set at a time that isn't currently displayed, you will see a "<B" in the top-left corner of the display if the cursor is positioned before the displayed time or a "B>" in the top-right corner of the display if the cursor is positioned after the displayed time. You can also change timing cursors by clicking on them and dragging them left or right.
K) Timing Cursor A ValueThis value shows the time position of timing cursor A. If the trigger is enabled, this value will be relative to the time the trigger occurred. If the trigger is disabled, this value will be relative to the beginning of the captured data.
L) Timing Cursor B ValueThis value shows the time position of timing cursor B. If the trigger is enabled, this value will be relative to the time the trigger occurred. If the trigger is disabled, this value will be relative to the beginning of the captured data.
19 ELAB-080 User Guide
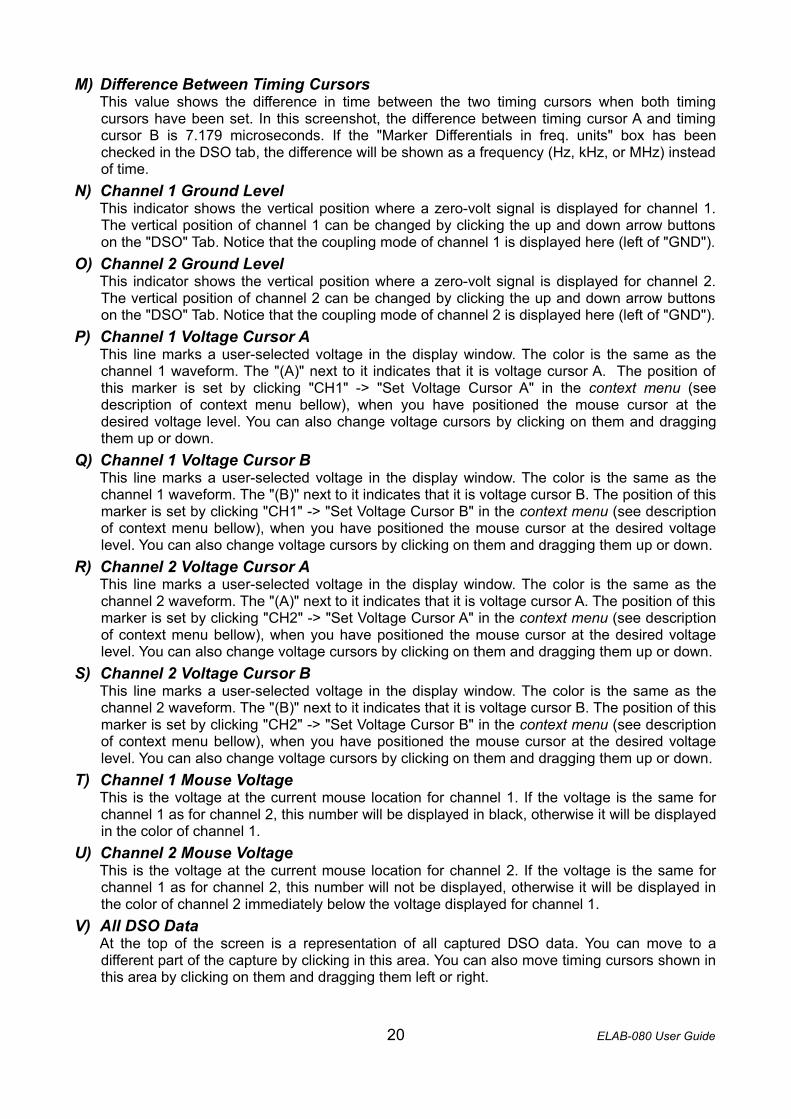
M) Difference Between Timing CursorsThis value shows the difference in time between the two timing cursors when both timing cursors have been set. In this screenshot, the difference between timing cursor A and timing cursor B is 7.179 microseconds. If the "Marker Differentials in freq. units" box has been checked in the DSO tab, the difference will be shown as a frequency (Hz, kHz, or MHz) instead of time.
N) Channel 1 Ground LevelThis indicator shows the vertical position where a zero-volt signal is displayed for channel 1. The vertical position of channel 1 can be changed by clicking the up and down arrow buttons on the "DSO" Tab. Notice that the coupling mode of channel 1 is displayed here (left of "GND").
O) Channel 2 Ground LevelThis indicator shows the vertical position where a zero-volt signal is displayed for channel 2. The vertical position of channel 2 can be changed by clicking the up and down arrow buttons on the "DSO" Tab. Notice that the coupling mode of channel 2 is displayed here (left of "GND").
P) Channel 1 Voltage Cursor AThis line marks a user-selected voltage in the display window. The color is the same as the channel 1 waveform. The "(A)" next to it indicates that it is voltage cursor A. The position of this marker is set by clicking "CH1" -> "Set Voltage Cursor A" in the context menu (see description of context menu bellow), when you have positioned the mouse cursor at the desired voltage level. You can also change voltage cursors by clicking on them and dragging them up or down.
Q) Channel 1 Voltage Cursor BThis line marks a user-selected voltage in the display window. The color is the same as the channel 1 waveform. The "(B)" next to it indicates that it is voltage cursor B. The position of this marker is set by clicking "CH1" -> "Set Voltage Cursor B" in the context menu (see description of context menu bellow), when you have positioned the mouse cursor at the desired voltage level. You can also change voltage cursors by clicking on them and dragging them up or down.
R) Channel 2 Voltage Cursor AThis line marks a user-selected voltage in the display window. The color is the same as the channel 2 waveform. The "(A)" next to it indicates that it is voltage cursor A. The position of this marker is set by clicking "CH2" -> "Set Voltage Cursor A" in the context menu (see description of context menu bellow), when you have positioned the mouse cursor at the desired voltage level. You can also change voltage cursors by clicking on them and dragging them up or down.
S) Channel 2 Voltage Cursor BThis line marks a user-selected voltage in the display window. The color is the same as the channel 2 waveform. The "(B)" next to it indicates that it is voltage cursor B. The position of this marker is set by clicking "CH2" -> "Set Voltage Cursor B" in the context menu (see description of context menu bellow), when you have positioned the mouse cursor at the desired voltage level. You can also change voltage cursors by clicking on them and dragging them up or down.
T) Channel 1 Mouse VoltageThis is the voltage at the current mouse location for channel 1. If the voltage is the same for channel 1 as for channel 2, this number will be displayed in black, otherwise it will be displayed in the color of channel 1.
U) Channel 2 Mouse VoltageThis is the voltage at the current mouse location for channel 2. If the voltage is the same for channel 1 as for channel 2, this number will not be displayed, otherwise it will be displayed in the color of channel 2 immediately below the voltage displayed for channel 1.
V) All DSO DataAt the top of the screen is a representation of all captured DSO data. You can move to a different part of the capture by clicking in this area. You can also move timing cursors shown in this area by clicking on them and dragging them left or right.
20 ELAB-080 User Guide
W) Location in CaptureAt the top of the screen is a representation of all captured DSO data. Your current position in this data is underlined by a grey bar. Scrolling DSO data left or right will move this grey bar left or right.
11.2.1 DSO window context menuThe context menu allows you to access certain controls quickly and easily. To open the context menu, simply click your right-hand mouse button somewhere inside the DSO display window. The context menu has several options that control the behavior of the DSO display window: • Zoom (S/nS)
This submenu allows you to set the current seconds/division (horizontal zoom) of the DSO window. You can choose anything from 5 sec/division down to 2 ns/division.
• Zoom Ch1 (V/mV)This submenu allows you to set the current volts/division (vertical zoom) for DSO channel 1. You can choose anything from 10 V/division down to 5 mV/division. 5 mV/division to 10 mV/division is only available when configured to use a 1x probe. 1 V/division to 10 V/division is only available when configured to use a 10x probe.
• Zoom Ch2 (V/mV)This submenu allows you to set the current volts/division (vertical zoom) for DSO channel 2. You can choose anything from 10 V/division down to 5 mV/division. 5 mV/division to 10 mV/division is only available when configured to use a 1x probe. 1 V/division to 10 V/division is only available when configured to use a 10x probe.
• GotoThis submenu allows you to go to a specific point in the data. You can go to the trigger if the data you are looking at had a trigger, or you can go to one of the two timing cursors (A or B) if they are currently set.
• Set Trigger VoltageThis option allows you to set (or move) the trigger voltage level. Clicking it will set the trigger voltage where the horizontal line of the mouse cursor is currently positioned.
• Remove All CursorsThis option allows you to remove all voltage and timing cursors from both the DSO and LA displays.
• Set Timing Cursor AThis option allows you to set (or move) timing cursor A. Clicking it will set the timing cursor A marker where the vertical line of the mouse cursor is currently positioned.
• Rmv Timing Cursor AThis option allows you to remove timing cursor A from the both the DSO and the LA displays
• Set Timing Cursor BThis option allows you to set (or move) timing cursor B. Clicking it will set the timing cursor B marker where the vertical line of the mouse cursor is currently positioned.
• Rmv Timing Cursor BThis option allows you to remove timing cursor B from the both the DSO and the LA displays.
• CH1 → This option opens the channel 1 sub-menu : • Enable
This option allows you to show the channel 1 waveform and all channel 1 - specific information on the display if it is currently hidden.
• DisableThis option allows you to hide the channel 1 waveform and all channel 1 - specific information on the display if it is currently shown.
• Set Volt Curs AThis option allows you to set (or move) channel 1 voltage cursor A. Clicking it will set the
21 ELAB-080 User Guide
voltage cursor where the horizontal line of the mouse cursor is currently positioned • Rmv Volt Curs A
This option allows you to remove channel 1 voltage cursor A from the display. • Set Volt Curs B
This option allows you to set (or move) channel 1 voltage cursor B. Clicking it will set the voltage cursor where the horizontal line of the mouse cursor is currently positioned
• Rmv Volt Curs BThis option allows you to remove channel 1 voltage cursor B from the display.
• CH2 → This option opens the channel 2 sub-menu. • Enable
This option allows you to show the channel 2 waveform and all channel 2 - specific information on the display if it is currently hidden.
• DisableThis option allows you to hide the channel 2 waveform and all channel 2 - specific information on the display if it is currently shown.
• Set Volt Curs AThis option allows you to set (or move) channel 2 voltage cursor A. Clicking it will set the voltage cursor where the horizontal line of the mouse cursor is currently positioned
• Rmv Volt Curs AThis option allows you to remove channel 2 voltage cursor A from the display.
• Set Volt Curs BThis option allows you to set (or move) channel 2 voltage cursor B. Clicking it will set the voltage cursor where the horizontal line of the mouse cursor is currently positioned
• Rmv Volt Curs BThis option allows you to remove channel 2 voltage cursor B from the display.
22 ELAB-080 User Guide
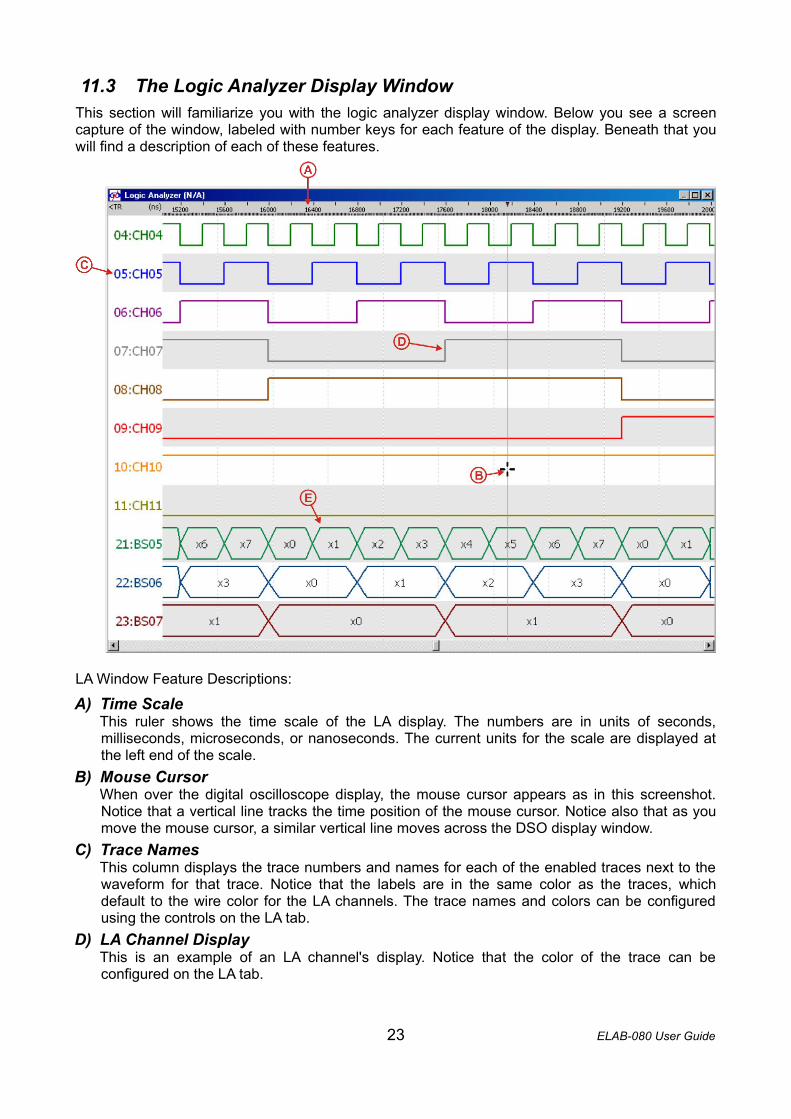
11.3 The Logic Analyzer Display WindowThis section will familiarize you with the logic analyzer display window. Below you see a screen capture of the window, labeled with number keys for each feature of the display. Beneath that you will find a description of each of these features.
LA Window Feature Descriptions:
A) Time ScaleThis ruler shows the time scale of the LA display. The numbers are in units of seconds, milliseconds, microseconds, or nanoseconds. The current units for the scale are displayed at the left end of the scale.
B) Mouse CursorWhen over the digital oscilloscope display, the mouse cursor appears as in this screenshot. Notice that a vertical line tracks the time position of the mouse cursor. Notice also that as you move the mouse cursor, a similar vertical line moves across the DSO display window.
C) Trace NamesThis column displays the trace numbers and names for each of the enabled traces next to the waveform for that trace. Notice that the labels are in the same color as the traces, which default to the wire color for the LA channels. The trace names and colors can be configured using the controls on the LA tab.
D) LA Channel DisplayThis is an example of an LA channel's display. Notice that the color of the trace can be configured on the LA tab.
23 ELAB-080 User Guide

E) LA Bus DisplayThis is an example of an LA bus' display. Notice that this bus is configured to show its bus value in hexadecimal. This setting can be configured on the Buses tab. Notice that the color of the trace can be configured on the LA tab.
11.3.1 LA window trace label context menuThe trace label context menu allows you to create buses quickly and easily: To open this context menu, simply click your right-hand mouse button in the trace labels area (the left-hand section containing the signal trace names) of the LA display window. This context menu has several options that allow you to edit buses more efficiently: • Define a bus
1. Select Bus Channels Select the traces displaying channels that you wish to create a bus from. You can select a contiguous group of channels by clicking on the first channel in the group, then Shift-Clicking on the last channel in the group. You can select non-contiguous channels by Control-Clicking on each desired channel.
2. Create Bus Now, right-click on a trace label. Select "Define bus ->", then the bus which you wish to configure as the selected channels.
• Clear a Bus If you would like to remove all channels from a bus definition and remove any instances of that bus from the display, you can right-click on a trace label, select "Clear bus", and the bus you want to clear.
• Hide Traces 1. Select Traces to Hide
Select the traces that you wish to hide. You can select a contiguous group of traces by clicking on the first channel in the group, then Shift-Clicking on the last channel in the group. You can select non-contiguous traces by Control-Clicking on each desired trace.
2. Hide Traces Now, right-click on a trace label, and select "Hide Traces".
• Show All Traces If you would like to show all traces, including those not currently enabled, you can right-click on a trace label and select "Show All Traces" to enable all 24 traces for display.
11.3.2 LA window display area context MenuThe display area context menu allows you to access certain display controls quickly and easily. To open this context menu, simply click your right-hand mouse button in the display area (the right-hand section with the signal displays) of the LA display window. The context menu has several options that control the behavior of the LA display window: • Zoom (S/nS)
This submenu allows you to set the current seconds/division (horizontal zoom) of the LA window. You can choose anything from 5 seconds/division down to 2 nanoseconds/division.
• GotoThis submenu allows you to go to a specific point in the data. You can go to the trigger if the data you are looking at had a trigger, or you can go to one of the two timing cursors (A or B) if they are currently set.
• Set Timing Cursor AThis option allows you to set (or move) timing cursor A. Clicking it will set the timing cursor A marker where the vertical line of the mouse cursor is currently positioned.
24 ELAB-080 User Guide
• Rmv Timing Cursor AThis option allows you to set (or move) timing cursor A. Clicking it will set the timing cursor A marker where the vertical line of the mouse cursor is currently positioned.
• Set Timing Cursor BThis option allows you to set (or move) timing cursor B. Clicking it will set the timing cursor B marker where the vertical line of the mouse cursor is currently positioned.
• Rmv Timing Cursor BThis option allows you to remove timing cursor B from the both the LA and the DSO displays.
• Show/Hide Trace ->NThis option allows you to toggle the display of each trace. Each trace appears in the list. All enabled (displayed) traces show a black dot to the left of the trace number. Clicking on a trace on the list will toggle it from enabled to disabled or from disabled to enabled.
• Bus Display FormatThis submenu gives you quick access to the numerical format of the bus values. You can choose to display your bus values in binary, octal, decimal, or hexadecimal.
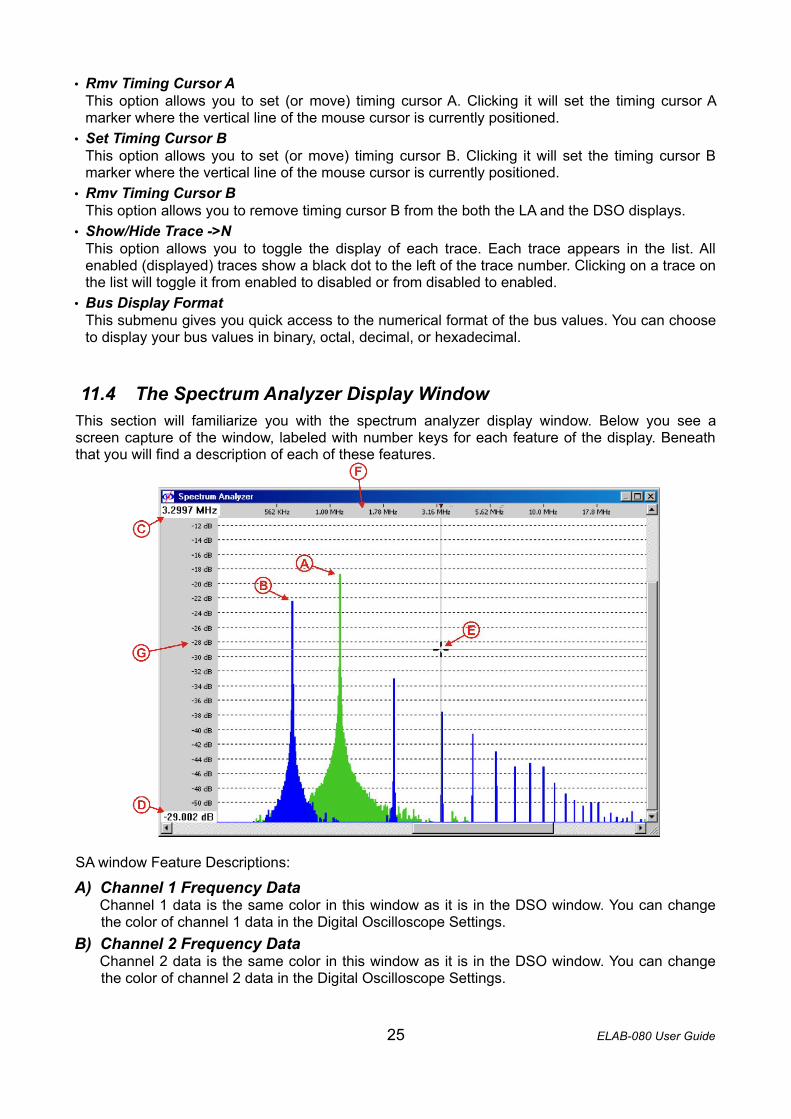
11.4 The Spectrum Analyzer Display Window This section will familiarize you with the spectrum analyzer display window. Below you see a screen capture of the window, labeled with number keys for each feature of the display. Beneath that you will find a description of each of these features.
SA window Feature Descriptions:
A) Channel 1 Frequency DataChannel 1 data is the same color in this window as it is in the DSO window. You can change the color of channel 1 data in the Digital Oscilloscope Settings.
B) Channel 2 Frequency DataChannel 2 data is the same color in this window as it is in the DSO window. You can change the color of channel 2 data in the Digital Oscilloscope Settings.
25 ELAB-080 User Guide

C) Mouse FrequencyThis number shows the frequency at the current mouse horizontal location.
D) Mouse MagnitudeThis number shows the intensity corresponding to the current mouse vertical location. Note that this is NOT the intensity of the signal on channel 1 or channel 2 at this frequency. It merely shows the current mouse Y location in dB.
E) Mouse CursorWhen over the spectrum analyzer display, the mouse cursor appears as in this screenshot. Notice that a vertical line tracks the frequency of the mouse cursor (in Hz, KHz, or MHz), and this frequency is displayed in the top left corner of the screen. Notice also that a horizontal line tracks the magnitude of the mouse cursor (in dB), and this magnitude is displayed in the bottom left corner of the screen.
F) Frequency ScaleThis ruler shows the frequency scale of the SA display. The numbers are in units of hertz, kilohertz, or megahertz.
G) Magnitude ScalThis ruler shows the magntitude (intensity) scale of the SA display. The numbers are in units of decibels.
11.4.1 SA window context menuThe context menu allows you to access certain controls quickly and easily. To open the context menu, simply click your right-hand mouse button somewhere inside the SA display window. The context menu has several options that control the behavior of the SA display window: • Magnitude Scale
This submenu allows you to set whether the magnitude (the vertical scale) on the SA window is logarithmic or linear. A logarithmic scale will provide more detail on signals other than the primary signal.
• Frequency ScaleThis submenu allows you to set whether the frequency (the horizontal scale) on the SA window is logarithmic or linear. A logarithmic scale makes it easier to see low-frequency signals, but linear distributes data more evenly and is more commonly used.
26 ELAB-080 User Guide
12 Using the Arbitrary Waveform GeneratorThe arbitrary waveform generator is used to generate analog and digital signals. It has a powerful interface that lets you choose from preset waveforms, as well as draw your own waveforms. This chapter explains AWG properties and parameters setup using the "AWG" tab in main application window and features and usage of AWG window. The different methods of AWG output signal creation are also described.
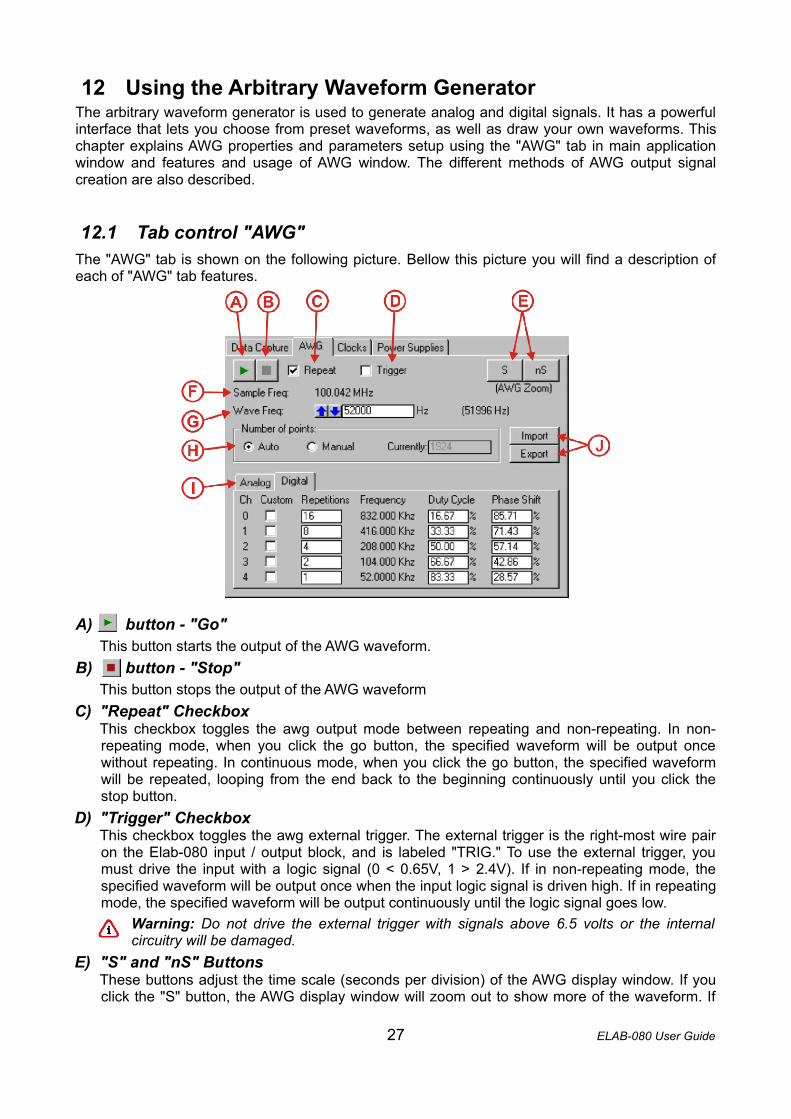
12.1 Tab control "AWG"The "AWG" tab is shown on the following picture. Bellow this picture you will find a description of each of "AWG" tab features.
A) button - "Go" This button starts the output of the AWG waveform.
B) button - "Stop" This button stops the output of the AWG waveform
C) "Repeat" CheckboxThis checkbox toggles the awg output mode between repeating and non-repeating. In non-repeating mode, when you click the go button, the specified waveform will be output once without repeating. In continuous mode, when you click the go button, the specified waveform will be repeated, looping from the end back to the beginning continuously until you click the stop button.
D) "Trigger" CheckboxThis checkbox toggles the awg external trigger. The external trigger is the right-most wire pair on the Elab-080 input / output block, and is labeled "TRIG." To use the external trigger, you must drive the input with a logic signal (0 < 0.65V, 1 > 2.4V). If in non-repeating mode, the specified waveform will be output once when the input logic signal is driven high. If in repeating mode, the specified waveform will be output continuously until the logic signal goes low.
Warning: Do not drive the external trigger with signals above 6.5 volts or the internal circuitry will be damaged.
E) "S" and "nS" ButtonsThese buttons adjust the time scale (seconds per division) of the AWG display window. If you click the "S" button, the AWG display window will zoom out to show more of the waveform. If
27 ELAB-080 User Guide
you click the "nS" button, the AWG display window will zoom in to show less of the waveform (and more detail).
F) "Sample Freq" DisplayThese shows the sample frequency used to generate the current waveform. It is automatically calculated, based on wave frequency and the the number of points used.
G) "Wave Freq" Controls These controls allow you to select the desired frequency of the output waveform. You can change the value by typing in the desired value or by using the up and down arrow buttons. You can click the up and down arrow buttons to change the value in small steps or hold them down to change the value rapidly. The actual frequency that will be generated displays next to the setting box. The best sample rate for the desired wave frequency is automatically calculated. The best number of samples for the desired wave frequency is also automatically calculated, unless you select "manual" in the "Number of points" controls and enter the desired number of sample points.
H) "Number of Points" Controls These controls allow you to specify the number of sample points that you want in the output waveform. It is recommended that you let the Elab software determine the best number of points to match your waveform freqency by selecting "Auto." However, if you would like to specify the number of points, simply select "Manual" and type in the desired number of sample points, between 17 and 65536.
I) "Analog" and "Digital" Tabs These buttons allow you to load and save waveforms, usually custom waveforms. For instructions on using the import and export features for custom waveforms, see Creating Custom Waveforms
J) "Import" and "Export" Buttons You can configure the analog output of the AWG under the Analog Tab. Digital AWG outputs can be configured under the Digital Tab. Description of Analog and Digital tab is noted bellow.
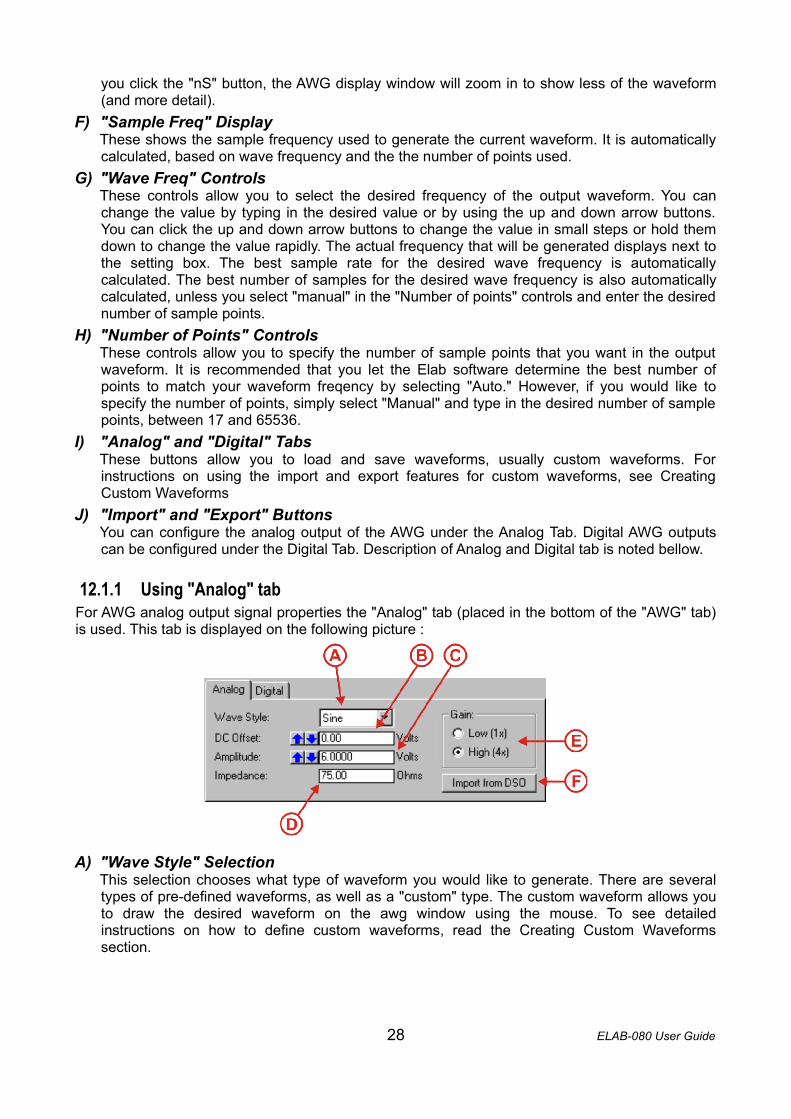
12.1.1 Using "Analog" tabFor AWG analog output signal properties the "Analog" tab (placed in the bottom of the "AWG" tab) is used. This tab is displayed on the following picture :
A) "Wave Style" Selection This selection chooses what type of waveform you would like to generate. There are several types of pre-defined waveforms, as well as a "custom" type. The custom waveform allows you to draw the desired waveform on the awg window using the mouse. To see detailed instructions on how to define custom waveforms, read the Creating Custom Waveforms section.
28 ELAB-080 User Guide

B) "DC Offset" Controls These controls allow you to select the desired dc offset of the output waveform. The DC offset is the amount that the entire waveform is offset from ground (zero volts). When you adjust the DC offset, you can see that the waveform looks the same, but moves up or down the voltage scale according to the direction of the DC offset. You can change the value of the DC offset in volts by typing in the desired value or by using the up and down arrow buttons. You can click the up and down arrow buttons to change the value in small steps or hold them down to change the value rapidly. Total output including DC offset is limited to about +/- 3 volts (with infinite impedance). If you create a waveform that exceeds the maximum voltage the AWG can output, the AWG waveform will be shown with a dashed line in those voltages (see the AWG display)
C) "Amplitude" Controls These controls allow you to select the desired amplitude of the output waveform. You can change the value in volts by typing in the desired value or by using the up and down arrow buttons. You can click the up and down arrow buttons to change the value in small steps or hold them down to change the value rapidly. The amplitude is limited to approximately +/- 1.25 Volts in 1x gain mode and approximately +/- 3 Volts in 4x gain mode, assuming no load (infinite impedance) for both gain settings. A 50 Ohm load reduces these voltages by half.
D) "Impedance" Controls These controls allow you to select the output impedance, or "load", your circuit will place on the AWG output. For a fifty ohm load, all voltages will be half of what they would measure with infinite impedance (infinite impedance is often referred to as "no load" in this documentation). After you input the output impedance, the AWG display will update to show the voltage output you should expect for the load that you have specified.
E) "Gain" Selection This selection chooses what the amount of gain applied to the waveform. In 1x gain mode, the Elab-080 AWG is capable of putting out a signal spanning approximately +/- 1.25 volts (before DC offset). In 4x gain mode, it is capable of putting out a signal spanning approximately +/- 3 volts (before DC offset). These voltages assume no load (ie near-infinite impedance). A 50 Ohm load reduces these voltages by half.
F) "Import from DSO" Button This button initiates importing a waveform from the DSO display into the AWG to replace the current analog waveform. The following considerations should be noted when moving data from the DSO to the AWG:
• At least one DSO channel must be enabled in order to import data. If both channels are enabled, you will be asked which channel you wish to import from.
• The DSO timing cursors (A and B) must be placed on either side of the data you wish to import. To place a timing cursor, right-click on the DSO waveform, and choose "Set Timing Cursor".
• Voltages that cannot be output by the AWG with current AWG settings will be clipped to what the AWG can actually output.
• If your selection to import contains an area with no data or invalid data, those areas will be imported as zero volts.
• Upon import, the AWG wave frequency will be adjusted so that the timescale of the AWG output will be the same timescale as the selected DSO data. (You can verify this by checking the "Marker differentials in freq. units" checkbox in the "Data" tab under the "Data Capture" tab: after you import DSO data into the AWG, the displayed frequency between the DSO timing cursors should be the same as the AWG wave frequency).
• Upon import, the DC Offset of the AWG analog wave will be set to zero volts. • Upon import, the AWG analog "Wave Style" drop down will be changed to "Custom".
29 ELAB-080 User Guide
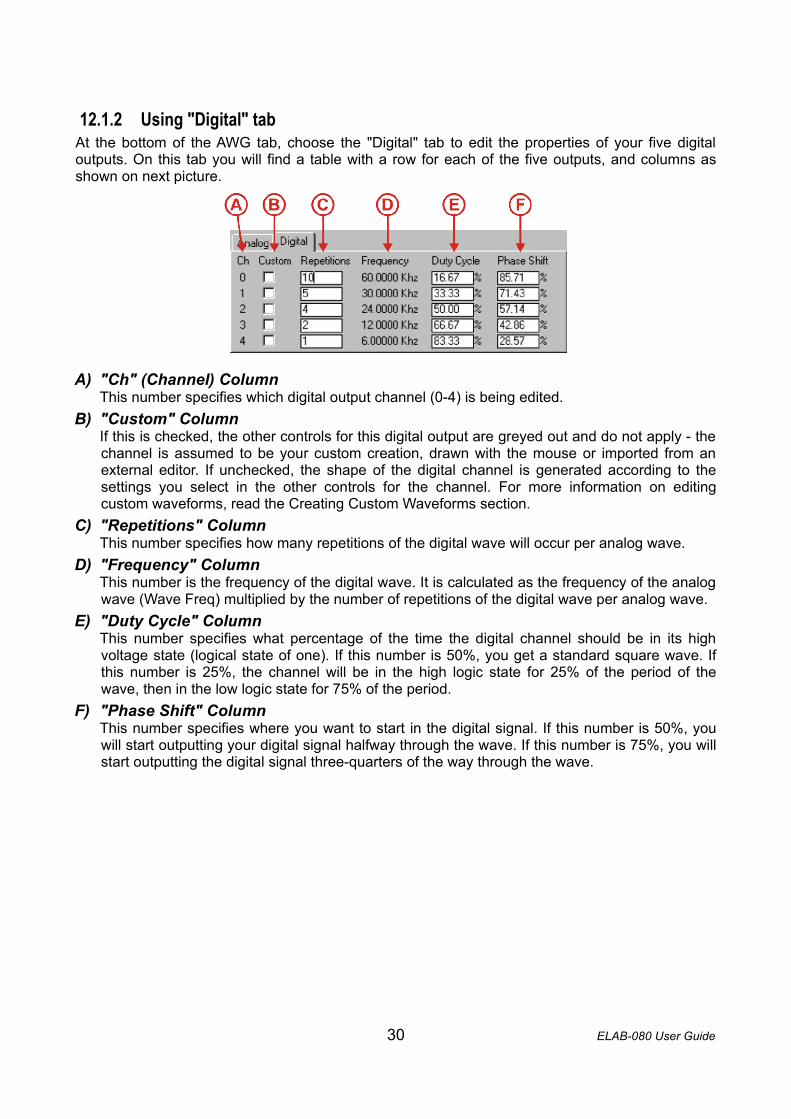
12.1.2 Using "Digital" tabAt the bottom of the AWG tab, choose the "Digital" tab to edit the properties of your five digital outputs. On this tab you will find a table with a row for each of the five outputs, and columns as shown on next picture.
A) "Ch" (Channel) Column This number specifies which digital output channel (0-4) is being edited.
B) "Custom" Column If this is checked, the other controls for this digital output are greyed out and do not apply - the channel is assumed to be your custom creation, drawn with the mouse or imported from an external editor. If unchecked, the shape of the digital channel is generated according to the settings you select in the other controls for the channel. For more information on editing custom waveforms, read the Creating Custom Waveforms section.
C) "Repetitions" Column This number specifies how many repetitions of the digital wave will occur per analog wave.
D) "Frequency" Column This number is the frequency of the digital wave. It is calculated as the frequency of the analog wave (Wave Freq) multiplied by the number of repetitions of the digital wave per analog wave.
E) "Duty Cycle" Column This number specifies what percentage of the time the digital channel should be in its high voltage state (logical state of one). If this number is 50%, you get a standard square wave. If this number is 25%, the channel will be in the high logic state for 25% of the period of the wave, then in the low logic state for 75% of the period.
F) "Phase Shift" Column This number specifies where you want to start in the digital signal. If this number is 50%, you will start outputting your digital signal halfway through the wave. If this number is 75%, you will start outputting the digital signal three-quarters of the way through the wave.
30 ELAB-080 User Guide
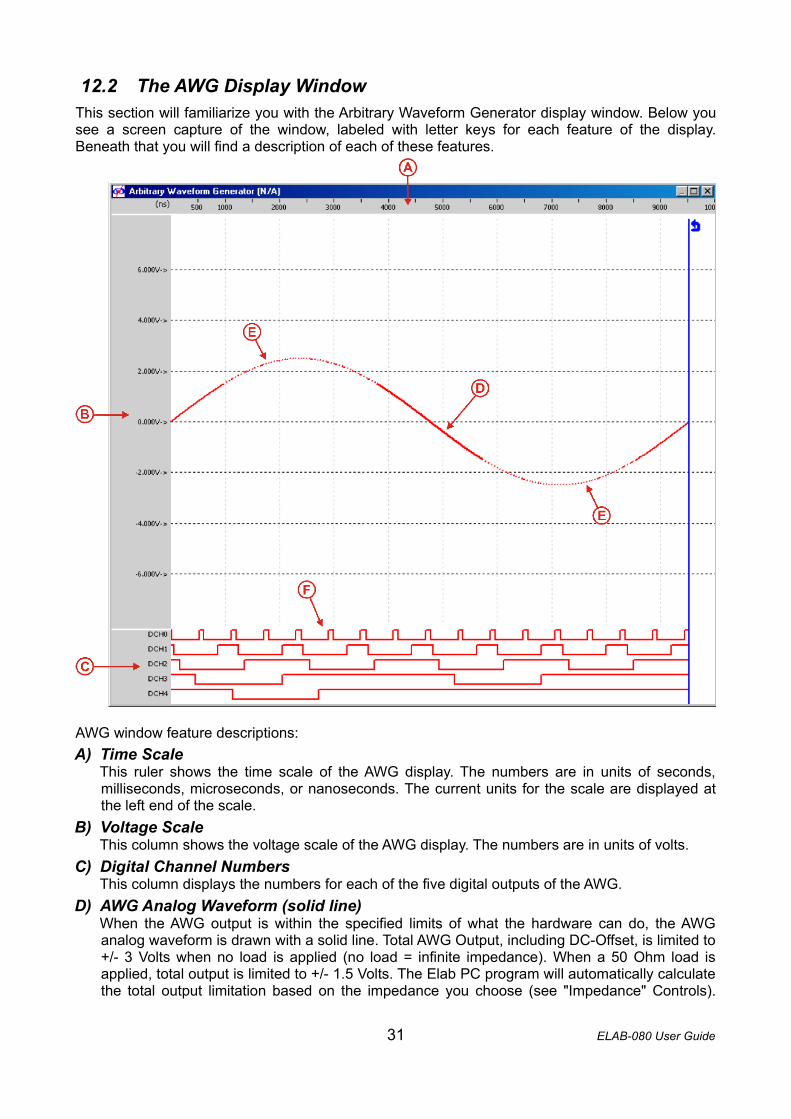
12.2 The AWG Display WindowThis section will familiarize you with the Arbitrary Waveform Generator display window. Below you see a screen capture of the window, labeled with letter keys for each feature of the display. Beneath that you will find a description of each of these features.
AWG window feature descriptions:A) Time Scale
This ruler shows the time scale of the AWG display. The numbers are in units of seconds, milliseconds, microseconds, or nanoseconds. The current units for the scale are displayed at the left end of the scale.
B) Voltage ScaleThis column shows the voltage scale of the AWG display. The numbers are in units of volts.
C) Digital Channel NumbersThis column displays the numbers for each of the five digital outputs of the AWG.
D) AWG Analog Waveform (solid line)When the AWG output is within the specified limits of what the hardware can do, the AWG analog waveform is drawn with a solid line. Total AWG Output, including DC-Offset, is limited to +/- 3 Volts when no load is applied (no load = infinite impedance). When a 50 Ohm load is applied, total output is limited to +/- 1.5 Volts. The Elab PC program will automatically calculate the total output limitation based on the impedance you choose (see "Impedance" Controls).
31 ELAB-080 User Guide
You can edit the Analog Waveform by left-clicking on it as described in step 3 of Editing a Waveform by Drawing with the Mouse.
E) AWG Analog Waveform (dashed line)When the AWG output is outside the specified limits of what the hardware can do, the AWG analog waveform is drawn with a dashed line. Total AWG Output, including DC-Offset, is limited to +/- 3 Volts when no load is applied (no load = infinite impedance). When a 50 Ohm load is applied, total output is limited to +/- 1.5 Volts. The Elab PC program will automatically calculate the total output limitation based on the impedance you choose (see "Impedance" Controls). You can edit the Analog Waveform by left-clicking on it as described in step 3 of Editing a Waveform by Drawing with the Mouse.
F) Digital WaveformsThe data that the AWG outputs on the five digital output lines can be seen and edited here. Digital outputs are on the same timescale as the analog outputs, and can be edited by left-clicking on them as described in Editing a Waveform by Drawing with the Mouse.
12.2.1 AWG window context menuThe Context menu allows you to access certain display controls quickly and easily. To open the context menu, simply click your right-hand mouse button in the AWG display window. The context menu has the following options that control the behavior of the AWG display window: • Zoom (S/nS)
This submenu allows you to set the current seconds/division (horizontal zoom) of the AWG window. You can choose anything from 5 seconds/division down to 2 nanoseconds/division.
• Wave StyleThis submenu allows quick access to change the wave style (sine wave, triangle wave, square wave, etc).
12.3 Using Preset WaveformsThis topic will describe the process of creating and using preset waveforms with the Elab-080 arbitrary waveform generator. These instructions often refer to the various controls on the "AWG" Tab (see chapter 12.1).Procedure to Use Preset Waveforms:
1. Select the desired type of waveform in the "Waveform Style" selection. You can choose from sine, triangle, square, and flat-line preset waveforms.
2. In the box labeled "impedance", enter the output impedance or "load" that your circuit will put on the AWG. For a fifty ohm load, all voltages will be half of what they would measure with infinite impedance (infinite impedance is referred to as "no load" for the remainder of this document). After you input the output impedance, the AWG display will update to show the voltage output you should expect for the load that you have specified.
3. Set the desired amplitude of the waveform, using the "Amplitude" controls. The amplitude is the peak-to-peak voltage of the waveform. You can change the value in volts by typing in the desired value or by using the up and down arrow buttons. You can click the up and down arrow buttons to change the value in small steps or hold them down to change the value rapidly. The amplitude is limited to approximately +/- 1.25 Volts (with no load) in 1x gain mode and approximately +/- 3 Volts (with no load) in 4x gain mode. To change the gain mode, simply click the desired value in the "Gain" selection. If you create a waveform that exceeds the maximum voltage the AWG can output, the AWG waveform will be shown with a dashed line in those voltages (see the AWG display)
4. Set the desired DC offset of the waveform, using the "DC Offset" controls. The DC offset is the amount that the entire waveform is offset from ground (zero volts). When you adjust the DC offset, you can see that the waveform looks the same, but moves up or down the voltage
32 ELAB-080 User Guide
scale according to the direction of the DC offset. You can change the value of the DC offset in volts by typing in the desired value or by using the up and down arrow buttons. You can click the up and down arrow buttons to change the value in small steps or hold them down to change the value rapidly. Total output including DC offset is limited to about +/- 3 volts (with no load). If you create a waveform that exceeds the maximum voltage the AWG can output, the AWG waveform will be shown with a dashed line in those voltages (see the AWG display)
5. Set the desired frequency of the waveform, using the "Wave Freq" controls. You can click the up and down arrow buttons to change the value in small steps or hold them down to change the value rapidly. The actual frequency that will be generated displays next to the setting box. As you adjust the frequency, your waveform may become hard to see clearly because of the current time scale. If the AWG display window is too "zoomed in" to see the waveform as desired, click the "S" button to zoom out. If the AWG display window is too "zoomed out" to see the waveform as desired, click the "nS" button to zoom in. You can also adjust the size of the AWG display window by dragging the edge of the window with your mouse.
6. For best results, make sure that the "Number of Points" controls are set to "Auto." This will allow the Elab software to automatically calculate the best number of points to match your waveform's frequency.
7. If you would like the waveform to be repeated continuously instead of just outputting once, make sure that the "Repeat" checkbox is checked.
8. If you would like the waveform to start by external control: 1. Make sure the "Trigger" checkbox is checked. 2. Make sure that your external input is connected to the "TRIG" input on the right side of the
Elab-080 input / output block. To use the external trigger, you must drive the input with a logic signal (0 < 0.65V, 1 > 2.4V). If in non-repeating mode, the specified waveform will be output once when the input logic signal is driven high. If in repeating mode, the specified waveform will be output continuously until the logic signal goes low.
Warning: Do not drive the external trigger with signals above 6.5 volts or the internal circuitry will be damaged.
9. Make sure that one of the oscilloscope probes is connected to the "AWG OUTPUT" connector and also connect to your circuitry that requires the waveform input. For proper operation with the AWG, the probe's gain switch should be set to "x1."
10. If the AWG is not already running (the Go button is grayed and the Stop button is not grayed when the AWG is running), click the Go button (the button with the green right-pointing triangle). Depending on the settings you chose the waveform will be output once or continuously, starting either when you click the Go button or when the external trigger is set.
12.4 Creating and using custom waveformsThis topic will describe the process of creating, editing and using custom waveforms with the Elab-080 arbitrary waveform generator. These instructions often refer to the various controls on the "AWG" Tab (see chapter 12.1)Custom Waveform Procedures:
• Creating a Waveform Based on a Preset Waveform Custom waveforms are often easier to edit if they are started from a preset waveform. This procedure guides you through the process of creating a new custom waveform that is based on the preset waveforms of the Elab-080's AWG (see chapter 12.4.1).
• Editing a Waveform by Drawing with the Mouse Basic waveforms can be easy to draw. This procedure guides you through the process of editing a custom waveform by drawing it with your mouse in the Elab-080 software (see chapter 12.4.2).
33 ELAB-080 User Guide
• Editing a Waveform by Using an External Editor This procedure guides you through the process of editing a custom waveform by opening it in a text editor or spreadsheet application. (see chapter 12.4.3)
• Using a Custom Waveform This procedure guides you through the process of using the custom waveforms that you have created and edited (see chapter 12.4.4).
12.4.1 Creating a Waveform Based on a Preset Waveform1. Decide what type of preset waveform would give you the best starting point for the custom
wave you want to create. 2. Follow steps 1-6 of Using Preset Waveforms (see chapter 12.3), using the waveform type that
you decided in step 1. Be careful to select the appropriate frequency for your custom waveform. The frequency of your custom waveform can be modified after it is defined, but the resampling that happens when you do so can change the shape of the waveform somewhat.
3. Click the "Export" button on the "AWG" tab, and save the waveform file. It is recommended to give the file an appropriate name based on the settings that produced it.
4. Now you have created a preset waveform and you are ready to edit it if desired.
12.4.2 Editing a Waveform by Drawing with the Mouse1. Open the custom waveform that you want to edit (from Creating a Waveform Based on a
Preset Waveform) by clicking the "Import" button and selecting the desired file. 2. Adjust the AWG display using the "S" and "nS" buttons until the waveform fills most of the
window (the blue repeat line is close to the right side of the window), giving you more precision in drawing the waveform. You may also want to expand the AWG window to fill more of the screen, also giving you more drawing precision.
3. Draw the desired waveform on the AWG window using the mouse. Clicking with the left mouse button will modify the waveform such that it passes through the center of the crosshair mouse cursor. Dragging the mouse with the left button held down is the easiest way to draw the waveform. Remember that the AWG output has limits of approximately +/- 1.25 Volts in 1x gain mode and approximately +/- 3 Volts in 4x gain mode, assuming no load (infinite impedance) at either gain mode. When you draw outside of the specified limits of the AWG, the waveform will drawn with a dashed line, and when you exceed the range of the AWG DAC itself, your waveform will be clipped at that voltage.
4. When you are finished drawing the desired waveform, click the "Export" button on the "AWG" tab to save the waveform to a file. It is recommended that you save to a different file than you started with and give the new file an appropriate name.
5. Now you have created your custom waveform and you are ready to use it.
12.4.3 Editing a Waveform by Using an External Editor1. Open the custom waveform that you want to edit (from Creating a Waveform Based on a
Preset Waveform) in the external editor of your choice. Suggested editors are spreadsheet applications like OpenOffice Calc and Microsoft Excel.
2. Edit the waveform by changing the data within each row. Do not add or remove points to the AWG waveform. The number of rows of AWG voltages must be 65536. AWG data is resampled from the 65536 voltages to fit the number of points in the AWG wave actually being used. It is recommended that you save a copy of the file in the preferred format of the spreadsheet application. That will allow you to use all the power of the functions offered by the spreadsheet application to generate and view the waveform.
3. Copy the data rows from the spreadsheet back to the original AWG waveform file, making sure that you copy only the values, not the formulas.
4. Save the modified AWG waveform file, making sure to save the file as tab-delimited text
34 ELAB-080 User Guide
instead of the spreadsheet application's preferred formatting. 5. Now you have created your custom waveform and you are ready to use it.
12.4.4 Using a Custom Waveform1. Open the custom waveform that you want to use by clicking the "Import" button and selecting
the desired file. 2. Set the desired DC offset of the waveform, using the "DC Offset" controls. The DC offset is the
amount that the entire waveform is offset from ground (zero volts). When you adjust the DC offset, you can see that the waveform looks the same, but moves up or down the voltage scale according to the direction of the DC offset. You can change the value of the DC offset in volts by typing in the desired value or by using the up and down arrow buttons. You can click the up and down arrow buttons to change the value in small steps or hold them down to change the value rapidly. Total output including DC offset is limited to about +/- 3 volts (with no load). If you create a waveform that exceeds the maximum voltage the AWG can output, the AWG waveform will be shown with a dashed line in those voltages (see the AWG display)
3. If you would like the waveform to be repeated continuously instead of just outputting once, make sure that the "Repeat" checkbox is checked.
4. If you would like the waveform to start by external control: 1. Make sure the "Trigger" checkbox is checked. 2. Make sure that your external input is connected to the "TRIG" input on the right side of
the Elab-080 input / output block. To use the external trigger, you must drive the input with a logic signal (0 < 0.65V, 1 > 2.4V). If in non-repeating mode, the specified waveform will be output once when the input logic signal is driven high. If in repeating mode, the specified waveform will be output continuously until the logic signal goes low.
Warning: Do not drive the external trigger with signals above 6.5 volts or the internal circuitry will be damaged.
5. Make sure that one of the oscilloscope probes is connected to the "AWG OUTPUT" connector and also connect to your circuitry that requires the waveform input. For proper operation with the AWG, the probe's gain switch should be set to "x1."
6. If the AWG is not already running (the Go button is grayed and the Stop button is not grayed when the AWG is running), click the Go button (the button with the green right-pointing triangle). Depending on the settings you chose the waveform will be output once or continuously, starting either when you click the Go button or when the external trigger is set.
35 ELAB-080 User Guide
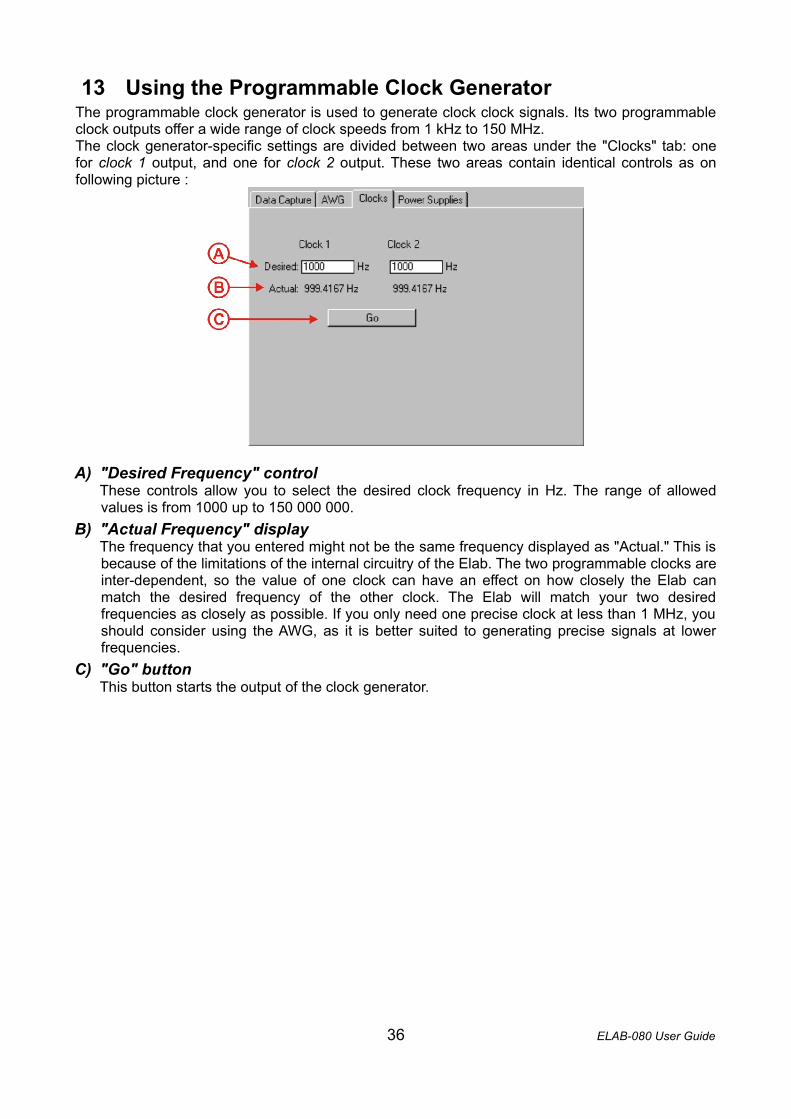
13 Using the Programmable Clock GeneratorThe programmable clock generator is used to generate clock clock signals. Its two programmable clock outputs offer a wide range of clock speeds from 1 kHz to 150 MHz. The clock generator-specific settings are divided between two areas under the "Clocks" tab: one for clock 1 output, and one for clock 2 output. These two areas contain identical controls as on following picture :
A) "Desired Frequency" controlThese controls allow you to select the desired clock frequency in Hz. The range of allowed values is from 1000 up to 150 000 000.
B) "Actual Frequency" displayThe frequency that you entered might not be the same frequency displayed as "Actual." This is because of the limitations of the internal circuitry of the Elab. The two programmable clocks are inter-dependent, so the value of one clock can have an effect on how closely the Elab can match the desired frequency of the other clock. The Elab will match your two desired frequencies as closely as possible. If you only need one precise clock at less than 1 MHz, you should consider using the AWG, as it is better suited to generating precise signals at lower frequencies.
C) "Go" buttonThis button starts the output of the clock generator.
36 ELAB-080 User Guide
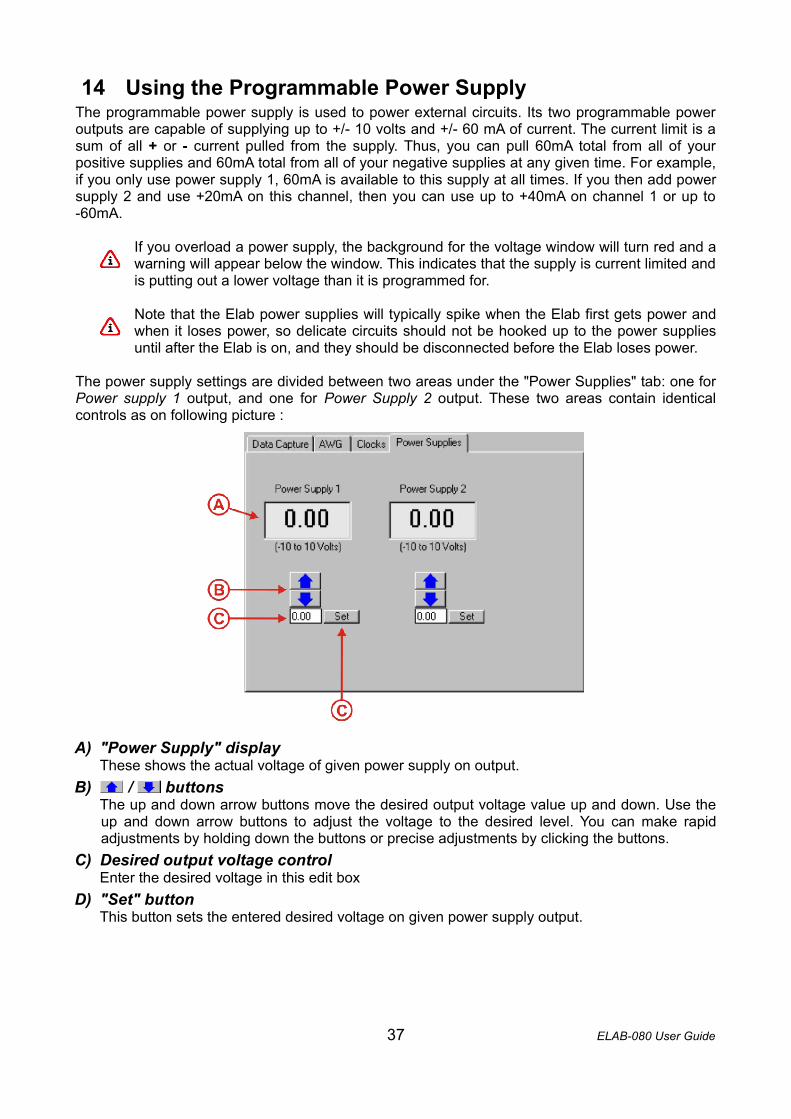
14 Using the Programmable Power SupplyThe programmable power supply is used to power external circuits. Its two programmable power outputs are capable of supplying up to +/- 10 volts and +/- 60 mA of current. The current limit is a sum of all + or - current pulled from the supply. Thus, you can pull 60mA total from all of your positive supplies and 60mA total from all of your negative supplies at any given time. For example, if you only use power supply 1, 60mA is available to this supply at all times. If you then add power supply 2 and use +20mA on this channel, then you can use up to +40mA on channel 1 or up to -60mA.
If you overload a power supply, the background for the voltage window will turn red and a warning will appear below the window. This indicates that the supply is current limited and is putting out a lower voltage than it is programmed for.
Note that the Elab power supplies will typically spike when the Elab first gets power and when it loses power, so delicate circuits should not be hooked up to the power supplies until after the Elab is on, and they should be disconnected before the Elab loses power.
The power supply settings are divided between two areas under the "Power Supplies" tab: one for Power supply 1 output, and one for Power Supply 2 output. These two areas contain identical controls as on following picture :
A) "Power Supply" displayThese shows the actual voltage of given power supply on output.
B) / buttonsThe up and down arrow buttons move the desired output voltage value up and down. Use the up and down arrow buttons to adjust the voltage to the desired level. You can make rapid adjustments by holding down the buttons or precise adjustments by clicking the buttons.
C) Desired output voltage controlEnter the desired voltage in this edit box
D) "Set" buttonThis button sets the entered desired voltage on given power supply output.
37 ELAB-080 User Guide

15 Technical SupportThis section will help answer your questions when you have unanticipated problems with the Elab-080. In general, the first step to take when you encounter problems is to check for software upgrades for the Elab. As problems are discovered, they will be fixed as soon as possible in new software releases.
15.1 Software Upgrades Dynon Instruments and OSCILOSKOPY.COM is committed to improving the quality and functionality of the Elab-080. As a result, we will release software upgrades, which could fix problems that have been found as well as improve or add features. Software upgrades can be found on downloads page (www.osciloskopy.com or www.dynonistruments.com). Follow the instructions for Installing from the Internet in this help documentation.
15.2 Troubleshooting Elab ProblemsThis section contains information to help you to diagnose and solve some of the more common problems encountered with the Elab-080. If you don't see the problem that you are experiencing mentioned in this section, please contact Dynon Instruments Technical Support or distributor OSCILOSKOPY.COM support. Common Problems Experienced with the Elab-080:
Elab-080 software randomly "freezes" or "locks up."
Solution : Restarting the Elab-080 System The Elab-080 software should not lock up during normal usage, but there are some combinations of operating system, hardware, software, and circumstances that could possibly cause problems. If your Elab-080 appears to be locked up in some way, try the following steps: 1. Reset the elab by performing the following steps:
a. Close the Elab PC software by whatever means are necessary. (You may have to use <CTRL><ALT><DELETE>.)
b. Unplug the Elab hardware from both the USB and power connectors. c. Plug in the USB connector, then the power connector to the Elab. d. Start the Elab software again.
2. If the preceding steps don't fix the problem, try restarting your computer 3. If all else fails, contact Dynon Instruments or distributor OSCILOSKOPY.COM
support (contacts are noted on title page of this user guide), and we'll help you figure it out.
38 ELAB-080 User Guide