e-lecture 2: school finance
DESCRIPTION
E-Lecture 2: School Finance. SCHOOL FINANCE. How are schools financed in the United States? How does the financing of urban district schools compare to financing of suburban or rural district schools, on the one hand, and to urban charter schools, on the other? - PowerPoint PPT PresentationTRANSCRIPT

E-Lecture 2:School Finance

SCHOOL FINANCE• How are schools financed in the United States?• How does the financing of urban district schools
compare to financing of suburban or rural district schools, on the one hand, and to urban charter schools, on the other?
• How significant is equitable financing for equitable educational outcomes?
• What does, can, and should money get used for in urban school systems?
• How is federal financing through ARRA and RTTT changing the answers to these questions?
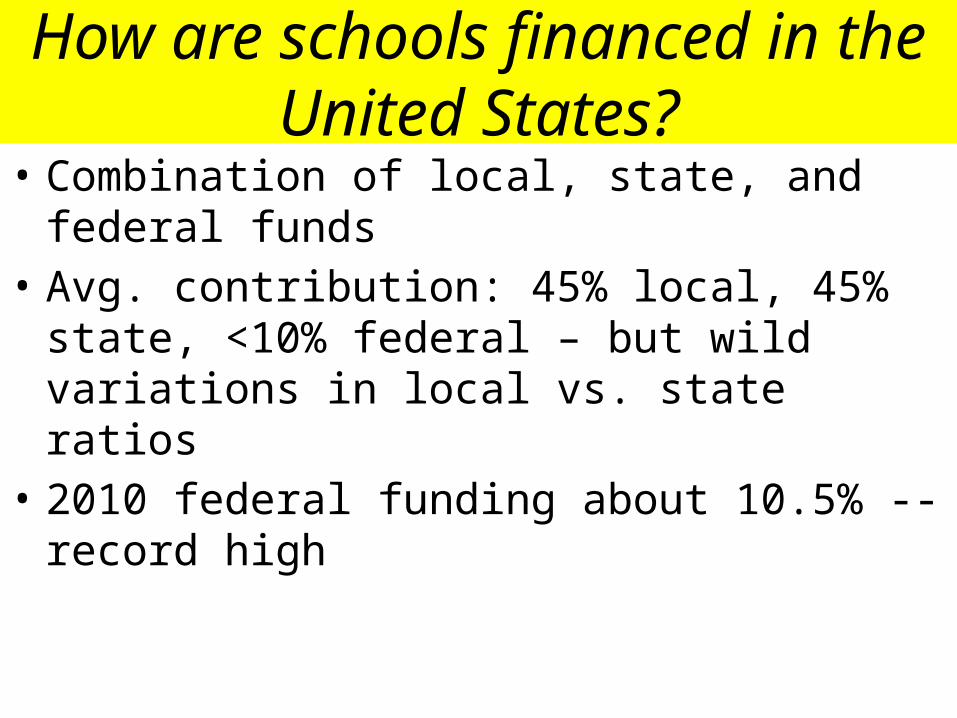
• Combination of local, state, and federal funds• Avg. contribution: 45% local, 45% state, <10%
federal – but wild variations in local vs. state ratios• 2010 federal funding about 10.5% -- record high
How are schools financed in the United States?
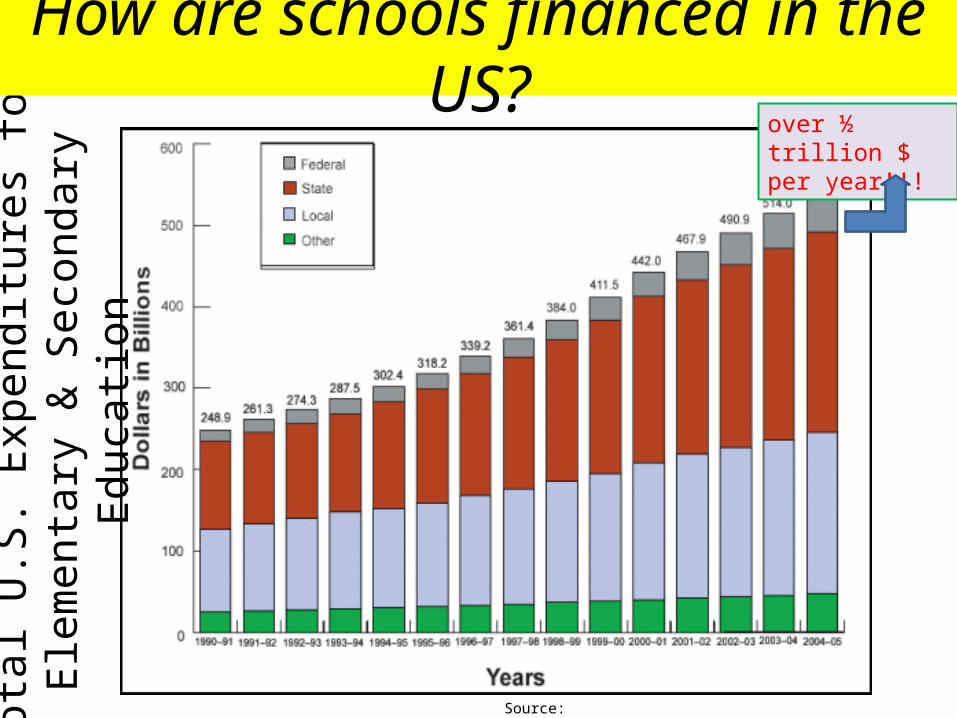
Source: http://www.ed.gov/about/overview/fed/10facts/edlite-chart.html
Tota
l U.S
. Exp
endi
ture
s fo
rEl
emen
tary
& S
econ
dary
Edu
catio
n over ½ trillion $ per year!!!
How are schools financed in the US?
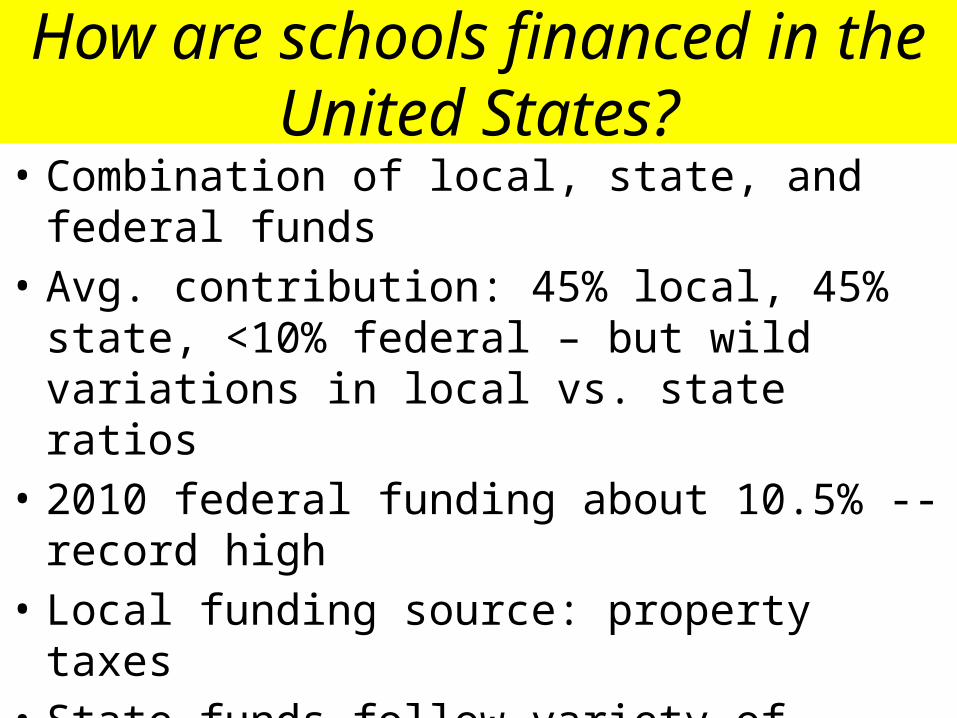
• Combination of local, state, and federal funds• Avg. contribution: 45% local, 45% state, <10%
federal – but wild variations in local vs. state ratios• 2010 federal funding about 10.5% -- record high• Local funding source: property taxes• State funds follow variety of models:
fixed per-pupil allocation redistributive by district redistributive by student characteristics incentives-based and/or performance-oriented
How are schools financed in the United States?

How does the financing of urban district schools compare to
financing of suburban or rural district schools, on the one hand, and to urban charter
schools, on the other?

• High-poverty schools tend to have lower levels of funding than low-poverty schools
How are school financing and student demographics related?
Source: http://epsl.asu.edu/eprp/EPSL-0206-102-EPRP.doc(1998)

• High-poverty schools tend to have lower levels of funding than low-poverty schools
How are school financing and student demographics related?
Hill, Roza, and Harvey, 2009, p. 10.

• High-poverty schools tend to have lower levels of funding than low-poverty schools
• High-minority schools <$ than low-minority schools
How are school financing and student demographics related?
Gap in Per-Pupil Funding
High-Poverty versus Low-Poverty Districts
–$773 per student
High-Minority versus Low-Minority Districts
–$1,122 per student
Education Trust analyses based on U.S. Department of Education and U.S. Census Bureau data for the 2005-06 school year.
Source: http://www.edtrust.org/sites/edtrust.org/files/publications/files/Funding%20Equity%20Data%20Points.pptx

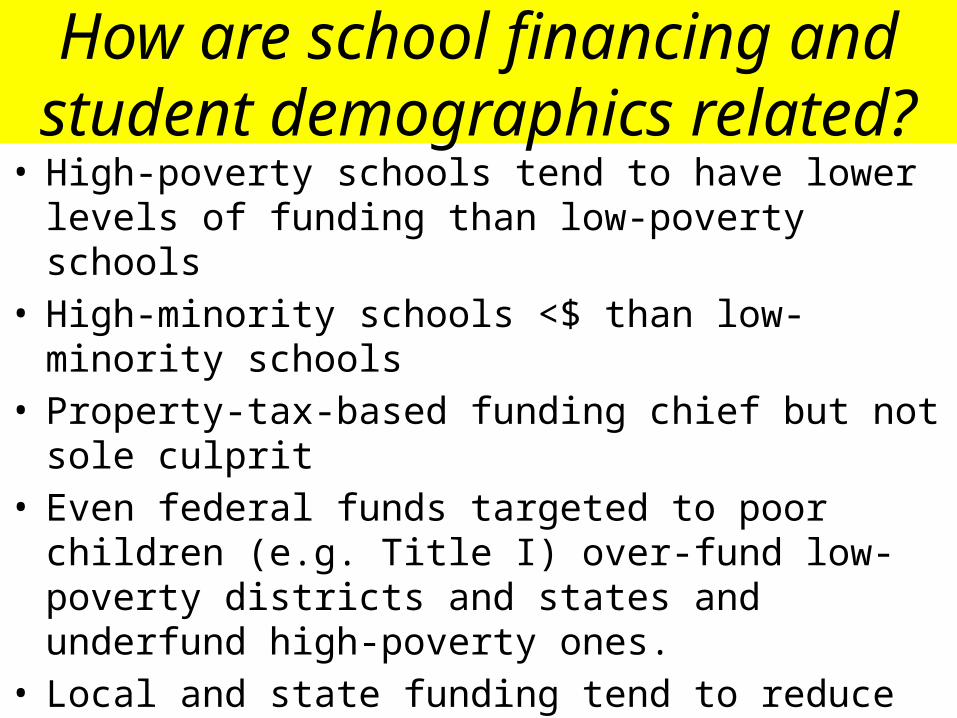
• High-poverty schools tend to have lower levels of funding than low-poverty schools
• High-minority schools <$ than low-minority schools• Property-tax-based funding chief but not sole culprit• Even federal funds targeted to poor children (e.g. Title I)
over-fund low-poverty districts and states and underfund high-poverty ones.
How are school financing and student demographics related?
Title I Allocations Per Poor Child in Selected States, 2008-09
MD IL KS GA TX WA AL ID UT
$2,067 $1,822 $ 1,707 $1,561 $1,425 $1,408 $1,366 $1,286 $1,238
Source: http://www.edtrust.org/sites/edtrust.org/files/publications/files/Funding%20Equity%20Data%20Points.pptx
• High-poverty schools tend to have lower levels of funding than low-poverty schools
• High-minority schools <$ than low-minority schools• Property-tax-based funding chief but not sole culprit• Even federal funds targeted to poor children (e.g. Title I)
over-fund low-poverty districts and states and underfund high-poverty ones.
• Local and state funding tend to reduce proportionately when federal compensatory funds are provided
• Even supposed within-district equity often hide salary inequities because budgets are done by FTEs, not salaries
How are school financing and student demographics related?

Source: “No Accounting for Fairness: Equitable Education Funding Remains Elusive in Ohio,” The Education Trust, December 2008.
District Gaps in Average Teacher Salaries Between Highest Poverty and Lowest Poverty Elementary Schools, 2007-08
Akron -$4,919
Canton -$6,397
Cincinnati -$2,637
Cleveland -$204
Columbus -$1,509
Olentangy -$6,246
Ohio: Within-district teacher salary gaps between high- and low-poverty schools
Source: http://www.edtrust.org/sites/edtrust.org/files/publications/files/Funding%20Equity%20Data%20Points.pptx

How does the financing of urban district and charter schools compare?
“In most states … charter schools receive less public funding per student than school districts, and they
also lack access to locally generated revenues or funds districts typically receive for facilities, transportation,
and other specific functions. Inequitable resources remain a major barrier to quality and scale in the
charter school movement and, since charter schools in most states disproportionately serve minority and
disadvantaged populations, a civil rights issue.”--Mead and Rotherham, 2007
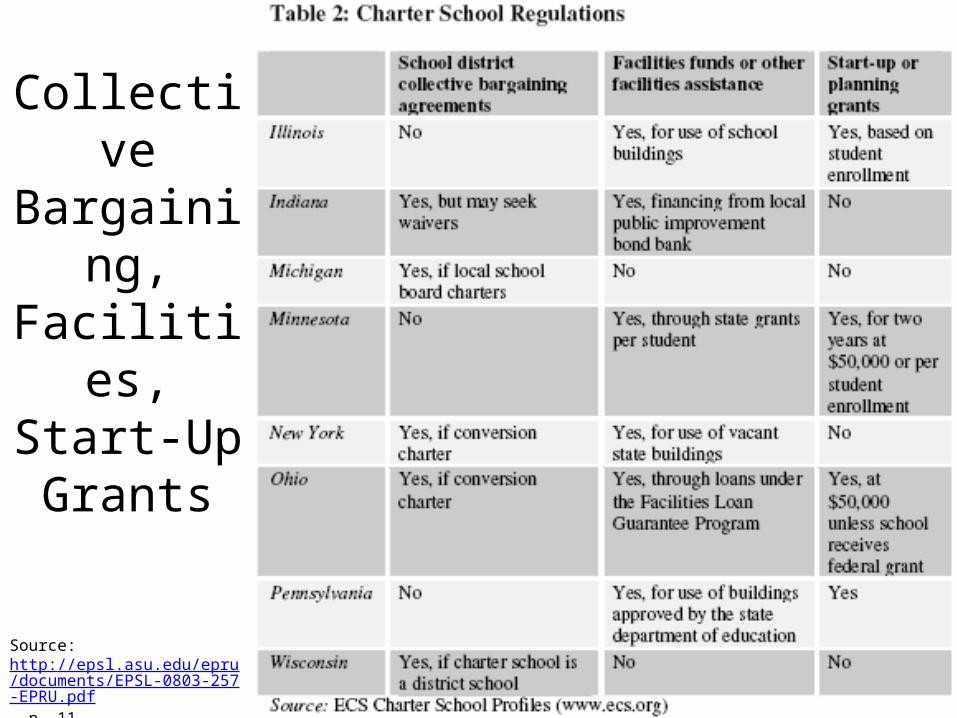
Collective Bargaining, Facilities, Start-Up Grants
Source: http://epsl.asu.edu/epru/documents/EPSL-0803-257-EPRU.pdf, p. 11.

Sample Range of Charter
School Funding
Formulas
Source: http://epsl.asu.edu/epru/documents/EPSL-0803-257-EPRU.pdf, p. 10.

Charter complaints about state/local funding:
• Funding transferred from state or school district is often lower than district’s own per-pupil expenditures
• Charters denied in-kind goods and services
• Funding fails to take account of start-up costs
District and union complaints about charter funding:
• Funds follow students to charters, but often don’t follow them back mid-year
• Lack of union contracts lower teacher salaries and other benefits
• Low public oversight or accountability
How does the financing of urban district and charter schools compare?

How significant is equitable financing for equitable educational outcomes?
Does money matter?

Real spending
has tripled in the past
half-century. Has the
quality of education similarly
increased??Source: http://www.ed.gov/about/overview/fed/10facts/edlite-chart.html
In the past decade (2001-2011), average
spending has increased another 10%.

Guthrie, 2006, Table 1

Hill, Roza, and Harvey, 2009, p. 37.
“Money matters when the real inputs that it purchases matter.”
(Ferguson, 1991, p. 483)
vs.
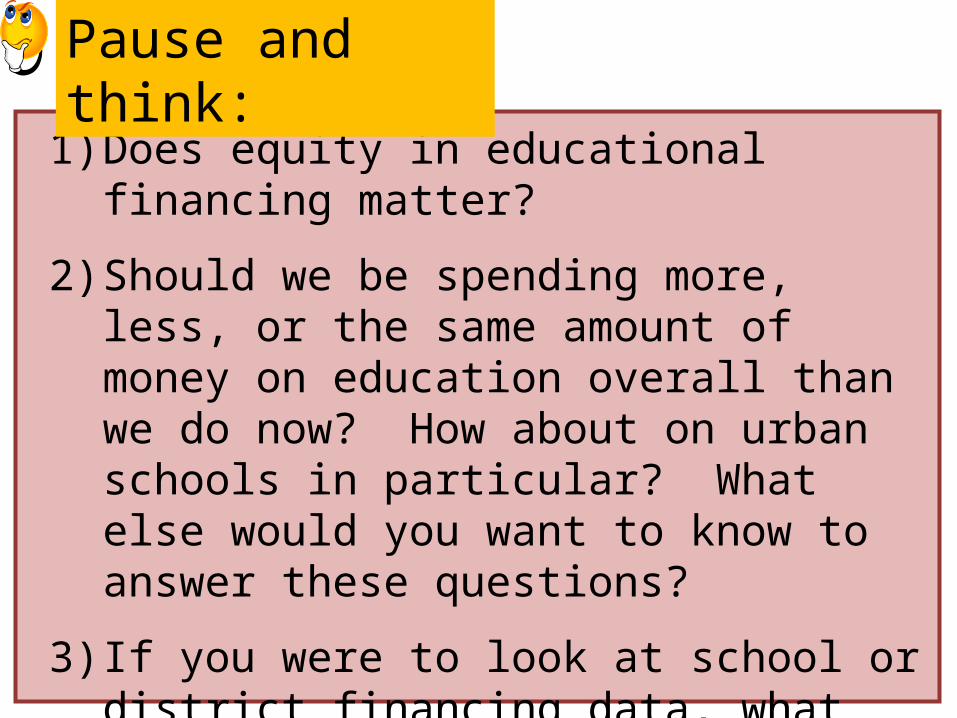
1) Does equity in educational financing matter?
2) Should we be spending more, less, or the same amount of money on education overall than we do now? How about on urban schools in particular? What else would you want to know to answer these questions?
3) If you were to look at school or district financing data, what would you want to know in order to assess it? What data matters to you? What values matter to you?
Pause and think:
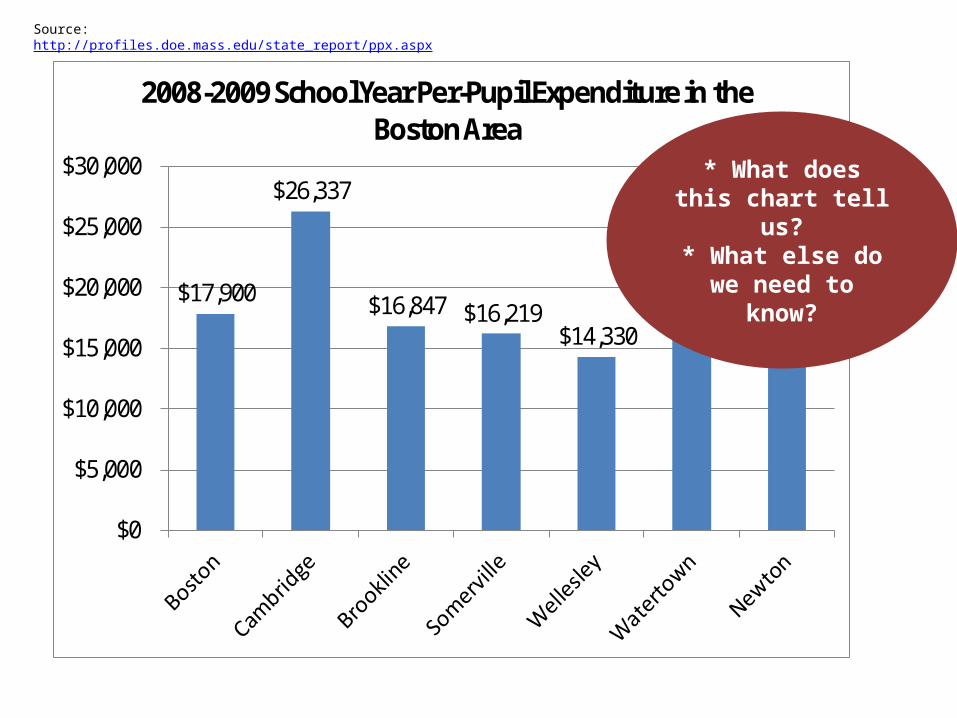
$17,900
$26,337
$16,847 $16,219 $14,330
$16,277 $16,243
$0
$5,000
$10,000
$15,000
$20,000
$25,000
$30,000
2008-2009 School Year Per-Pupil Expenditure in the Boston Area
Source: http://profiles.doe.mass.edu/state_report/ppx.aspx
* What does this chart tell us?
* What else do we need to know?

2.49%
6%
28.97%
7.44%
4.12%
2.81%1.24%
9.79%
6.48%
22.16%
8.11%
2008: Per-Pupil Expenditure inBOSTON Public School District
Administration
Instructional Leadership
Classroom and Specialist TeachersOther Teaching Services
Professional Development
Instructional Materials, Equipment, TechnologyGuidance, Counseling, TestingPupil Services
Operations and MaintenanceInsurance, Retirement Programs, and OtherPayments to Out-Of-District Schools
Source: MA Dept. Of Education Total Expenditures: $1,111,006,735
Let’s compare: Boston vs. Newton
Per-pupil costs: $17,900

2.80%
6.38%
36.61%
11.28%1.95%
1.84%3.57%
7.90%
7.47%
14.48%
5.70%
2008: Per-Pupil Expenditure inNEWTON Public School District
Administration
Instructional Leadership
Classroom and Specialist TeachersOther Teaching Services
Professional Development
Instructional Materials, Equipment, TechnologyGuidance, Counseling, TestingPupil Services
Operations and MaintenanceInsurance, Retirement Programs, and OtherPayments to Out-Of-District Schools
Source: MA Dept. Of Education Total Expenditures: $182,606,104
Let’s compare: Boston vs. Newton
Per-pupil costs: $16,243
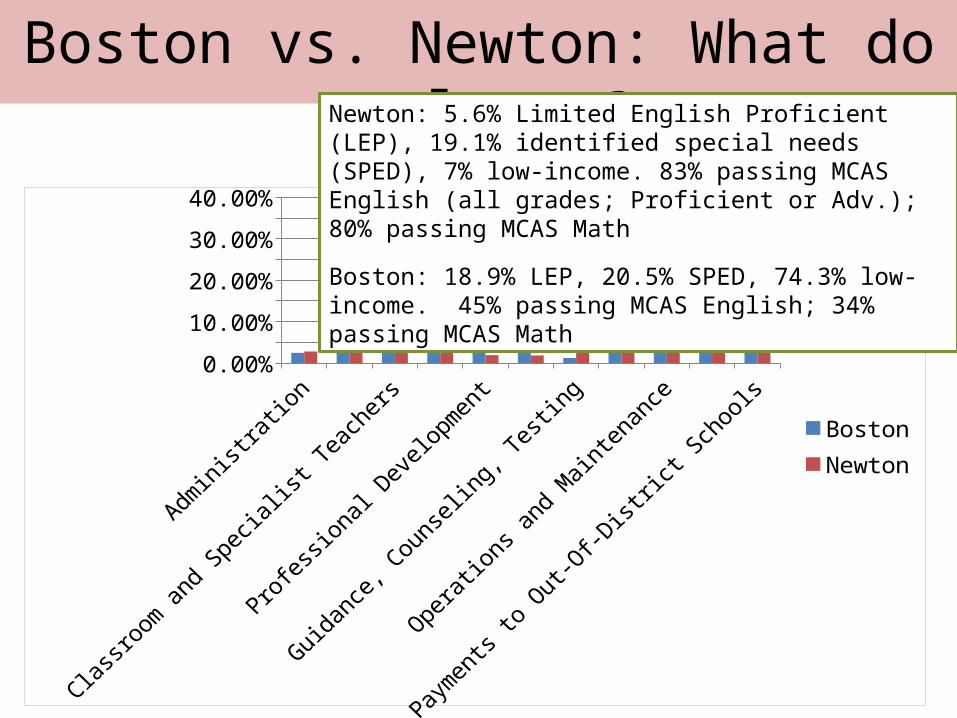
0.00%
10.00%
20.00%
30.00%
40.00%
BostonNewton
Boston vs. Newton: What do we learn?Newton: 5.6% Limited English Proficient (LEP), 19.1% identified special needs (SPED), 7% low-income. 83% passing MCAS English (all grades; Proficient or Adv.); 80% passing MCAS Math
Boston: 18.9% LEP, 20.5% SPED, 74.3% low-income. 45% passing MCAS English; 34% passing MCAS Math
• How should differences in student and/or community demographics be taken into account?
• Do differences in rates of expenditures on “instructional core” reveal different (perhaps misbegotten) priorities or different student needs?
• Should we pay any attention to inputs at all, or are outputs all that matter?
How significant is school financing? Some dilemmas to ponder:
Pause and think

How significant is equitable financing for equitable educational outcomes?
Is this even the right question? EQUITY
ADEQUACY
EFFICIENCY

How significant is equitable financing for equitable educational outcomes?
What financing sources should we consider?
Grants
other private
PTA
Family expenditures
public

Another path to inequity: School/District Fundraising
Source: Reich, Rob (2005). "A Failure of Philanthropy: American Charity Shortchanges the Poor, and Public Policy is Partly to Blame." Stanford Social Innovation Review(Winter): 24-33.

How significant is equitable financing for equitable educational outcomes?
Is this even the right question?
INCENTIVESShouldn’t more successful teachers and districts be rewarded for their
success and get more money(e.g. via merit pay)?
Shouldn’t failing districts get extra resources to help them succeed?
How can we equalize school financing
without a backlash from wealthy
districts?

Some Sources:
Education Trust (2010). “Funding Fairness.” http://www.edtrust.org/issues/pre-k-12/funding-fairness. Accessed Dec. 3, 2010.
Hill, Paul T., Roza, Marguerite, and Harvey, James. Facing the Future: Financing Productive Schools. Report released Dec. 2008. Center on Reinventing Public Education.
Koski, William S. and Rob Reich “When Adequate Isn’t: The Retreat From Equity in Educational Law and Policy and Why it Matters.” Emory Law Review, Vol. 56, No. 3, 2006. pp. 545-617.
Liu, Goodwin (2007). “Improving Title I Funding Equity Across States, Districts, and Schools.” Working Paper 7, March 2007. School Finance Redesign Project. http://www.crpe.org/cs/crpe/download/csr_files/wp_sfrp7_liu_mar07.pdf. Accessed Jan. 10, 2010.
Mead, Sara and Andrew J. Rotherham (2007). “A Sum Greater Than the Parts: What States Can Teach Each Other About Charter Schooling.” Education Sector Reports. http://www.educationsector.org/usr_doc/CharterSchoolSummary.pdf. Accessed Jan. 10, 2010.
Reich, Rob (2005). "A Failure of Philanthropy: American Charity Shortchanges the Poor, and Public Policy is Partly to Blame." Stanford Social Innovation Review (Winter): 24-33.