e m p any li ite - sobeys corporate
TRANSCRIPT

EMPIRE COMPANY LIMITED 2007 ANNUAL REPORT
Clearly focused on our strengths
EM
PIR
E C
OM
PA
NY
LIM
ITE
D
20
07
AN
NU
AL R
EP
OR
T
7/26/07 7:17:56 AM7/26/07 7:17:56 AM

EMPIRE COMPANY LIMITED (TSX: EMP.A) is a Canadian
company whose key businesses include food retailing
and related real estate. Guided by conservative business
principles, our primary goal is to grow long-term shareholder
value through income and cash flow growth and equity
participation in businesses that have the potential for
long-term growth and profitability.
Financial Highlights
52 Weeks Ended 52 Weeks Ended 53 Weeks Ended ($ in millions, except per share amounts) May 5, 2007 May 6, 2006 (1) May 7, 2005
OPERATIONS
Revenue $ 13,366.7 $ 13,063.6 $ 12,435.2
Operating income 440.3 491.4 463.7
Operating earnings 204.4 202.0 182.9
Capital gains and other items, net of tax 5.7 94.8 3.7
Net earnings 210.1 296.8 186.6
FINANCIAL CONDITION
Total assets $ 5,224.9 $ 5,051.5 $ 4,929.2
Long-term debt 881.9 809.8 974.4
Shareholders’ equity 2,135.4 1,965.2 1,709.0
PER SHARE INFORMATION
Operating earnings (fully diluted) $ 3.10 $ 3.07 $ 2.78
Capital gains and other items, net of tax 0.09 1.44 0.05
Net earnings (fully diluted) 3.19 4.51 2.83
Book value 32.37 29.77 25.87
Dividends 0.60 0.56 0.48
SHARE PRICE
High $ 45.25 $ 44.35 $ 38.00
Low 39.49 33.37 24.25
Close 42.33 43.29 36.66
(1) Restated.
TABLE OF CONTENTS
EMPIRE TODAY .. . . . . . . . . . . . . . . . . . . . . . . . . . . . . . . . . . . . . . . . . . . . . . . . . . . . . . . . . . . . . . . . . . . . . . . . . . . . . . . . . . . 2
LETTER TO SHAREHOLDERS . . . . . . . . . . . . . . . . . . . . . . . . . . . . . . . . . . . . . . . . . . . . . . . . . . . . . 4
MESSAGE FROM THE CHAIR . . . . . . . . . . . . . . . . . . . . . . . . . . . . . . . . . . . . . . . . . . . . . . . . . . . . . . 8
CORPORATE GOVERNANCE . . . . . . . . . . . . . . . . . . . . . . . . . . . . . . . . . . . . . . . . . . . . . . . . . . . . . . . 11
OPERATIONS REVIEW
FOOD RETAILING .. . . . . . . . . . . . . . . . . . . . . . . . . . . . . . . . . . . . . . . . . . . . . . . . . . . . . . . . . . . . . . . . . . . . . . . . . . 12
100 YEARS IN FOOD .. . . . . . . . . . . . . . . . . . . . . . . . . . . . . . . . . . . . . . . . . . . . . . . . . . . . . . . . . . . . . . . . . . . 18
REAL ESTATE . . . . . . . . . . . . . . . . . . . . . . . . . . . . . . . . . . . . . . . . . . . . . . . . . . . . . . . . . . . . . . . . . . . . . . . . . . . . . . . . . . . 20
LONG-TERM PROGRESS . . . . . . . . . . . . . . . . . . . . . . . . . . . . . . . . . . . . . . . . . . . . . . . . . . . . . . . . . . . . . . . 22
COMMUNITY SUPPORT .. . . . . . . . . . . . . . . . . . . . . . . . . . . . . . . . . . . . . . . . . . . . . . . . . . . . . . . . . . . . . . . . . 24
CORPORATE OFFICERS . . . . . . . . . . . . . . . . . . . . . . . . . . . . . . . . . . . . . . . . . . . . . . . . . . . . . . . . . . . . . . . . 28
MANAGEMENT’S DISCUSSION AND ANALYSIS .. . . . . . . . . . . . . . . . 29
MANAGEMENT’S STATEMENT OF RESPONSIBILITY
FOR FINANCIAL REPORTING ... . . . . . . . . . . . . . . . . . . . . . . . . . . . . . . . . . . . . . . . . . . . . . . 69
AUDITORS’ REPORT . . . . . . . . . . . . . . . . . . . . . . . . . . . . . . . . . . . . . . . . . . . . . . . . . . . . . . . . . . . . . . . . . . . . . . . . . 69
CONSOLIDATED FINANCIAL STATEMENTS ... . . . . . . . . . . . . . . . . . . . . . . . 70
NOTES TO THE CONSOLIDATED
FINANCIAL STATEMENTS .. . . . . . . . . . . . . . . . . . . . . . . . . . . . . . . . . . . . . . . . . . . . . . . . . . . . . . . . . 74
ELEVEN-YEAR FINANCIAL REVIEW . . . . . . . . . . . . . . . . . . . . . . . . . . . . . . . . . . . . . . . . . . 98
GLOSSARY .. . . . . . . . . . . . . . . . . . . . . . . . . . . . . . . . . . . . . . . . . . . . . . . . . . . . . . . . . . . . . . . . . . . . . . . . . . . . . . . . . . . . . . . . . . . . 100
SHAREHOLDER AND INVESTOR INFORMATION .. . . . . . . . . . . . . IBC
9928_Cover-Eng_Final v1a.indd 29928_Cover-Eng_Final v1a.indd 2

A passionate commitment to food
and real estate. A refined corporate
structure designed to build on the synergies between
our businesses. Uncompromising values established
100 years ago by our founder J.W. Sobey. We are
clearly focused on these strengths, determined to
continue our century-old legacy of consistently growing
while building shareholder value.
EMPIRE COMPANY LIMITED 2007 ANNUAL REPORT 1
9928_Front (no cover)-Eng_Final 1 19928_Front (no cover)-Eng_Final 1 1 7/26/07 6:42:06 AM7/26/07 6:42:06 AM

Empire Today
RIGHT FORMAT, RIGHT-SIZED STORES
Sobeys Inc. owns and operates over 1,300 corporate and franchise
affi liate stores in every province across Canada under retail banners
that include Sobeys, IGA, IGA extra, Foodland and Price Chopper.
Our fi ve core retail formats are each geared to ensure we have the
right-sized, right offering for each market we serve from the full
service format food stores to the convenience format stores, each
designed to satisfy our customers’ lifestyles and needs.
Food Retailing
COMPETITIVE STRENGTHS
Our committed and knowledgeable franchise affiliates and store operators.
Our fresh food expertise, the cornerstone of our impassioned commitment to be “best in food.”
A successful private label program, Compliments.
Our ever-improving supply chain, processes, systems and tools that enable our employees to be more efficient, and provide superior customer service.
Performance
FORMAT BRANDS PROFILE MARKETS STORES
Full Sobeys; IGA extra Total food shopping experience Atlantic Canada, Québec, 323Service with broadest assortment Ontario, Western Canada
Fresh Sobeys; IGA (Québec); Ready to serve, ‘fresh fill-in’ Québec, Ontario 181Service Sobeys express and ‘today’s meal’ market
Community IGA; Foodland ‘Routine and fill-in’ shopping in Atlantic Canada, Ontario, 312Service rural and one-store communities Western Canada
Price Price Chopper Everyday food needs in Atlantic Canada, Ontario, 124Service price-driven markets Western Canada
Convenience Needs; Marché Bonichoix; ‘On-the-go’ convenience needs Atlantic Canada, Québec 285Service Les Marchés Tradition
Other Lawtons; Cash and Carry; Meeting other specialized Atlantic Canada, Ontario, 107 Sobeys Fast Fuel; customer needs Western Canada
Sobeys Spirits, Wine & Cold Beer
2 EMPIRE TODAY
9928_Front (no cover)-Eng_Final 2 29928_Front (no cover)-Eng_Final 2 2 7/27/07 9:02:42 PM7/27/07 9:02:42 PM

“Our real estate
division recorded
another solid year.”
PAUL D. SOBEY
PRESIDENT AND CEO,
EMPIRE COMPANY LIMITED
Real Estate
FOCUSED ON FOOD-RELATED REAL ESTATE
Empire’s real estate business includes commercial and residential
property operations. Our commercial operations consist of
wholly-owned ECL Properties Limited and Sobey Leased Properties
Limited as well as a 48.1 percent ownership interest in publicly
traded Crombie REIT. Residential operations are predominantly
carried out through a 35.7 percent ownership interest in Genstar
Development Partnership.
COMPETITIVE STRENGTHS
Our knowledge, strength of management and experiencein the successful development of food-related real estate.
The preferential development agreement between ECLProperties and Crombie REIT. This agreement reduces risk and enhances opportunities for both businesses.
The strengthened relationship between Empire’s food retailing and real estate businesses, allowing Empire to accelerate the cross-Canada development of food-anchored shopping plazas.
Performance
BUSINESS COMPANY PROFILE MARKETS SIZE
Commercial ECL Properties Development of food-anchored Atlantic Canada, Québec, 1.3 million sq. ft.Development shopping plazas Ontario
Sobey Leased Renovation and expansion of Atlantic Canada, Québec, 4.4 million sq. ft. Properties existing assets, including Ontario
Sobeys-anchored shopping plazas,Sobeys standalone stores
and Sobeys convenience stores
Property Crombie REIT Ownership and management Atlantic Canada, Québec, 7.7 million sq. ft.Management of shopping centres and Ontario office buildings
Residential Genstar Development of master-planned Ontario, Manitoba, Development Development residential communities Alberta, British Columbia Partnership
EMPIRE COMPANY LIMITED 2007 ANNUAL REPORT 3
9928_Front (no cover)-Eng_Final 3 39928_Front (no cover)-Eng_Final 3 3 7/26/07 6:42:15 AM7/26/07 6:42:15 AM

Clearly Focused
$13.3 BillionBUILDING ALREADY STRONG RELATIONSHIPS
Our legacy of creating value decade after decade is based on investing in businesses we know and understand – food and related real estate – guided by strong management supported by dedicated employees.
“With 100 years of experience in
food retailing and over 40 years
in real estate, we realized we could
best build shareholder value by
becoming even more focused on
our core strengths.”
PAUL D. SOBEY PRESIDENT AND CEO, EMPIRE COMPANY LIMITED
REVENUE FOR 2007
4 LETTER TO SHAREHOLDERS
9928_Front (no cover)-Eng_Final 4 49928_Front (no cover)-Eng_Final 4 4 7/26/07 6:42:19 AM7/26/07 6:42:19 AM

his year, the leadership team at Empire had an
important decision to make: Given our financial
capacity to make a major transaction, should
we diversify our business further or focus even more tightly
on our core businesses – food retail and related real estate?
During the year, management and the Board of Directors
undertook a comprehensive strategic review of our
businesses, thoroughly analyzing our potential growth
opportunities and capabilities. We came to realize that with
100 years of experience in food retailing and over 40 years
in real estate, we could best build shareholder value by
becoming even more focused on our core strengths.
Accordingly, Empire announced in the fourth quarter of
fiscal 2007 its intent to privatize Sobeys. This transaction
made sense for many reasons. Most importantly, we were
convinced it was in our best interest – and in the best
interests of our shareholders – to acquire the 28 percent
of Sobeys shares not already owned by Empire. This
transaction, which was completed subsequent to fiscal
year-end, was immediately accretive to our earnings
and resulted in Sobeys becoming a wholly-owned
subsidiary of Empire.
The privatization of Sobeys reflects our complete confidence
in its food-focused strategy to build shareholder value.
While Sobeys’ day-to-day operations are unaffected by
the transaction, Empire’s 100 percent ownership of the
business will allow Sobeys’ management to concentrate
squarely on their business operations. Ultimately, food
retail is a business that the leadership team of Empire
also knows and understands well. We feel comfortable
in the industry, despite its competitiveness, and will
provide Sobeys the support it needs to continue to make
progress towards achieving its goals.
At the same time, 100 percent ownership of Sobeys by
Empire will strengthen the already solid relationship
between our core businesses of food retail and related
real estate, which we believe will result in ongoing financial
benefits. For decades we have benefited from an intimate
relationship between food retail and real estate development
as evidenced by our proven food-anchored shopping
plaza presence throughout Atlantic Canada and now into
Ontario. We see significant opportunity to expand our
food-anchored shopping plaza model further into Central
Canada and into Western Canada. Having 100 percent
ownership of both Sobeys and ECL Properties serves as a
solid platform for future growth in food-anchored shopping
plaza development across Canada.
T
The privatization of Sobeys
reflects our complete confidence
in its food-focused strategy to
build shareholder value.
DONALD CLOW (LEFT) AND FRANK SOBEY (RIGHT) OF
OUR REAL ESTATE BUSINESS WITH CRAIG GILPIN
OF SOBEYS ONTARIO.
9928_Front (no cover)-Eng_Final 5 59928_Front (no cover)-Eng_Final 5 5 7/26/07 6:43:04 AM7/26/07 6:43:04 AM

The announced Sobeys transaction was our most significant
event of fiscal 2007, but it was by no means the only
one. Our real estate division recorded another solid year.
In its first full year of operations as a public company,
Crombie REIT delivered outstanding performance that has
translated into a more than 49 percent total investment
return since the initial public offering in March 2006 to
the end of fiscal 2007. As well, our residential real estate
operations, through Genstar Development Partnership,
enjoyed an unprecedented year with record earnings.
These achievements represent the culmination of efforts
that Empire management has made over the past few
years to grow value across our business lines.
FINANCIAL HIGHLIGHTS
Empire posted solid results in fiscal 2007. Revenues
grew by 2.3 percent to $13.37 billion while operating
earnings increased to a record $204.4 million, equivalent
to $3.10 per share. Dividends paid to common shareholders
increased by 7.1 percent to $0.60 per annum while book
value per share grew by 8.7 percent. Subsequent to
fiscal year-end, coinciding with the release of our fourth
quarter results on June 28, 2007, we were pleased to
announce a 10 percent increase in the Empire dividend
to $0.66 annually. This marks the twelfth consecutive year
of dividend increases. The capital markets have long
recognized both the soundness of our operating strategies
and the strength of our businesses as evidenced by a
compound average annual total return to shareholders of
19.8 percent over the last 10 years.
SOBEYS
Sobeys reached a major milestone in 2007, celebrating
100 years in food retailing. This momentous occasion has
presented the opportunity to reflect on the entrepreneurial
spirit that has sustained and renewed this business for a
century. At the same time, it has given us pause to reflect on
Sobeys’ future within the Empire fold. While Sobeys will remain
a standalone, limited entity, we believe that the leadership
team at Empire, with its experience in food, is exceptionally
well positioned to guide Sobeys’ ongoing progress.
Sobeys achieved $13.0 billion in sales and $173.4 million in
net earnings in fiscal 2007. Sobeys’ strategy of differentiating
itself from the competition through an unwavering focus
on food and a sheer determination to “out-food”, “out-fresh”,
“out-service” and “out-market” the competition is resonating
with the Canadian food consumer as evidenced by Sobeys’
continued industry-leading same-store sales growth.
Within a food retail marketplace that remained fiercely
competitive in 2007, Sobeys continued to make significant
capital expenditures to renovate, expand and build its
store network while bringing as many individual stores as
possible to the same high operating standard. Sobeys
acquired Achille de la Chevrotière Ltée, a regional Québec
food retailer, to boost its position in the Québec market;
rolled out two exciting product lines under its Compliments
private label; continued to implement an enterprise-wide
information platform; and announced plans to build an
automated distribution centre to support Sobeys’ growth
in Ontario.
WITH MUCH MORE IN STORE
Building shareholder value rests firmly on meeting customer needs, from the meal ideas in our industry-leading Inspired magazine to our strong pharmacy offering, both in-store and at our standalone Lawtons Drug Stores.
6 LETTER TO SHAREHOLDERS
9928_Front (no cover)-Eng_Final 6 69928_Front (no cover)-Eng_Final 6 6 7/26/07 6:43:05 AM7/26/07 6:43:05 AM

REAL ESTATE
This was Crombie REIT’s first full year of operations
after its creation by Empire in fiscal 2006, and we were
very pleased by the results. Empire continues to hold a
48.1 percent ownership interest in Crombie REIT, which
generated a 35 percent total investment return in fiscal
2007 reflecting its solid operating and financial performance.
Our interest in Crombie REIT represents a sizeable portion
of our involvement in commercial real estate.
The year also witnessed the establishment of wholly-
owned ECL Developments as our commercial property
development company which will work closely with Sobeys
on food-anchored shopping plaza development. Our
100 percent ownership of Sobeys will allow Empire to more
fully exploit this development pipeline by taking advantage
of favourable tenancy arrangements and other potential
benefits. Once developed, these properties will first be
offered for sale to Crombie REIT with capital generated
being redeployed into further property development.
The focus of our real estate business in the future will
therefore be primarily on the development and sale
of food-anchored shopping plazas rather than continued
ownership of these properties. We are pursuing a strategy
of aggressive yet disciplined growth, and have expanded
our real estate management team to ensure our success.
In particular, I would like to acknowledge Donald Clow who
joined Empire this year as President of ECL Developments,
bringing a wealth of talent and experience in the property
development business as we ramp up our activities in
commercial real estate development.
Empire shareholders also benefited from Empire’s interest
in Genstar. Driven by the continued strength of the
residential real estate market, particularly in Calgary and
Edmonton, Alberta, Genstar contributed record earnings
to Empire in fiscal 2007. While results were unusually
robust, we expect activity in Genstar’s markets to remain
relatively strong into the first half of fiscal 2008. Wajax
Income Fund also generated solid performance in fiscal
2007, contributing equity earnings of $20.2 million, a
23.9 percent increase over the prior year. Wajax Income
Fund is a leading Canadian distributor and service support
provider of mobile equipment, industrial components and
power systems.
ACKNOWLEDGMENTS
The knowledge and experience of our Board, corporate
management and management in our core businesses
place Empire in an especially strong position to allocate
capital in an effective and prudent manner. Empire
provides financial strength and liquidity, as well as enhanced
risk control measures and oversight to our businesses, not
only ensuring that they operate effectively and efficiently,
but enhancing their ability to create value for shareholders.
Fiscal 2007 has brought clarity to our priorities while
reinforcing our determination and ability to continue to
deliver long-term value for our shareholders. I would
also like to acknowledge and offer my gratitude to our
employees across all of our business lines for another
year of excellent performance. It is through the hard work
and enthusiasm of our employees, hand-in-hand with
the leadership provided by our management team and
the Board, that Empire has been able to deliver and
sustain long-term value to our shareholders and to
the communities that we serve. We are confident that
our strategies, particularly the decision to privatize
Sobeys, will bring us continued success and
profitable growth in the years ahead.
Paul D. SobeyPresident and CEO,
Empire Company Limited
June 28, 2007
2007 witnessed the establishment
of wholly-owned ECL Developments
as our commercial property
development company.
EMPIRE COMPANY LIMITED 2007 ANNUAL REPORT 7
9928_Front (no cover)-Eng_Final 7 79928_Front (no cover)-Eng_Final 7 7 7/26/07 6:43:52 AM7/26/07 6:43:52 AM

Excellence in Governance
“At Empire, the Board’s primary
responsibilities are the prudent
allocation of the Company’s capital
resources and the provision of
solid corporate stewardship and
overall governance.”
ROBERT P. DEXTER CHAIR, EMPIRE COMPANY LIMITED
HALIFAX, NOVA SCOTIA
DIRECTOR SINCE 1987.
CHAIR AND CEO OF MARITIME TRAVEL INC.
JOHN L. BRAGG (3,6)
COLLINGWOOD, NS
DIRECTOR SINCE 1999.
CHAIRMAN, PRESIDENT
AND CO-CHIEF EXECUTIVE
OFFICER OF OXFORD
FROZEN FOODS LTD.
WILLIAM T. BROCK (3,5)
TORONTO, ON
DIRECTOR SINCE 2005.
CORPORATE DIRECTOR
JAMES W. GOGAN (2)
NEW GLASGOW, NS
DIRECTOR SINCE 1972.
CORPORATE DIRECTOR
EDWARD C. HARSANT (1)
WOODBRIDGE, ON
DIRECTOR SINCE 2003.
CORPORATE DIRECTOR
8 MESSAGE FROM THE CHAIR
9928_Front (no cover)-Eng_Final 8 89928_Front (no cover)-Eng_Final 8 8 7/26/07 6:43:52 AM7/26/07 6:43:52 AM

uring the past year, the Empire Board of Directors
was actively involved in examining the Company’s
growth opportunities and developing a long-term
strategic direction. At this point in Empire’s evolution, we
had two options: further diversification or placing a stronger
focus on our core businesses. Ultimately, we chose to
concentrate on the businesses we know best – food and
related real estate. Our capabilities within these businesses
have enabled Empire to post a compound average annual
total return to shareholders of 19.8 percent during the
past 10 years and we believe food and related real estate
will continue to be the foundation of our future success.
The privatization of Sobeys has meant that eight members
of the former Sobeys’ Board will be nominated for election
to the Empire Board at the upcoming Annual General
Meeting on September 12, 2007. While these new directors
will provide fresh views and strong food retailing experience,
I would first like to acknowledge the contributions of the
directors who will be retiring this year.
James Gogan has served on the Empire Board since 1972,
seeing the Company through a vast number of changes.
His breadth of knowledge and wisdom will be sincerely
missed. I would also like to thank Courtney Pratt, who joined
the Board in 1995; Anna Porter, who has served since
2004; and William Brock who has served since 2005.
These individuals brought a wealth of business expertise,
insight and thoughtfulness to their responsibilities. Their
contributions have served to strengthen Empire’s focus on
its core businesses and for that we are grateful.
I would also like to thank two Sobeys’ directors that are
retiring and not standing for election to the Empire Board.
Peter Godsoe was Chair of Sobeys since 2004 and
a director of Empire from 1993 until 2004. His wise
counsel will be greatly missed. Robert Dutton joined the
Sobeys Board in 2006 and we appreciated the benefit
of his experience.
A REVITALIZED BOARD
We look forward to welcoming eight new directors
to the Empire Board: Marcel Côté, Christine Cross,
David Ferguson, David Leslie, Bill McEwan, Malen Ng,
Mel Rhinelander, and Frank Sobey. These individuals
bring decades of experience as corporate directors to
our Board, as well as a healthy mix of backgrounds. I am
looking forward to working with our new Board as we
guide Empire towards continued long-term growth.
This revitalized Board will continue to examine Empire’s
opportunities for growth with an eye on maximizing the
Company’s long-term performance. We are fortunate
to have many veteran business leaders, from diverse
business backgrounds and with a wide range of skill sets
serving as board members. While the majority of our
directors are independent, the Sobey family will continue
D
1 AUDIT COMMITTEE MEMBER
2 AUDIT COMMITTEE CHAIR
3 HUMAN RESOURCES COMMITTEE MEMBER
4 HUMAN RESOURCES COMMITTEE CHAIR
5 CORPORATE GOVERNANCE
AND NOMINATING COMMITTEE MEMBER
6 CORPORATE GOVERNANCE AND NOMINATING
COMMITTEE CHAIR
E. COURTNEY PRATT (4,5)
TORONTO, ON
DIRECTOR SINCE 1995.
CORPORATE DIRECTOR
STEPHEN J. SAVIDANT (1)
CALGARY, AB
DIRECTOR SINCE 2004.
CHAIRMAN,
PROSPEX RESOURCES
LIMITED AND
CORPORATE DIRECTOR
DAVID F. SOBEY
NEW GLASGOW, NS
DIRECTOR SINCE 1963.
CHAIR EMERITUS,
SOBEYS INC.
DONALD R. SOBEY
PICTOU COUNTY, NS
DIRECTOR SINCE 1963.
CHAIR EMERITUS,
EMPIRE COMPANY LIMITED
ANNA PORTER (1)
TORONTO, ON
DIRECTOR SINCE 2004.
CORPORATE DIRECTOR
EMPIRE COMPANY LIMITED 2007 ANNUAL REPORT 9
9928_Front (no cover)-Eng_Final 9 99928_Front (no cover)-Eng_Final 9 9 7/26/07 6:44:56 AM7/26/07 6:44:56 AM

to be well represented on the Board. These long-term
stakeholders bring a proprietor’s perspective to the
decision-making process – one that has served to
keep Empire focused on long-term value creation and
patient investment in our core businesses of food
and related real estate.
At Empire, the Board’s primary responsibilities are the
prudent allocation of the Company’s capital resources
and the provision of solid corporate stewardship and
overall governance. As part of this process, we remain
attuned to the accomplishments within each of Empire’s
business lines. Sobeys has continued to perform well
in a highly competitive environment and its privatization
is more than just a smart investment; it underscores our
confidence in Sobeys’ strategic plan and in the strategic
priorities of their management team.
I would also like to acknowledge the management
of Empire and its operating companies for another
year of solid leadership that collectively supports our
long-term success. It was also a good year for our
investments in Genstar and Wajax with their excellent
management teams creating significant value for
Empire and our shareholders.
Despite the changes that have taken place this year,
Empire’s commitment to corporate citizenship remains
consistent. The Sobey family has a long tradition of
philanthropy and community involvement, particularly
in the Company’s home region of Atlantic Canada.
In fact, this year, Donald and David Sobey were inducted
into the Junior Achievement Canadian Business Hall of Fame.
I know their father, Frank H. Sobey, who was inducted in
1984, would have been proud to see his sons so justifiably
honoured, particularly on the 100th anniversary of Sobeys.
On behalf of the Board, I would like to congratulate them
for this historic achievement.
In closing, I would like to thank the management and
employees at Empire and in our operating companies for
helping Empire post solid results in fiscal 2007. I would
also like to express our appreciation for the continued
support of our shareholders. As we look ahead, the Board
remains confident that Empire’s renewed focus on its
core strengths in food retailing and related real estate has
positioned the Company for enduring success.
Robert P. DexterChair,
Empire Company Limited
June 28, 2007
Empire directors have a wide
range of skills acquired from
diverse business backgrounds.
KARL R. SOBEY (3)
HALIFAX, NOVA SCOTIA
DIRECTOR SINCE 2001.
CORPORATE DIRECTOR
PAUL D. SOBEY
PICTOU COUNTY,
NOVA SCOTIA
DIRECTOR SINCE 1993.
PRESIDENT AND CEO,
EMPIRE COMPANY LIMITED
ROB G. C. SOBEY
STELLARTON, NOVA SCOTIA
DIRECTOR SINCE 1998.
PRESIDENT AND CEO,
LAWTON’S DRUG STORES LIMITED
JOHN R. SOBEY (1)
PICTOU COUNTY,
NOVA SCOTIA
DIRECTOR SINCE 1979.
CORPORATE DIRECTOR
MESSAGE FROM THE CHAIR10
9928_Front (no cover)-Eng_Final 10 109928_Front (no cover)-Eng_Final 10 10 7/30/07 11:43:12 AM7/30/07 11:43:12 AM
mpire is committed to the highest level of
corporate governance. Good governance and
long-term sustainability are interdependent.
We believe that a strict code of business conduct –
emphasizing accountability – and a comprehensive
disclosure policy – ensuring transparency – forms the
foundation for a successful company.
Sustaining leadership in corporate governance – indeed,
sustaining Empire’s earnings growth – requires constantly
reviewing, monitoring and improving governance policies
and practices. Empire’s Board of Directors is committed
to delivering value to our stakeholders while assuming the
explicit responsibility of stewardship of the Company.
Our priority for fiscal 2008 is to clearly redefine the roles
and responsibilities of the Board and management.
A comprehensive review of our existing corporate
governance policies and practices can be found in our
Management Information Circular and on our website at
www.empireco.ca. A detailed explanation of our Corporate
Disclosure Policy – approved by our Corporate Governance
and Nominating Committee – and our Code of Business
Conduct are also available on our website.
BOARD COMMITTEES
Governance at Empire is the responsibility of the Board of
Directors, supported by three key committees: Corporate
Governance and Nominating Committee, Human Resources
Committee, and Audit Committee. All members of the
Corporate Governance and Nominating Committee and
Audit Committee are independent directors according to
independence standards established by applicable
corporate and securities laws as well as Empire’s own
Board of Directors. In addition, members of the Audit
Committee meet the independence and financial literacy
tests set out in Multilateral Instrument 52-110 adopted by
most of the Canadian securities regulators.
The primary responsibilities of each committee of the
Board are as follows:
AUDIT COMMITTEE
Reviews and assesses the Company’s financial reporting
practices and procedures; reviews the adequacy and
reporting of internal accounting controls and the
independence of external auditors from management;
recommends the appointment of the external auditor;
communicates directly with internal and external auditors;
directly oversees the work of the external auditor; reviews
and assesses the Company’s risk management; and
reviews consolidated quarterly and annual financial
statements and related financial communications prior
to public disclosure.
CORPORATE GOVERNANCE
AND NOMINATING COMMITTEE
Develops Empire’s corporate governance policies, including
responsibility for disclosure; monitors and ensures
compliance with those policies; monitors the composition
of the Board for skill and expertise; identifies, evaluates
and recommends suitable candidates for election or
appointment as directors of the Company; annually reviews
and assesses the effectiveness of the Board as a whole,
the committees of the Board and the contributions of
individual directors; and recommends suitable compensation
of directors.
HUMAN RESOURCES COMMITTEE
Reviews and approves management compensation and
compensation disclosure; reviews the Company’s management
training and development programs; undertakes CEO and
executive succession planning and monitors management
succession planning; conducts the CEO’s annual performance
review; establishes annual and longer-term objectives
for the CEO; and oversees the Company’s pension plan.
Corporate Governance
A comprehensive review of our corporate
governance policies and practices can be found
in our Management Information Circular and on
our website at www.empireco.ca.
E
EMPIRE COMPANY LIMITED 2007 ANNUAL REPORT 11
9928_Front (no cover)-Eng_Final 11 119928_Front (no cover)-Eng_Final 11 11 7/26/07 6:46:20 AM7/26/07 6:46:20 AM

Food Retailing
“The focus of Sobeys remains where it has always
been – on food – as we strive to be the very best food
retailer in Canada.”
BILL McEWAN PRESIDENT AND CEO, SOBEYS INC.
$13.0 BillionA REFRESHING NEW LOOK
Over Sobeys’ long history, generations of store employees have worked hard to provide superior customer service in the right format, right-sized stores for each market we serve. In 2007, the Sobeys banner introduced new uniforms for its employees, reinforcing its fresh and food-focused image.
REVENUE FOR 2007
OPERATIONS REVIEW12
9928_Front (no cover)-Eng_Final 12 129928_Front (no cover)-Eng_Final 12 12 7/26/07 6:46:21 AM7/26/07 6:46:21 AM

he year 2007 represents a significant milestone
for Sobeys as we celebrate the 100th anniversary
of a true Canadian success story. The drive,
determination and focus on serving the needs of customers
that began with the entrepreneurial spirit of J.W. Sobey in
Stellarton, Nova Scotia a century ago continues at Sobeys
to this day as we strive to be the very best food retailer in
Canada. And while much has changed since J.W. Sobey
started the business, the focus of Sobeys remains where
it always has been – on food. Our goal is to “out-food”,
“out-fresh”, “out-service” and “out-market” all who choose to
compete with us in the Canadian food retail marketplace.
The privatization of Sobeys by Empire firmly reinforces our
focus. With the support of Empire and their commitment
to our strategy, Sobeys can continue to concentrate
on strategic priorities and day-to-day operations with the
same passion and determination as ever before.
We will continue to drive our food-focused strategy with our
fresh food excellence, innovation and superior customer
service, in the right format, right-sized stores for each
market we serve. We know and understand the differences
from market-to-market and that the needs of individual
customers can change from one shopping occasion to the
next. With five distinct store formats supported by strong
operating and merchandising teams in each of our four
geographic regions, we are competing more effectively for
the patronage and loyalty of customers.
HIGHLIGHTS OF FISCAL 2007
During 2007, we continued to make progress along our
continuum with every initiative aligned and contributing to
the achievement of the long-term goals that we established
almost five years ago. Company-wide highlights for fiscal
2007 include:
32 new stores, including three locations in the highly
competitive Toronto market. With right-sized Sobeys
and Sobeys express stores we are filling the gap
for quality fresh foods and convenient shopping in
the thriving downtown core.
Acquisition of Achille de la Chevrotière Ltée, a 25-store
chain in the Abitibi-Témiscamingue region of Québec.
With this $80 million transaction, Sobeys further
solidified its position as the leading food retailer in
Québec with IGA and IGA extra.
Completed the rollout of the Compliments Organics
and Compliments balance-équilibre lines, affording
consumers an even wider range of alternative and
healthy choices. All Compliments balance-équilibre
products bear the Heart & Stroke Foundation’s
Health Check™ symbol.
Successful implementation of the SAP enterprise-wide
information platform in Ontario. The establishment of
an enterprise-wide system began in 2005 in Atlantic
Canada and the successful implementation in Ontario
represents a significant step forward.
Announcement of an automated distribution centre in
Vaughan, Ontario – just north of Toronto – scheduled to
open in 2009.
T
Great products and engaging
service come together to meet the
needs of our customers.
9928_Front (no cover)-Eng_Final 13 139928_Front (no cover)-Eng_Final 13 13 7/27/07 9:42:33 PM7/27/07 9:42:33 PM

4,400
OUR ASSURANCE OF QUALITY
Compliments has become one of Canada’s most complete lines of quality products at everyday prices. New products are being introduced almost daily, giving our customers more of what they’re looking for – more variety, more value, more information, more everyday inspiration. The Compliments name is our assurance of quality that is equal to or better than other national and competitive store brands.
We are continually
expanding our product
and service offerings
to satisfy ever-changing
and diverse customer
expectations.
COMPLIMENTSBRAND
PRODUCTS
OPERATIONS REVIEW14
9928_Front (no cover)-Eng_Final 14 149928_Front (no cover)-Eng_Final 14 14 7/26/07 6:47:34 AM7/26/07 6:47:34 AM

While the food retail marketplace remains highly
competitive, particularly in Ontario, Sobeys had a year of
solid operational and financial performance. We sustained
our competitive retail price position by improving our
product mix, reducing our costs and increasing productivity
through SMART Retailing and other initiatives. Throughout
the year Sobeys achieved industry-leading same-store
sales growth, an important indicator of progress overall,
while sales per square foot increased in all of its operating
regions. Total revenue for the year equalled $13.03 billion
compared to $12.72 billion in fiscal 2006.
OUR IMPERATIVES
Our progress over the past year resulted from our
steadfast commitment to building a differentiated, healthy
and competitive retail food business and infrastructure
as we pursue our goal to be the very best food retailer in
the country. Achieving our goal demands focus on three
cornerstone imperatives:
1. Maintain our unwavering focus on food: to “out-food”,
“out-fresh”, “out-service” and “out-market” those
who choose to compete with us for a greater share
of Canadian consumers’ food requirements.
Though pleased with the progress we made in 2007 in
a challenging competitive environment, we know that
significant opportunities remain. We are continually
expanding our product and service offerings to satisfy
ever-changing and diverse customer expectations.
This year saw the full launch and integration of our two
new Compliments lines – Compliments balance-équilibre
and Compliments Organics – further enhancing our variety
of natural and “wellness” foods, and we are pleased with
the early results.
Our Inspired magazine is now recognized as a leading-
edge, food ideas, food inspiration and food preparation
publication and our suite of innovations includes the
“Discover the World of Food” program which has migrated
as a best practice from our Québec region.
2. Improve our cost base and productivity.
We continue to streamline our business processes,
systems and supply chain. During the year, we announced
the construction of an automated distribution centre in
Vaughan, Ontario. When operational this facility will serve
the diverse requirements of our five formats at substantially
lower costs and higher service levels. Numerous upgrades
and expansions in our distribution centres across the
country will ensure that the demands of our retail network
growth can be adequately and efficiently supplied.
SMART Retailing, our store-based operational excellence
and productivity program, continues to support our ability
to sustain our competitive retail price position. Focus
continued in fiscal 2007 on the program’s core objectives
to reduce shrink and improve production planning,
backroom inventory management
and shelf-stocking procedures.
Our suite of innovations
includes the “Discover the World
of Food” program that has
migrated as a best practice from
our Québec region.
9928_Front (no cover)-Eng_Final 15 159928_Front (no cover)-Eng_Final 15 15 7/27/07 9:45:25 PM7/27/07 9:45:25 PM

Our progress is fueled by our passion for the food business,
knowledge of the markets we serve and continued investment
in our store network, products and people.
1,332
TAKING STOCK
At Sobeys, we are distinguishing ourselves by improving every aspect of our business and our stores – inside and out, on the shelf and behind the scene – from products to service to operating excellence. Our goal is to satisfy the needs of our customers in each market we serve.
TOTAL STORECOUNT
(ALL BANNERS)
OPERATIONS REVIEW16
9928_Front (no cover)-Eng_Final 16 169928_Front (no cover)-Eng_Final 16 16 7/26/07 6:49:12 AM7/26/07 6:49:12 AM

At the same time, we launched the third component
of SMART Retailing with the rollout of Peer-to-Peer
Management. Peer-to-Peer allows stores across our
network to share information and best practices. Going
forward, we will launch several new programs as part of
the third phase of SMART Retailing, including initiatives
in workforce management and fresh item management.
The success of SMART Retailing – like many of our
initiatives – is all about the detail of retail: continuous,
incremental improvements that all add up to enhance our
competitive position, increase productivity and contribute
to better top and bottom-line performance.
3. Invest in and develop our people as we nurture a
superior service and high-performance culture.
Over the past 100 years, Sobeys has earned a proud
and enviable reputation as an employer that respects
its people, fairly and consistently values individual
contributions, and supports the communities that have
built Sobeys.
Over the past four years we have strengthened the
leadership ranks of Sobeys. We have conducted training
programs for hundreds of managers and store operators
with more to come. Improving food knowledge, fresh food
handling skills, customer service capabilities and ability to
execute a safe and consistent food shopping experience
demands that we educate, reward, recognize and
communicate with our people. At the same time, as we
search for fresh talent, we are expanding our post-
secondary institution recruitment efforts and summer
co-op programs.
Our performance management system facilitates a
dialogue that allows supervisors and their employees
to set specific goals, measure performance and
reward achievement. This helps to ensure that our
employees can be more engaged in their work,
know what is expected of them and have the enabling
tools to be successful.
We conduct comprehensive surveys with our employees in
our stores, offices and distribution centres. These surveys
help guide management as we constantly seek to improve
the level of understanding, the quality of communication
and the level of engagement with our people.
EMBRACING THE NEXT 100 YEARS
Sobeys is on solid financial and strategic ground as
we continue to implement the programs and initiatives
that will ensure our long-term growth and sustainability.
Franchise affiliates and employees across Sobeys
continue to show the commitment and dedication necessary
to sustain our success, by executing our food-focused,
customer-centric strategy.
At Sobeys we understand and embrace the opportunities
and challenges in this very dynamic retail food industry.
With the expertise and experience of 100 years and the
steadfast commitment to build a healthy and sustainable
retail food business and infrastructure for the long term,
we will do so with the stability and flexibility afforded by
our even stronger relationship with Empire.
We are confident that Sobeys will be able to meet the
challenges and exploit our opportunities for growth. We
intend to be the very best food retailer in the country, and
we will stay our course in that pursuit.
Bill McEwanPresident and CEO,
Sobeys Inc.
June 28, 2007
We understand and embrace the
industry’s opportunities and challenges.
9928_Front (no cover)-Eng_Final 17 179928_Front (no cover)-Eng_Final 17 17 7/26/07 6:50:37 AM7/26/07 6:50:37 AM

100 Years in Food
“When you think about the roots of this organization, dating back 100 years in
Pictou County to over 1,330 stores across the country today – each one
with its own sense of purpose and pride and passion just like the fi rst store
in Stellarton, Nova Scotia in 1907 – that’s a pretty phenomenal story.”
BILL McEWAN PRESIDENT AND CEO, SOBEYS INC.
1907
John William (J.W.) Sobey starts a meat delivery business in Stellarton, Nova Scotia.
1924
Frank Sobey persuades his father to expand the business to include a full line of groceries. The next year, the Sobeys chain is born.
1949
Sobeys opens its first self-serve, all-cash supermarket in Truro, Nova Scotia.
1950s & 1960s
Rapid expansion through the Atlantic provinces. Frank’s sons – Donald, Bill and David – become involved in running the business.
1982
Empire goes public at $0.35 per share, split adjusted. Annual revenue is $300 million.
OPERATIONS REVIEW18
9928_Front (no cover)-Eng_Final 18 189928_Front (no cover)-Eng_Final 18 18 7/26/07 6:50:38 AM7/26/07 6:50:38 AM

or 100 years now, the Sobey name has been
a hallmark of quality, value, innovation and
customer service for Canadian food shoppers.
From one store in northern Nova Scotia, Sobeys has
grown to become a leading national food retailer with
stores in all 10 provinces, fueled by a continuous drive to
make progress by always looking forward.
Our customers and employees across the country are
celebrating Sobeys’ 100th anniversary with store parties,
promotions, special displays and heritage products. In
Atlantic Canada, 100 days of activities commenced in late
May, including a tour of a replica Ford Model T similar to
the one Frank Sobey used in the early days of the business.
FROM HUMBLE BEGINNINGS
From humble beginnings to nationwide success, the Sobey
pride and purpose shines through to this day in locations
all across the country. But as the Sobey family moves
into its fifth generation in the food retail business, the
values held by J.W. Sobey remain at the core of the
business: dedication to our customers, employees, products
and our communities.
The Sobeys’ story is one of incredible entrepreneurial
spirit and courage, characterized by always looking
forward, always making progress and standing up as an
organization behind our core values. Those values were
demonstrated during a coal miners’ strike in Stellarton
in the 1920s, when Frank Sobey opened the doors and
allowed hungry workers and their families to take what
they needed. He simply asked that they leave a list
of what they had taken and to repay when able. This spirit
of giving endures to this day through the philanthropic
activities and community initiatives that, in large part,
define the Sobeys’ legacy.
BUILDING ON THE VISION
While we have had many occasions to celebrate the rich
and vibrant history of Sobeys, we have even more to
look forward to in our future. By applying the acquired
experiences of the first 100 years we will forge ahead,
always finding new and better ways to serve our customers.
We will continue to innovate and grow, steadfast behind
our focus on food, rooted by our heritage in Atlantic Canada
and fueled by our growing, cross-Canada presence.
“The strength of any
organization is
the people involved.”
FRANK H. SOBEY
(1902 – 1985)
F
1987
Sobeys records sales of $1 billion for the first time.
1998
Sobeys acquires Oshawa Group, tripling Sobeys’ size overnight.
2003
The first Sobeys banner store in Western Canada opens in Winnipeg, Manitoba. Today there are close to 80 Sobeys stores in the four western provinces.
2005
Sobeys introduces Compliments private label to Canadian consumers.
2007 (JUNE)
Empire acquires all outstanding shares of Sobeys, providing further support for its food-focused strategy.
EMPIRE COMPANY LIMITED 2007 ANNUAL REPORT 19
9928_Front (no cover)-Eng_Final 19 199928_Front (no cover)-Eng_Final 19 19 7/26/07 6:53:04 AM7/26/07 6:53:04 AM

Real Estate
“The privatization of Sobeys will strengthen the already
strong relationship between Empire’s food retailing and
real estate businesses.”
FRANK C. SOBEY PRESIDENT, ECL PROPERTIES LIMITED
$218.8 MillionOUTSTANDING LOCATIONS AND SERVICES
Sobey Leased Properties and ECL Properties – through ECL Developments and its investments in Crombie REIT and Genstar – are committed to developing and managing shopping centres, office buildings and residential communities with outstanding locations, facilities and services.
REVENUE FOR 2007
OPERATIONS REVIEW20
9928_Front (no cover)-Eng_Final 20 209928_Front (no cover)-Eng_Final 20 20 7/26/07 6:53:07 AM7/26/07 6:53:07 AM

his has been a year of change for Empire’s real
estate business – ECL Properties – as we
continue the restructuring that began with the
launch of Crombie REIT in 2006. Our goal is to structure
our real estate assets and management to ensure we
derive maximum value from the real estate we hold today
while capitalizing on the development expertise that we’ve
acquired over the past four decades.
Our real estate division continues to hold investments in
both commercial and residential real estate. Both segments
performed well in fiscal 2007. Empire holds a 35.7 percent
ownership interest in Genstar, which had a record year in
fiscal 2007 as it continued to benefit from unprecedented
strength in the residential real estate market, particularly
in Calgary and Edmonton, Alberta. While we anticipate
more modest growth in the residential real estate market
in fiscal 2008, we are confident that Genstar will continue
to yield solid results for Empire shareholders.
In commercial real estate, as of May 5, 2007, our share-
holders benefited from a 49 percent total investment
return in Crombie REIT since its initial public offering in
March, 2006. Empire continues to hold a 48.1 percent
ownership interest. Much of Crombie REIT’s success in
fiscal 2007 can be attributed to its management team,
which implemented strategies that increased rental
income, decreased vacancy and controlled expenses.
FOCUSED ON DEVELOPMENT
With the launch of Crombie REIT in 2006, the role of
ECL Properties shifted from property acquisition to property
development. Under the umbrella of ECL Properties,
ECL Developments will develop – or redevelop – food-
anchored shopping plazas, which it will then offer for sale
to Crombie REIT under the terms of their preferential
development agreement. The privatization of Sobeys by
Empire will strengthen the already strong relationship
between Empire’s food retailing and real estate businesses,
allowing them to work more closely to formulate growth
strategies. This should result in decreased risk and greater
potential for value creation in both businesses.
During fiscal 2007, ECL Properties completed several
major redevelopment projects, including the Avalon Mall
in St. John’s, Newfoundland and the County Fair Mall in
Summerside, Prince Edward Island. Ongoing redevelopment
projects include the conversion of Fredericton Mall in
New Brunswick into a power centre, Phase II of the Greenfield
Park site in Montreal and the redevelopment of Highland
Square Mall in New Glasgow, Nova Scotia, resulting in
significant completion of our capital spending commitments
to the REIT as part of the original agreement.
Sobey Leased Properties (“SLP”), our second wholly-owned
commercial real estate subsidiary, provides a relatively
consistent stream of income to the real estate group. The
assets of SLP include Sobeys-anchored shopping plazas,
Sobeys standalone stores and Sobeys convenience stores.
We continue to focus on the renovation and expansion
of our existing properties to meet Sobeys’ requirements.
REFINING OUR GOALS
With the privatization of Sobeys now complete, we
continue to be firmly focused on working together to
develop attractive food-anchored shopping plazas.
We are also focused on the review of our SLP property
portfolio to determine if there are opportunities to
offer certain properties for sale to Crombie REIT.
Our experience and expertise in real estate, as well as
our commitment to our investment criteria, will help to
ensure that Empire can withstand the traditional economic
cycles of the real estate industry. We are building a solid
team, capable of executing effectively and dedicated
to expanding our presence without incurring undue risk.
Frank C. SobeyPresident, ECL Properties Limited
and Sobey Leased Properties Limited
June 28, 2007
TOur major goal for fiscal 2008 is to
expand our pipeline of food-anchored
shopping plazas.
EMPIRE COMPANY LIMITED 2007 ANNUAL REPORT 21
9928_Front (no cover)-Eng_Final 21 219928_Front (no cover)-Eng_Final 21 21 7/26/07 6:54:25 AM7/26/07 6:54:25 AM

Long-Term Progress
mpire’s ability to build shareholder value
has been based on continually investing in
businesses we know and understand. This is
reflected in our long-term performance and progress
through different business cycles and will continue
to ensure solid performance despite competition in food
retailing and aggressive growth in real estate.
A CONSISTENT STRATEGY
Sobeys Stores Limited was our publicly listed entity on
major exchanges until Empire Company was listed on the
Toronto Stock Exchange in July, 1982. By June, 1987,
Empire had purchased 100 percent of Sobeys’ outstanding
shares creating a business with three components: food
retailing, real estate and other investments.
Other milestones in Empire’s legacy of value creation are:
December, 1993 – The real estate division increases
its ownership of Halifax Developments Limited to
100 percent from 36 percent.
December, 1998 – After acquiring the Oshawa Group,
Sobeys Inc. became a public company with 62 percent
ownership by Empire Company Limited.
January, 2001 – The real estate division purchases a
35.8 percent interest in Genstar Development Partnership.
March, 2006 – Crombie REIT completes an initial
public offering with Empire retaining a 48.3 percent
ownership interest.
June, 2007 – Empire acquires remaining common shares
of Sobeys to increase its ownership to 100 percent from
72 percent at year-end.
E
+13.6% +17.1%+20.2%
EMPIRE PERFORMANCE 1983–2007
FISCAL YEAR 83 84 85 86 87 88 89 90 91 92 93 94 95 96 97 98 99 00 01 02 03 04 05 06 07
REVENUE ($ IN MILLIONS)
SHARE PRICE ($ PER SHARE)
OPERATING EARNINGS ($ IN MILLIONS)
FISCAL YEAR 83 84 85 86 87 88 89 90 91 92 93 94 95 96 97 98 99 00 01 02 03 04 05 06 07
$625.0
$4.6
$0.51
$204.4
$42.33
$13,366.7
Empire’s Legacy of Value Creation Since Going Public in 1982
REVENUE CAGR (1) OPERATING EARNINGS CAGR (1)
(1) COMPOUND ANNUAL GROWTH RATE SINCE FIRST FISCAL YEAR AS A PUBLIC COMPANY.
SHARE PRICE CAGR (1)
22 LONG-TERM PROGRESS
9928_Front (no cover)-Eng_Final 22 229928_Front (no cover)-Eng_Final 22 22 7/27/07 11:06:26 PM7/27/07 11:06:26 PM

Providing Optimum Choice
Compliments, Sobeys’ private label brand launched in
fiscal 2005, has been a strong contributor to sales
and earnings growth at stores across Canada while
enjoying an ever-increasing share of our customers’
shopping baskets.
At the end of fiscal 2007, the Compliments brand had
grown to more than 4,400 products from mouth-watering
meal solutions to products for babies, health and body,
home and garden, and pets. Compliments offers
three quality tiers – Value, Selection and Sensations –
supplemented by the Organics and balance-équilibre
lines launched in fiscal 2006.
Our Compliments Culinary Centres in Toronto
and Halifax – established in 2005 – have become
focal points for innovation and excellence,
providing outstanding support to Compliments
product development.
Every Organics product is certified by Quality Assurance
International (QAI) and accredited by Le Conseil des
appellations agroalimentaires du Québec (CAAQ).
Every Compliments balance-équilibre product has been
evaluated by the Heart and Stroke Foundation’s
registered dietitians and bears the Health Check™
symbol – a first for private label brands in Canada.
New products are launched almost daily, giving
our customers more of what they’re looking for –
more variety, more value, more information, and more
everyday inspiration.
Initiatives that Deliver Results
Focus on Property Development
Over the past two years, Empire has established a
new real estate structure, including the creation of
ECL Developments. This new division will be focused
on food-anchored shopping plaza development under
the leadership of Donald Clow as President, one of
several key hires made by Empire in 2007 to support our
pursuit of aggressive growth in real estate.
DISCIPLINED GROWTH
As Empire increases its capital investment in real estate
development, we realize that our approach must be
disciplined. This means investment decisions that adhere
to a set of specific criteria, including:
Projects are seen to generate a satisfactory return
on investment;
A beneficial competitive effect on Sobeys;
Credit-worthy tenants with long-term leases that
include contractual increases;
Enhanced geographic diversification; and
Competitive positioning in the project target market.
“Every investment
decision must adhere
to a set of strict criteria.”
DONALD E. CLOW
PRESIDENT,
ECL DEVELOPMENTS LIMITED
EMPIRE COMPANY LIMITED 2007 ANNUAL REPORT 23
9928_Front (no cover)-Eng_Final 23 239928_Front (no cover)-Eng_Final 23 23 7/26/07 6:56:08 AM7/26/07 6:56:08 AM

Community Support
The management and employees within Empire support hundreds of
community projects aimed at promoting the well-being of our communities
and enhancing the lives of Canadians.
GIVING BACK
Many of Empire’s diverse community initiatives are related to our businesses by promoting the well-being of communities, families and children across Canada. One key focus is education. Several scholarship programs for young people have been established and substantial commitments made to the capital campaigns at several Atlantic Canadian universities, including Saint Mary’s University in Halifax, Nova Scotia (main photo).
24 COMMUNITY SUPPORT
9928_Front (no cover)-Eng_Final 24 249928_Front (no cover)-Eng_Final 24 24 7/26/07 6:56:09 AM7/26/07 6:56:09 AM

OUR CORPORATE COMMITMENT
t Empire and within our operating companies,
we have always believed in supporting the
communities that make our success possible.
We encourage our employees to volunteer, be active and
share their passion for service beyond their workplace.
In fiscal 2007, the management and employees within
Empire, Sobeys, ECL Properties and Empire Theatres
supported hundreds of charities across Canada at the
corporate, regional, community and personal levels.
Many are related to our businesses – such as dozens of
health and food related programs including local food
banks, Cook for the Cure and Smart Options. But our
reach is broad, extending to such events and initiatives
as the Special Olympics, Children’s Wish Foundation,
Kids Help Phone and the Atlantic Film Festival.
Community-based events that took place in fiscal
2007 included:
Food Banks – Sobeys’ stores nationwide are regular
contributors to food banks. Regional campaigns in
Atlantic Canada, Ontario and the West have raised
hundreds of thousands of dollars for local food banks.
Employees of both Real Estate and Empire Theatres
also participated in food drives throughout the year to
support the children and families in their neighbourhoods.
Easter Seals Paper Egg Campaign – Once again,
Sobeys and IGA stores across the West and Ontario
sold paper eggs to raise money for children with
disabilities. This year, almost $200,000 was collected.
Cook for the Cure – IGA and Foodland stores in
Ontario raised over $210,000 for the Canadian Cancer
Society through the Cook for the Cure community
barbecue and fundraising event. Stores and vendors
raised a total of over $500,000 through food sales,
community events and corporate donations.
Boys and Girls Clubs of Canada – Through Sobeys
Ontario’s Annual Retailer Golf Tournament, more
than $60,000 was collected to support this worthy
charity, which helps children and youth develop the
skills and values they need.
Kids Help Phone Walk – Sobeys and Empire Theatres
employees were actively involved in fundraising and
organizing the walk to help support the Kids Help Phone.
A fundraising initiative in our Sobeys Atlantic stores in
January 2007 raised an additional $35,000.
Pictou County Dragon Boat Race Festival – Since its
inception in 2001, Sobeys has been the presenting
sponsor of this event, which raises funds to support
the Women Alike Abreast Cancer Survivors Support
Association, Special Olympics of Northern Nova Scotia,
the Pictou County Prostate Cancer Support Association
and Nova Scotia Amateur Sport Fund. This one-day
event drew 45 teams this year, including several teams
from Sobeys, Real Estate and Empire Theatres who
collectively raised over $112,000.
Heartfelt Rewards – For the 21st straight year,
IGA-affiliated retailers in Québec took part in the
$2 For A Heartfelt Reward campaign, supporting
the Montreal Heart Institute Foundation. A total of
$450,000 was collected in less than three weeks.
Environmental Initiatives – Empire and Sobeys both
share in the mission to help keep our community green
and clean. Recognizing the importance of encouraging
daily habits that help reduce waste, Sobeys introduced the
reusable Green Bag for Life in stores across the country.
In the spirit of helping our community reduce waste every
day throughout the year, Sobeys stores in Pictou County,
Nova Scotia supported the Go Clean, Get Green Campaign
in which participants volunteered to clean up the areas
surrounding their workplaces, schools and homes.
Cancer Research – Sobeys and IGA stores in the
West were regional sponsors of the Canadian Breast
Cancer Foundation’s CIBC Run for the Cure. Sobeys
stores in Saskatchewan collected well over $50,000
for breast cancer research during a fundraising drive
in October 2006.
A
To “proudly serve our communities”
is a corporate goal embraced
by management and employees
across Empire.
EMPIRE COMPANY LIMITED 2007 ANNUAL REPORT 25
9928_Front (no cover)-Eng_Final 25 259928_Front (no cover)-Eng_Final 25 25 7/26/07 6:57:26 AM7/26/07 6:57:26 AM

Christmas Events – Real Estate employees recognize
that every little bit makes a difference and throughout
the year weekly events such as 50/50 draws cumulate
to help sponsor local families for Christmas. As well,
the Main Street IGA in Winnipeg held the One Big
Day for Christmas event that had two radio stations
broadcast live for 12 hours, asking listeners and
customers to drop off food, toys and money in support
of the Winnipeg Christmas Cheer Board. The event
brought in nearly $110,000 and more than 2,000 toys.
Both Empire and Sobeys continued their long-standing
commitment to Saint Mary’s University in Halifax
(home of the Sobey School of Business) through
contributions to the University’s Hearts & Minds
Capital Campaign. In 2005, the two companies pledged
$2 million to the University over a five-year period.
EMPLOYEES – SOBEYS VALUE CHAMPIONS
Every year, Sobeys honours employees across the country
for their commitment to Sobeys’ core values. In fiscal 2007,
hundreds of outstanding individuals were nominated as
Sobeys Value Champions. Below are four Value Champion
nominees who are shining examples of “living” our four
core values.
STEPHEN MACDONALD
“Always Place The Customer First”Sobeys Atlantic/National Departments –Customer Service Clerk, Store 652, New Glasgow, Nova Scotia
Stephen was recently named Employee of the Year by the Pictou County Chamber of Commerce, and has been recognized by both co-workers and customers for his pride in his work and his kind, friendly manner. His dedication to customer service embodies the Sobeys’ spirit; in fact, Stephen’s store manager calls him a “true ambassador of the Company.”
ANDRE DUPRE
“Stay Real”Sobeys West – Edmonton Retail Support Centre
When a co-worker suffered a spinal injury and was immobilized for three months, Andre selflessly and tirelessly helped with the recovery effort. He cooked meals, ran errands and brought his co-worker to medical appointments – all while refusing any compensation. Andre’s co-worker recovered from the injury in March 2007, and says the experience showed “there are good and decent people in the world, one of them being Mr. Andre Dupre.”
ANNIE BENOIT
“Proudly Serve Our Communities”Sobeys Québec – Québec Retail Support Centre
Annie believes deeply in aiding sick children, as evidenced by her 14-year-long involvement with Centraide (the United Way). During that time, she has received the “Coup de coeur” award. All along, Annie has acknowledged the support of her colleaguesin helping to make her community a better place, and says being a Value Champion is truly a team victory. Annie’s photo appears on page 27.
CARLO CORDI
“Get It Done With Passion and Integrity”Sobeys Ontario – Viscount Office
Carlo is always willing to assist the team however he can. Whether it’s accepting and completing last-second work requests with efficiency and flair, or offering helpful advice to others in the Viscount office, Carlo is known for always being ready to do what it takes to get the job done, even at a moment’s notice.
CANADIAN BUSINESS HALL OF FAME
Donald and David Sobey were inducted into the Junior
Achievement Canadian Business Hall of Fame in
May 2007, following in the footsteps of their father, the
late Frank H. Sobey. This honour recognizes not only
their business acumen, but also their enduring belief
in supporting communities through personal and
corporate philanthropy. Empire believes in this approach
and, as our business continues to grow, we will always
remember to give back to the people and communities
who have helped us achieve our success.
26 COMMUNITY SUPPORT
9928_Front (no cover)-Eng_Final 26 269928_Front (no cover)-Eng_Final 26 26 7/26/07 6:57:26 AM7/26/07 6:57:26 AM

THE SOBEY LEGACY
Empire’s dedication to community service is closely tied to
the legacy of the Sobey family, which is strongly represented
in the leadership and governance of our companies.
With the support of the Sobey Foundation, contributions
from our operating companies as well as the investments
by individual family members, we are proud to play a role
in enhancing the lives of Canadians.
EDUCATION
Education is a key focus of the Sobey family efforts, with
several scholarships dedicated to providing a brighter
future for young people and their communities:
Frank H. Sobey Fund for Excellence in Business
Studies – provides six $10,000 scholarships to
business students at universities in Atlantic Canada.
D&R Sobey Atlantic Leadership Scholarship –
provides six $14,000 scholarships to students from
Atlantic Canada entering the Commerce program at
Queen’s University.
In addition, over the past two years the Sobey Foundation
has made commitments to capital campaigns at several
Atlantic Canadian universities, including Cape Breton
University, Saint Mary’s University, the University of
New Brunswick, Mount Allison University, Acadia University
and the Coady International Institute at Saint Francis
Xavier University.
ARTS & CULTURE
Five talented artists from across Canada were short-listed
for this year’s Sobey Art Award presented by Scotiabank.
The winner was Annie Pootoogook (below) of Cape Dorset,
Nunavut, who received $50,000 as well as valuable
exposure for her work. The Sobey Art Award, created in
2002 by the Sobey Art Foundation, is designed to
recognize and support deserving contemporary Canadian
artists under the age of 40. This year, the previously
biennial award became an annual prize with the support
of Scotiabank, the award’s presenting sponsor, ensuring
an even greater commitment to contemporary artists
throughout Canada. For more information about the
Sobey Art Award visit www.sobeyartaward.ca.
HEALTHCARE
In fiscal 2007, the Frank and Irene Sobey Memorial Trust,
together with the Aberdeen Hospital Foundation, contributed
nearly $1 million towards the purchase of a new MRI
unit at Aberdeen Hospital in New Glasgow, Nova Scotia
(centre photo below). This purchase significantly raises the
level of care available to residents of the area. Members
of management at Empire and Sobeys volunteer their time
to community-based groups such as the Aberdeen Hospital
Foundation, as well as the Dalhousie Medical Research
Foundation and Summer Street Industries Foundation.
A BREADTH OF COMMITMENT
Our corporate commitment extends from the celebration of employees in our stores who exemplify our corporate values – our Value Champions – to improving the quality of education and healthcare in our communities and supporting talented young artists across Canada.
9928_Front (no cover)-Eng_Final 27 279928_Front (no cover)-Eng_Final 27 27 7/26/07 6:58:14 AM7/26/07 6:58:14 AM

Corporate Offi cersas of July 26, 2007
Officers of Empire Company Limited
Officers of Operating Companies
Directors of Sobeys Inc.
1 ROBERT P. DEXTER
CHAIR
2 PAUL D. SOBEY
PRESIDENT AND
CHIEF EXECUTIVE OFFICER
3 PAUL V. BEESLEY
EXECUTIVE VICE-PRESIDENT,
CHIEF FINANCIAL OFFICER
AND SECRETARY
4 FRANK C. SOBEY
VICE-PRESIDENT,
REAL ESTATE
5 STEWART H. MAHONEY
VICE-PRESIDENT,
TREASURY AND
INVESTOR RELATIONS
6 CAROL A. CAMPBELL
VICE-PRESIDENT,
RISK MANAGEMENT
7 JOHN G. MORROW
VICE-PRESIDENT AND
COMPTROLLER
SOBEYS INC.
1 ROBERT P. DEXTER
CHAIR
2 BILL McEWAN
PRESIDENT AND
CHIEF EXECUTIVE OFFICER
3 CRAIG T. GILPIN
PRESIDENT OPERATIONS,
SOBEYS ONTARIO
4 J. GARY KERR
PRESIDENT OPERATIONS,
SOBEYS WEST
5 JASON POTTER
PRESIDENT OPERATIONS,
SOBEYS ATLANTIC
6 MARC POULIN
PRESIDENT OPERATIONS,
SOBEYS QUÉBEC
7 DENNIS FOLZ
CHIEF HUMAN
RESOURCES OFFICER
8 FRANÇOIS VIMARD
CHIEF FINANCIAL OFFICER
9 BELINDA YOUNGS
CHIEF MARKETING OFFICER
10 KARIN MCCASKILL
SENIOR VICE-PRESIDENT,
GENERAL COUNSEL
AND SECRETARY
11 PAUL A. JEWER
SENIOR VICE-PRESIDENT,
FINANCE AND TREASURER
12 L. JANE MCDOW
ASSISTANT SECRETARY
ECL PROPERTIES LIMITED
& SOBEY LEASED
PROPERTIES LIMITED
1 FRANK C. SOBEY
PRESIDENT
2 JOHN G. MORROW
VICE-PRESIDENT, FINANCE
AND TREASURER
3 PAUL V. BEESLEY
SECRETARY
ECL DEVELOPMENTS
LIMITED
1 DONALD E. CLOW
PRESIDENT
2 PAT MARTIN
VICE-PRESIDENT,
ONTARIO AND QUEBEC
EMPIRE THEATRES LIMITED
1 STUART G. FRASER
PRESIDENT AND
CHIEF EXECUTIVE OFFICER
2 KEVIN J. MACLEOD
EXECUTIVE VICE-PRESIDENT,
OPERATIONS
3 PAUL W. WIGGINTON
VICE-PRESIDENT, FINANCE
AND CHIEF FINANCIAL OFFICER
ROBERT P. DEXTER
CHAIR
BILL MCEWAN
PRESIDENT AND
CHIEF EXECUTIVE OFFICER
JOHN L. BRAGG
CHAIRMAN, PRESIDENT
AND CO-CHIEF EXECUTIVE
OFFICER, OXFORD FROZEN
FOODS LTD.
MARCEL CÔTÉ
SENIOR PARTNER,
SECOR INC.
CHRISTINE CROSS
PRESIDENT,
CHRISTINE CROSS LTD.
DAVID S. FERGUSON
PRINCIPAL, D.S. FERGUSON
ENTERPRISES, LLC
EDWARD C. HARSANT
CORPORATE DIRECTOR
DAVID A. LESLIE
CORPORATE DIRECTOR
MALEN NG
CHIEF FINANCIAL OFFICER,
WORKPLACE SAFETY
AND INSURANCE BOARD
OF ONTARIO
MEL A. RHINELANDER
VICE-CHAIRMAN,
EXTENDICARE INC. AND
EXTENDICARE REIT
STEPHEN J. SAVIDANT
CHAIRMAN, PROSPECTS
RESOURCES LIMITED
DAVID F. SOBEY
CHAIR EMERITUS
DONALD R. SOBEY
CHAIR EMERITUS,
EMPIRE COMPANY LIMITED
FRANK C. SOBEY
CHAIRMAN, CROMBIE REIT
JOHN R. SOBEY
CORPORATE DIRECTOR
KARL R. SOBEY
CORPORATE DIRECTOR
PAUL D. SOBEY
PRESIDENT AND
CHIEF EXECUTIVE OFFICER,
EMPIRE COMPANY LIMITED
ROB G.C. SOBEY
PRESIDENT AND
CHIEF EXECUTIVE OFFICER,
LAWTON’S DRUG
STORES LIMITED
1 2 3 4 5 6 7
1 2 3 4 5 6 7 8 99 1010 1111 1212
1 2 3 1 2 1 2 3
1 2 3 4 5 6 7
1 2 3 4 5 6 7 8 9 10 11 12
1 2 3 1 2 1 2 3
28
9928_Front (no cover)-Eng_Final 28 289928_Front (no cover)-Eng_Final 28 28 7/26/07 6:58:16 AM7/26/07 6:58:16 AM

TABLE OF CONTENTS
INTRODUCTION ............................................................................ 30
FORWARD-LOOKING INFORMATION .................................. 30
NON-GAAP FINANCIAL MEASURES ................................... 31
OVERVIEW OF THE BUSINESS .............................................. 31
FOOD RETAILING .................................................................... 31
REAL ESTATE ............................................................................ 32
INVESTMENTS & OTHER OPERATIONS .......................... 33
EMPIRE’S STRATEGIC DIRECTION ...................................... 33
OPERATIONAL CHANGES ........................................................ 33
CONSOLIDATED OPERATING RESULTS ............................. 34
MANAGEMENT’S EXPLANATION OF FISCAL 2007
ANNUAL CONSOLIDATED RESULTS ............................... 35
REVENUE ................................................................................... 35
OPERATING INCOME ............................................................. 36
INTEREST EXPENSE .............................................................. 36
INCOME TAXES ........................................................................ 37
MINORITY INTEREST ............................................................. 37
OPERATING EARNINGS ........................................................ 37
CAPITAL GAINS AND OTHER ITEMS ................................ 37
NET EARNINGS ........................................................................ 37
FISCAL 2007 OPERATING PERFORMANCE
BY DIVISION .............................................................................. 38
FOOD RETAILING .................................................................... 38
REAL ESTATE ............................................................................ 41
INVESTMENTS AND OTHER OPERATIONS ................... 43
QUARTERLY RESULTS OF OPERATIONS ........................... 46
RESULTS BY QUARTER ........................................................ 46
FOURTH QUARTER RESULTS ............................................ 47
Management’s Discussion and Analysis
FINANCIAL CONDITION ............................................................ 49
CAPITAL STRUCTURE AND KEY
FINANCIAL CONDITION MEASURES ............................... 49
SHAREHOLDERS’ EQUITY .................................................. 49
LIABILITIES ................................................................................. 50
FINANCIAL INSTRUMENTS .................................................. 51
LIQUIDITY AND CAPITAL RESOURCES ............................. 52
OPERATING ACTIVITIES ........................................................ 52
INVESTING ACTIVITIES .......................................................... 54
FINANCING ACTIVITIES ......................................................... 55
ACCOUNTING POLICY CHANGES ....................................... 55
CRITICAL ACCOUNTING ESTIMATES ................................. 58
CONTROLS AND PROCEDURES ........................................... 59
INTERNAL CONTROLS OVER
FINANCIAL REPORTING ...................................................... 60
RELATED PARTY TRANSACTIONS ....................................... 60
GUARANTEES AND COMMITMENTS .................................. 60
DESIGNATION FOR ELIGIBLE DIVIDENDS ....................... 61
CONTINGENCIES ........................................................................ 62
RISK MANAGEMENT .................................................................. 63
SUBSEQUENT EVENTS ............................................................. 66
OUTLOOK ........................................................................................ 67
NON-GAAP FINANCIAL MEASURES ................................... 68
EMPIRE COMPANY LIMITED 2007 ANNUAL REPORT 29
9928_Back-Eng_Final v1a.indd 299928_Back-Eng_Final v1a.indd 29 7/26/07 8:00:42 AM7/26/07 8:00:42 AM

The following Management’s Discussion and Analysis (“MD&A”) contains commentary from management on the consolidated fi nancial condition and results of operations of Empire Company Limited (“Empire” or the “Company”) for the 52 weeks ended May 5, 2007, as compared to the 52 weeks ended May 6, 2006. Management also provides as explanation of the Company’s fourth quarter results, changes in accounting policies, critical accounting estimates and factors that the Company believes may affect its prospective fi nancial condition, cash fl ows and results of operations. This MD&A also provides analysis of the operating performance of the Company’s divisions as well as a discussion of cash fl ows, the impact of risks and the outlook for the business. Additional information about the Company, including the Company’s Annual Information Form, can be found on SEDAR at www.sedar.com.
This discussion and analysis is the responsibility of management. The Board of Directors carries out its responsibility for review
of this disclosure principally through its Audit Committee, comprised exclusively of independent directors. The Audit Committee has reviewed and approved this disclosure and it has also been approved by the Board of Directors.
This discussion and analysis should be read in conjunction with the audited annual consolidated fi nancial statements of the Company and the accompanying notes for the 52 weeks ended May 5, 2007. The consolidated fi nancial statements and accompanying notes have been prepared in accordance with Canadian Generally Accepted Accounting Principles (“GAAP”) and are reported in Canadian dollars.
These consolidated fi nancial statements include the accounts of Empire and its subsidiaries and variable interest entities (“VIEs”) which the Company is required to consolidate. Included in the Company’s 2007 Annual Report, on page 100, is a glossary of terms used throughout this MD&A. The information contained in this MD&A is current to June 28, 2007, unless otherwise noted.
Management’s Discussion and Analysis
Forward-looking Information
This discussion contains forward-looking statements which refl ect management’s expectations regarding the Company’s objectives, plans, goals, strategies, future growth, results of operations, performance and business prospects and opportunities. These forward-looking statements include the following items:
Sobeys’ expectations regarding tobacco sales decline, which could be impacted by further changes in the sales and distribution practices of tobacco suppliers;
Management’s belief that the current growth rate in residential lot sales is not sustainable over the long-term and may be impacted by general economic conditions in the Western housing market;
The Company’s expectations related to pending tax matters with Canada Revenue Agency (“CRA”), which could be determined differently by CRA. This could cause the Company’s effective tax rate and its earnings to be affected positively or negatively in the period in which the matters are resolved;
Sobeys’ expectations that the new distribution centre announced for Ontario and the closures of distribution centres in Québec will reduce overall distribution costs, which could be impacted by the number of positions eliminated at Sobeys’ distribution centres in Ontario and Québec;
Sobeys’ expectations that administrative and business rationalization activities as well as system process initiatives in the current year and upcoming quarters will have a cost impact as expected and will provide thereafter annualized
cost reductions, both of which could be impacted by the fi nal scope and scale of these activities;
Sobeys’ expectation that sales growth will continue through 2008 could be impacted by market conditions and therefore may not be realized;
The Company’s expectations that its capital resources and liquidity position will meet its capital and liquidity requirements over the next year;
The Company’s expectations on future capital spending for its Real Estate and Food Retailing Divisions, which could be impacted by the availability of labour, capital resource allocation decisions, as well as general economic and market conditions;
The Company’s discussion of the potential disposition of real property by Sobey Leased Properties. There are no agreements for any such transaction. There can be no assurances that these transactions will occur and, if they occur, no assurances as to the economic value of the transactions;
The Company’s expectations that the pension plan merger will be approved by the appropriate authorities. If this merger is not completed, the value of the transitional pension assets included in other assets on the balance sheet may be impacted; and
The Company’s expectation of continued strong occupancy levels which could be impacted by changes in demand for the Company’s properties, tenant bankruptcies, the effect of general economic conditions and competitive supply of retail or offi ce locations in proximity to the Company’s locations.
MANAGEMENT’S DISCUSSION AND ANALYSIS30
9928_Back-Eng_Final v1a.indd 309928_Back-Eng_Final v1a.indd 30 7/26/07 8:00:43 AM7/26/07 8:00:43 AM

Forward-looking statements are typically identifi ed by words or phrases such as “anticipates”, “expects”, “believes”, “estimates”, “intends” and other similar expressions. These statements are based on management’s assumptions and beliefs in light of the information currently available to them. These forward-looking statements are subject to inherent uncertainties, risks and other factors that could cause actual results to differ materially from such statements. These uncertainties and risks are discussed in the Company’s materials fi led with the Canadian securities regulatory authorities from time to time, including those in the Risk Management section of this MD&A.
When relying on forward-looking statements to make decisions, the Company cautions readers not to place undue reliance on these statements, as a number of important factors could cause actual results to differ materially from any estimates or intentions expressed in such forward-looking statements. The Company does not undertake to update any forward-looking statements that may be made from time to time by or on behalf of the Company.
Non-GAAP Financial Measures
There are measures included in this MD&A that do not have a standardized meaning under Canadian GAAP. Management includes these measures because it believes certain investors
use these measures as a means of assessing relative fi nancial performance. Additional information relating to non-GAAP fi nancial measures is provided at the end of this document.
Overview of the Business
Empire is a Canadian company headquartered in Stellarton, Nova Scotia. Empire’s key businesses at year-end were: food retailing through a 72.1 percent ownership interest in Sobeys Inc. (“Sobeys”); real estate through two wholly-owned operating subsidiaries: Sobey Leased Properties Limited (“SLP”), and ECL Properties Limited (“ECL”) which includes wholly owned ECL Developments Limited, a 35.7 percent ownership interest in Genstar Development Partnership and a 43.3 percent interest in Genstar Development Partnership 2 (collectively referred to as “Genstar”) and a 48.1 percent ownership interest in Crombie Real Estate Investment Trust (“Crombie REIT”); and corporate investment activities and other operations which include wholly-owned ETL Canada Holdings Limited (“Empire Theatres”),
Kepec Resources Limited (“Kepec”), a joint venture with APL Oil and Gas Limited which has ownership interests in various oil and gas properties in Alberta, and a 27.6 percent ownership position in Wajax Income Fund (“Wajax”). With approximately $5.2 billion in assets, Empire employs approximately 40,000 people directly and through its subsidiaries.
Empire’s primary goal is to grow long-term shareholder value through income and cash fl ow growth and equity appreciation. This is accomplished through direct ownership and equity participation in businesses that management believes have the potential for long-term growth and profi tability.
Food Retailing
Sobeys is a leading national retail grocery and food distributor headquartered in Stellarton, Nova Scotia. Founded in 1907, Sobeys owns or franchises more than 1,300 corporate and franchised food stores located in all 10 provinces under various retail banners including: Sobeys, IGA extra, IGA, Price Chopper and Foodland. Sobeys, its subsidiaries and its VIEs conduct business in four retail regions: Sobeys West, Sobeys Ontario, Sobeys Québec, and Sobeys Atlantic.
Sobeys’ strategy is focused on delivering the best food shopping experience to its customers in the right format, right-sized stores, supported by superior customer service. The fi ve distinct store formats deployed by Sobeys to satisfy its customers’ principal shopping requirements are: full service, fresh service, convenience service, community service and price service. Sobeys remains focused on improving the product, service and merchandising offerings within each format by realigning and renovating its current store base, while continuing to build new stores. Sobeys’ fi ve major banners are the primary focus of these format development efforts.
EMPIRE COMPANY LIMITED 2007 ANNUAL REPORT 31
9928_Back-Eng_Final v1a.indd 319928_Back-Eng_Final v1a.indd 31 7/26/07 8:00:43 AM7/26/07 8:00:43 AM

During the year, Sobeys opened, replaced, expanded, renovated, acquired and/or converted the banners in 150 stores (2006 – 83 stores). In fi scal 2007, Sobeys continued to execute against a number of initiatives in support of its food-focused strategy including productivity initiatives and business process, supply chain and system upgrades.
Compliments, Sobeys private label brand, was launched in fi scal 2005 to contribute to growth of company-wide sales and profi tability and earn a greater share of customers’ food and grocery shopping requirements. The Compliments brand consists of three quality tiers: Value, Selection and Sensations. In addition, Sobeys introduced two sub-brands during fi scal 2006, Compliments Organics and Compliments balance-
équilibre, an organic and healthy line of products, respectively. At the end of fi scal 2007, the Compliments brand consisted of approximately 4,400 products.
During fi scal 2007, Sobeys continued to make signifi cant progress in the implementation of system-wide business process optimization initiatives that are designed to reduce complexity and improve processes throughout Sobeys.
In fi scal 2006, Sobeys began its business process and information systems plan for the Company by focusing on the signifi cant opportunity to upgrade information processing and decision support capabilities and improve effi ciencies in the Ontario region. The system and processes that were implemented were developed over several years and are also employed in the Sobeys’ Atlantic region. The Ontario roll-out standardized and streamlined the “back shop” in support of Sobeys’ food-focused strategy. This move will allow Sobeys to leverage technology investments, improve effi ciencies and lower costs over the long-term. During the third quarter of fi scal 2007 Sobeys completed the implementation of the system in the Ontario region in accordance with its plan. A similar business process and system initiative began in the Western region during fi scal 2007. Costs associated with the Ontario and West initiatives totalled $0.21 per Empire share in fi scal 2007 as compared to $0.13 per Empire share in fi scal 2006.
Subsequent to year-end on June 15, 2007, Empire acquired the outstanding common shares of Sobeys that it did not already own, achieving 100 percent ownership. Further details can be found in the section titled “Subsequent Events” near the end of this MD&A.
Real Estate
Empire’s real estate division consists of wholly-owned SLP and ECL, which includes an interest in Genstar, a residential land development business with operations primarily in Western Canada. ECL also owns various commercial properties held for redevelopment, a self-storage operation and a 48.1 percent ownership interest in Crombie REIT. Empire segments its real estate’s fi nancial results between commercial property operations, consisting of SLP and ECL, and residential property operations which consist primarily of Genstar.
Genstar’s business is the development of raw land for residential use primarily carried out in Ontario and Western Canada. Genstar is accounted for on a proportionate consolidation basis.
At the end of fi scal 2007, commercial real estate operations had approximately 5.7 million square feet of gross leaseable area, relatively consistent with the 5.9 million square feet at the end of last fi scal year.
SLP owns commercial properties in the Atlantic Provinces, as well as in Ontario and Québec. The primary tenant of these properties is Sobeys and its subsidiaries. There have been no additions to SLP since 2001; its main focus remains on the renovation and expansion of its existing portfolio.
The remaining wholly-owned real estate operations are focused on commercial property development. For new commercial property development management is committed to adhering to a disciplined growth strategy. Specifi cally, investment decisions are expected to meet certain criteria, including:
A satisfactory return on investment; A benefi cial competitive effect on Sobeys; Credit-worthy tenants with long-term leases that include
contractual increases; Enhanced geographic diversifi cation; and Competitive positioning in the project target market.
Pursuant to a Development Agreement with Crombie REIT, ECL provides Crombie REIT with a preferential right to acquire all property developments proposed to be undertaken by ECL. ECL also has a Non-Competition Agreement with Crombie REIT, whereby it will not compete with Crombie REIT in the acquisition, ownership, investment in or development of any grocery-anchoredshopping plazas in Canada. These agreements are for an initial 10-year term, subject to an extension reached by mutual agreement. Empire subsidiaries will continue to work closely with Crombie REIT to identify development opportunities that further Crombie REIT’s external growth strategy.
MANAGEMENT’S DISCUSSION AND ANALYSIS32
9928_Back-Eng_Final v1a.indd 329928_Back-Eng_Final v1a.indd 32 7/26/07 8:00:43 AM7/26/07 8:00:43 AM

Investments & Other Operations
The third component of Empire’s business is its investments and other operations. Empire’s investment portfolio consists of Canadian and U.S. common equity investments. At fi scal year-end, Empire’s investments, excluding its investment in Genstar U.S. builder deals and in Crombie REIT, carried a market value of $441.2 million consisting of Canadian common equity investments valued at $391.7 million, foreign common equities (including the value of the forward contract hedges) valued at $48.0 million in Canadian dollars, and other investments valued at $1.5 million. The Canadian common equity investment market value includes the market value of Empire’s equity accounted investment in Wajax (approximately a 27.6 percent ownership
position on a fully diluted basis) of $154.6 million at fi scal year-end. All of Empire’s portfolio investments are listed on a recognized public stock exchange.
Subsequent to fi scal year-end the liquid investments in the portfolio, with the exception of the investment in Wajax, were sold to assist in fi nancing the acquisition of the remaining common shares of Sobeys that Empire did not already own (please see the section titled “Subsequent Events” in this MD&A for more information).
Other operations include wholly-owned Empire Theatres, the second largest movie exhibitor in Canada which owns or has an interest in 56 locations representing 394 screens, and Kepec.
Empire’s Strategic Direction
Management’s primary objective is to maximize the long-term sustainable value of Empire through enhancing the worth of the Company’s net assets and in turn, having that value refl ected in Empire’s share price.
During the year, management and the Board of Directors undertook a comprehensive strategic review of Empire’s businesses, thoroughly analyzing our potential growth opportunitiesand capabilities. As a consequence of this review it was determined that with 100 years of experience in the retail food industry and over 40 years in real estate, shareholder value could be increased by becoming even more focused on the core strengths of the Company. On April 26, 2007 Empire and Sobeys jointly announced that they had entered into an agreement pursuant to which Empire would acquire the remaining outstanding common shares of Sobeys. Subsequent to the end of the fi scal year, on June 15, 2007, Empire completed the privatization of Sobeys (see the section titled “Subsequent Events” in this MD&A for more information).
This decision results in the Company being clearly focused on its core strengths: food and related real estate development, while continuing to direct its energy and capital towards growing
the long-term sustainable value of each of its core operating businesses. While these respective core businesses are well established and profi table in their own right, the diversifi cation they offer Empire by both business line and by market area served is considered by management to be an additional source of strength. Together, these core businesses reduce risk and volatility, thereby contributing to greater consistency in consolidated earnings growth over the long-term. Going forward, the Company intends to continue to direct its resources towards the most promising opportunities within these core businesses in order to maximize long-term shareholder value.
In carrying out the Company’s strategic direction, Empire management defi nes its role as having four fundamental responsibilities: fi rst, to support the development and execution of sound strategic plans for each of its operating companies; second, to regularly monitor the development and the execution of business plans within each operating company; third, to ensure that Empire is well governed as a public company; and fourth, to prudently manage its capital in order to augment the growth in its core operating businesses.
Operational Changes
Listed below is a summary of events that impacted the fi scal year 2007 operating results and which affect the comparability of information for the 13-week and 52-week periods ended May 5, 2007 versus the 13-week and 52-week periods ended May 6, 2006:
On August 27, 2006, Sobeys completed the acquisition of Achille de la Chevrotière Ltée and its associated companies
(“ADL”), which included 25 owned or franchised retail store operations, other wholesale supply agreements and distribution facilities;
For the 12 months ended May 5, 2007, Empire acquired 1,248,950 common shares of Sobeys, increasing its ownership position from 70.3 percent at May 6, 2006 to its position of 72.1 percent at May 5, 2007;
EMPIRE COMPANY LIMITED 2007 ANNUAL REPORT 33
9928_Back-Eng_Final v1a.indd 339928_Back-Eng_Final v1a.indd 33 7/27/07 9:53:31 PM7/27/07 9:53:31 PM

On March 23, 2006, the Company completed the sale of 44 commercial properties to Crombie REIT. For both the quarter and fi scal year ended May 5, 2007, the Company is equity accounting its 48.1 percent ownership in Crombie REIT, whereas for the 13-week and 52-week periods ended May 6, 2006, the results included 100 percent of the operations related to these 44 commercial properties;
Empire Theatres changed its year-end from the last Thursday in April to the last Thursday in December effective December 28, 2006. This change in Empire Theatres’ year-end was made to align with industry practice. However, because of this change, the fi scal year ended May 5, 2007 contained 48 weeks of operations while the fi scal year ended May 6, 2006 contained 52 weeks of operations; and
On September 30, 2005, Empire Theatres acquired 28 movie theatres. There are approximately 30 weeks of operations related to these newly acquired theatres in fi scal 2006 whereas there are 48 weeks included in fi scal 2007.
Also impacting comparability year-over-year are costs related to Sobeys’ business process and system initiative, business rationalization, and privatization costs as outlined under the sectiontitled “Fiscal 2007 Operating Performance by Division – Food”.
The reader should note that management explains the impact of the above events when discussing the operating results for the food division, the real estate division and investments and other operations.
Consolidated Operating Results
The consolidated fi nancial overview provided below reports on the fi nancial performance for fi scal 2007 relative to the last two fi scal years.
Summary Table of Consolidated Financial Results
52 Weeks Ended 52 Weeks Ended 53 Weeks Ended
($ in millions, May 5, % of May 6, % of May 7, % of except per share information) 2007 Revenue 2006 (1) Revenue 2005 Revenue
Consolidated revenue $ 13,366.7 100.00% $ 13,063.6 100.00% $ 12,435.2 100.00%
Operating income 440.3 3.29% 491.4 3.76% 463.7 3.73%
Operating earnings 204.4 1.53% 202.0 1.55% 182.9 1.47%
Capital gains and other items, net of tax 5.7 0.04% 94.8 0.72% 3.7 0.03%
Net earnings $ 210.1 1.57% $ 296.8 2.27% $ 186.6 1.50%
BASIC EARNINGS PER SHARE
Operating earnings $ 3.11 $ 3.08 $ 2.79
Capital gains and other items, net of tax 0.09 1.45 0.05
Net earnings $ 3.20 $ 4.53 $ 2.84
Basic weighted average number
of shares outstanding (in millions) 65.6 65.5 65.5
DILUTED EARNINGS PER SHARE
Operating earnings $ 3.10 $ 3.07 $ 2.78
Capital gains and other items, net of tax 0.09 1.44 0.05
Net earnings $ 3.19 $ 4.51 $ 2.83
Diluted weighted average number
of shares outstanding (in millions) 65.7 65.7 65.7
Dividends per share $ 0.60 $ 0.56 $ 0.48
(1) Restated.
MANAGEMENT’S DISCUSSION AND ANALYSIS34
9928_Back-Eng_Final v1a.indd 349928_Back-Eng_Final v1a.indd 34 7/26/07 8:00:43 AM7/26/07 8:00:43 AM

The 13 weeks and 52 weeks ended May 6, 2006 have been restated to refl ect the retroactive adjustment related to EIC-156. Please see the section entitled “Accounting Policy Changes – Accounting for Consideration by a Vendor to a Customer (Including a Reseller of the Vendor’s Products) (“EIC-156”)” in this MD&A.
The following is a review of Empire’s consolidated fi nancial performance for the 52-week periods ended May 5, 2007 compared to May 6, 2006.
Revenue and fi nancial performance of each of the Company’s businesses (food retailing, real estate, and investments and other operations) are discussed in detail in the section entitled “Fiscal 2007 Operating Performance by Division” in this MD&A.
Management’s Explanation of Fiscal 2007 Annual Consolidated Results
Revenue
The consolidated revenue for fi scal 2007 was $13.4 billion, an increase of $303.1 million or 2.3 percent compared to fi scal 2006. Growth in Sobeys’ sales of $313.9 million and in investments and other operations of $27.4 million was partially offset by a $38.2 million reduction in revenue from the real estate division.
Items impacting revenue comparability:
Sobeys’ sales were negatively impacted by the disposition on March 31, 2006 of its Cash and Carry business in Ontario and Québec;
Sobeys continued to experience declines in its tobacco sales. Late in the second quarter of fi scal 2007 a major Canadian tobacco supplier began to sell and distribute directly to certain Sobeys’ customers, further impacting the decline;
Revenue was positively impacted by the acquisition on August 27, 2006 of ADL. The acquisition included 25 owned or franchised retail store operations, other wholesale supply agreements and a distribution facility in Rouyn-Noranda, Québec;
Empire Theatres changed its year-end from the last Thursday in April to the last Thursday in December effective December 28, 2006. This change in Empire Theatres’ year-end was made to align with industry practice. However, because of this change, fi scal year ended May 5, 2007 contained 48 weeks of operations while the fi scal year ended May 6, 2006 contained 52 weeks of operations, respectively;
Revenue for the fi scal year-to-date ended May 5, 2007, included 48 weeks of revenue related to the acquisition of the 28 movie theatres, whereas the fi scal year-to-date ended May 6, 2006, included 30 weeks of revenue from the acquired movie theatres; and
The sale of 44 properties to Crombie REIT has reduced the quarter and year-to-date revenue when compared to the prior year.
EMPIRE COMPANY LIMITED 2007 ANNUAL REPORT 35
9928_Back-Eng_Final v1a.indd 359928_Back-Eng_Final v1a.indd 35 7/26/07 8:00:44 AM7/26/07 8:00:44 AM

Operating Income
Consolidated operating income, defi ned as operating earnings before minority interest, interest expense, income taxes and capital gains and other items, in fi scal 2007 totalled $440.3 million compared to $491.4 million last year, a decrease of $51.1 million or 10.4 percent. The decrease in operating income is the result of a $31.4 million or 9.5 percent decrease in operating income contribution from the food retailing division and a decrease in real estate division operating income of $20.3 million or 14.7 percent, partially offset by a $0.6 million or 2.8 percent increase in operating income from investments and other operations, net of corporate expenses.
Included in operating income for fi scal 2007 are $51.7 million of pre-tax costs incurred by Sobeys related to its business process and system initiative, severance in its Atlantic, Québec and Ontario regions as a result of business rationalization, along with fi xed asset and inventory write-offs, and privatization costs. Sobeys incurred $18.6 million of pre-tax costs related to its business process and system initiative during the last fi scal year.
Please refer to the section entitled “Fiscal 2007 Operating Performance by Division” for an explanation of the change in operating income for each division.
Interest Expense
For the 52 weeks ended May 5, 2007, interest expense equalled $60.1 million, versus $83.8 million in the prior year. The $23.7 million decrease in fi scal 2007 consolidated interest expense compared to last fi scal year is primarily due to a $21.5 million reduction in interest expense connected to long-term debt.
Long-term debt, including long-term debt related to properties sold to Crombie REIT, was $240.8 million lower in fi scal 2007 compared to fi scal 2006. The decrease in long-term debt and related long-term interest expense in fi scal 2007 is primarily related to the repayment of long-term debt as a result of the sale of 44 commercial properties to Crombie REIT in March 2006, partially offset by the issuance of $125 million of Medium Term Notes (“MTN”) in the second quarter by the food division.
Short-term interest expense declined $2.2 million, to $6.0 million from $8.2 million last year. The decrease in short-term interest expense is primarily the result of proceeds generated from the sale of investments which were used in part to reduce bank indebtedness.
The majority of the Company’s debt is long-term in nature carrying fi xed interest rates; accordingly there is limited exposure to interest rate volatility. The Company is exposed to interest rate risk when arranging new debt.
As presented in the following table, excluding the impact of the above items, revenue growth would have been 4.3 percent in fi scal 2007 compared to fi scal 2006.
REVENUE TABLE
52 Weeks Ended ($ in millions) May 5, 2007 May 6, 2006 $ Change % Change
Financially reported sales $ 13,366.7 $ 13,063.6 $ 303.1 2.3%
Add (deduct) the impact of:
Cash and Carry disposal 196.1
Wholesale tobacco decline 123.9
ADL acquisition (151.8)
Theatre acquisition and year-end change (1) (22.8)
Sale of 44 commercial properties to Crombie REIT 116.7
Subtotal 262.1
$ 565.2 4.3%
(1) The impact for theatres’ revenue, refl ected in the above table, represents the reduction of four weeks of revenue for fi scal 2007 as a result of Empire Theatres’ fi scal year-end change as well as an additional 18 weeks of revenue in the current fi scal year-to-date as a result of the acquisition of 28 movie theatres in the second quarter of the prior fi scal year.
Please refer to the section entitled “Fiscal 2007 Operating Performance by Division” for an explanation of the change in revenue by division.
MANAGEMENT’S DISCUSSION AND ANALYSIS36
9928_Back-Eng_Final v1a.indd 369928_Back-Eng_Final v1a.indd 36 7/27/07 9:58:03 PM7/27/07 9:58:03 PM

Income Taxes
The effective income tax rate for fi scal 2007 was 32.5 percent versus 34.8 percent last year. The main reason for the fi scal year decrease is due to reductions in the Canadian federal and certain provincial statutory income tax rates and the application of those lower rates to future tax balances.
Minority Interest
In fi scal 2007, Empire recorded minority interest expense of $57.0 million compared to $66.9 million last year. The decrease of $9.9 million in minority interest expense is primarily the result of lower Sobeys’ earnings as well as an increase in Empire’s ownership in Sobeys from 70.3 percent at May 6, 2006, to 72.1 percent at May 5, 2007. Empire purchased 1,248,950 common shares of Sobeys during fi scal 2007.
Operating Earnings
The $2.4 million or 1.2 percent increase in fi scal 2007 operating earnings (earnings before capital gains and other items) over the prior year was the result of the $51.1 million reduction in operating income partially offset by the $23.7 million reduction in interest expense, the $19.9 million reduction in income taxes and the $9.9 million decrease in minority interest as discussed.
As mentioned, $51.7 million of pre-tax costs incurred by Sobeys resulted in a $24.4 million impact on Empire’s fi scal 2007 net earnings ($0.37 per share), whereas there were $18.6 million of pre-tax costs incurred by Sobeys in fi scal 2006 that resulted in a $8.6 million impact on Empire’s net earnings ($0.13 per share).
Capital Gains and Other Items
The Company generated capital gains and other items, net of tax, of $5.7 million in fi scal 2007 largely as a result of net gains on the sale of investments. Fiscal 2006 capital gains and other items, net of tax, of $94.8 million was realized primarily from the gain of $76.2 million on the sale of properties to Crombie REIT and a net gain of $23.5 million on the sale of 2.875 million Wajax Income Fund units last year, partially offset by a reduction in book value of real estate assets held for redevelopment of $17.0 million, net of tax.
Net Earnings
Consolidated net earnings, including capital gains and other items, net of tax, totalled $210.1 million ($3.19 per share) in fi scal 2007, a decrease of $86.7 million or 29.2 percent compared to last year. The decline in net earnings for fi scal 2007 compared to fi scal 2006 largely refl ects lower capital gains and other items of $89.1 million.
The modest increase in operating earnings refl ects reduced operating income from both food retailing and real estate offset by lower interest expense, income taxes and minority interest expense.
EMPIRE COMPANY LIMITED 2007 ANNUAL REPORT 37
9928_Back-Eng_Final v1a.indd 379928_Back-Eng_Final v1a.indd 37 7/27/07 9:58:03 PM7/27/07 9:58:03 PM

Fiscal 2007 Operating Performance by Division
Food Retailing
HIGHLIGHTS
Sobeys is celebrating 100 years in the food industry. Sobeys achieved fi scal 2007 sales growth of $313.9 million
or 2.5 percent and same-store sales growth of 2.4 percent. Total capital expenditures equalled $482.8 million (total
company-wide capital expenditures, which included franchisee and third party spending equalled $580.0 million).
Opened, or replaced 48 corporate and franchised stores, acquired 29 stores, expanded 24 stores and rebannered/redeveloped 49 stores.
To assess its fi nancial performance and condition, Sobeys’ management monitors a set of fi nancial measures, which evaluate sales growth, profi tability and fi nancial condition.
The primary fi nancial performance and condition measures for Sobeys are set out below.
52 Weeks Ended May 5, 2007 May 6, 2006
Same-store sales growth 2.4% 4.0%Sales growth 2.5% 5.4%Basic earnings per share growth (8.9%) 1.7%Return on equity 9.1% 10.8%Funded debt to total capital 23.7% 21.1%Funded debt to EBITDA 1.2x 0.9xCompany-wide capital expenditures (in millions) $ 580 $ 560
The table below presents sales, operating income and net earnings for Sobeys:
52 Weeks Ended 52 Weeks Ended Year over Year ($ in millions) May 5, 2007 May 6, 2006 $ Change % Change
Sales $ 13,032.0 $ 12,718.1 $ 313.9 2.5%
Operating income 300.2 331.6 (31.4) (9.5%)
Net earnings $ 173.4 $ 189.4 $ (16.0) (8.4%)
SALES
In fi scal 2007, Sobeys achieved sales of $13.0 billion, an increase of $313.9 million or 2.5 percent over fi scal 2006. During the fi scal year, same-store sales (sales from stores in the same locations in both reporting periods) increased by 2.4 percent. Same-store sales growth does not include wholesale sales.
Sales growth, for the year, was driven by Sobeys’ continued implementation of sales and merchandising initiatives across the country, coupled with an increase in retail selling square footage resulting from the development of new stores, an ongoing program to enlarge and renovate existing store assets, and by the acquisition on August 27, 2006 of ADL. This acquisition included 25 owned or franchised retail store operations, other wholesale supply agreements and a distribution facility in Rouyn-Noranda, Québec.
Store square footage increased by 4.0 percent in fi scal 2007 as a result of the opening of 77 new or replacement stores and the expansion of 24 stores. There were 38 stores closed in fi scal 2007.
Sobeys expects sales growth to continue in fi scal 2008 as a result of the ongoing capital investment in its retail store network, and continued offering, merchandising and pricing improvements across the country.
Sobeys experienced declines in its wholesale tobacco sales during fi scal 2007. Wholesale tobacco sales declined $123.9 million in fi scal 2007 compared to fi scal 2006. Sales growth was also negatively impacted by the disposition on March 31, 2006 of Sobeys’ Cash and Carry business in Ontario and Québec. Cash and Carry sales were $196.1 million in fi scal 2006. As shown in the table below, excluding the impact of the wholesale tobacco decline, the Cash and Carry disposition, and the ADL acquisition, Sobeys’ sales growth would have been 3.8 percent in fi scal 2007.
MANAGEMENT’S DISCUSSION AND ANALYSIS38
9928_Back-Eng_Final v1a.indd 389928_Back-Eng_Final v1a.indd 38 7/26/07 8:00:45 AM7/26/07 8:00:45 AM

52 Weeks Ended ($ in millions) May 5, 2007 May 6, 2006 $ Change % Change
Sobeys’ fi nancially reported sales $ 13,032.0 $ 12,718.1 $ 313.9 2.5%
Add (deduct) the impact of:
Cash and Carry disposal 196.1
Wholesale tobacco decline 123.9
ADL acquisition (151.8)
Subtotal 168.2
$ 482.1 3.8%
Business rationalization costs – Also during the third quarter of fi scal 2007, Sobeys completed a rationalization of administrative functions in Atlantic Canada. This administrativerationalization was completed following the recent successful implementation of Sobeys’ fi rst phase of the business processand system initiative. In addition to asset write-offs, in excess of 100 people were impacted by this rationalization; however, a number of these people were redeployed into Sobeys’ retail store network. Pre-tax costs of $7.9 million were incurred during the third quarter of fi scal 2007 as a result of this rationalization. Sobeys’ expectations are for full-year expense reductions in fi scal 2008 in excess of these costs.Ontario distribution network rationalization – On November 21, 2006, Sobeys announced plans to build a new distribution centre in Vaughan, Ontario. Utilizing automation technology, the new facility is expected to signifi cantly increase Sobeys’ warehouse and distribution capacity while reducing overall distribution costs and improving service to its store network and customers. During the third quarter of the fi scal year Sobeys recognized $5.3 million of severance costs associated with this rationalization. This new distribution centre, when opened in fi scal 2009, is expected to provide annual distribution cost savings in excess of the costs incurred in the third quarter and any additional business rationalization or restructuring costs incurred leading up to its opening. Québec distribution network rationalization – In the fourth quarter Sobeys completed the closure of two small facilities, one in Anjou and one in the Abitibi region of Québec. Rationalization costs related to these facilities of $5.6 million were incurred in the fourth quarter. It is expected that the annualized savings associated with this closure will be approximately $5.0 million.
As noted in previous quarters, late in the second quarter of fi scal 2007 a major Canadian tobacco supplier began to sell and distribute directly to certain Sobeys’ customers further impacting the decline in sales. This change is expected to reduce sales on an annual basis by approximately $300.0 million. Margins on tobacco sales are signifi cantly lower than on other products: the loss of these sales are not expected to have a material impact on earnings.
BUSINESS PROCESS AND SYSTEM
INITIATIVE, BUSINESS RATIONALIZATION
AND PRIVATIZATION COSTS
Included in earnings for fi scal 2007 were costs related to Sobeys’ business process and system initiative as well as business rationalization and privatization costs. In total these costs had a $51.7 million pre-tax impact on earnings ($18.6 million pre-tax in fi scal 2006).
These costs include:
Business process and system initiative costs – For the 52 weeks ended May 5, 2007, $30.3 million ($18.6 million in fi scal 2006) of pre-tax costs ($4.9 million for the 13 weeks ended May 5, 2007 and $5.3 million for the 13 weeks ended May 6, 2006) were incurred related to the business process and system initiative as outlined in “Overview of the Business”section. The business process and system initiative costs primarily include labour, implementation and training costs associated with the business process and system implementation as well as fi nal costs associated with exiting the Commisso’s banner. During the third quarter, Sobeys completed the implementation of the system in Ontario in accordance with its plans. This implementation supports all aspects of Sobeys’ Ontario business including operations, merchandising, distribution and fi nance and is an important enabler of further initiatives in Ontario including the new distribution facility in Ontario as further discussed below. Sobeys continues its work on the business process and system initiative in the Western region.
EMPIRE COMPANY LIMITED 2007 ANNUAL REPORT 39
9928_Back-Eng_Final v1a.indd 399928_Back-Eng_Final v1a.indd 39 7/27/07 10:05:53 PM7/27/07 10:05:53 PM

Privatization – On April 26, 2007, Empire and Sobeys jointly announced that they had entered into an agreement pursuant to which Empire would acquire the common shares of Sobeys, other than those owned by Empire or its subsidiaries at a price of $58.00 per share. Pre-tax costs of $2.6 million were incurred in the fourth quarter related to this transaction. Subsequent to the end of the fi scal year, on June 15, 2007, Empire completed the privatization of Sobeys (see the section titled “Subsequent Events” near the end of this MD&A).
Sobeys expects to incur additional administrative rationalization costs into the fi rst half of fi scal 2008, as a result of its continuing business process and system initiative. The dollar value of these additional costs will be quantifi ed and disclosed in the fi rst quarter of fi scal 2008.
OPERATING INCOME
Sobeys’ operating income equalled $300.2 million during fi scal 2007, a 9.5 percent decrease from last year, with an operating income margin of 2.30 percent compared to 2.61 percent in fi scal 2006. Included in fi scal 2007 operating income was an $18.7 million increase in depreciation and amortization expense,
refl ecting Sobeys’ continued capital investments. Also included in operating income are the business process and system initiative, rationalization and privatization costs outlined previously.
Sobeys will continue to focus on disciplined cost management initiatives, supply chain and retail productivity improvements and migration of best practices across its four regions to continue to fuel and fund investments to drive sales and improve margins over time.
NET EARNINGS
Sobeys’ fi scal 2007 net earnings equalled $173.4 million, a decrease of 8.4 percent compared to the $189.4 million recorded in the prior year. Empire’s 72.1 percent ownership of Sobeys contributed net earnings of $123.9 million in fi scal 2007 ($130.1 million in fi scal 2006 based on a 70.3 percent ownership interest at the end of the year).
Sobeys’ net earnings for the 52-week period ended May 5, 2007 included the increased depreciation and amortization expense, and the business process and system initiative costs as well as the business rationalization and privatization costs referred to above.
Despite growth in revenue, operating income declined as a result of Sobeys’ continuing investment in its stores, business processes and systems and rationalization as well as privatization costs.
FOOD RETAILING OPERATING INCOME $ IN MILLIONS
FISCAL YEAR 03 04 05 06 07
80
160
240
320
300.2
MANAGEMENT’S DISCUSSION AND ANALYSIS40
9928_Back-Eng_Final v1a.indd 409928_Back-Eng_Final v1a.indd 40 7/27/07 10:05:54 PM7/27/07 10:05:54 PM

Real Estate
HIGHLIGHTS
A record year for residential operations with growth in operating income contribution of $19.9 million or 38.8 percent.
A 49.0 percent total investment return from Crombie REIT since the initial public offering in March 2006.
Appointed Donald Clow as President of ECL Developments with a mandate to become the developer of choice for Crombie REIT with Sobeys as a key tenant.
Completed the Martello condominium project.
Real estate management assesses its fi nancial performance and condition through monitoring of key fi nancial measures. The primary fi nancial performance and condition measures are set out below.
52 Weeks Ended May 5, 2007 May 6, 2006
Total square footage (in millions) 5.7 5.9Occupancy 92.9% 93.2%Funds from operations ($ in millions) $ 74.6 $ 76.5 Return on equity 17.5% 17.3% *Funded debt to total capital 39.8% 41.9%
*Excluding gain on the sale of properties to Crombie REIT.
The table below presents revenue, operating income, net earnings and funds from operations for the real estate division’s commercial operations and residential operations.
52 Weeks Ended ($ in millions) May 5, 2007 May 6, 2006 $ Change % Change
REVENUE
Commercial $ 72.7 $ 191.8 $ (119.1) (62.1%)Residential 146.1 84.9 61.2 72.1%
218.8 276.7 (57.9) (20.9%)Inter-segment (34.3) (54.0) 19.7 (36.5%)
$ 184.5 $ 222.7 $ (38.2) (17.2%)
OPERATING INCOME
Commercial $ 46.8 $ 87.0 $ (40.2) (46.2%)Residential 71.2 51.3 19.9 38.8%
$ 118.0 $ 138.3 $ (20.3) (14.7%)
NET EARNINGS
Commercial (1) $ 21.0 $ 85.8 $ (64.8) (75.5%)Residential 46.8 32.9 13.9 42.2%
$ 67.8 $ 118.7 $ (50.9) (42.9%)
FUNDS FROM OPERATIONS
Commercial $ 26.8 $ 43.2 $ (16.4) (38.0%)Residential 47.8 33.3 14.5 43.5%
$ 74.6 $ 76.5 $ (1.9) (2.5%)
(1) There were no net capital gains in net earnings for fi scal 2007 compared to $59.1 million last fi scal year.
EMPIRE COMPANY LIMITED 2007 ANNUAL REPORT 41
9928_Back-Eng_Final v1a.indd 419928_Back-Eng_Final v1a.indd 41 7/26/07 8:00:46 AM7/26/07 8:00:46 AM

properties to Crombie REIT in March 2006 which accounted for approximately $39.1 million of the decline. The residential operating income increase in fi scal 2007 refl ects the continued strength in the Western housing market.
NET EARNINGS
Real estate division net earnings contribution in fi scal 2007 amounted to $67.8 million compared to $118.7 million last year, a $50.9 million or 42.9 percent decrease. The earnings decline largely refl ects the $20.3 million reduction in operating income as discussed and a decrease in capital gains, net of tax, of $59.1 million, partially offset by a $23.3 million reduction in interest expense due to lower long-term debt levels as a result of the sale of 44 commercial properties to Crombie REIT and lower income tax expense of $5.2 million.
FUNDS FROM OPERATIONS
Funds from real estate operations in fi scal 2007 of $74.6 million decreased $1.9 million or 2.5 percent compared to last year as a result of a decrease in commercial funds from operations of $16.4 million due to lower operating earnings, partially offset by higher residential funds from operations of $14.5 million due to higher operating earnings.
REVENUE
Real estate division revenues (net of inter-segment amounts) during fi scal 2007 declined $38.2 million or 17.2 percent compared to the previous fi scal year. Commercial property revenue declined $99.4 million. This revenue decline was expected given the sale of 44 commercial properties to Crombie REIT, which accounted for approximately $116.7 million of revenue last fi scal year. Revenue from residential operations equalled $146.1 million in fi scal 2007 compared to $84.9 million last year, a $61.2 million or 72.1 percent increase. This increase is primarily attributed to higher Genstar revenue. Management continues to caution that the pace of growth experienced in residential lot sales is not sustainable over the long-term, but does expect continued strength in the Alberta market over the next several months.
OPERATING INCOME
During fi scal 2007, real estate division operating income declined $20.3 million or 14.7 percent compared to last year as the result of a $40.2 million decline in commercial operating income partially offset by a $19.9 million increase in residential operating income. The commercial operating income decline was anticipated and is primarily attributed to the sale of 44 commercial
Real estate division performance refl ects the impact of the sale of 44 commercial properties to Crombie REIT partially offset by improved residential performance.
MANAGEMENT’S DISCUSSION AND ANALYSIS42
9928_Back-Eng_Final v1a.indd 429928_Back-Eng_Final v1a.indd 42 7/26/07 8:00:46 AM7/26/07 8:00:46 AM

Investments & Other Operations
HIGHLIGHTS
A $27.4 million or 22.3 percent increase in revenue. A $5.3 million or 21.5 percent increase in investment income. A $0.6 million or 2.8 percent increase in operating income. Capital gains of $6.2 million generated on the sale
of investments. Four year annualized return performance for Empire’s
portfolio was 27.3 percent compared to a 22.4 percent for the S&P/TSX Composite Index and a 9.0 percent total return for the S&P 500 Index, in Canadian dollars.
Subsequent to year-end, the investment portfolio, excluding Wajax, was sold for proceeds of $288 million, resulting in a net capital gain of $101.4 million.
INVESTMENT VALUE
At the end of fi scal 2007, Empire’s total investments, excluding its investment in Genstar U.S. investments and in Crombie REIT, carried a market value of $441.2 million on a cost base of $221.9 million, resulting in an unrealized gain of $219.3 million (2006 – $214.3 million).
The table below presents a reconciliation of the consolidated balance sheet investments, both equity and cost, to those related to the investment and other operations division:
May 5, 2007 May 6, 2006
Market Cost Unrealized Market Cost Unrealized(in millions) Value Value Gain Value Value Gain
Investments, at cost $ 283.1 $ 189.7 $ 93.4 $ 398.9 $ 359.9 $ 39.0
Investments, at equity 434.0 142.8 291.2 425.3 157.5 267.8
Less: Crombie REIT 278.1 109.3 168.8 220.7 112.8 107.9
Less: Genstar U.S. (1) 1.3 1.3 – 11.6 11.6 –
Plus: Hedge value 3.5 – 3.5 15.4 – 15.4
$ 441.2 $ 221.9 $ 219.3 $ 607.3 $ 393.0 $ 214.3
(1) Assumes market value equals book value.
During fi scal 2007 there was a realized capital gain on the sale of investments equal to $6.2 million compared to an $11.6 million capital gain last year. The Company sold a signifi cant portion of its U.S. equity investments during the year due to perceived market risk and used the proceeds to reduce bank indebtedness. The total unrealized gain position at the end of fi scal 2007 was $219.3 compared to $214.3 million at the end of fi scal 2006.
Realized capital gain for fi scal 2007, plus unrealized capital gain, combined to equal $225.5 million at the end of the year. This compares to a total realized gain on investment sales plus
capital gains at the end of fi scal 2006 equal to $225.9 million. The decrease in the realized plus unrealized gain position of $0.4 million since the end of fi scal 2006 is largely the result of a decrease in the valuation of Wajax which was largely offset by an increase in valuations of other investments.
Subsequent to year-end the investment portfolio, with the exception of Wajax, was sold for proceeds of approximately $288 million. For further details, please see the section entitled “Subsequent Events” in this MD&A.
EMPIRE COMPANY LIMITED 2007 ANNUAL REPORT 43
9928_Back-Eng_Final v1a.indd 439928_Back-Eng_Final v1a.indd 43 7/26/07 8:00:46 AM7/26/07 8:00:46 AM

Empire’s direct debt matched to the investment portfolio as of May 5, 2007 was $6.5 million, representing approximately 1.5 percent of the investment portfolio’s market value, including the hedge value. Management considers a ratio of debt to investment value of no greater than 35 percent as prudent.
INVESTMENT RETURN
The table below presents the total return performance for Empire’s investments (excluding the 48.1 percent interest in Crombie REIT) relative to Canadian and U.S. equity benchmark returns on an annualized one through four-year basis for periods ended March 31, 2007.
PORTFOLIO COMPOSITION
At May 5, 2007, Empire’s investment portfolio (excluding cash) consisted of:
Unrealized Gain (Loss)
Market % of May 5, May 6, May 7,($ in millions Cdn.) Value Total Cost 2007 2006 2005
Canadian equities $ 237.1 53.8% $ 144.9 $ 92.2 $ 68.8 $ 51.4
Wajax 154.6 35.0% 32.2 122.4 159.9 89.5
U.S. equities 44.5 10.1% 43.3 1.2 (29.8) (1.3)
Preferred shares & other 1.5 0.3% 1.5 – – –
Hedge value(1) 3.5 0.8% – 3.5 15.4 5.2
Total $ 441.2 100.0% $ 221.9 $ 219.3 $ 214.3 $ 144.8
(1) The hedge value of $3.5 million is based on the $1.0 million mark-to-market position of $31 million CAD in currency forwards carrying an average forward foreign exchange rate of $1.1377 CAD/USD plus $2.5 million in deferred foreign currency gains on the repayment of U.S. dollar loans.
EMPIRE INVESTMENT PORTFOLIO TOTAL RETURN
For Periods Ending March 31, 2007 One Two Three FourAnnualized Returns Year Years Years Years
Empire Portfolio 1.1% 12.6% 17.2% 27.3%
Median Manager 11.4% 17.6% 15.3% 19.5%
S&P/TSX Index 11.4% 19.6% 17.7% 22.4%
S&P 500 Index in (C$) 10.5% 9.1% 5.4% 9.0%
The total return on the Empire investment portfolio, as indepen-dently benchmarked against the performance of over 100 equity fund managers, has been ranked as fi rst quartile (fi rst quartile means the top 25 percent of surveyed equity fund managers) investment return performance over the three and four-year trailing periods ended March 31, 2007. Total return performance was relatively weak for the one-year period ended March 31, 2007 at 1.1 percent (fourth quartile), as a result of a decrease in the market price per unit of Wajax over this period of 14.0 percent. Wajax represented approximately one-third of the average portfolio value during fi scal 2007. The value of Wajax units was impacted by the announcement on October 31, 2006 made by the Government of Canada regarding the “Tax Fairness Plan”, which intends to impose a tax on distributions from publicly traded income trusts and limited partnerships.
HEDGING INVESTMENT CURRENCY RISK
At May 5, 2007, Empire had hedged approximately 70.0 percent of the market value of its U.S. based common equity investments by way of $31 million CAD of forward currency contracts. The average foreign exchange rate associated with these U.S. forward currency contracts is $1.1377. The fair value of the hedge was $1.0 million at the end of the fourth quarter.
The forward currency contracts replaced U.S. dollar borrowings which were repaid with a portion of the net cash proceeds from the closing of the Crombie REIT initial public offering on March 23, 2006. The repayment of the U.S. based borrowings resulted in a deferred hedge gain of $10.2 million which will be realized on the eventual disposition of the underlying U.S. dollar portfolio investments. In fi scal 2007, $7.7 million of this deferred gain had been recognized, resulting in a deferred hedge gain of $2.5 million at the end of fi scal 2007.
MANAGEMENT’S DISCUSSION AND ANALYSIS44
9928_Back-Eng_Final v1a.indd 449928_Back-Eng_Final v1a.indd 44 7/26/07 8:00:47 AM7/26/07 8:00:47 AM

REVENUE
Investments and other operations’ revenue, primarily generated by Empire Theatres, equalled $150.2 million for fi scal 2007 versus $122.8 million last year. There are 48 weeks of revenue included in fi scal 2007 compared to 52 weeks last year from Empire Theatres as a result of the change in Empire Theatres’ year-end date. Fiscal 2006 included approximately 30 weeks of sales related to those newly acquired theatres in September 2006 compared to 48 weeks in fi scal 2007, which resulted in a net $22.8 million increase in revenue, as previously mentioned.
INVESTMENT INCOME
Investment income (excluding equity earnings from Crombie REIT and Genstar’s U.S. investments) equalled $29.9 million in fi scal 2007, an increase of $5.3 million over the $24.6 million recorded last year. The increase is the result of dividend income that was $1.4 million higher than last year and equity earnings from Wajax being $3.9 million higher than last year.
OPERATING EARNINGS
Investment (net of corporate expenses) and other operations’ operating earnings equalled $12.7 million in fi scal 2007, consistent with last year. This was the result of lower interest expense, higher equity earnings contribution from Wajax and higher dividend income, partially offset by higher income taxes.
Empire’s non-consolidated bank loans totalled $6.5 million at the end of fi scal 2007 versus $71.2 million at the beginning of the fi scal year, and $25.2 million at the end of the third quarter this year. Cash proceeds from investments sales in the third quarter were used in part to reduce bank loans.
CAPITAL GAINS AND OTHER ITEMS
Capital gains, net of tax, realized from investment sales in fi scal 2007 amounted to $5.7 million compared to $35.3 million last year. The bulk of the capital gains, net of tax, for fi scal 2007 relates to the sale of common equity investments. The bulk of the net capital gains in the last fi scal year resulted from the sale of 2.875 million units of Wajax in the fi rst quarter, with Empire retaining 4,577,994 units of Wajax.
NET EARNINGS
Investments (net of corporate expenses) and other operations contributed $18.4 million to Empire’s consolidated fi scal 2007 net earnings compared to a $48.0 million net earnings contribution last year. The decrease is primarily the result of lower realized investment capital gains, net of tax, during the year.
The table below presents investments and other operations’ fi nancial highlights for the 52 weeks ended May 5, 2007 compared to the same period last year.
52 Weeks Ended ($ in millions) May 5, 2007 May 6, 2006 Year over Year Increase (Decrease)
Revenue $ 150.2 $ 122.8 $ 27.4 22.3%
Investment income 29.9 24.6 5.3 21.5%
Operating earnings 12.7 12.7 – 0.0%Capital gains and other items, net of tax 5.7 35.3 (29.6) (83.9%)
Net earnings $ 18.4 $ 48.0 $ (29.6) (61.7%)
With the change in the year-end date for Empire Theatres, fi scal 2006 includes 52 weeks of sales, including 30 weeks of revenue from newly acquired theatres, compared to 48 weeks of sales in fi scal 2007.
EMPIRE COMPANY LIMITED 2007 ANNUAL REPORT 45
9928_Back-Eng_Final v1a.indd 459928_Back-Eng_Final v1a.indd 45 7/26/07 8:00:47 AM7/26/07 8:00:47 AM

Quarterly Results of Operations
The following table is a summary of selected fi nancial information from the Company’s consolidated fi nancial statements (unaudited) for each of the eight most recently completed quarters.
Results by Quarter
Fiscal 2007 Fiscal 2006 (1)
Q4 Q3 Q2 Q1 Q4 Q3 Q2 Q1 (13 Weeks) (13 weeks) (13 weeks) (13 weeks) (13 weeks) (13 weeks) (13 weeks) (13 weeks)($ in millions, except May 5, Feb. 3, Nov. 4, Aug. 5, May 6, Feb. 4, Nov. 5, Aug. 6,per share information) 2007 2007 2006 2006 2006 2006 2005 2005
Revenue $ 3,350.4 $ 3,281.9 $ 3,353.4 $ 3,381.0 $ 3,226.6 $ 3,235.2 $ 3,263.7 $ 3,338.1
Operating income 123.2 79.7 116.2 121.2 130.9 118.3 122.1 120.1
Operating earnings(2) 63.8 36.1 51.2 53.3 56.9 47.7 47.8 49.6
Capital gains (losses) and
other items, net of tax 0.7 (1.0) 6.0 – 61.5 8.3 0.8 24.2
Net earnings $ 64.5 $ 35.1 $ 57.2 $ 53.3 $ 118.4 $ 56.0 $ 48.6 $ 73.8
PER SHARE
INFORMATION, DILUTED
Operating earnings $ 0.97 $ 0.54 $ 0.78 $ 0.81 $ 0.87 $ 0.72 $ 0.73 $ 0.75
Capital gains (losses) and
other items, net of tax 0.01 (0.01) 0.09 – 0.93 0.13 0.01 0.37
Net earnings $ 0.98 $ 0.53 $ 0.87 $ 0.81 $ 1.80 $ 0.85 $ 0.74 $ 1.12
Diluted weighted average
number of shares
outstanding (in millions) 65.7 65.7 65.7 65.7 65.7 65.7 65.7 65.7
(1) All quarters prior to the fi rst quarter of fi scal 2007 have been restated to refl ect retroactive adjustments related to EIC-156. Please see the section entitled “EIC-156” in this MD&A.
(2) Operating earnings is net earnings before capital gains (losses) and other items, net of tax.
Revenue and operating earnings growth have been infl uenced by the Company’s investing activities, the competitive environment, general industry trends and by other risk factors as outlined in this MD&A.
MANAGEMENT’S DISCUSSION AND ANALYSIS46
9928_Back-Eng_Final v1a.indd 469928_Back-Eng_Final v1a.indd 46 7/26/07 8:00:48 AM7/26/07 8:00:48 AM

Fourth Quarter Results
SUMMARY TABLE OF CONSOLIDATED FINANCIAL RESULTS FOR THE FOURTH QUARTER
($ in millions, 13 Weeks Ended % of 13 Weeks Ended % of except per share information) May 5, 2007 Revenue May 6, 2006 Revenue
Consolidated revenue $ 3,350.4 100.00% $ 3,226.6 100.00%
Operating income 123.2 3.68% 130.9 4.06%
Operating earnings 63.8 1.91% 56.9 1.76%
Capital gains and other items, net of tax 0.7 0.02% 61.5 1.91%
Net earnings $ 64.5 1.93% $ 118.4 3.67%
BASIC EARNINGS PER SHARE
Operating earnings $ 0.97 $ 0.87
Capital gains and other items, net of tax 0.01 0.94
Net earnings $ 0.98 $ 1.81
Basic weighted average number of
shares outstanding (in millions) 65.6 65.5
DILUTED EARNINGS PER SHARE
Operating earnings $ 0.97 $ 0.87
Capital gains and other items, net of tax 0.01 0.93
Net earnings $ 0.98 $ 1.80
Diluted weighted average number of
shares outstanding (in millions) 65.7 65.7
The following is a review of fi nancial performance for the 13-week period ended May 5, 2007 compared to the 13-week period ended May 6, 2006.
REVENUE
Revenue for the fourth quarter was $3.35 billion compared to $3.23 billion last year, a $123.8 million or 3.8 percent increase.As shown in the following table, excluding the quarterly impact of: the sale of the Sobeys’ Cash and Carry business, the sale of 44 properties to Crombie REIT, the decline in wholesale tobacco sales and the ADL acquisition, revenue growth would have been 5.4 percent for the fourth quarter.
13 Weeks Ended ($ in millions) May 5, 2007 May 6, 2006 $ Change % Change
Financially reported sales $ 3,350.4 $ 3,226.6 $ 123.8 3.8%
Add (deduct) the impact of:
Cash and Carry disposal 26.4
Wholesale tobacco decline 37.5
ADL acquisition (41.5)
Sale of 44 commercial properties to Crombie REIT 27.5
Subtotal 49.9
$ 173.7 5.4%
EMPIRE COMPANY LIMITED 2007 ANNUAL REPORT 47
9928_Back-Eng_Final v1a.indd 479928_Back-Eng_Final v1a.indd 47 7/26/07 8:00:48 AM7/26/07 8:00:48 AM

Food retailing division revenue increased by $117.9 million or 3.8 percent compared to the fourth quarter of fi scal 2006. Same-store sales increased 2.3 percent during the fourth quarterof fi scal 2007. The growth in retail sales was a direct result of the continued implementation of sales and merchandising initiatives across Sobeys, and the ongoing fi nancial commitment to upgrade and renovate existing store assets. As outlined above the decline in wholesale tobacco sales and the disposition of Sobeys’ Cash and Carry business in Ontario and Québec had a negative impact on fourth quarter sales, however this was offset in part by the ADL acquisition. Excluding the impact of the tobacco decline, the impact of the Cash and Carry disposition, and the ADL acquisition, Sobeys’ sales growth would have been 4.5 percent on a comparable 13-week basis.
Real estate operations reported fourth quarter revenues (net of inter-company elimination) of $66.0 million, an increase of $1.8 million or 2.8 percent over the fourth quarter last year. Commercial property revenue declined by $23.9 million or 72.2 percent while revenue from residential operations increased by $25.7 million or 82.6 percent. The decline in commercial property revenues was expected, resulting primarily from the sale of 44 properties to Crombie REIT nine days prior to the end of the fourth quarter last year. The increase in residential revenue from Genstar was the result of exceptionally strong lot sales, particularly in the Calgary and Edmonton, Alberta markets.
Revenue from investments and other operations in the fourth quarter equalled $40.7 million, an increase of $4.1 million or 11.2 percent over the fourth quarter last year. This is primarily related to higher revenue contributions from both Empire Theatres and Kepec.
OPERATING INCOME
Consolidated operating income in the fourth quarter of fi scal 2007 totalled $123.2 million compared to $130.9 million in the fourth quarter last year, a decrease of $7.7 million or 5.9 percent. The decrease in operating income is the result of an $11.0 million or 12.9 percent decline in operating income contribution from the food division, partially offset by an increase in real estate division operating income of $5.4 million or 13.3 percent.
Included in operating income for the fourth quarter are $13.1 million of pre-tax costs incurred by Sobeys related to its business process and system initiative, warehouse closure costs in Québec and privatization costs. Sobeys incurred $5.3 million of pre-tax costs related to its business process and system initiative in the fourth quarter last year.
Residential real estate operating income of $34.6 million increased $17.6 million compared to the fourth quarter last year, refl ecting the development and timing of land parcel and lot sales during the quarter. Commercial real estate operating income of $11.5 million declined $12.2 million from the same quarter last year, largely the result of the sale of 44 properties to Crombie REIT in the fourth quarter last year.
INTEREST EXPENSE
The $4.7 million decrease in fourth quarter consolidated interest expense compared to the same quarter last year is primarily due to a $3.7 million reduction in long-term interest expense. This is primarily related to the decrease in real estate long-term debt as a result of the sale of commercial property to Crombie REIT in the fourth quarter last year, as previously discussed.
INCOME TAXES
The effective income tax rate for the fourth quarter was 30.3 percent versus 32.9 percent in the fourth quarter last year. The main reason for this decrease in the tax rate is due to a reduction in the Canadian federal and certain provincial statutory income tax rates and the application of those lower rates to future tax balances, related to the real estate operations.
MINORITY INTEREST
In the fourth quarter of fi scal 2007, Empire recorded minority interest expense of $13.9 million compared to $18.9 million in the fourth quarter last year. The decrease of $5.0 million in minority interest is primarily the result of lower Sobeys’ earnings as well as an increase in Empire’s ownership in Sobeys from 70.3 percent at May 6, 2006 to 72.1 percent at May 5, 2007.
OPERATING EARNINGS
The $6.9 million or 12.1 percent increase in operating earnings (earnings before capital gains and other items) over the prior year was the result of the $7.7 million reduction in operating income more than offset by the $4.7 million reduction in interest expense, the $4.9 million reduction in income taxes and the $5.0 million reduction in minority interest, as discussed.
CAPITAL GAINS AND OTHER ITEMS
The Company generated capital gains and other items, net of tax, of $0.7 million in the fourth quarter compared to $61.5 million last year. The fourth quarter of fi scal 2006 included the gains from the sale of properties to Crombie REIT.
NET EARNINGS
Consolidated net earnings, including capital gains and other items, net of tax, totalled $64.5 million ($0.98 per share) in the fourth quarter, a decrease of $53.9 million or 45.5 percent over the fourth quarter last year.
MANAGEMENT’S DISCUSSION AND ANALYSIS48
9928_Back-Eng_Final v1a.indd 489928_Back-Eng_Final v1a.indd 48 7/27/07 10:18:11 PM7/27/07 10:18:11 PM

Total Non-Voting Class A and Class B common shares outstand-ing at May 5, 2007 equalled 65,734,800, slightly lower than the previous fi scal year-end, May 6, 2006. There were 31,174,037 Non-Voting Class A and 34,560,763 Class B common shares outstanding at May 5, 2007. Empire had no options outstanding at May 5, 2007 compared to 27,674 options outstanding at May 6, 2006. There were 27,674 options exercised during the
second quarter of fi scal 2007. During the third quarter of fi scal 2007 the Company purchased for cancellation 31,900 Series 2 Preferred shares for $0.8 million; no preferred shares were purchased in fi scal 2006. The Company plans to purchase for cancellation an additional 100,000 Series 2 Preferred shares by the end of calendar 2007.
Financial Condition
Capital Structure and Key Financial Condition Measures
The Company’s fi nancial condition at the end of fi scal 2007 remained healthy as indicated by the following fi nancial condition measures.
($ in millions, except per share and ratio calculations) May 5, 2007 May 6, 2006 May 7, 2005
Shareholders’ equity $ 2,135.4 $ 1,965.2 $ 1,709.0
Book value per share 32.37 29.77 25.87
Minority interest 590.2 585.4 556.3
Bank indebtedness 30.1 98.6 219.4
Long-term debt, including current portion(1) 881.9 809.8 974.4
Funded debt to total capital 29.9% 31.6% 41.1%
Net debt to capital ratio(2) 22.4% 22.4% 34.8%
Adjusted debt to total capital(3) 48.1% 50.4% 53.5%
Debt to EBITDA 1.42x 1.33x 1.85x
Interest coverage 7.33x 5.86x 5.35x
Total assets $ 5,224.9 $ 5,051.5 $ 4,929.2
(1) Includes liabilities related to assets held for sale.(2) Net debt to total capital reduces funded debt by cash and cash equivalents.(3) Adjusted debt includes capitalization of lease obligations based on six times net annual lease payments (gross lease payments net of expected
sub-lease income).
Empire’s fi nancial condition continued to strengthen as evidenced by the improvement in interest coverage, a reduction in funded debt to total capital and an increase in the book value per share.
Shareholders’ Equity
Book value per common share was $32.37 at May 5, 2007, compared to $29.77 at May 6, 2006 and $25.87 at May 7, 2005. The increase in book value largely refl ects the Company’s earnings growth.
The Company’s share capital on May 5, 2007 consisted of:
Issued and Authorized Outstanding
Number of Shares Number of Shares
Preferred shares, par value $25 each, issuable in series 2,814,100 300,0002002 Preferred shares par value $25 each, issuable in series 992,000,000 –Non-Voting Class A shares, without par value 259,107,435 31,174,037Class B common shares, without par value, voting 40,800,000 34,560,763
EMPIRE COMPANY LIMITED 2007 ANNUAL REPORT 49
9928_Back-Eng_Final v1a.indd 499928_Back-Eng_Final v1a.indd 49 7/26/07 8:00:48 AM7/26/07 8:00:48 AM

Empire has a policy of repurchasing enough Non-Voting Class A shares to offset the dilutive effect of shares issued to fulfi ll the Company’s obligation under its stock option and share purchase plans. During fi scal 2007, Empire purchased 46,047 Non-Voting Class A shares for cancellation versus 20,254 shares purchased for cancellation in fi scal 2006.
On July 26, 2006, Empire fi led a Notice of Intention to make a Normal Course Issuer Bid with the Toronto Stock Exchange to purchase for cancellation up to 623,200 shares representing approximately 2.0 percent of the issued and outstanding Non-Voting Class A shares. The Board of Directors and senior management of Empire are of the opinion that from time to time the purchase of Class A Non-Voting shares at the prevailing market prices is a worthwhile use of funds and in the best
interests of Empire and its shareholders. The Normal Course Issuer Bid expires on July 27, 2007. The Company intends to renew its Normal Course Issuer Bid.
As at June 28, 2007, the Company had total Non-Voting Class A and Class B common shares outstanding of 31,174,037 and 34,560,763 respectively.
Dividends paid to Non-Voting Class A and Class B common shareholders amounted to $39.5 million in fi scal 2007 ($0.60 per share) versus $36.7 million ($0.56 per share) in fi scal 2006. Subsequent to fi scal year-end, on June 28, 2007, the Company announced an increase in the dividend rate to $0.66 per share annually.
Long-term debt ($ in millions) May 5, 2007 May 6, 2006 May 7, 2005
Food retailing $ 612.7 $ 490.0 $ 457.8
Real estate 228.1 261.0 512.2
Investments and other operations 41.1 58.8 4.4
Total $ 881.9 $ 809.8 $ 974.4
On October 6, 2006, Sobeys issued a $125.0 million Series E MTN with a maturity date of October 6, 2036 (30 years) and a coupon rate of 5.79 percent, the proceeds of which were used for general corporate purposes.
Since last fi scal year-end, the consolidated funded debt to total capital ratio has decreased 1.7 percentage points to 29.9 percent as higher debt levels were more than offset by growth in total capital.
Interest coverage in fi scal 2007 was 7.3 times, an increase from the 5.9 times reported for the fi scal year ended May 6, 2006. The increase in the interest coverage ratio relative to the prior year is the result of lower interest expense.
Empire and its subsidiaries have provided covenants to its lenders in support of various fi nancing facilities. All covenants were complied with for the 52 weeks ended May 5, 2007 and for fi scal 2006.
Liabilities
Historically, Empire has fi nanced a signifi cant portion of its assets through the use of bank indebtedness and long-term debt. Longer-term assets are generally fi nanced with fi xed rate, long-term debt, thereby reducing both interest rate and refi nancing risk. Total fi xed rate, long-term debt (including the current portion of long-term debt) at May 5, 2007 was $700.9 million, representing 76.8 percent of Empire’s total funded debt of $912.0 million. Funded debt has increased $3.6 million from the previous fi scal year, May 6, 2006 ($908.4 million). The increase over fi scal 2006 is primarily the result of the $125 million MTN issued by Sobeys in the second quarter of fi scal 2007, partially offset by reductions in indebtedness matched to investment and other operations of
$78.4 million and real estate of $40.7 million. The reduction in investment and other operations indebtedness is the result of proceeds on investment sales being used to reduce the short-term debt levels, while the real estate reduction relates to payments to Crombie REIT in connection with commitments for capital expenditures, rental income subsidies, interest rate subsidies and tax subsidies as detailed in various commercial agreements between ECL and Crombie REIT.
The majority of Empire’s funded debt is long-term in nature. The long-term debt, excluding bank indebtedness, is segmented by division as follows:
MANAGEMENT’S DISCUSSION AND ANALYSIS50
9928_Back-Eng_Final v1a.indd 509928_Back-Eng_Final v1a.indd 50 7/26/07 8:00:48 AM7/26/07 8:00:48 AM

Financial Instruments
Empire utilizes interest rate instruments from time to time to prudently manage its exposure to interest rate volatility and also to fi x future long-term debt maturities that are expected to be refi nanced. At May 5, 2007, there were no interest rate hedges in place by Empire directly or with any of its operating companies,other than Empire Theatres. Empire Theatres entered into two interest rate swaps on December 27, 2006, which fi xed the interest rate on $20.0 million of the fl oating rate debt at 4.28 percent plus a stamping fee, for a fi ve-year term. These swaps fi xed the interest rate on approximately 40 percent of Empire Theatres’ total indebtedness, all of which is borrowed at fl oating rates.
To mitigate the currency risk associated with the Company’s U.S. dollar investments, including its investment in Genstar U.S., Empire entered into and designated $31.0 million CAD dollar forward currency contracts with staggered maturities to act as a hedge against the effect of a stronger Canadian dollar
relative to the U.S. dollar. The fair value of these currency forwards at May 5, 2007 was positive $0.9 million U.S. Approximately 70 percent of the market value of U.S. dollar common equities in the Empire investment portfolio was hedged at an average foreign exchange rate of $1.1377. These forward exchange contracts have variable maturities over the next year and were wound-up subsequent to year-end.
The Company also uses forward contracts to fi x the exchange rate on some of its expected requirements for Euros and U.S. dollars. Amounts received or paid related to instruments used to hedge foreign exchange, including any gains and losses, are recognized in the cost of purchases. The fair value of these contracts at year-end was $0.9 million.
Empire and its subsidiaries utilize hedging instruments as deemed appropriate to mitigate risk exposure, not for speculative purposes.
Empire’s fi nancial condition remained healthy in almost every fi nancial metric.
EMPIRE COMPANY LIMITED 2007 ANNUAL REPORT 51
9928_Back-Eng_Final v1a.indd 519928_Back-Eng_Final v1a.indd 51 7/26/07 8:00:49 AM7/26/07 8:00:49 AM

Empire’s liquidity remained strong at May 5, 2007 as a result of the following sources of liquidity:
Cash and cash equivalents on hand; Unutilized bank credit facilities; Availability of long-term debt fi nancing; Empire’s portfolio of liquid investments; and Cash generated from operating activities.
At May 5, 2007, cash and cash equivalents equalled $294.9 million versus $341.1 million at May 6, 2006.
At the end of fi scal 2007, on a non-consolidated basis, Empire maintained authorized bank lines for operating, general and corporate purposes of $325.0 million, of which $6.5 million or 2.0 percent was utilized. On a consolidated basis, Empire’s
authorized bank credit facilities exceeded borrowings by $661.0 million at May 5, 2007, versus $626.4 million at May 6, 2006.
Subsequent to fi scal year-end, on June 15, 2007, Empire purchased all of the outstanding common shares of Sobeys that it did not then own for a total consideration of approximately $1.06 billion. Please see the section titled “Subsequent Events” for more details.
The Company anticipates that its capital resources will meet its fi nancial and liquidity requirements over the next year, includingcapital expenditures, dividends and scheduled debt repayments.
The following table highlights major cash fl ow components for the 13 weeks and 52 weeks ended May 5, 2007 compared to the 13 weeks and 52 weeks ended May 6, 2006.
Liquidity and Capital Resources
MAJOR CASH FLOW COMPONENTS
13 Weeks Ended 13 Weeks Ended 52 Weeks Ended 52 Weeks Ended($ in millions) May 5, 2007 May 6, 2006 May 5, 2007 May 6, 2006
Earnings for common shareholders $ 64.4 $ 118.3 $ 209.7 $ 296.5
Items not affecting cash 127.2 45.1 387.5 254.4
191.6 163.4 597.2 550.9
Net change in non-cash working capital 90.3 168.3 (147.8) 75.7
Cash fl ows from operating activities 281.9 331.7 449.4 626.6
Cash fl ows used in investing activities (154.8) (19.9) (435.4) (472.9)
Cash fl ows used in fi nancing activities (35.6) (136.3) (60.2) (94.3)
Increase (decrease) in cash and cash equivalents $ 91.5 $ 175.5 $ (46.2) $ 59.4
Operating Activities
Fourth quarter cash fl ows from operating activities equalled $281.9 million compared to $331.7 million in the comparable period last year. The decline of $49.8 million is largely attributed to a decrease in the net change in non-cash working capital of $78.0 million, and by a decrease in net earnings available for common shareholders of $53.9 million as discussed, partially offset by an increase in items not affecting cash of $82.1 million. The decrease in earnings for common shareholders is primarily the result of the $76.2 million gain last year associated with the sale of properties to Crombie REIT.
In fi scal 2007, operating activities generated cash fl ow of $449.4 million compared to $626.6 million last year. After adjusting for the one-time gain on the sale of Wajax units of $23.5 million and the gain on the sale of property to Crombie REIT of $76.2 million in fi scal 2006, earnings for common shareholders increased $13.0 million and items not affecting cash, primarily Sobeys’ rationalization costs and depreciation and amortization, increased $33.4 million, partially offset by reduced minority interest. Non-cash working capital decreased $223.5 million, resulting in a $177.2 million decrease in cash fl ows from operating activities for the 52 weeks ended May 5, 2007.
MANAGEMENT’S DISCUSSION AND ANALYSIS52
9928_Back-Eng_Final v1a.indd 529928_Back-Eng_Final v1a.indd 52 7/26/07 8:00:49 AM7/26/07 8:00:49 AM
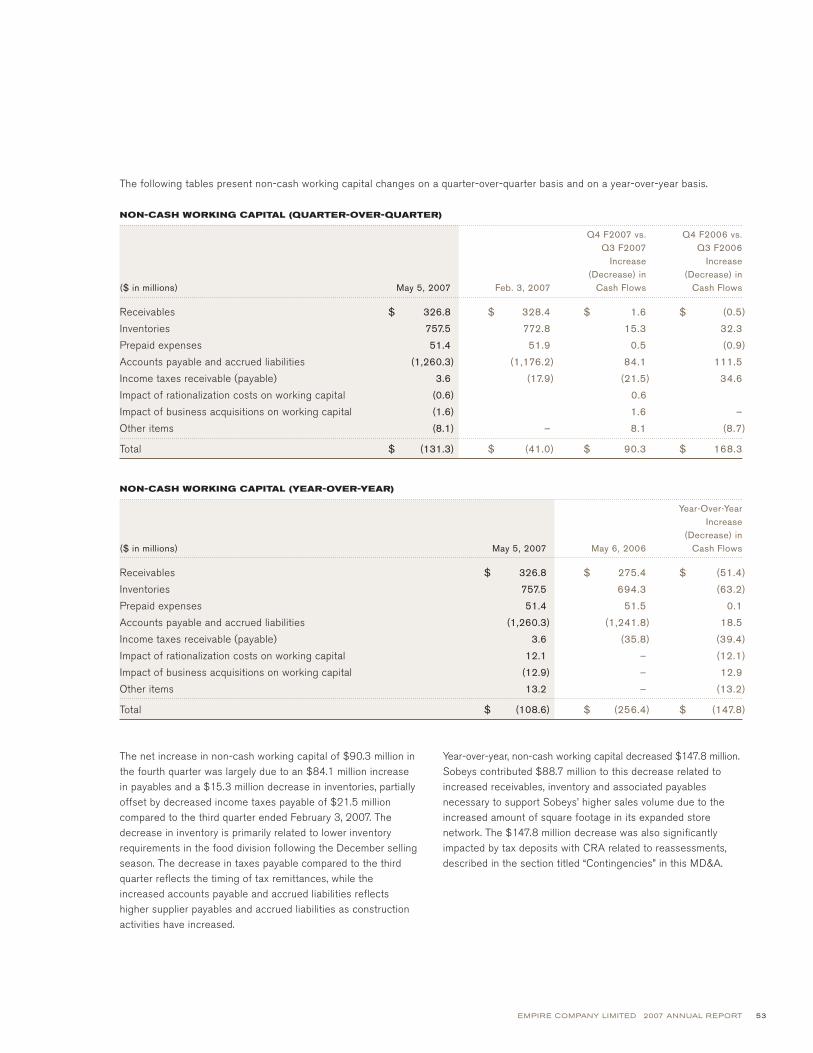
The following tables present non-cash working capital changes on a quarter-over-quarter basis and on a year-over-year basis.
NON-CASH WORKING CAPITAL (QUARTER-OVER-QUARTER)
Q4 F2007 vs. Q4 F2006 vs. Q3 F2007 Q3 F2006 Increase Increase (Decrease) in (Decrease) in
($ in millions) May 5, 2007 Feb. 3, 2007 Cash Flows Cash Flows
Receivables $ 326.8 $ 328.4 $ 1.6 $ (0.5)
Inventories 757.5 772.8 15.3 32.3
Prepaid expenses 51.4 51.9 0.5 (0.9)
Accounts payable and accrued liabilities (1,260.3) (1,176.2) 84.1 111.5
Income taxes receivable (payable) 3.6 (17.9) (21.5) 34.6
Impact of rationalization costs on working capital (0.6) 0.6
Impact of business acquisitions on working capital (1.6) 1.6 –
Other items (8.1) – 8.1 (8.7)
Total $ (131.3) $ (41.0) $ 90.3 $ 168.3
NON-CASH WORKING CAPITAL (YEAR-OVER-YEAR)
Year-Over-Year Increase (Decrease) in
($ in millions) May 5, 2007 May 6, 2006 Cash Flows
Receivables $ 326.8 $ 275.4 $ (51.4)
Inventories 757.5 694.3 (63.2)
Prepaid expenses 51.4 51.5 0.1
Accounts payable and accrued liabilities (1,260.3) (1,241.8) 18.5
Income taxes receivable (payable) 3.6 (35.8) (39.4)
Impact of rationalization costs on working capital 12.1 – (12.1)
Impact of business acquisitions on working capital (12.9) – 12.9
Other items 13.2 – (13.2)
Total $ (108.6) $ (256.4) $ (147.8)
Year-over-year, non-cash working capital decreased $147.8 million.Sobeys contributed $88.7 million to this decrease related to increased receivables, inventory and associated payables necessary to support Sobeys’ higher sales volume due to the increased amount of square footage in its expanded store network. The $147.8 million decrease was also signifi cantly impacted by tax deposits with CRA related to reassessments, described in the section titled “Contingencies” in this MD&A.
The net increase in non-cash working capital of $90.3 million in the fourth quarter was largely due to an $84.1 million increase in payables and a $15.3 million decrease in inventories, partially offset by decreased income taxes payable of $21.5 million compared to the third quarter ended February 3, 2007. The decrease in inventory is primarily related to lower inventory requirements in the food division following the December selling season. The decrease in taxes payable compared to the third quarter refl ects the timing of tax remittances, while the increased accounts payable and accrued liabilities refl ects higher supplier payables and accrued liabilities as construction activities have increased.
EMPIRE COMPANY LIMITED 2007 ANNUAL REPORT 53
9928_Back-Eng_Final v1a.indd 539928_Back-Eng_Final v1a.indd 53 7/26/07 8:00:49 AM7/26/07 8:00:49 AM

Investing Activities
Cash used in investing activities equalled $154.8 million in the fourth quarter of fi scal 2007 compared to $19.9 million in the fourth quarter last year. The fourth quarter investing activities last year benefi ted from proceeds of $267.7 million related to the sale of property to Crombie REIT, which was partially offset by the purchase of Sobeys’ common shares in the amount of $49.5 million and the purchase of portfolio investments totalling $112.9 million. Investment in property, equipment and other assets totalled $166.5 million in the fourth quarter versus $137.3 million in the same quarter last year.
For the fi scal year, cash used in investing activities decreased $37.5 million to total $435.4 million. This was primarily the result of: (i) a net decrease in investments of $317.4 million, (ii) proceeds on sale of property to Crombie REIT in fi scal 2006 of $267.7 million, (iii) reduced purchases of property plant and equipment of $1.2 million and (iv) increased proceeds on the sale of other property of $39.6 million.
Consolidated on-balance sheet purchases of property, equipment and other assets totalled $545.2 million compared to $546.4 millionlast fi scal year. The table below presents on-balance sheet capital expenditures over the last two years by division.
($ in millions) May 5, 2007 May 6, 2006
Food retailing $ 482.8 $ 421.3 Real estate 16.2 67.9Investments and other operations 46.2 57.2
Total $ 545.2 $ 546.4
Food division company-wide capital investment which includes on-balance sheet capital expenditures, all known capital investments by franchise affi liates and capital investment by third-party landlords totalled $580.0 million in fi scal 2007, an increase of $20.0 million from $560.0 million recorded in the previous year.
The table below outlines the number of stores Sobeys invested in during fi scal 2007 compared to fi scal 2006.
SOBEYS’ CORPORATE AND FRANCHISED STORE CONSTRUCTION ACTIVITY
13 Weeks Ended 13 Weeks Ended 52 Weeks Ended 52 Weeks Ended# of Stores May 5, 2007 May 6, 2006 May 5, 2007 May 6, 2006
Opened/Relocated 7 12 48 56
Acquired – – 29 –
Expanded 3 4 24 18
Rebannered/Redeveloped 13 4 49 9
Closed (9) – (38) (76)
Empire’s capital expenditure program is focused on developing food-anchored shopping plazas that build on the relationship between the food retailing and real estate businesses.
MANAGEMENT’S DISCUSSION AND ANALYSIS54
9928_Back-Eng_Final v1a.indd 549928_Back-Eng_Final v1a.indd 54 7/26/07 8:00:49 AM7/26/07 8:00:49 AM

At May 5, 2007, Sobeys’ square footage totalled 26.4 million square feet, a 4.0 percent increase over May 6, 2006.
Sobeys continues to focus on growth through a combination of new store openings, renovations, replacements and enlargements and, where appropriate, through strategic
acquisitions. It is expected that there will be an increase in capital expenditures in fi scal 2008. This will include a continued focus on the retail store network along with increased spending on landbank sites and logistics infrastructure, particularly the new distribution centre in Vaughan, Ontario as previously announced. During fi scal 2008, Sobeys plans to open, expand, or renovate approximately 150 corporate and franchised stores across Canada, increasing square footage by approximately four percent.
Capital expenditures for the real estate division equalled $16.2 million in fi scal 2007 ($67.9 million in fi scal 2006) as a result of ongoing property developments and land additions. The capital expenditures are expected to accelerate in fi scal 2008 as a result of ECL Developments’ focus on acquiring sites for grocery-anchored shopping plaza development.
Capital spending by investments and other operations equalled $46.2 million in fi scal 2007 ($57.2 million in fi scal 2006) as a result of expenditures to invest in selected oil and gas propertiesin Alberta through Kepec and to modernize and develop various movie theatre locations.
The following table shows Sobeys’ square footage changes for the 13 weeks and 52 weeks ended May 5, 2007 by type.
SOBEYS’ SQUARE FOOTAGE CHANGES
13 Weeks Ended 52 Weeks EndedSquare Feet May 5, 2007 May 5, 2007
Opened 58,278 464,166 Relocated 142,368 548,372 Acquired – 437,362 Expanded 3,480 120,895 Rebannered/Redeveloped – (13,714)Closed (138,846) (567,172)
65,280 989,909
Accounting Policy Changes
The following accounting standards have been implemented during fi scal 2007 and 2006:
ACCOUNTING FOR CONSIDERATION BY A
VENDOR TO A CUSTOMER (INCLUDING A RESELLER
OF THE VENDOR’S PRODUCTS) (“EIC-156”)
Issued in September 2005, EIC-156 addresses cash consider-ation, including a sales incentive, given by a vendor to a customer. This consideration is presumed to be a reduction of the selling price of the vendor’s products and should therefore be classifi ed as a reduction of sales in the vendor’s income
statement. These recommendations were effective for all interim and annual fi nancial statements for fi scal years beginning on or after January 1, 2006.
Prior to the implementation of EIC-156, Sobeys recorded certain sales incentives paid to independent franchisees, associates and independent accounts in cost of sales, selling and administrative expenses. As reclassifi cations, these changes did not impact net earnings.
Financing Activities
Financing activities during the fourth quarter used $35.6 million of cash compared to $136.3 million of cash used in the comparable period of fi scal 2006. Net repayments of funded debt amounted to $19.0 million in the fourth quarter (repayments of $40.9 million net of issuances of $21.9 million) compared to net repayments of $126.5 million (repayments of $281.7 million net of issuances of $155.2 million) in the fourth quarter of fi scal 2006. In the fourth quarter of fi scal 2006 some of the proceeds from the sales of property to Crombie REIT were used to pay down bank indebtedness, and also to purchase common shares of Sobeys.
For the fi scal year, fi nancing activities decreased cash by $60.2 million compared to a $94.3 million decline last year. Bank indebtedness decreased in fi scal 2007 by $68.5 million compared to a $110.6 million decrease last year. In fi scal 2007, proceeds from the sale of investments were used to reduce bank indebtedness. The Company added net long-term debt of $57.8 million in fi scal 2007 versus $47.0 million added last year.
EMPIRE COMPANY LIMITED 2007 ANNUAL REPORT 55
9928_Back-Eng_Final v1a.indd 559928_Back-Eng_Final v1a.indd 55 7/27/07 10:21:43 PM7/27/07 10:21:43 PM

ACCOUNTING BY A CUSTOMER (INCLUDING A
RESELLER) FOR CERTAIN CONSIDERATION RECEIVED
FROM A VENDOR (“EIC–144”)
During fi scal 2006, the Company adopted the amendment to EIC-144 issued in January 2005. The amendment requires disclosure of the amount of vendor allowances that have been recognized in income but for which the full requirements for entitlement have not yet been met. Certain allowances from vendors are contingent on the Company achieving minimum purchase levels. In accordance with EIC-144, the Company recognizes these allowances in income when it is probable that the minimum purchase level will be met, and the amount of allowance can be estimated. As of the fi scal year ended May 5, 2007, the Company has recognized $2.4 million (May 6, 2006 – $3.5 million) of allowances in income where it is probable that the minimum purchase level will be met and the amount of allowance can be estimated.
ACCOUNTING FOR CONDITIONAL ASSET
RETIREMENT OBLIGATIONS (“EIC-159”)
This abstract provides guidance on when a conditional asset retirement obligation should be recognized in accordance with CICA Section 3110, “Asset Retirement Obligations.” The abstractwas applied on a retroactive basis effective in the fourth quarter of fi scal 2006. The abstract requires an entity to recognize a conditional asset retirement obligation if the fair value of the liability can be reasonably estimated. A conditional asset retirement obligation refers to a legal obligation to perform an asset retirement activity in which the timing and/or method of settlement are conditional on a future event that may not be within the control of the entity. The obligation to perform the asset retirement activity is unconditional even though uncertainty exists about the timing and/or method of settlement.
FUTURE ACCOUNTING STANDARDS
FINANCIAL INSTRUMENTS, HEDGING
AND COMPREHENSIVE INCOME
As part of Canada’s current move toward harmonization with International Accounting Standards (currently expected to be completed by 2011), the CICA issued three new accounting standards that apply to the Company as of the fi rst day of its 2008 fi scal year.
CICA Section 1530, “Comprehensive Income”, introduces a statement of comprehensive income which will be included in interim and annual fi nancial statements. Comprehensive income is comprised of net income and other comprehensive income, and represents the change in equity during a period from transactions and other events with non-owner sources. It includes all changes in equity during a period except those resulting from investments by owners and distributions to owners. Other comprehensive income will include unrealized gains and losses on fi nancial assets that are classifi ed as available-for-sale and changes in fair value of the effective portion of cash fl ow hedges.
CICA Section 3855, “Financial Instruments – Recognition and Measurement”, requires that all fi nancial assets be classifi ed as held for trading, available for sale, held-to-maturity or loans and receivables and all fi nancial liabilities as held for trading or as other liabilities. All derivative instruments, including any embedded derivatives that are required to be separated from the host instruments, must be classifi ed as held for trading. Financial assets and liabilities classifi ed as held for trading are measured at fair value with gains and losses during the period recognized in net income in the periods in which they arise. Financial assets classifi ed as available-for-sale are measured at fair value with gains and losses recognized in other comprehensiveincome until the underlying fi nancial asset is derecognized or
Effective in the fi rst quarter of fi scal 2007, sales fi gures were retroactively restated as required by EIC-156. The following is a summary of the restatement of selected consolidated fi nancial statements for each of the eight most recently completed quarters.
Fiscal 2007 Fiscal 2006 (1)
Q4 Q3 Q2 Q1 Q4 Q3 Q2 Q1 (13 Weeks) (13 weeks) (13 weeks) (13 weeks) (13 weeks) (13 weeks) (13 weeks) (13 weeks) May 5, Feb. 3, Nov. 4, Aug. 5, May 6, Feb. 4, Nov. 5, Aug. 6,($ in millions) 2007 2007 2006 2006 2006 2006 2005 2005
Sales as previously reported $ 3,384.8 $ 3,318.0 $ 3,388.6 $ 3,416.5 $ 3,263.4 $ 3,271.1 $ 3,295.9 $ 3,368.4
Sales after reclassifi cation $ 3,350.4 $ 3,281.9 $ 3,353.4 $ 3,381.0 $ 3,226.6 $ 3,235.2 $ 3,263.7 $ 3,338.1
Reclassifi cation between
sales and cost of sales,
selling and administrative
expenses $ 34.4 $ 36.1 $ 35.2 $ 35.5 $ 36.8 $ 35.9 $ 32.2 $ 30.3
MANAGEMENT’S DISCUSSION AND ANALYSIS56
9928_Back-Eng_Final v1a.indd 569928_Back-Eng_Final v1a.indd 56 7/26/07 8:00:51 AM7/26/07 8:00:51 AM

becomes impaired. Held-to-maturity investments, loans and receivables and other liabilities are measured at amortized cost. Gains or losses on fi nancial assets and liabilities carried at amortized cost are recognized in net income when the fi nancial asset or fi nancial liability is derecognized or impaired.
CICA Section 3865, “Hedges”, establishes standards for when and how hedge accounting may be applied. The standard requires that hedges be designated as either fair value hedges, cash fl ow hedges or hedges of a net investment in a self-sustaining operation. For a fair value hedge, the gain or loss on the hedging item is recognized in earnings for the period together with the offsetting change on the hedged item attributable to the hedged risk. For a cash fl ow hedge, as well as a hedge of a net investment in a self-sustaining foreign operation, the effective portion of the unrealized gain or loss on the hedging item is reported in other comprehensive income and subsequently recognized in earnings when the hedged item affects earnings.
These new standards are effective for fi scal year ends beginning after October 1, 2006. Therefore, the Company will adopt these standards effective May 6, 2007. Prior periods presented will not be restated; the opening balance of retained earnings, net of income taxes, will be adjusted by the following:
The difference between the previous carrying amount and the fair value of fi nancial assets and liabilities designated as held for trading under the fair value option;
The ineffective portion of the gain or loss on the hedging items in designated cash fl ow hedging relationships and the total gain or loss on the hedging items in designated fair value hedging relationships;
The difference between the carrying amount and the fair value of derivatives or non-derivatives that no longer meet the hedging criteria; and
The fair value of “embedded derivatives” (i.e. clauses in contracts that are in essence derivatives).
The opening balance of “Accumulated other comprehensive income”, net of income taxes, will be adjusted by the following:
The difference between the previous carrying amount and the fair value of assets classifi ed as available for sale;
The effective portion of the gain or loss on the hedging items that are included in designated cash fl ow hedging relation-ships; and
The accumulated foreign currency translation adjustment on the translation of certain subsidiaries historically accounted for using the current rate method.
The Company has gone through a process of determining the transitional impact on the Fiscal 2008 Consolidated Financial Statements. While the future impact of the new standards on the Company’s results of operations, fi nancial position and cash fl ows cannot be determined at present, as they are partially contingent upon future events, the new standards are not expected to have a material impact on business strategy or business risks.
CICA Section 3070 “Deferred Charges” has been withdrawn with the introduction of CICA Sections 3855, 3865, and 1530 as discussed above.
CICA Section 1506 “Accounting Changes” requires that all companies are permitted to change an accounting policy only when it results in fi nancial statements that provide reliable and more relevant information or results from a requirement under a primary source of Canadian GAAP. This guidance also addresses how to account for a change in accounting policy, estimate or corrections of errors, and establishes enhanced disclosures about their effects on the fi nancial statements. These recommendations are effective for fi scal years beginning on or after January 1, 2007. The Company will implement these recommendations as required on a prospective basis.
CICA Section 3031 “Inventories” which has replaced Section 3030 with the same title was approved in March 2007. The new section establishes that inventories should be measured at the lower of cost and net realizable value, with guidance on the determination of cost. The fi nal standard is effective for interim and annual fi nancial statements relating to fi scal years beginning on or after January 1, 2008 and are applicable for the Company’s fi rst quarter of fi scal 2009. The Company is currently evaluating the impact of this new standard.
EMPIRE COMPANY LIMITED 2007 ANNUAL REPORT 57
9928_Back-Eng_Final v1a.indd 579928_Back-Eng_Final v1a.indd 57 7/26/07 8:00:51 AM7/26/07 8:00:51 AM

The preparation of fi nancial statements in accordance with Canadian GAAP requires management to make estimates and assumptions that affect the reported amounts and disclosures made in the consolidated fi nancial statements and accompanying notes. Management continually evaluates the estimates and assumptions it uses. Actual results could differ from these estimates.
PENSION, POST-RETIREMENT AND
POST-EMPLOYMENT BENEFITS
Certain estimates and assumptions are used in actuarially determining the Company’s defi ned pension and employee future benefi ts obligation.
Signifi cant assumptions used to calculate the pension and employee future benefi ts obligation are the discount rate, the expected long-term rate of return on plan assets and expected growth rate of health care costs. These assumptions depend on various underlying factors such as economic conditions, investment performance, employee demographics and mortality rates. These assumptions may change in the future and may result in material changes in the pension and employee benefi t plans expense. The magnitude of any immediate impact,
however, is mitigated by the fact that net actuarial gains and losses in excess of 10 percent of the greater of the accrued benefi t plan obligation and the market value of the benefi t plan assets are amortized on a straight-line basis over the average remaining service period of the active employees. Changes in fi nancial market returns and interest rates could also result in changes in funding requirements for the Company’s defi ned benefi t pension plans.
The discount rate is based on current market interest rates, assuming a portfolio of Corporate AA bonds with terms to maturity that, on average, match the terms of the obligation. The appropriate discount rates are determined on April 30 th every year. For fi scal 2007, the discount rate used for calculation of pension and other benefi t plan expense was 5.0 percent and 5.25 percent, respectively (fi scal 2006 – 5.5 percent for both pension and other benefi t plans). The expected long-term rate of return on plan assets for pension benefi t plans for each of fi scal 2007 was 7.0 percent (fi scal 2006 – 7.0 percent). The expected growth rate in health care costs was 10.0 percent for fi scal 2007 (fi scal 2006 – 10.0 percent). The cumulative growth rate in health care costs to 2016 is expected to be 5.0 percent. The expected future growth rate is evaluated on an annual basis.
Critical Accounting Estimates
The table below outlines the sensitivity of the 2007 key economic assumptions used in measuring the accrued benefi t plan obligations and related expenses of the Company’s pension and other benefi t plans. The sensitivity of each key assumption has been calculated independently. Changes to more than one assumption simultaneously may amplify or reduce the impact on the accrued benefi ts obligation or benefi t plan expenses.
Pension Plans Other Benefit Plans
Benefit Benefit Benefit Benefit ($ in millions) Obligations Cost (1) Obligations Cost (1)
Expected long-term rate of return on plan assets 7.0%
Impact of: 1% increase $ (2.8)
Impact of: 1% decrease $ 2.8
Discount rate 5.0% 5.0% 5.25% 5.25%
Impact of: 1% increase $ (32.6) $ 0.4 $ (17.2) $ (0.6)
Impact of: 1% decrease $ 36.7 $ (0.8) $ 20.7 $ 0.7
Growth rate of health care costs (2) 10.0% 10.0%
Impact of: 1% increase $ 17.4 $ 1.8
Impact of: 1% decrease $ (13.6) $ (1.3)
(1) Refl ects the impact on the current service cost, the interest cost and the expected return on assets.(2) Gradually decreasing to 5.0 percent in 2016 and remaining at that level thereafter.
MANAGEMENT’S DISCUSSION AND ANALYSIS58
9928_Back-Eng_Final v1a.indd 589928_Back-Eng_Final v1a.indd 58 7/26/07 8:00:51 AM7/26/07 8:00:51 AM

The Company has also assumed that a pending merger of pension plans will be completed. If this merger is not completed, the valuation of the transitional pension asset included in other assets on the balance sheet may need to be re-evaluated.
GOODWILL AND LONG LIVED ASSETS
Goodwill is not amortized and is assessed for impairment at the reporting unit level. This is done, at a minimum, annually. Any potential goodwill impairment is identifi ed by comparing the fair value of a reporting unit to its carrying value. If the fair value of the reporting unit exceeds its carrying value, goodwill is considered not to be impaired. If the carrying value of the reporting unit exceeds its fair value, potential goodwill impair-ment has been identifi ed and must be quantifi ed by comparing the estimated fair value of the reporting unit’s goodwill to its carrying value. Any goodwill impairment will result in a reduction in the carrying value of goodwill on the consolidated balance sheet and in the recognition of a non-cash impairment charge in operating income.
The Company periodically assesses the recoverability of long-lived assets when there are indications of potential impairment. In performing these analyses, the Company considers such factors as current results, trends and future prospects, current market value and other economic factors.
A substantial change in estimated undiscounted future cash fl ows for these assets could materially change their estimated fair values, possibly resulting in additional impairment. Changes which may impact future cash fl ows include, but are not limited to, competition and general economic conditions and unrecoverable increases in operating costs.
INCOME TAXES
Future income tax assets and liabilities are recognized for the future income tax consequences attributable to temporary differences between the fi nancial statement carrying values of assets and liabilities and their respective income tax bases. Future income tax assets or liabilities are measured using enacted or substantively enacted income tax rates expected
to apply to taxable income in the years in which those temporary differences are expected to be recovered or settled. The calculationof current and future income taxes requires management to makeestimates and assumptions and to exercise a certain amount of judgement. The fi nancial statement carrying values of assets and liabilities are subject to accounting estimates inherent in those balances. The income tax bases of assets and liabilities are based upon the interpretation of income tax legislation across various jurisdictions. The current and future income tax assets and liabilities are also impacted by expectations about future operating results and the timing of reversal of temporary differences as well as possible audits of tax fi lings by the regulatory authorities. Management believes it has adequately provided for income taxes based on current available information.
Changes or differences in these estimates or assumptions may result in changes to the current or future income tax balances on the consolidated balance sheet. A charge or credit to income tax expense may result in cash payments or receipts.
VALUATION OF INVENTORIES
Inventories are valued at the lower of cost and estimated net realizable value. Signifi cant estimation or judgment is required in the determination of (i) inventories counted and adjusted to cost and (ii) estimated inventory reductions due to spoilage, shrinkage and allowances, occurring between the last physical inventory count and the balance sheet date.
Inventory shrinkage, which is calculated as a percentage of the related inventory, is evaluated throughout the year and provides for estimated inventory shortages from the last physical count to the balance sheet date. To the extent that actual losses experienced vary from those estimated, both inventories and operating income may be impacted.
Changes or differences in these estimates may result in changes to inventories on the consolidated balance sheet and a charge or credit to operating income in the consolidated statement of earnings.
Controls and Procedures
Empire’s management, with the participation of the Chief Executive Offi cer (“CEO”) and Chief Financial Offi cer (“CFO”), has reviewed and evaluated the Corporation’s disclosure controls and procedures (as that term is defi ned in Multi-National Instrument 52-109) as of May 5, 2007. Based on that evaluation the CEO and CFO have concluded that the design and operation of the system of disclosure controls and procedures was effective.
EMPIRE COMPANY LIMITED 2007 ANNUAL REPORT 59
9928_Back-Eng_Final v1a.indd 599928_Back-Eng_Final v1a.indd 59 7/27/07 10:22:28 PM7/27/07 10:22:28 PM

Empire’s management, with the participation of the CEO and CFO, has reviewed and evaluated the design of the Corporation’s internal controls over fi nancial reporting (as that term is defi ned in MI 52-109) as of May 5, 2007. Internal controls over fi nancial reporting are designed to provide reasonable assurance regarding the reliability of the Company’s fi nancial reporting and its preparation of fi nancial statements for external purposes in accordance with Canadian GAAP. All internal control systems, no matter how well designed, have inherent limitations. Therefore, even those systems determined to be effective can provide only reasonable assurance with respect to fi nancial reporting.
As a result of this evaluation, management is in the process of remediating several control defi ciencies. However, these defi ciencies, even in aggregate, are not material in nature. Therefore, Empire’s CEO and CFO have concluded that the design of its internal controls over fi nancial reporting was effective.
In addition, management has evaluated whether there were changes in our internal controls over fi nancial reporting during the interim period ended May 5, 2007 that have materially affected, or are reasonably likely to materially affect, our internal controls over fi nancial reporting. While there are no such changes, we continue to undergo a system transition initiative that will further enhance our internal controls.
Internal Controls Over Financial Reporting
Related Party Transactions
The Company rents premises from Crombie REIT. In addition, Crombie REIT provides administrative and management services to the Company. The rental payments are at fair value and the charges incurred for administrative and management services are on a cost recovery basis. The Company has non-interest bearing notes payable to Crombie REIT in the amount of $33.1 million.
On October 2, 2006, the Company sold two commercial properties to Crombie REIT, for cash proceeds of $32.4 million, which was fair market value. Since the sale was to an equity accounted investment, no gain was recorded on the sale.
Guarantees and Commitments
The following illustrates the Company’s signifi cant contractual obligations.
GROSS OBLIGATIONS EXCLUDING LEASE INCOME
($ in millions) 2008 2009 2010 2011 2012 Thereafter Total
Long-term debt $ 72.3 $ 74.2 $ 33.8 $ 38.8 $ 27.1 $ 579.2 $ 825.4
Capital leases 10.2 7.7 7.2 6.5 5.6 12.5 49.7
Operating leases 249.1 230.6 219.0 207.2 195.8 1,392.1 2,493.8
Total contractual
obligations $ 331.6 $ 312.5 $ 260.0 $ 252.5 $ 228.5 $ 1,983.8 $ 3,368.9
OPERATING LEASES, NET OF EXPECTED LEASE INCOME RECEIVED BY THE COMPANY
($ in millions) 2008 2009 2010 2011 2012 Thereafter Total
$ 187.1 $ 164.7 $ 157.0 $ 151.1 $ 144.0 $ 1,073.5 $ 1,877.4
MANAGEMENT’S DISCUSSION AND ANALYSIS60
9928_Back-Eng_Final v1a.indd 609928_Back-Eng_Final v1a.indd 60 7/26/07 8:00:52 AM7/26/07 8:00:52 AM

FRANCHISE AFFILIATES
Sobeys has guaranteed certain bank loans contracted by franchise affi liates. As at May 5, 2007, these loans amounted to approximately $2.9 million (May 6, 2006 – $1.3 million).
Sobeys also has guaranteed certain equipment leases of its franchise affi liates. Under the terms of the guarantee should a franchise affi liate be unable to fulfi ll its lease obligation Sobeys would be required to fund the difference of the lease commitments up to a maximum of $100.0 million on a cumulative basis. Sobeys approves each of the contracts.
The aggregate, annual, minimum rent payable under the guaranteed equipment leases for fi scal 2008 is approximately $29.4 million. The guaranteed lease commitments over the next fi ve fi scal years are:
Guaranteed ($ in millions) Lease Commitments
2008 $ 29.4
2009 25.5
2010 21.7
2011 17.0
2012 6.4
Thereafter $ –
OTHER
At May 5, 2007, the Company was contingently liable for letters of credit issued in the aggregate amount of $48.5 million (May 6, 2006 – $47.6 million).
Upon entering into the lease of its new Mississauga distribution centre in March 2000, Sobeys guaranteed to the landlord the performance by SERCA Foodservice Inc. of all of its obligations under the lease. The remaining term of the lease is 13 years with an aggregate obligation of $40.4 million (May 6, 2006 – $43.3 million). At the time of the sale of assets of SERCA Foodservice Inc. to Sysco Corp., the lease of the Mississauga distribution centre was assigned to and assumed by a subsidiary of the purchaser and Sysco Corp. agreed to indemnify and hold Sobeys harmless from any liability it may incur pursuant to its guarantee.
Designation for Eligible Dividends
The new dividend regime for the favourable tax treatment of “eligible dividends” has been brought into effect by Bill C-28 which came into effect on February 21, 2007. Passage of this bill has important implications for corporations paying eligible dividends. To be eligible dividends, dividends paid:
On or after February 21, 2007, must be designated as such at the time of payment;
Before February 21, 2007, can be designated as such up to May 22, 2007.
Empire has, in accordance with the administrative position of the Canada Revenue Agency, included the appropriate language on its website to designate the dividends paid by Empire as eligible dividends unless otherwise designated.
EMPIRE COMPANY LIMITED 2007 ANNUAL REPORT 61
9928_Back-Eng_Final v1a.indd 619928_Back-Eng_Final v1a.indd 61 7/26/07 8:00:52 AM7/26/07 8:00:52 AM

In the ordinary course of business, the Company is subject to ongoing audits by tax authorities. While the Company believes that its tax fi ling positions are appropriate and supportable, from time to time certain matters are reviewed and challenged by tax authorities.
On June 21, 2005, Sobeys received a notice of reassessment from CRA for the fi scal years 1999 and 2000 related to the Goods and Services Tax (“GST”). CRA asserts that Sobeys was obliged to collect GST on sales of tobacco products to Status Indians. The total tax, interest and penalties in the reassessment were $13.6 million. Sobeys has reviewed this matter, has received legal advice and believes it was not required to collect GST. During the second quarter of fi scal 2006, Sobeys fi led a Notice of Objection with CRA. Accordingly, Sobeys has not recorded in its statement of earnings any of the tax, interest or penalties set-out in the notice of reassessment. Sobeys has deposited with CRA funds to cover the total tax, interest and penalties in the reassessment and has recorded this amount as a long-term receivable from CRA pending resolution of the matter.
The Company and certain subsidiaries are presently under audit by CRA and certain provincial taxing authorities for fi scal years 2001 through 2006. The principal matters under audit are:
a) The tax treatment of gains realized on the sale of shares in Hannaford Bros. Co. (“Hannaford”) in fi scal 2001;
b) The tax treatment of gains realized on the sale of shares in Delhaize America Inc. in fi scal years 2001 and 2002; and
c) The taxation of income from certain of the Company’s real estate investments for fi scal years 2003 to 2006.
Reassessments have been received in respect of the sale of shares of Hannaford. In the event that the tax authorities are successful in respect of the Hannaford transaction, which the Company believes is unlikely, the maximum potential exposure in excess of provisions taken is approximately $30 million.
The Company has appealed the reassessments in respect of the sale of the Hannaford shares. The Company expects that it will be substantially successful on its appeals of each of these reassessments. The Company also believes that the ultimate resolution of these matters will not, in any event, have a material impact on earnings because it has made adequate provisions for each of these matters. Should the ultimate outcome materially differ from the provisions established, the effective tax rate and earnings of the Company could be materially affected, negatively or positively, in the period in which the matters are resolved.
In the third quarter of fi scal 2007, Sobeys was named as a defendant in a lawsuit brought by benefi ciaries of a multi-employerpension plan. The lawsuit alleges mismanagement of certain pension plan investments by the trustees of the pension plan and seeks, among other remedies, payment of $1 billion in damages from the trustees and the contributing employers, of which Sobeys is one of approximately 440. Sobeys played no role in the management of the pension plan and intends to contest the lawsuit. Accordingly, Sobeys has not recorded in its statement of earnings any amount related to this lawsuit.
The Company entered into an agreement with Crombie REIT to fund certain property redevelopments and originally issued and recorded a note payable to Crombie REIT in the amount of $39.6 million related thereto. The Company has agreed to pay all additional costs and expenses required for the redevelopment of those properties. In the event that the redevelopment costs are less than $39.6 million, the savings will be paid to the Company.
The Company has agreed to indemnify its directors and offi cers and particular employees in accordance with the Company’s policies. The Company maintains insurance policies that may provide coverage against certain claims.
There are various claims and litigation which the Company is involved with arising out of the ordinary course of business operations. The Company’s management does not consider the exposure to such litigation to be material, although this cannot be predicted with certainty.
Contingencies
MANAGEMENT’S DISCUSSION AND ANALYSIS62
9928_Back-Eng_Final v1a.indd 629928_Back-Eng_Final v1a.indd 62 7/26/07 8:00:52 AM7/26/07 8:00:52 AM

Through its operating companies and its investment portfolio, Empire is exposed to a number of risks in the normal course of business that have the potential to affect operating performance. The Company has operating and risk management strategies and insurance programs to help minimize these operating risks.
During fi scal 2006, Sobeys adopted an annual enterprise risk management assessment which is overseen by the Company’s Leadership Committee and reported to the Board and Committees of the Board. The enterprise risk management framework sets out principles and tools for identifying, evaluating, prioritizing and managing risk effectively and consistently across Sobeys.
COMPETITION
Empire’s food retail business, through Sobeys, operates in a dynamic and competitive market. Other national and regional food distribution companies along with non-traditional competitors, such as mass merchandisers and warehouse clubs, represent a competitive risk to Sobeys’ ability to attract customers and operate profi tably in its markets.
Sobeys maintains a strong national presence in the Canadian retail food and food distribution industry through regionally managed operations. The most signifi cant risk to Sobeys is the potential for reduced revenues and profi t margins as a result of increased competitive intensity. To mitigate this risk, Sobeys’ strategy is to be geographically diversifi ed with the benefi ts of national scale, to be customer and market-driven, to be focused on superior execution, and to have effi cient, cost effective operations. Sobeys reduces its exposure to competitive or economic pressures in any one region of the country by operating in each region of Canada through a network of corporate, franchised, and affi liated stores, and through servicing the needs of thousands of independent, wholesale accounts. Sobeys approaches the market with fi ve distinct formats, sizes, and banners, to meet anticipated needs of its customers in order to enhance profi tability by region and by target market.
Empire’s real estate operations, through ECL, compete with numerous other developers, managers, and owners of real estate properties in seeking tenants and new properties for future development. The existence of competing developers, managers and owners could affect our real estate group’s ability to lease space in its properties and on rents charged or concessions granted. Commercial property revenue is also dependent on the renewal of lease arrangements by key tenants. These factors could adversely affect revenues and cash fl ows.
Continued growth of rental income is dependent on renewing expiring leases and fi nding new tenants to fi ll vacancies at market rental rates, thereby ensuring an attractive return on our investment. The success of the real estate portfolio is also subject to general economic conditions, the supply and demand for rental property in key markets served, and the availability of attractive fi nancing to expand the real estate portfolio where deemed prudent. During fi scal 2007, our real estate operations encountered generally positive economic conditions with relatively stable occupancy levels and healthy rental renewal rates. During fi scal 2007, capitalization rates remained low which impacted the number of potential properties that generate an attractive return on investment.
FINANCIAL
The Company employs numerous professionally accredited accountants throughout its fi nance group.
Empire and its operating companies have adopted a number of key fi nancial policies to manage interest rate risk and foreign exchange risk. Risks can also arise from changes in the rules or standards governing accounting or fi nancial reporting.
In the ordinary course of managing its debt, the Company utilizes fi nancial instruments from time to time to manage the volatility of borrowing costs. Financial instruments are not used for speculative purposes. The majority of Empire’s consolidated debt is at fi xed rates and accordingly there is limited exposure to interest rate fl uctuations.
INTEREST RATE RISK
Interest rate risk is the potential for fi nancial loss arising from changes in interest rates. The majority of the Company’s long-term debt is generally at a fi xed interest rate, and therefore, the Company’s exposure to interest rate cash fl ow risk during the term of the debt is minimal.
INSURANCE
Empire and its subsidiaries are self-insured on a limited basis with respect to certain operational risks and also purchase excess insurance coverage from fi nancially stable third-party insurance companies. In addition to maintaining comprehensive loss prevention programs, the Company maintains management programs to mitigate the fi nancial impact of operational risks.
HUMAN RESOURCES
Empire is exposed to the risk of labour disruption in its operating companies. Labour disruptions pose a moderate operational risk, as Sobeys operates an integrated network of more than 21 distribution centres across the country for
Risk Management
EMPIRE COMPANY LIMITED 2007 ANNUAL REPORT 63
9928_Back-Eng_Final v1a.indd 639928_Back-Eng_Final v1a.indd 63 7/27/07 10:25:49 PM7/27/07 10:25:49 PM

the food division. Sobeys has good relations with its employees and unions and does not anticipate any material labour disruptions in fi scal 2008. However, Sobeys has stated that it will accept the short-term costs of a labour disruption to support a steadfast commitment to building and sustaining a competitive cost structure for the long-term.
Effective leadership is very important to the growth and continued success of the Company. The Company develops and delivers training programs at all levels across its various operating regions in order to improve employee knowledge and to better serve its customers. The ability of the Company to properly develop and retain its employees could affect the Company’s future performance.
BUSINESS CONTINUITY
The Company is subject to unexpected events and natural hazards which could cause sudden or complete cessation of its day-to-day operations.
One such unexpected and natural hazard is the risk of a pandemic. Sobeys is working with industry and government sources to develop a pandemic preparedness plan.
Responsibility for business continuity planning has been designated to Sobeys’ Leadership Committee.
ENVIRONMENTAL, HEALTH AND SAFETY
The Company is continually enhancing its programs in areas of environmental, health and safety and is in compliance with relevant legislation. Employee awareness and training programs are conducted and environmental, health and safety risks are reviewed on a regular basis.
Any environmental site remediation is completed using appropriate, qualifi ed internal and external resources and health and safety issues are proactively dealt with. The Board of Directors receives regular reports which review outstanding matters, identify new legislation and outline new programs being implemented across the Company to positively impact the environment and employee health and safety. Existing environmental protection regulatory requirements are not expected to have a material fi nancial or operational effect on the capital expenditures, earnings or competitive position of the Company during the current fi scal year or in future years.
Sobeys has developed programs to promote a healthy and safe workplace, as well as progressive employment policies focused on the well-being of the thousands of employees who work in its stores, distribution centres and offi ces. These policies and programs are reviewed regularly by the Human Resources Committee of the Board.
Each operating business conducts an ongoing, comprehensive environmental monitoring process and the Company is unaware of any material environmental liabilities in any of its operating
companies. Empire’s Board of Directors receives quarterly reports that review any outstanding issues including plans to resolve them.
FOOD SAFETY
Sobeys is subject to potential liabilities connected with its business operations, including potential liabilities and expenses associated with product defects, food safety and product handling. Such liabilities may arise in relation to the storage, distribution and display of products and, with respect to private label products, in relation to the production, packaging and design of products.
A large majority of Sobeys’ sales are generated from food products and Sobeys could be vulnerable in the event of a signifi cant outbreak of food-borne illness or increased public health concerns in connection with certain food products. Such an event could materially affect fi nancial performance. Procedures are in place to manage food crises, should they occur. These procedures identify risks, provide clear communication to employees and consumers and ensure that potentially harmful products are removed from inventory immediately. Food safety related liability exposures are insured by the Company’s insurance program. In addition, Sobeys has food safety procedures and programs, which address safe food handling and preparation standards. Sobeys employs best practices for storage and distribution of food products.
TECHNOLOGY
The Company and each of its operating companies are committed to improving their respective operating systems, tools and procedures in order to become more effi cient and effective. The implementation of major information technology projects carries with it various risks that must be mitigated by disciplined change management and governance processes. Sobeys has a business process optimization team staffed with knowledgeable internal and external resources that is responsible for implementingthe various initiatives. Sobeys’ Board of Directors has also created an oversight committee to ensure appropriate governanceof these change initiatives is in place and this committee receives regular reports from the Company’s management.
REAL ESTATE
The Company utilizes a capital allocation process which is focused on obtaining the most attractive real estate locations for its retail grocery stores as well as for its commercial property and residential development operations, with direct Company ownership being an important, but not overriding, consideration. Sobeys develops certain retail store locations on owned sites, however, the majority of its store development is done in conjunction with external developers. The availability of high potential new store sites and/or the ability to expand existing
MANAGEMENT’S DISCUSSION AND ANALYSIS64
9928_Back-Eng_Final v1a.indd 649928_Back-Eng_Final v1a.indd 64 7/26/07 8:00:52 AM7/26/07 8:00:52 AM

stores is therefore in large part contingent upon successful negotiation of operating leases with these developers and Sobeys’ ability to purchase these sites.
LEGAL, TAXATION AND ACCOUNTING
Changes to any of the various federal and provincial laws, rules and regulations related to the Company’s business could have a material impact on its fi nancial results. Compliance with any proposed changes could also result in signifi cant cost to the Company. Failure to fully comply with various laws, rules and regulations may expose the Company to proceedings which may materially affect its performance.
Similarly, income tax regulations and/or accounting pronounce-ments may be changed in ways which could negatively affect the Company. The Company mitigates the risk of not being in compliance with the various laws, rules and regulations by monitoring for newly adopted activities, improving technology systems and controls, improving internal controls to detect and prevent errors and overall, application of more scrutiny to ensure compliance.
OPERATIONS
The success of Empire is closely tied to the performance of Sobeys’ retail stores. Franchise affi liates operate approximately 56 percent of these retail stores. Sobeys relies on the franchise affi liates and corporate store management to successfully execute retail programs and strategies.
To maintain controls over Sobeys’ brands and the quality and range of products and services offered at its stores, each franchisee agrees to purchase merchandise from Sobeys. In addition, each store agrees to comply with the policies, marketing plans and operating standards prescribed by Sobeys. These obligations are specifi ed under franchise agreements which expire at various times for individual franchisees. As well, Sobeys maintains head lease control, or has long-term buying agreements, to control the vast majority of its retail locations.
SUPPLY CHAIN
Sobeys is exposed to potential supply chain disruptions that could result in shortages of merchandise in its retail store network. Sobeys mitigates this risk through effective supplier selection and procurement practices along with a reliance on the effi cient maintenance and evolution of its supply and logistics chain to sustain and meet growth objectives.
SEASONALITY
The Company’s operations as they relate to food, specifi cally inventory levels, sales volume and product mix, are impacted to some degree by certain holiday periods in the year.
UTILITY AND FUEL PRICES
The Company is a signifi cant consumer of electricity, other utilities and fuel. Unanticipated cost increases in these items could negatively affect the Company’s fi nancial performance. The Company has various consumption and procurement programs in place to minimize utility risk.
FOREIGN OPERATIONS
Empire does not directly carry out foreign operations, however, Sobeys and ECL do have certain foreign operations. Sobeys’ foreign operations are limited to a small number of produce brokerage offi ces based in the United States.
ECL, through its interest in Genstar, has certain residential land development in the California market but on a limited scale. These foreign operations are relatively small and are not considered material to Empire on a consolidated basis, as such, the Company does not have any material risks associated with foreign operations.
FOREIGN CURRENCY
The Company conducts the majority of its operating business in Canadian dollars and its foreign exchange risk is limited to currency fl uctuations between the Canadian dollar, the Euro, and the U.S. dollar. U.S. dollar purchases of product by the food division represent approximately three percent of Sobeys’ total annual purchases with Euro purchases limited to specifi c contracts for capital expenditures. Sobeys has processes in place to use forward contracts with high quality counter-parties to fi x the exchange rate on some of its expected requirements for Euros and U.S. dollars.
With respect to portfolio investments denominated in U.S. dollar currency, to mitigate exposure to currency fl uctuations, the Company has hedged a portion of its foreign currency exposure through the use of U.S. forward currency contracts. At May 5, 2007 the ratio of U.S. dollar debt to the market value of U.S. equities was approximately 70.0 percent.
ETHICAL BUSINESS CONDUCT
Any failure of the Company to adhere to its policies, the law or ethical business practices could signifi cantly affect its reputation and brands and could therefore, negatively impact the Company’s fi nancial performance. The Company’s framework for managing ethical business conduct includes the adoption of a Code of Business Conduct which employees and Directors of the Company are required to acknowledge and agree to on a regular basis and as part of an independent audit and security function, maintenance of a whistle-blowing hotline.
EMPIRE COMPANY LIMITED 2007 ANNUAL REPORT 65
9928_Back-Eng_Final v1a.indd 659928_Back-Eng_Final v1a.indd 65 7/26/07 8:00:52 AM7/26/07 8:00:52 AM

INFORMATION MANAGEMENT
The integrity, reliability and security of information in all its forms are critical to the Company’s daily and strategic operations. Inaccurate, incomplete or unavailable information and/or inappropriate access to information could lead to incorrect fi nancial and/or operational reporting, poor decisions, privacy breaches and/or inappropriate disclosure or leaks of sensitive information.
Information management is identifi ed as a risk in its own right, separate from the technology risk. The Company recognizes that information is a critical enterprise asset. Currently, the information management risk is being managed at the Regional and National levels through the development of policies and procedures pertaining to security access, system development, change management and problem and incident management. With a view to enhancing and standardizing the controls to manage the information management risk, the Company is
developing corporate operating policies which establish minimum standards for the usage, security and appropriate destruction of information. Furthermore, enterprise metrics are being identifi ed to assist in monitoring signifi cant information management risks.
EQUITY PRICE RISK
The carrying values of the investments in Empire’s investment portfolio are based on cost; however the realizable value of each investment and therefore the portfolio is based on market prices and is subject to market price fl uctuations. Empire has a disciplined, long-term approach to selecting quality investments and has been successful in generating above market portfolio returns. While portfolio returns may not match those of the prior year, or exceed median manager returns, management will continue to manage the portfolio prudently to ensure appropriate diversifi cation and liquidity.
(a) On April 26, 2007, Empire and Sobeys jointly announced that they had entered into an arrangement agreement (the “Arrangement”) pursuant to which Empire would acquire all of the outstanding common shares of Sobeys that it did not then own at a price of $58.00 per share. The transaction valued the Sobeys shares not then owned by Empire at approximately $1.06 billion.
The Arrangement required various approvals to comply with applicable corporate and securities laws: The Sobeys share holders approved the Arrangement at a special shareholders’ meeting held on June 9, 2007 by the requisite majority; the Supreme Court of Nova Scotia gave its sanction to the Arrangement on June 13, 2007; the Arrangement became effective upon registration of the fi nal Court order with the Nova Scotia Registry of Joint Stock Companies at the close of business on June 15, 2007, at which time the Company acquired all the outstanding shares of Sobeys that it did not previously own. Subsequently, the Sobeys common shares ceased trading on the Toronto Stock Exchange, and were de-listed at the close of business on June 18, 2007.
The acquisition was fi nanced by funds from the sale of certain portfolio investments for proceeds of $278 million and advances of $784 million under new credit facilities (the “Credit Facilities”). The Credit Facilities consist of a $950 million unsecured revolving credit facility maturing on June 8, 2010 (subject to annual extensions at the request of the Company) and a $50 million unsecured non-revolving credit facility maturing June 30, 2007. The Credit facilities are subject to certain fi nancialcovenants. Interest on the debt varies based on the designation of the loan (bankers’ acceptances (“BA”) rate loans, Canadian prime rate loans, U.S. base rate loans or LIBOR loans), fl uctuations
in the underlying rates, and in the case of BA rate loans or LIBOR loans, the margin applicable to the fi nancial covenants.
On June 18, 2007, Empire entered into two delayed fi xed rate interest swaps. The fi rst swap in an amount of $200.0 million is for a period of three years at a fi xed interest rate of 4.998 percent. The second swap in an amount of $200.0 million is for a period of fi ve years at a fi xed interest rate of 5.051 percent. Both swaps became effective on July 23, 2007.
On June 27, 2007, pursuant to the terms of the Credit Facilities, Empire and Sobeys fi led notice with the lenders requesting the establishment of a new $300.0 million fi ve-year credit facility in favour of Sobeys at the same interest rate as the Credit Facilities. On July 23, 2007, Sobeys drew down $300.0 million from the new credit facility, the proceeds of which were used to pay a dividend to Empire. Empire used the proceeds from the dividend to reduce its indebtedness under the Credit Facilities and the Credit Facilities were reduced accordingly. On that date, Empire transferred the second swap to Sobeys.
(b) On July 16, 2007, the Company announced that Sobeys and Thrifty Foods (“Thrifty”) have entered into an agreement that will see Sobeys purchase the British Columbia-based grocery retailer. The transaction is based on an enterprise value of $260.0 million and is subject to adjustments for, among other items, assumed liabilities and working capital at closing. Thrifty’s business includes 20 full-service supermarkets, a main distribution centre and a wholesale division on Vancouver Island and the lower mainlandof British Columbia. The deal is expected to close during the Company’s second quarter following receipt of regulatory approvaland completion of due diligence. The transaction is expected to be fi nanced with cash and available banking facilities.
Subsequent Events
MANAGEMENT’S DISCUSSION AND ANALYSIS66
9928_Back-Eng_Final v1a.indd 669928_Back-Eng_Final v1a.indd 66 7/26/07 8:00:53 AM7/26/07 8:00:53 AM

Management’s primary objective will continue to be to maximize the long-term sustainable value of Empire through enhancing the worth of the Company’s net assets and in turn, having that value refl ected in Empire’s share price.
Management is clearly focused on directing its energy and capital towards growing the long-term sustainable value of its food retail, real estate and related businesses. While the Company’s core businesses are well established and profi table in their own right, the diversifi cation they offer Empire by both business line and by market area served is considered by management to be an additional source of strength. Going forward, the Company intends to continue to direct its resources towards the most promising opportunities within these core businesses in order to maximize long-term shareholder value.
FOOD RETAILING DIVISION
Sobeys intends to continue to invest in infrastructure and productivity improvements in a manner consistent with its expressed intention to build a healthy and sustainable retail business and infrastructure for the long term.
In fi scal 2008, Sobeys intends to advance its business process and information systems installation plan for the Company by focusing on the signifi cant opportunity to upgrade information processing and decision support capabilities and improve effi ciencies in its Western region. The system and processes that are being implemented have been developed over several years and are currently employed in Sobeys’ Ontario and Atlantic regions. These initiatives will simplify, standardize and streamline the “back shop”, in support of Sobeys’ food-focused strategy. This move will leverage technology investments, improve effi ciency and lower costs over the long term.
The approach taken for this set of initiatives will be guided and informed by Sobeys’ previous experience. The complexity of this comprehensive set of initiatives, which impacts every aspect of the business, requires that a signifi cant investment be made to manage the risk of implementation but also to prepare employees to secure and sustain the benefi ts of more effi cient processes and systems after they have been implemented. The necessary re-training of thousands of employees in Ontario continues and will continue through the fi rst six months of fi scal 2008. The implementation costs as well as training costs for thousands of employees in the Western region will be fi nalized during fi scal 2008.
REAL ESTATE DIVISION
Over the next year, Empire’s real estate management group intends to continue its policy of maximizing and prudently reinvesting its cash fl ow to further strengthen and diversify its portfolio of residential and commercial properties.
Empire’s real estate management group expects overall retail occupancy levels to remain strong during fi scal 2008 as a result of the diligence of the leasing team and general economic conditions. Management looks forward to continuing its strong relationship with Sobeys and to pursuing attractive opportunities to jointly develop locations with Sobeys.
As previously advised, Empire is continuing to explore the potentialsale of some or all of the SLP commercial real estate portfolio. Pursuant to a Non-Competition Agreement between Empire and Crombie REIT, any property sold from SLP must fi rst be offered to Crombie REIT. Any potential transaction, if deemed appropriate, would be subject to customary Board approval.
Outlook
EMPIRE COMPANY LIMITED 2007 ANNUAL REPORT 67
9928_Back-Eng_Final v1a.indd 679928_Back-Eng_Final v1a.indd 67 7/26/07 8:00:53 AM7/26/07 8:00:53 AM

There are measures included in this MD&A that do not have a standardized meaning under GAAP and therefore may not be comparable to similarly titled measures presented by publicly traded companies. The Company includes these measures because it believes certain investors use these measures as a means of assessing fi nancial performance. Empire’s defi nition of the non-GAAP terms are as follows:
Operating income or EBIT is calculated as operating earnings before minority interest, interest expense and income taxes.
EBITDA is calculated as EBIT plus depreciation and amortization.
Operating earnings is calculated as net earnings before capital gains and other items.
Funds from operations are calculated as operating earnings plus depreciation and amortization.
Interest coverage is calculated as operating income divided by interest expense.
Funded debt is all interest bearing debt, which includes bank loans, bankers’ acceptances, long-term debt and liabilities relating to assets held for sale.
Net debt is calculated as funded debt less cash and cash equivalents.
Total capital is calculated as funded debt plus shareholders’ equity.
Adjusted debt is funded debt plus the capitalized value of net operating lease payments, which is calculated as six times net annual operating lease payments.
Company-wide capital investment includes on-balance sheet capital expenditures, all known capital investments by franchiseaffi liates and capital investments by third-party landlords.
Same-store sales are sales from stores in the same locations in both reporting periods.
Non-GAAP Financial Measures
The following table reconciles Empire’s funded debt and total capital to GAAP measures reported in the unaudited interim periodbalance sheets as at May 5, 2007, May 6, 2006 and May 7, 2005, respectively:
($ in millions) May 5, 2007 May 6, 2006 May 7, 2005
Bank indebtedness $ 30.1 $ 98.6 $ 219.4
Long-term debt due within one year 82.5 95.4 247.0
Liabilities relating to assets held for sale 6.8 7.1 –
Long-term debt 792.6 707.3 727.4
Funded debt 912.0 908.4 1,193.8
Total shareholders’ equity 2,135.4 1,965.2 1,709.0
Total capital $ 3,047.4 $ 2,873.6 $ 2,902.8
Additional fi nancial information relating to Empire, including the Company’s Annual Information Form, can be found on the Company’s web site or on the SEDAR website for Canadian regulatory fi lings at www.sedar.com.
Dated: June 28, 2007Stellarton, Nova Scotia, Canada
MANAGEMENT’S DISCUSSION AND ANALYSIS68
9928_Back-Eng_Final v1a.indd 689928_Back-Eng_Final v1a.indd 68 7/26/07 8:00:53 AM7/26/07 8:00:53 AM

Preparation of the consolidated fi nancial statements accompanying this annual report and the presentation of all other information in the report is the responsibility of management. The consolidated fi nancial statements have been prepared in accordance with Canadian generally accepted accounting principles and refl ect management’s best estimates and judgements. All other fi nancial information in the report is consistent with that contained in the consolidated fi nancial statements.
Management of the Company has established and maintains a system of internal control that provides reasonable assurance as to the integrity of the consolidated fi nancial statements, the safeguarding of Company assets, and the prevention and detection of fraudulent fi nancial reporting.
The Board of Directors, through its Audit Committee, oversees management in carrying out its responsibilities for fi nancial reporting and systems of internal control. The Audit Committee, which is chaired by and composed solely of directors who are unrelated to, and independent of, the Company, meet regularly with fi nancial management and external auditors to satisfy itself as to reliability and integrity of fi nancial information and the safeguarding of assets. The Audit Committee reports its fi ndings to the Board of Directors for consideration in approving the annual consolidated fi nancial statements to be issued to shareholders. The external auditors have full and free access to the Audit Committee.
Paul D. Sobey Paul V. BeesleyPresident and Executive Vice-President, Chief Executive Offi cer Chief Financial Offi cer and Secretary
June 28, 2007 June 28, 2007
To the Shareholders of Empire Company Limited
We have audited the consolidated balance sheets of Empire Company Limited as at May 5, 2007 and May 6, 2006, and the consolidated statements of earnings, retained earnings, and cash fl ows for the 52 week fi scal years then ended. These consolidated fi nancial statements are the responsibility of the Company’s management. Our responsibility is to express an opinion on these consolidated fi nancial statements based on our audits.
We conducted our audits in accordance with Canadian generally accepted auditing standards. Those standards require that we planand perform an audit to obtain reasonable assurance whether the consolidated fi nancial statements are free of material misstatement. An audit includes examining, on a test basis, evidence supporting the amounts and disclosures in the consolidated fi nancial state-ments. An audit also includes assessing the accounting principles used and signifi cant estimates made by management, as well as evaluating the overall consolidated fi nancial statement presentation.
In our opinion, these consolidated fi nancial statements present fairly, in all material respects, the fi nancial position of the Company as at May 5, 2007 and May 6, 2006, and the results of its operations and its cash fl ows for the fi scal years then ended in accordance with Canadian generally accepted accounting principles.
Chartered AccountantsNew Glasgow, Canada
June 15, 2007, except for Note 27 which is as of July 23, 2007
EMPIRE COMPANY LIMITED 2007 ANNUAL REPORT 69
Management’s Statement of Responsibility for Financial Reporting
Auditors’ Report
9928_Back-Eng_Final v1a.indd 699928_Back-Eng_Final v1a.indd 69 7/26/07 8:00:53 AM7/26/07 8:00:53 AM

(in millions) May 5, 2007 May 6, 2006
ASSETS
Current Cash and cash equivalents $ 294.9 $ 341.1 Receivables 326.8 275.4 Income taxes receivable 3.6 – Inventories 757.5 694.3 Prepaid expenses 51.4 51.5
1,434.2 1,362.3Investments, at cost (quoted market value $283.1; 2006 - $398.9) 189.7 359.9Investments, at equity (realizable value $434.0; 2006 - $425.3) (Note 5) 142.8 157.5Property and equipment (Note 6) 2,302.9 2,143.6Assets held for sale 24.1 23.1Other assets (Note 7) 344.6 273.3Goodwill 786.6 731.8
$ 5,224.9 $ 5,051.5
LIABILITIES
Current Bank indebtedness (Note 8) $ 30.1 $ 98.6 Accounts payable and accrued liabilities 1,260.3 1,241.8 Income taxes payable – 35.8 Future income taxes (Note 14) 40.4 46.1 Long-term debt due within one year 82.5 95.4 Liabilities relating to assets held for sale 6.8 7.1
1,420.1 1,524.8Long-term debt (Note 9) 792.6 707.3Long-term lease obligation 36.9 20.8Other liabilities (Note 10) 14.0 18.9Employee future benefi ts obligation (Note 21) 102.1 97.3Future income taxes (Note 14) 133.6 131.8Minority interest 590.2 585.4
3,089.5 3,086.3
SHAREHOLDERS’ EQUITY
Capital stock (Note 11) 196.1 195.1Contributed surplus 0.3 0.2Retained earnings 1,939.6 1,771.0Cumulative translation adjustment (0.6) (1.1)
2,135.4 1,965.2
$ 5,224.9 $ 5,051.5
Contingent liabilities (Note 19)
Subsequent events (Note 27)
Approved on behalf of the Board
Director Director
See accompanying notes to the consolidated fi nancial statements
70 CONSOLIDATED FINANCIAL STATEMENTS
Consolidated Balance Sheets
9928_Back-Eng_Final v1a.indd 709928_Back-Eng_Final v1a.indd 70 7/26/07 8:00:54 AM7/26/07 8:00:54 AM

52 Weeks Ended(in millions) May 5, 2007 May 6, 2006
Balance, beginning of year $ 1,771.0 $ 1,515.5Net earnings 210.1 296.8Adjustment to minority interest (Note 26) – (3.6)Dividends Preferred shares (0.4) (0.3) Common shares (39.5) (36.7)Premium on common shares purchased for cancellation (Note 11) (1.6) (0.7)
Balance, end of year $ 1,939.6 $ 1,771.0
See accompanying notes to the consolidated fi nancial statements
EMPIRE COMPANY LIMITED 2007 ANNUAL REPORT 71
Consolidated Statements of Retained Earnings
9928_Back-Eng_Final v1a.indd 719928_Back-Eng_Final v1a.indd 71 7/26/07 8:00:55 AM7/26/07 8:00:55 AM

52 Weeks Ended May 5, 2007 May 6, 2006(in millions except per share amounts) Restated (Note 1)
Revenue $ 13,366.7 $ 13,063.6Operating expenses Cost of sales, selling and administrative expenses 12,724.0 12,378.2 Depreciation and amortization 243.9 225.8
398.8 459.6Investment income (Note 12) 41.5 31.8
Operating income 440.3 491.4
Interest expense Long-term debt 54.1 75.6 Short-term debt 6.0 8.2
60.1 83.8
380.2 407.6Capital gains and other items (Note 13) 7.1 109.4
Earnings before income taxes and minority interest 387.3 517.0
Income taxes (Note 14)
Current 104.8 141.8 Future 15.4 11.3
120.2 153.1
Earnings before minority interest 267.1 363.9Minority interest 57.0 67.1
Net earnings $ 210.1 $ 296.8
Earnings per share (Note 4)
Basic $ 3.20 $ 4.53
Diluted $ 3.19 $ 4.51
Weighted average number of common shares outstanding, in millions Basic 65.6 65.5
Diluted 65.7 65.7
See accompanying notes to the consolidated fi nancial statements
72 CONSOLIDATED FINANCIAL STATEMENTS
Consolidated Statements of Earnings
9928_Back-Eng_Final v1a.indd 729928_Back-Eng_Final v1a.indd 72 7/27/07 10:58:09 PM7/27/07 10:58:09 PM

52 Weeks Ended(in millions) May 5, 2007 May 6, 2006
OPERATING ACTIVITIES
Net earnings $ 210.1 $ 296.8 Items not affecting cash (Note 15) 387.5 254.4 Preferred dividends (0.4) (0.3)
597.2 550.9 Net change in non-cash working capital (147.8) 75.7
Cash fl ows from operating activities 449.4 626.6
INVESTING ACTIVITIES
Net decrease (increase) in investments 185.4 (132.0) Net proceeds from sale of Wajax Income Fund – 50.8 Proceeds from sale of property to Crombie REIT – 267.7 Purchase of shares in subsidiary, Sobeys Inc. (48.6) (49.5) Purchase of property, equipment and other (545.2) (546.4) Proceeds from sale of other property 68.9 29.3 Business acquisitions, net of cash acquired (95.9) (92.8)
Cash fl ows used in investing activities (435.4) (472.9)
FINANCING ACTIVITIES
Decrease in bank indebtedness (68.5) (110.6) Increase in construction loans 1.2 – Issue of long-term debt 159.6 409.5 Repayment of long-term debt (103.0) (362.5) Minority interest (8.3) 6.0 Repurchase of preferred shares (0.8) – Issue of Non-Voting Class A shares 1.0 0.8 Repurchase of Non-Voting Class A shares for cancellation (1.9) (0.8) Common dividends (39.5) (36.7)
Cash fl ows used in fi nancing activities (60.2) (94.3)
(Decrease) increase in cash and cash equivalents (46.2) 59.4Cash and cash equivalents, beginning of year 341.1 281.7
Cash and cash equivalents, end of year $ 294.9 $ 341.1
See accompanying notes to the consolidated fi nancial statements
EMPIRE COMPANY LIMITED 2007 ANNUAL REPORT 73
Consolidated Statements of Cash Flows
9928_Back-Eng_Final v1a.indd 739928_Back-Eng_Final v1a.indd 73 7/26/07 8:00:56 AM7/26/07 8:00:56 AM

BASIS OF CONSOLIDATION
Empire Company Limited (the “Company”) is a diversifi ed Canadian company whose key businesses include food retailing, real estate and corporate investment activities. These consolidatedfi nancial statements have been prepared in accordance with Canadian generally accepted accounting principles (“GAAP”), and include the accounts of the Company, all subsidiary companies, including 72.1% owned Sobeys Inc. (“Sobeys”), and certain enterprises considered variable interest entities (“VIEs”) where control is achieved on a basis other than through ownership of a majority of voting rights. Investments in which the Company has signifi cant infl uence are accounted for by the equity method. Investments in signifi cant joint ventures are consolidated on a proportionate basis.
The Company’s fi scal year ends on the fi rst Saturday in May. As a result of this, the fi scal year is usually 52 weeks but results in a duration of 53 weeks every fi ve to six years.
CHANGES IN ACCOUNTING POLICIES
ADOPTED DURING FISCAL 2007
Vendor considerationDuring the fi rst quarter of fi scal 2007, the Company implemented, on a retroactive basis, the Canadian Institute of Chartered Accountants (“CICA”) Emerging Issues Committee (“EIC”) Abstract 156, “Accounting by a Vendor for Consideration Given to a Customer (including a Reseller of the Vendor’s Products)”. This abstract requires a vendor to generally record cash consideration given to a customer as a reduction to the selling price of the vendor’s products or services and refl ect it as a reduction of revenue when recognized in the statement of earnings.
Prior to the implementation of EIC-156, the Company recorded certain sales incentives paid to independent franchisees, associates and independent accounts in cost of sales, selling and administrative expenses on the statement of earnings. Accordingly, the implementation of EIC-156 on a retroactive basis resulted in a reduction in both revenue and cost of sales, selling and administrative expenses during fi scal 2007 of $141.2 (2006 – $135.2). As reclassifi cations, these changes did not impact net earnings or earnings per share.
ADOPTED DURING FISCAL 2006
Vendor allowancesDuring the fi rst quarter of fi scal 2006, the Company adopted the amendment to EIC-144 issued in January 2005. The amendment requires disclosure of the amount of any vendor allowances that have been recognized in income but for which the full requirements for entitlement have not yet been met (see Note 25).
FUTURE CHANGES IN ACCOUNTING POLICIES
Financial instrumentsIn January 2005, the CICA issued Section 3855 of the Handbook,“Financial Instruments – Recognition and Measurement”, which describes the standards for recognizing and measuring fi nancial assets, fi nancial liabilities and derivatives. This Section requires that all fi nancial assets be measured at fair value, with some exceptions for loans and investments that are classifi ed as held-to-maturity, and that all fi nancial liabilities be measured at fair value if they are derivatives or classifi ed as held for trading purposes. Other financial liabilities are measured at their amortized cost, and all derivative financial instruments are measured at fair value, even when they are part of a hedging relationship.
The CICA has also reissued Handbook Section 3860 as Section 3861, “Financial Instruments – Disclosure and Presentation”, which establishes standards for presentation of fi nancial instruments and non-fi nancial derivatives, and identifi es the information that should be disclosed about them.
These changes are applicable to the Company for the fi rst quarter of fi scal 2008. The effect of adopting this Section is not expected to be signifi cant as investments, at a cost of $188.2,have been sold in the fi rst quarter of fi scal 2008 (see Note 27).
HedgesIn January 2005, the CICA issued Section 3865 of the Handbook, “Hedges”, which describes how and when hedge accounting can be used.
Hedging is an activity used to change an exposure to one or more risks by creating an offset between changes in the fair value of a hedged item and a hedging item, changes in the cash fl ows attributable to a hedged item and a hedging item, or changes resulting from a risk exposure related to a hedged item and a hedging item.
Note 1 Summary of Signifi cant Accounting Policies
Notes to the Consolidated Financial Statements
May 5, 2007 (in millions except share capital)
74 NOTES TO THE CONSOLIDATED FINANCIAL STATEMENTS
9928_Back-Eng_Final v1a.indd 749928_Back-Eng_Final v1a.indd 74 7/26/07 8:00:56 AM7/26/07 8:00:56 AM

Under hedge accounting, all gains, losses, revenues and expenses from the derivative and the item it hedges are recorded in the statement of earnings or the other comprehensive income statement in the same period.
These changes are applicable to the Company for the fi rst quarter of fi scal 2008. The effect of adopting this section is not expected to be signifi cant.
Comprehensive incomeIn January 2005, the CICA issued Handbook Section 1530, “Comprehensive Income”. The section describes how to report and disclose comprehensive income and its components. The main components of other comprehensive income include unrealized gains and losses on available-for-sale investments, and gains and losses on cash fl ow hedges.
These changes are applicable to the Company for the fi rst quarter of fi scal 2008. The effect of adopting these sections is not expected to be signifi cant.
InventoriesIn March 2007, the CICA issued Handbook Section 3031, “Inventories”, which has replaced existing Section 3030 with the same title. The new Section establishes that inventories should be measured at the lower of cost and net realizable value, with guidance on the determination of cost. The new standard is effective for interim and annual fi nancial statements relating to fi scal years beginning on or after January 1, 2008 and is therefore applicable for the Company’s fi rst quarter of fi scal 2009. The Company is currently evaluating the impact of this new standard.
Accounting changesIn July 2006, the CICA issued Handbook Section 1506, “Accounting Changes”, which describes the criteria for changing accounting policies, along with the accounting and disclosure for changes in accounting policies, changes in accounting estimates and corrections of errors. These changes came into effect as of January 1, 2007 and are applicable for the fi rst quarter of fi scal 2008.
CASH AND CASH EQUIVALENTS
Cash and cash equivalents are defi ned as cash, treasury bills and guaranteed investments with a maturity less than 90 days at date of acquisition.
INVENTORIES
Warehouse inventories are valued at the lower of cost and net realizable value with cost being determined on a fi rst-in, fi rst-out (“FIFO”) or a moving average cost basis. Retail inventories are valued at the lower of cost and net realizable value. Cost is determined using FIFO or the retail method. The retail method uses the anticipated selling price less normal profi t margins, substantially on an average cost basis. Real estate inventory of residential properties is carried at the lower of cost and net realizable value.
PORTFOLIO INVESTMENTS
Portfolio investments are accounted for under the cost method. Investment income is recognized on an accrual basis. Portfolio investments are written down when the inherent loss is determined to be other than temporary. Gains and losses on sale of investments are recorded in earnings as realized.
PROPERTY AND EQUIPMENT
Property and equipment is recorded at net book value, being original cost less accumulated depreciation and any writedowns for impairment.
Depreciation on real estate buildings is calculated using the straight-line method with reference to each property’s book value, its estimated useful life (not exceeding 40 years) and its residual value. Deferred leasing costs are amortized over the terms of the related leases.
Depreciation of other property and equipment is recorded on a straight-line basis over the estimated useful lives of the assets as follows:
Equipment 3 – 20 yearsBuildings 10 – 40 yearsLeasehold improvements Lesser of lease term and 7 – 10 years
Property and equipment is reviewed for impairment when events or circumstances indicate that the carrying value exceeds the sum of the undiscounted future cash fl ows expected from use and eventual disposal. Property and equipment is reviewed for impairment annually. The carrying value of the property and equipment is also reviewed whenever events or changes in circumstances indicate that the carrying value of property and equipment may not be recoverable. If property and equipment is determined to be impaired, the impairment loss is measured at the excess of the carrying value over fair value.
EMPIRE COMPANY LIMITED 2007 ANNUAL REPORT 75
9928_Back-Eng_Final v1a.indd 759928_Back-Eng_Final v1a.indd 75 7/26/07 8:00:56 AM7/26/07 8:00:56 AM

Assets to be disposed are classifi ed as held for sale and are no longer depreciated. Assets held for sale are recognized at the lower of book value and fair value less cost of disposal.
The Company follows the full cost method of accounting for its exploration and development of petroleum and natural gas reserves. Costs initially capitalized are depleted and depreciated using the unit-of-production method based on production volumes, before royalties, in relation to the Company’s share of estimated proved petroleum and natural gas reserves.
CAPITALIZATION OF COSTS
(a) Construction projectsCertain subsidiary companies and joint ventures capitalize interest during the construction period until the project opening date. The amount of interest capitalized to construction in progress in the current year was $1.5 (2006 – $0.5).
(b) Commercial propertiesCertain subsidiaries and joint ventures capitalize the direct carrying and operating costs applicable to the unleased areas of each new project for a reasonable period from the project opening date until a certain level of occupancy is reached. No amounts were capitalized in fi scal 2006 or 2007.
(c) Development properties and land held for future developmentA subsidiary company capitalizes interest, real estate taxes and other expenses to the extent that they relate to properties for immediate development. To the extent that the resulting carrying value exceeds its fair market value, the excess is charged against income. The carrying costs on the balance of properties held for future development are capitalized as incurred. An amountof $0.7 (2006 – $0.2) was capitalized during the year.
LEASES
Leases meeting certain criteria are accounted for as capital leases. The imputed interest is charged against income. If the lease contains a term that allows ownership to pass to the Company or there is a bargain purchase option the capitalized value is depreciated over the estimated useful life of the related asset. Otherwise the capitalized value is depreciated on a straight-line basis over the lesser of the lease term and its estimated useful life. Capital lease obligations are reduced by rental payments net of imputed interest. All other leases are accounted for as operating leases.
Lease allowances and incentives received are recorded as a deferred credit and amortized as a reduction of lease expense over the terms of the lease. Real estate lease expense is amortized straight-line over the entire term of the lease including free rent periods related to store fi xturing. A store fi xturing period varies by store but is generally considered to be one month prior to the store opening.
GOODWILL
Goodwill represents the excess of the purchase price of the business acquired over the fair value of the underlying net tangible and intangible assets acquired at the date of acquisition. Goodwill is not amortized but rather is subject to an annual impairment review or more frequently if circumstances exist that might indicate the value is impaired. Should the carrying value exceed the fair value, the carrying value will be written down to the fair value.
INTANGIBLES
Intangibles arise on the purchase of a new business, existing franchises and the acquisition of pharmacy prescription fi les. Amortization on limited life intangibles is recorded on a straight-line basis over 10-15 years. Intangible assets with indefi nite useful lives are not amortized but rather are subject to an annual impairment review or more frequently if circumstances exist that might indicate their value is impaired. Should the carrying value exceed the fair value of intangible assets (e.g. trademarks), the carrying value will be written down to the fair value.
DEFERRED COSTS
Deferred costs consist of deferred store marketing, deferred fi nancing and deferred purchase agreements and are included in other assets.
Deferred costs are amortized on a straight-line basis as follows:
Deferred store marketing – up to 7 years Deferred fi nancing – over the term of the debt Deferred purchase agreements – over the term of the
purchase agreement
ASSETS HELD FOR SALE
Certain land and buildings have been listed for sale and reclassifi ed as “Assets held for sale” in accordance with CICA Handbook Section 3475, “Disposal of Long-lived Assets and Discontinued Operations”. These assets are expected to be sold within a twelve month period, are no longer productive assets and there is no longer an intent to develop for future use. Assets held for sale are valued at the lower of book value and fair value less cost of disposal.
STORE OPENING EXPENSES
Opening expenses of new stores and store conversions are written off on a straight-line basis during the fi rst year of operation.
FUTURE INCOME TAXES
The Company accounts for income taxes under the liability method. The difference between the tax basis of assets and liabilities and their carrying value on the balance sheet is used
76 NOTES TO THE CONSOLIDATED FINANCIAL STATEMENTS
9928_Back-Eng_Final v1a.indd 769928_Back-Eng_Final v1a.indd 76 7/26/07 8:00:56 AM7/26/07 8:00:56 AM

to calculate future tax assets and liabilities. The future tax assets and liabilities have been measured using substantively enacted tax rates that will be in effect when the differences are expected to reverse.
DEFERRED REVENUE
Deferred revenue consists of long-term supplier purchase agreements, rental revenue arising from the sale of subsidiaries and gains on sale leaseback transactions. Deferred revenue is being taken into income on a straight-line basis over the term of the related agreements.
FOREIGN CURRENCY TRANSLATION
Assets and liabilities of self-sustaining foreign investments are translated at exchange rates in effect at the balance sheet date. The revenues and expenses are translated at average exchange rates for the year. Cumulative gains and losses on translation are shown as a separate component of shareholders’ equity.
Other assets and liabilities are translated at the exchange rate in effect at the balance sheet date. These exchange gains or losses are recognized in operating income. Revenues and expenses denominated in foreign currencies are translated into Canadian dollars at the average exchange rate for the period.
REVENUE RECOGNITION
Food sales are recognized at the point-of-sale. Sales include revenues from customers through corporate stores operated by the Company and consolidated VIEs, and revenue from sales to non-VIE franchised stores, affi liated stores and independent accounts. Revenue received from non-VIE franchised stores, affi liated stores and independent accounts is mainly derived from the sale of product. The Company also collects franchise fees under two types of arrangements. Franchise fees contractually due based on the dollar value of product shipped are recorded as revenue when the product is shipped. Franchise fees contractually due based on the franchisee’s retail sales are recorded as revenue weekly upon invoicing based on the franchisee’s retail sales. Real Estate revenue is recognized in accordance with the lease agreements with tenants on a straight-line basis.
FINANCIAL INSTRUMENTS
The Company uses various derivative fi nancial instruments to hedge its exposure to foreign exchange and interest rate risks. If documentation and effectiveness requirements are met, gains and losses on these instruments are deferred and recognized in earnings in the same period the related hedged risk is realized (settlement accounting). If effectiveness requirements are not met,gains and losses on these instruments are recognized in earningsas the fair value of the instrument changes. Amounts received or paid, including any gains and losses on instruments used to hedge these risks are recognized over the term of the hedged item. The derivatives are not recorded on the balance sheet.
PENSION BENEFIT PLANS AND OTHER BENEFIT PLANS
The cost of the Company’s pension benefi ts for defi ned contribution plans are expensed at the time active employees are compensated. The cost of defi ned benefi t pension plans and other benefi t plans is accrued based on actuarial valuations, which are determined using the projected benefi t method pro-rated on service and management’s best estimate of the expected long-term rate of return on plan assets, salary escalation, retirement ages and expected growth rate of health care costs.
Current market values are used to value benefi t plan assets. The obligation related to employee future benefi ts is measured using current market interest rates, assuming a portfolio of Corporate AA bonds with terms to maturity that, on average, match the terms of the obligation.
The impact of changes in plan amendments is amortized on a straight-line basis over the expected average remaining service life (“EARSL”) of active members. For pension benefi t plans, the actuarial gains and losses and the impact of changes in the actuarial basis in excess of 10% of the greater of the projected benefi t obligation and the market value of assets are amortized on a straight-line basis over the EARSL of the active members. For the Company’s Supplemental Executive Retirement Plan, the impact of changes in the plan provisions are amortized over fi ve years. For other benefi t plans, actuarial gains and losses are recognized immediately.
USE OF ESTIMATES
The preparation of consolidated fi nancial statements in conformity with Canadian generally accepted accounting principles, requires management to make estimates and assumptions that affect the amounts reported in the consolidated fi nancial statements and accompanying notes. Certain of these estimates require subjective or complex judgements by management that may be uncertain. Some of these items include the valuation of inventories, goodwill, employee future benefi ts and income taxes. Changes to these estimates could materially impact the fi nancial statements. These estimates are based on management’s best knowledge of current events and actions that the Company may undertake in the future. Actual results could differ materially from these estimates.
EARNINGS PER SHARE
Earnings per share is calculated by dividing the earnings available to common shareholders by the weighted average number of common shares outstanding during the year. Diluted earnings per share is calculated using the treasury stock method.
EMPIRE COMPANY LIMITED 2007 ANNUAL REPORT 77
9928_Back-Eng_Final v1a.indd 779928_Back-Eng_Final v1a.indd 77 7/26/07 8:00:56 AM7/26/07 8:00:56 AM

On June 6, 2005, the shareholders of Wajax Limited, an equity accounted investment, approved a Plan of Arrangement to convert into Wajax Income Fund (“Wajax”). The Company owned approximately 45% of the outstanding shares of Wajax Limited (on a fully diluted basis). The Plan of Arrangement was completed on June 15, 2005 with the Company receiving one unit of Wajax for each Wajax Limited share held. Through a secondary offering on June 21, 2005, the Company sold a total of 2.5 million Wajax units for net proceeds of approximately $44.0. On June 29, 2005, the underwriter exercised their over-allotment option to purchase 375,000 Wajax units at $19.25 per
unit, resulting in additional net proceeds of $6.8. This reduced the Company’s ownership percentage to approximately 27.6%. Details of the sale are as follows:
Net proceeds $ 50.8Book value 21.1
29.7Equity share of income fund conversion-related items 4.1
Capital gain before income taxes 25.6Income taxes 2.1
Net capital gain $ 23.5
Note 2 Sale of Wajax Income Fund
Note 3 Sale of Property to Crombie REIT
On March 23, 2006, the Company’s real estate segment sold 44 commercial properties to Crombie Real Estate Investment Trust (“Crombie REIT”). Included in the proceeds is an interest in Crombie REIT giving the Company effective ownership of 48.3%. The Company’s investment in Crombie REIT is accounted using the equity method. Details of the sale are as follows:
Proceeds Cash $ 267.7 Investment in Crombie REIT 200.8
468.5
Book value of assets sold and liabilities assumed Property and equipment 593.2 Net working capital (1.0) Employee future benefi ts obligation (2.2) Future income taxes (44.7) Long-term debt (312.9)
232.4Early extinguishment of long-term debt 25.4Share of issue costs 9.4Other costs 17.1
284.3
Capital gain before deferral and income taxes 184.2Deferral of capital gain related to retained interest (88.2)
Capital gain before income taxes 96.0Income taxes 19.8
Net capital gain $ 76.2
78 NOTES TO THE CONSOLIDATED FINANCIAL STATEMENTS
9928_Back-Eng_Final v1a.indd 789928_Back-Eng_Final v1a.indd 78 7/26/07 8:00:56 AM7/26/07 8:00:56 AM

Note 4 Earnings Per Share
Earnings per share amounts are calculated on the weighted average number of shares outstanding after providing for preferred share dividends accrued to the balance sheet date. Diluted earnings per share is calculated on the assumption that all the outstanding stock options were exercised and share purchase loans were repaid at the beginning of the year.
Earnings applicable to common shares is comprised of the following:
2007 2006
Operating earnings $ 204.4 $ 202.0Capital gains and other items, net of tax of $1.4 (2006 – $14.4) 5.7 94.8
Net earnings 210.1 296.8Preferred share dividends (0.4) (0.3)
Earnings applicable to common shares $ 209.7 $ 296.5
Earnings per share is comprised of the following:
2007 2006
Operating earnings $ 3.11 $ 3.08Capital gains and other items 0.09 1.45
Basic earnings per share $ 3.20 $ 4.53
Operating earnings $ 3.10 $ 3.07Capital gains and other items 0.09 1.44
Diluted earnings per share $ 3.19 $ 4.51
Note 5 Investments, at Equity
May 5, 2007 May 6, 2006
Wajax Income Fund (27.6% interest) $ 32.2 $ 33.1Crombie REIT (48.1% interest) 109.3 112.8U.S. residential real estate partnerships 1.3 11.6
$ 142.8 $ 157.5
EMPIRE COMPANY LIMITED 2007 ANNUAL REPORT 79
9928_Back-Eng_Final v1a.indd 799928_Back-Eng_Final v1a.indd 79 7/26/07 8:00:57 AM7/26/07 8:00:57 AM

The Company’s carrying value of its investment in Wajax Income Fund is as follows:
May 5, 2007 May 6, 2006
Balance, beginning of year $ 33.1 $ 55.1Equity earnings 20.6 16.3Distributions received (21.5) (13.1)Book value of equity interest sold – (25.2)
Balance, end of year $ 32.2 $ 33.1
The Company’s carrying value of its investment in Crombie REIT is as follows:
May 5, 2007 May 6, 2006
Balance, beginning of year $ 112.8 $ –Interest received in Crombie REIT – 200.8Less deferral of gain due to retained interest (88.2)Equity earnings 11.6 0.2Distributions received (15.1) –
Balance, end of year $ 109.3 $ 112.8
Note 6 Property and Equipment
May 5, 2007 Accumulated Net Cost Depreciation Book Value
Food segment Land $ 152.8 $ – $ 152.8 Land held for future development 129.0 – 129.0 Buildings 782.5 161.7 620.8 Equipment 1,819.5 1,170.1 649.4 Leasehold improvements 397.9 243.9 154.0 Assets under capital leases 83.1 34.5 48.6
3,364.8 1,610.2 1,754.6
Real estate and other segments Land 78.8 – 78.8 Land held for future development 26.8 – 26.8 Buildings 399.1 102.2 296.9 Equipment 72.7 32.6 40.1 Leasehold improvements 52.4 12.1 40.3 Petroleum and natural gas costs 78.7 13.3 65.4
708.5 160.2 548.3
Total $ 4,073.3 $ 1,770.4 $ 2,302.9
80 NOTES TO THE CONSOLIDATED FINANCIAL STATEMENTS
9928_Back-Eng_Final v1a.indd 809928_Back-Eng_Final v1a.indd 80 7/26/07 8:00:57 AM7/26/07 8:00:57 AM

May 6, 2006 Accumulated Net Cost Depreciation Book Value
Food segment Land $ 138.6 $ – $ 138.6 Land held for future development 89.5 – 89.5 Buildings 681.1 135.7 545.4 Equipment 1,707.4 1,062.7 644.7 Leasehold improvements 361.0 218.2 142.8 Assets under capital leases 78.9 27.7 51.2
3,056.5 1,444.3 1,612.2
Real estate and other segments Land 79.6 – 79.6 Land held for future development 23.6 – 23.6 Buildings* 385.9 94.1 291.8 Equipment 69.4 26.9 42.5 Leasehold improvements 51.6 8.3 43.3 Petroleum and natural gas costs 54.0 3.4 50.6
664.1 132.7 531.4
Total $ 3,720.6 $ 1,577.0 $ 2,143.6
* During the year ended May 6, 2006, based on revised estimates of holding periods, it was determined that the carrying value of fi ve commercial properties was impaired. Accordingly, the Company recorded an impairment charge of $27.4 to reduce their carrying value to estimated fair value using external appraisals.
Note 7 Other Assets
May 5, 2007 May 6, 2006
Loans and mortgages receivable $ 65.1 $ 68.4Deferred costs 144.3 101.4Accrued benefi t asset (Note 21) 42.7 36.2Restricted cash 5.7 14.7Other 48.6 25.4Intangibles (less accumulated amortization of $11.7; 2006 – $7.6) 38.2 27.2
$ 344.6 $ 273.3
LOANS RECEIVABLE
Loans receivable represent long-term fi nancing to certain retail associates. These loans are primarily secured by inventory, fi xtures and equipment, bear various interest rates and have repayment terms up to ten years. The carrying amount of the loans receivableapproximates fair value based on the variable interest rates charged on the loans and the operating relationship of the associates with the Company.
The loans and mortgages receivable are net of current portions of $14.5 (2006 – $15.9).
EMPIRE COMPANY LIMITED 2007 ANNUAL REPORT 81
9928_Back-Eng_Final v1a.indd 819928_Back-Eng_Final v1a.indd 81 7/26/07 8:00:57 AM7/26/07 8:00:57 AM

As security for certain bank loans the Company has provided an assignment of certain marketable securities and, in certain divisions and subsidiaries, general assignments of receivables and leases, fi rst fl oating charge debentures on assets and the assignment of proceeds of fi re insurance policies.
Under the terms of a credit agreement entered into between the Company and a banking syndicate, a revolving term credit facility of $300.0 was established. During the third quarter of fi scal 2006, the expiry date of the revolving unsecured credit facility was extended from June 22, 2006 to December 20, 2010. All indebtedness and obligations under the agreement shall be payable in full on December 20, 2010. Interest payable on this facility fl uctuates with changes in the prime interest rate.
Note 8 Bank Indebtedness
Note 9 Long-term Debt
May 5, 2007 May 6, 2006
Real EstateFood and other
Segment Segments Total Total
First mortgage loans, average interest rate 9.3%, due 2008-2026 $ 25.2 $ 130.4 $ 155.6 $ 167.2Medium Term Notes, interest Rate 5.8%, due October 6, 2036 125.0 – 125.0 –Medium Term Notes, interest rate 6.1%, due October 29, 2035 175.0 – 175.0 175.0Medium Term Notes, interest rate 7.2%, due February 26, 2018 100.0 – 100.0 100.0Debentures, average interest rate 10.4%, due 2008-2016 58.1 30.7 88.8 95.7Notes payable and other debt primarily at interest rates fl uctuating with the prime rate 79.7 101.3 181.0 215.6Capital lease obligations, net of imputed interest 49.7 – 49.7 49.2
612.7 262.4 875.1 802.7Less amount due within one year 30.0 52.5 82.5 95.4
$ 582.7 $ 209.9 $ 792.6 $ 707.3
Long-term debt is secured by land and buildings, specifi c charges on certain assets and additional security as described in Note 8. Capital lease obligations are secured by the related capital lease asset.
On October 21, 2005, the Company fi led a short form base shelf prospectus providing for the issuance of up to $500.0 of unsecured Medium Term Notes. On October 28, 2005, the
Company issued new Medium Term Notes of $175.0, maturing on October 29, 2035. On November 1, 2005, Medium Term Notes of $175.0 were repaid according to the terms of the agreement. On October 6, 2006, the Company issued new Medium Term Notes of $125.0, maturing on October 6, 2036.
During the year, the Company increased its capital lease obligation by $5.6 (2006 – $29.0) with a similar increase in assets under capital lease.
82 NOTES TO THE CONSOLIDATED FINANCIAL STATEMENTS
9928_Back-Eng_Final v1a.indd 829928_Back-Eng_Final v1a.indd 82 7/27/07 10:28:12 PM7/27/07 10:28:12 PM

Debt retirement payments and capital lease obligations in each of the next fi ve fi scal years are:
Long Term Debt Capital Leases
2008 $ 72.3 $ 10.22009 $ 74.2 $ 7.72010 $ 33.8 $ 7.22011 $ 38.8 $ 6.52012 $ 27.1 $ 5.6Thereafter $ 579.2 $ 12.5
OPERATING LEASES
The net aggregate, annual, minimum rent payable under operating leases for fi scal 2008 is approximately $178.1 ($249.1 gross less expected sub-lease income of $71.0). The commitments over the next fi ve fi scal years are:
Net Lease Gross lease Obligation Obligation
2008 $ 178.1 $ 249.12009 $ 164.7 $ 230.62010 $ 157.0 $ 219.02011 $ 151.1 $ 207.22012 $ 144.0 $ 195.8Thereafter $ 1,073.5 $ 1,392.1
Note 10 Other Liabilities
May 5, 2007 May 6, 2006
Deferred revenue $ 6.5 $ 3.3Deferred hedge gain 2.5 10.2Above market leases from acquisitions 4.4 5.0Asset retirement obligations 0.6 0.4
$ 14.0 $ 18.9
Note 11 Capital Stock
No. of Shares
AUTHORIZED
Preferred shares, par value of $25 each, issuable in series. Series 2 cumulative, redeemable, rate of 75% of prime. 2,814,1002002 Preferred Shares, par value of $25 each, issuable in series. 992,000,000Non-Voting Class A shares, without par value. 259,107,435Class B common shares, without par value, voting. 40,800,000
EMPIRE COMPANY LIMITED 2007 ANNUAL REPORT 83
9928_Back-Eng_Final v1a.indd 839928_Back-Eng_Final v1a.indd 83 7/26/07 8:00:57 AM7/26/07 8:00:57 AM

During the year, under a normal course issuer bid which expires on July 27, 2007, the Company purchased for cancellation 46,047 (2006 – 20,254) Non-Voting Class A shares. The purchase price was $1.9 of which $1.6 of the purchase price (representing the premium on common shares purchased for cancellation) was charged to retained earnings.
During the year, the Company purchased for cancellation 31,900 Series 2 preferred shares for $0.8.
During the year, 27,674 options were exercised for $0.2. Options allowed holders to purchase Non-Voting Class A shares at $6.555 per share. There are no longer any options outstanding.
During the year, 18,373 (2006 – 20,254) Non-Voting Class A shares were issued under the Company’s share purchase plan to certain offi cers and employees for $0.8 (2006 – $0.8), which was based on the average trading price of the Non-Voting Class A shares on the Toronto Stock Exchange for the fi ve previous trading days.
Loans receivable from offi cers and employees of $3.6 (2006 – $4.6) under the Company’s share purchase plan are classifi ed as a reduction of Shareholders’ Equity. Loan repayments will result in a corresponding increase in Share Capital. The loans are non-interest bearing and non-recourse, secured by 125,265 (2006 – 229,484) Non-Voting Class A shares. Market value of the shares at May 5, 2007 was $5.3 (May 6, 2006 – $9.9).
Under certain circumstances, where an offer (as defi ned in the share conditions) is made to purchase Class B common shares, the holders of the Non-Voting Class A shares shall be entitled to receive a follow-up offer at the highest price per share paid, pursuant to such offer to purchase Class B common shares.
During the year, Nil (2006 – 24,462) Class B common shares were exchanged for Nil (2006 – 24,462) Non-Voting Class A shares.
May 5, 2007 May 6, 2006
No. of Shares No. of Shares
ISSUED AND OUTSTANDING:
Preferred shares, Series 2 300,000 $ 7.5 331,900 $ 8.3Non-Voting Class A 31,174,037 184.5 31,175,047 183.7Class B common 34,560,763 7.7 34,560,763 7.7
199.7 199.7Loans receivable from offi cers and employees under share purchase plan (3.6) (4.6)
$ 196.1 $ 195.1
Note 12 Investment Income
2007 2006
Dividend and interest income $ 9.7 $ 8.3Share of earnings of companies accounted using the equity method 31.8 23.5
$ 41.5 $ 31.8
84 NOTES TO THE CONSOLIDATED FINANCIAL STATEMENTS
9928_Back-Eng_Final v1a.indd 849928_Back-Eng_Final v1a.indd 84 7/27/07 10:31:23 PM7/27/07 10:31:23 PM

Note 13 Capital Gains and Other Items
2007 2006
Gain on sale of investments $ 6.2 $ 11.6Other items 0.9 3.4Gain on sale of Wajax Income Fund (Note 2) – 25.6Gain on sale of property to Crombie REIT (Note 3) – 96.2Reduction of book value of real estate assets (Note 6) – (27.4)
$ 7.1 $ 109.4
Note 14 Income Taxes
Income tax expense varies from the amount that would be computed by applying the combined federal and provincial statutory tax rate as a result of the following:
2007 2006
Income tax expense according to combined statutory rate of 32.5% (2006 – 34.8%) $ 123.0 $ 141.8
Increase (decrease) in income taxes resulting from Rate changes effect on timing differences (2.0) (1.6) Non-taxable dividends and equity earnings (2.2) (3.5) Large corporation tax – 2.0
118.8 138.7 Capital gains and other items 1.4 14.4
$ 120.2 $ 153.1
May 5, 2007 income tax expense attributable to net earnings consists of:
Current Future Total
Operations $ 104.9 $ 13.9 $ 118.8Capital gains and other items (0.1) 1.5 1.4
$ 104.8 $ 15.4 $ 120.2
May 6, 2006 income tax expense attributable to net earnings consists of:
Current Future Total
Operations $ 127.7 $ 11.0 $ 138.7Capital gains and other items 14.1 0.3 14.4
$ 141.8 $ 11.3 $ 153.1
EMPIRE COMPANY LIMITED 2007 ANNUAL REPORT 85
9928_Back-Eng_Final v1a.indd 859928_Back-Eng_Final v1a.indd 85 7/26/07 8:00:58 AM7/26/07 8:00:58 AM

The tax effect of temporary differences that give rise to signifi cant portions of future income taxes are presented below:
May 5, 2007 May 6, 2006
Property and equipment $ 71.3 $ 64.1Investments 38.9 59.0Employee future benefi ts obligation (34.9) (34.8)Restructuring provisions (11.6) (5.0)Pension contributions 18.6 17.4Deferred costs 41.0 28.4Deferred credits 54.8 54.6Goodwill and intangibles 10.2 8.6Other (14.3) (14.4)
$ 174.0 $ 177.9
Future income taxes – current liabilities $ 40.4 $ 46.1Future income taxes – non-current liabilities 133.6 131.8
$ 174.0 $ 177.9
Note 15 Supplementary Cash Flow Information
2007 2006
a) Items not affecting cash Depreciation and amortization $ 243.9 $ 225.8 Future income taxes 15.4 10.1 Amortization of deferred items 44.4 35.8 Equity in earnings of other companies, net of dividends received – (4.1) Minority interest 46.0 55.8 Stock-based compensation 1.4 1.0 Long-term lease obligation 16.1 8.5 Employee future benefi ts obligation 4.8 4.2 Rationalization costs (Note 24) 15.5 – Gain on sale of Wajax Income Fund, net of tax of $2.1 – (23.5) Gain on sale of property to Crombie REIT, net of tax of $19.8 – (76.2) Reduction of book value of real estate assets, net of tax of $(10.4) – 17.0
$ 387.5 $ 254.4
b) Other information Net interest paid $ 58.9 $ 83.1
Net income taxes paid $ 168.2 $ 102.1
86 NOTES TO THE CONSOLIDATED FINANCIAL STATEMENTS
9928_Back-Eng_Final v1a.indd 869928_Back-Eng_Final v1a.indd 86 7/26/07 8:00:58 AM7/26/07 8:00:58 AM

Note 16 Joint Ventures
The fi nancial statements include the Company’s proportionate share of the accounts of incorporated and unincorporated joint ventures. A summary of these amounts is as follows:
May 5, 2007 May 6, 2006
Assets $ 136.3 $ 101.0
Liabilities $ 72.7 $ 60.0Equity and advances 63.6 41.0
$ 136.3 $ 101.0
2007 2006
Revenues $ 111.8 $ 98.2Expenses 41.7 43.4
Income before income taxes $ 70.1 $ 54.8
Cash provided (used) Operating activities $ 68.7 $ 62.3 Investing activities (34.2) 4.7 Financing activities 3.3 3.9
$ 37.8 $ 70.9
Note 17 Segmented Information
2007 2006
Restated (Note 1)
Revenue Food $ 13,032.0 $ 12,718.1
Real estate Commercial 38.4 137.8 Inter-segment 34.3 54.0 Residential 146.1 84.9
218.8 276.7
Investment and other operations 150.2 122.8
13,401.0 13,117.6 Elimination (34.3) (54.0)
$ 13,366.7 $ 13,063.6
2007 2006
Operating income Food $ 300.2 $ 331.6 Real estate Commercial 46.8 87.0 Residential 71.2 51.3 Investment and other operations 31.6 31.3 Corporate expenses (9.5) (9.8)
$ 440.3 $ 491.4
EMPIRE COMPANY LIMITED 2007 ANNUAL REPORT 87
9928_Back-Eng_Final v1a.indd 879928_Back-Eng_Final v1a.indd 87 7/27/07 10:32:24 PM7/27/07 10:32:24 PM

May 5, 2007 May 6, 2006
Identifi able assets Food $ 3,409.0 $ 3,119.5 Goodwill 746.5 691.7
4,155.5 3,811.2 Real estate 609.4 634.7 Investment and other operations (including goodwill of $40.1; 2006 – $40.1) 460.0 605.6
$ 5,224.9 $ 5,051.5
2007 2006
Depreciation and amortization Food $ 215.3 $ 196.6 Real estate 6.8 16.9 Investment and other operations 21.8 12.3
$ 243.9 $ 225.8
2007 2006
Capital expenditure Food $ 482.8 $ 421.3 Real estate 16.2 67.9 Investment and other operations 46.2 57.2
$ 545.2 $ 546.4
The Company operates principally in two business segments: food and real estate. The food segment consists of distribution of food products in Canada. The real estate segment consists of development and ownership of both commercial and residential properties. Commercial real estate is mainly shopping centres and offi ce buildings in Central and Eastern Canada. Residential real estate is the development of housing lots for resale. Inter-segment transactions are at market values.
Note 18 Financial Instruments
CREDIT RISK
There is no signifi cant concentration of credit risk. The credit risk exposure is considered normal for the business.
FAIR VALUE OF FINANCIAL INSTRUMENTS
The book value of cash and cash equivalents, receivables, incometaxes receivable, loans and mortgages, bank indebtedness, and accounts payable and accrued liabilities approximate fair values at May 5, 2007. The fair value of investments is $717.1 (May 6, 2006 – $824.2).
The total fair value of long-term debt is estimated to be $907.5 (May 6, 2006 – $866.4). The fair value of variable rate long-term debt is assumed to approximate its carrying amount. The fair value of other long-term debt has been estimated by discounting future cash fl ows at a current rate offered for debt of similar maturities and credit quality.
INTEREST RATE RISK
The majority of the Company’s debt is at fi xed rates. Accordingly, there is limited exposure for interest rate risk.
The Company has fi xed the interest rate on $20 of its long term debt at 4.28% by utilizing interest rate exchange agreements of which $10 expires in December, 2011 and $10 expires in January, 2012. The fair value of these contracts at year-end was nil.
FOREIGN CURRENCY RISK
Investments include $44.5 Canadian that is denominated in U.S. funds. Bank indebtedness includes $4.5 Canadian that is denominated in U.S. funds and it acts as a partial hedge to the foreign exchange fl uctuations inherent in the residual value of certain equipment.
At May 5, 2007, there are outstanding forward exchange contracts to sell a notional amount of $31.0, maturing over the next 12 months at a weighted average rate of U.S. 87.90 cents per Canadian dollar. The fair value of the outstanding forward exchange contracts, based on settlement requirements at May 5, 2007, is a positive value of U.S. $0.9 due to the strengthening of the Canadian dollar since the dates on which the contracts were entered.
The Company also uses forward contracts to fi x the exchange rate on some of its expected requirements for Euros and U.S. dollars. Amounts received or paid related to instruments used to hedge foreign exchange, including any gains and losses, are recognized in the cost of purchases. The fair value of these contracts at year end was $0.9.
88 NOTES TO THE CONSOLIDATED FINANCIAL STATEMENTS
9928_Back-Eng_Final v1a.indd 889928_Back-Eng_Final v1a.indd 88 7/27/07 10:35:40 PM7/27/07 10:35:40 PM

At May 5, 2007 the Company was contingently liable for letters of credit issued in the aggregate amount of $48.5 (May 6, 2006 – $47.6).
Sobeys has guaranteed certain bank loans contracted by franchise affi liates. As at May 5, 2007 these loans amounted to approximately $2.9 (May 6, 2006 – $1.3).
Sobeys has guaranteed certain equipment leases of its franchise affi liates. Under the terms of the guarantee should a franchise affi liate be unable to fulfi ll their lease obligation, Sobeys would be required to fund the difference of the lease commitments up to a maximum of $100.0 on a cumulative basis. Sobeys approves each of the contracts. The aggregate, annual, minimum rent payable under the guaranteed operating equipment leases for fi scal 2008 is approximately $29.4. The guaranteed lease commitments over the next fi ve fi scal years are:
Guaranteed lease commitments
2008 $ 29.42009 $ 25.52010 $ 21.72011 $ 17.02012 $ 6.4Thereafter $ –
Upon entering into the lease of its Mississauga distribution centre in March 2000, Sobeys guaranteed to the landlord the performance, by SERCA Foodservice, of all its obligation under the lease. The remaining term of the lease is 13 years with an aggregate obligation of $40.4 (2006 – $43.3). At the time of the sale of assets of SERCA Foodservice to Sysco Corp., the lease of the Mississauga distribution centre was assigned to and assumed by the purchaser, and Sysco Corp. agreed to indemnify and hold Sobeys harmless from any liability it may incur pursuant to its guarantee.
On June 21, 2005 Sobeys received a notice of reassessment from Canada Revenue Agency (“CRA”) for fi scal years 1999 and 2000 related to the Goods and Services Tax (“GST”). CRA asserts that Sobeys was obliged to collect GST on sales of tobacco products to Status Indians. The total tax, interest and penalties in the reassessment was $13.6. Sobeys has reviewed this matter, has received legal advice and believes it
was not required to collect GST. During the second quarter of fi scal 2006, Sobeys fi led a Notice of Objection with CRA. Accordingly the company has not recorded in its statement of earnings any of the tax, interest or penalties in the notice of reassessment. Sobeys has deposited with CRA funds to cover the total tax, interest and penalties in the reassessment and has recorded this amount as a long-term receivable from CRA pending resolution of the matter.
In the third quarter of fi scal 2007, Sobeys was named as a defendant in a lawsuit brought by benefi ciaries of a multi-employer pension plan. The lawsuit alleges mismanagement of certain pension plan investments by the trustees of the pension plan and seeks, among other remedies, payment of $1,000.0 in damages from the trustees and the contributing employers, of which Sobeys is one of approximately 440. Sobeys played no role in the management of the pension plan and intends to contest the lawsuit. Accordingly, the Company has not recorded in its statement of earnings any amount related to this lawsuit.
The Company and certain subsidiaries are presently under audit by CRA and certain provincial taxing authorities for fi scal years 2001 through 2006. The principal matters under audit are:
a) The tax treatment of gains realized on the sale of shares in Hannaford Bros. Co. (“Hannaford”) in fi scal 2001;
b) The tax treatment of gains realized on the sale of shares in Delhaize America Inc. in fi scal years 2001 and 2002; and
c) The taxation of income from certain of the Company’s real estate investments for fi scal years 2003 to 2006.
Reassessments have been received in respect of the sale of shares of Hannaford. In the event that the tax authorities are successful in respect of the Hannaford transaction, which the Company believes is unlikely, the maximum potential exposure in excess of provisions taken is approximately $30.0.
The Company has appealed the reassessments in respect of the sale of Hannaford shares. The Company expects that it will be substantially successful on its appeals of each of these reassessments. The Company also believes that the ultimate resolution of these matters will not, in any event, have a material impact on earnings because it has made adequate provisions for each of these matters. Should the ultimate outcome materially differ from the provisions established, the effective tax rate and earnings of the Company could be materially affected, negatively or positively, in the period in which the matters are resolved.
Note 19 Contingent Liabilities
EMPIRE COMPANY LIMITED 2007 ANNUAL REPORT 89
9928_Back-Eng_Final v1a.indd 899928_Back-Eng_Final v1a.indd 89 7/27/07 10:35:41 PM7/27/07 10:35:41 PM

The Company entered into an agreement with Crombie REIT to fund certain property redevelopments and originally issued and recorded a note payable to Crombie REIT in the amount of $39.6 related thereto. The Company has agreed to pay for all additional costs and expenses required for the redevelopment of those properties. In the event that the redevelopment costs are less than $39.6, the savings will be paid to the Company.
The Company has agreed to indemnify its directors and offi cers and particular employees in accordance with the Company’s policies. The Company maintains insurance policies that may provide coverage against certain claims.
There are various claims and litigation, which the Company is involved with, arising out of the ordinary course of business operations. The Company’s management does not consider the exposure to such litigation to be material, although this cannot be predicted with certainty.
Note 20 Related Party Transactions
The Company rents premises from Crombie REIT. In addition, Crombie REIT provides administrative and management services to the Company. The rental payments are at fair value and the charges incurred for administrative and management services are on a cost recovery basis. The Company has non-interest bearing notes payable to Crombie REIT in the amount of $33.1.
On October 2, 2006, the Company sold two commercial properties to Crombie REIT for cash proceeds of $32.4, which was fair market value. Since the sale was to an equity accounted investment, no gain was recorded on the sale.
Note 21 Employee Future Benefi ts
The company has a number of defi ned benefi t and defi ned contribution plans providing pension and other retirement benefi ts to most of its employees.
DEFINED CONTRIBUTION PENSION PLANS
The contributions required by the employee and the employer are specifi ed. The employee’s pension depends on what level of retirement income (for example, annuity purchase) that can be achieved with the combined total of employee and employer contributions and investment income over the period of plan membership, and the annuity purchase rates at the time of the employee’s retirement.
DEFINED BENEFIT PENSION PLANS
The ultimate retirement benefi t is defi ned by a formula that provides a unit of benefi t for each year of service. Employee contributions, if required, pay for part of the cost of the benefi t, but the employer contributions fund the balance. The employer contributions are not specifi ed or defi ned within the plan text; they are based on the result of actuarial valuations which determine the level of funding required to meet the total obligation as estimated at the time of the valuation.
The Company uses December 31 as an actuarial valuation date and April 30 as a measurement date for accounting purposes for its defi ned benefi t pension plans.
Most recent Next required valuation date valuation date
Retirement December 31, December 31, Pension Plan 2004 2007
Senior Management December 31, December 31, Pension Plan 2004 2007
DEFINED CONTRIBUTION PLANS
The total expense and cash contributions for the Company’s defi ned contribution plans are as follows:
2007 $ 14.52006 $ 14.2
90 NOTES TO THE CONSOLIDATED FINANCIAL STATEMENTS
9928_Back-Eng_Final v1a.indd 909928_Back-Eng_Final v1a.indd 90 7/26/07 8:00:59 AM7/26/07 8:00:59 AM

DEFINED BENEFIT PLANS
Information about the Company’s defi ned benefi ts plans, in aggregate, is as follows:
Pension Pension Other Other Benefit Plans Benefit Plans Benefit Plans Benefit Plans
2007 2006 2007 2006
ACCRUED BENEFIT OBLIGATION
Balance, beginning of year $ 269.3 $ 267.0 $ 114.1 $ 108.7 Current service cost, net of employee contributions 2.3 2.4 2.5 2.9 Interest cost 14.9 14.5 5.9 6.1 Employee contributions 0.3 0.4 – – Divestitures – (0.8) – (2.2) Benefi ts paid (18.6) (20.0) (3.8) (3.7) Actuarial losses (gains) 20.5 5.8 (2.1) 2.3
Balance, end of year $ 288.7 $ 269.3 $ 116.6 $ 114.1
PLAN ASSETS
Market value, beginning of year $ 267.2 $ 244.4 $ – $ – Actual return on plan assets 27.9 33.0 – – Employer contributions 6.5 9.3 3.8 3.7 Employee contributions 0.3 0.4 – – Benefi ts paid (18.6) (19.9) (3.8) (3.7)
Market value, end of year $ 283.3 $ 267.2 $ – $ –
FUNDED STATUS
Defi cit $ (5.4) $ (2.1) $ (116.6) $ (114.1) Unamortized past service cost 0.5 0.7 1.0 1.1 Unamortized actuarial losses 47.6 37.6 13.5 15.7
Accrued benefit asset (liability) $ 42.7 $ 36.2 $ (102.1) $ (97.3)
EXPENSE
Current service cost $ 2.3 $ 2.5 $ 2.5 $ 2.9 Interest cost 14.9 14.5 5.9 6.1 Actual return on plan assets (27.9) (33.0) – – Actuarial losses (gains) 20.4 5.8 (2.1) 2.3
Expense (income) before adjustments 9.7 (10.2) 6.3 11.3 Expected vs actual return on plan assets 9.4 16.0 – – Recognized vs actual past service costs 0.2 0.2 0.1 0.1 Recognized vs actual actuarial (gains) losses (19.3) (3.9) 2.2 (3.5)
Net expenses $ – $ 2.1 $ 8.6 $ 7.9
CLASSIFICATION OF ACCRUED
BENEFIT ASSET (LIABILITY)
Other assets $ 68.4 $ 60.8 $ – $ – Other liabilities (25.7) (24.6) (102.1) (97.3)
Accrued benefit asset (liability) $ 42.7 $ 36.2 $ (102.1) $ (97.3)
EMPIRE COMPANY LIMITED 2007 ANNUAL REPORT 91
9928_Back-Eng_Final v1a.indd 919928_Back-Eng_Final v1a.indd 91 7/27/07 10:37:01 PM7/27/07 10:37:01 PM

Included in the above accrued benefi t obligation at year-end are the following amounts in respect of plans that are not funded:
Pension Pension Other Other Benefit Plans Benefit Plans Benefit Plans Benefit Plans
2007 2006 2007 2006
Accrued benefi t obligation $ 20.9 $ 19.9 $ 102.1 $ 97.3
The signifi cant actuarial assumptions adopted in measuring the Company’s accrued benefi t obligations are as follows (weighted-average assumptions as of May 5, 2007):
Pension Pension Other Other Benefit Plans Benefit Plans Benefit Plans Benefit Plans
2007 2006 2007 2006
Discount rate 5.00% 5.50% 5.25% 5.50%Expected long-term rate of return on plan assets 7.00% 7.00%Rate of compensation increase 4.00% 4.00%
For measurement purposes, a 10% fi scal 2007 annual rate of increase in the per capita cost of covered health care benefi ts was assumed. The cumulative rate expectation to 2016 is 5%. The expected average remaining service period of the active employees covered by the pension benefi t plans ranges from 11 to 13 years with a weighted average of 11 years at year end. The expected average remaining service period of the active employees covered by the other benefi t plans range from 12 to 16 years with a weighted average of 16 years at year end.
The table below outlines the sensitivity of the fi scal 2007 key economic assumptions used in measuring the accrued benefi t plan obligations and related expenses of the Company’s pension and other benefi t plans. The sensitivity of each key assumption has been calculated independently. Changes to more than one assumption simultaneously may amplify or reduce impact on the accrued benefi t obligations or benefi t plan expenses.
Pension Plans Other Benefit Plans
Benefit Benefit Benefit Benefit Obligations Cost(1) Obligations Cost(1)
Expected long term rate of return on plan assets 7.00% Impact of: 1% increase $ (2.8) 1% decrease $ 2.8Discount rate 5.00% 5.00% 5.25% 5.25% Impact of: 1% increase $ (32.6) $ 0.4 $ (17.2) $ (0.6) 1% decrease $ 36.7 $ (0.8) $ 20.7 $ 0.7Growth rate of health costs (2) 10.00% 10.00% Impact of: 1% increase $ 17.4 $ 1.8 1% decrease $ (13.6) $ (1.3)
(1) Refl ects the impact on the current service cost, the interest cost and the expected return on assets.(2) Gradually decreasing to 5.0% in 2016 and remaining at that level thereafter.
92 NOTES TO THE CONSOLIDATED FINANCIAL STATEMENTS
9928_Back-Eng_Final v1a.indd 929928_Back-Eng_Final v1a.indd 92 7/26/07 8:00:59 AM7/26/07 8:00:59 AM

The asset mix of the defi ned benefi t pension plans as at year end is as follows:
2007 2006
Cash and short-term investments 2.43% 3.32%Bonds, debenture, fi xed income pooled funds and real estate funds 18.20% 17.92%Equities and pooled equities fund 78.55% 77.91%Accrued interest and dividends 0.22% 0.20%Foreign currency hedges 0.60% 0.65%
Total investments 100.00% 100.00%
Within these securities are investments in Empire Company Limited. The market value of these shares at year end are as follows:
% of plan % of plan2007 assets 2006 assets
$ 92.2 9.3% $ 93.4 10.2%
Note 22 Business Acquisitions
SOBEYS
During fi scal 2007, the Company increased its ownership interest in Sobeys from 70.3% to 72.1% by way of purchase of shares on the open market. The acquisition was accounted using the purchase method with operating results being included in the consolidated fi nancial statements from the date of each share acquisition. The cash consideration paid was $48.6, goodwill increased by $13.0 and minority interest decreased by $35.6.
During fi scal 2006, the Company increased its ownership interest in Sobeys from 68.4% to 70.3% by way of purchase of shares on the open market. The acquisition was accounted using the purchase method with operating results being included in the consolidated fi nancial statements from the date of each share acquisition. The cash consideration paid was $49.5, goodwill increased by $13.2 and minority interest decreased by $36.3.
EMPIRE COMPANY LIMITED 2007 ANNUAL REPORT 93
9928_Back-Eng_Final v1a.indd 939928_Back-Eng_Final v1a.indd 93 7/26/07 8:00:59 AM7/26/07 8:00:59 AM

OTHER ACQUISITIONS
During fi scal 2007, Sobeys acquired franchisee stores and prescription fi les as part of its normal course of operations for total cash consideration of $16.7. The acquisitions were accounted using the purchase method with net identifi able assets recorded at $15.8 (including intangible assets of $8.2) and goodwill recorded at $0.9.
On August 27, 2006, Sobeys acquired substantially all of the food distribution assets of Achille de la Chevrotière Ltée and its associated companies (“ADL”) for an amount of $79.2. The assets acquired include 25 owned or franchised retail store operations, other wholesale supply agreements and distribution facilities in Rouyn-Noranda, Québec. Sixteen of the franchised retail store operations are considered VIEs under the Company’s policy (see Note 27). They have been included in the consolidatedresults of the Company. The acquisition was accounted using the purchase method with the results of ADL being consolidated since the acquisition date. During the third quarter, management carried out a detailed analysis and changes were made to the preliminary allocation of the excess consideration paid over net assets acquired as disclosed in the second quarter. The measurement and allocation of intangible assets was also
completed and amended from $21.5 to $6.8. As a result goodwill was adjusted from $21.7 to $41.3 to refl ect the fi nalized valuation of ADL. The fi nal purchase price allocation, which has incorporated management’s assessment of fair value, is as follows:
Consideration Cash $ 75.8 Acquisition costs 3.4
Total consideration paid 79.2
Net assets acquired Current assets 28.0 Long term assets 27.7 Current liabilities assumed (20.0) Long term liabilities assumed (4.6)
Total net assets acquired 31.1
Excess consideration paid over net assets acquired $ 48.1
Allocation of excess consideration paid over net assets acquired Intangible assets $ 6.8 Goodwill 41.3
$ 48.1
During fi scal 2006, Sobeys acquired franchisee stores and prescription fi les as part of its normal course of operations for total cash consideration of $5.3. The acquisitions were accounted using the purchase method with net identifi able assets recorded at $5.0 (including intangible assets of $1.2) and goodwill recorded at $0.3.
On September 30, 2005, ETL Canada Holdings Limited (a subsidiary of the Company) acquired 27 theatres with 202 screens located in Ontario and Western Canada from Cineplex Galaxy LP. On October 21, 2005 ETL Canada Holdings Limited further acquired one theatre with four screens in Western Canada from Motion Picture Distribution LP. The total cash consideration of the acquisitions was $87.8. The acquisitions were accounted using the purchase method with net identifi able assets recorded at $51.5 (including intangible assets of $6.0) and goodwill recorded at $36.3.
94 NOTES TO THE CONSOLIDATED FINANCIAL STATEMENTS
9928_Back-Eng_Final v1a.indd 949928_Back-Eng_Final v1a.indd 94 7/27/07 10:38:08 PM7/27/07 10:38:08 PM

During the third quarter of fi scal 2007, Sobeys completed a rationalization of administrative functions in Atlantic Canada. Sobeys also began to incur costs associated with the development of a new grocery distribution centre in Vaughan, Ontario. These costs primarily relate to severance in both the Atlantic and Ontario regions along with fi xed asset and inventory write-offs. In the fourth quarter of fi scal 2007, Sobeys also recorded rationalization costs related to its Québec distribution
network. Sobeys expects to incur additional administrative rationalization costs in the fi rst half of fi scal 2008 enabled by its continuing business process and system initiative. The dollar value of these additional costs will be quantifi ed and disclosed in the fi rst quarter of fi scal 2008. The costs associated with the organizational change are recorded as incurred as cost of sales, selling and administrative expenses in the statement ofearnings, as follows:
Note 23 Stock-based Compensation
DEFERRED SHARE UNITS
Members of the Board of Directors may elect to receive all or any portion of their fees in Deferred Share Units (“DSUs”) in lieu of cash. The number of DSUs received is determined by the market value of the Company’s Non-Voting Class A shares on each director’s fee payment date. Additional DSUs are received as dividend equivalents. DSUs cannot be redeemed for cash until the holder is no longer a director of the Company. The redemption value of a DSU equals the market value of an Empire Company Limited Non-Voting Class A share at the time of the redemption. On an ongoing basis, the Company values the DSU obligation at the current market value of a correspond-ing number of Non-Voting Class A shares and records any increase in the DSU obligation as an operating expense. At May 5, 2007, there were 66,435 (May 6, 2006 – 60,470) DSUs outstanding. During the year, the stock-based compensation expense was $0.6 (2006 – $1.0).
SHARE PURCHASE LOANS
The Company has a Share Purchase Loan plan for employees of the Company whereby loans are granted to purchase Non-Voting Class A Shares. These loans have been treated as stock-based compensation in accordance with EIC Abstract 132.
The compensation cost relating to the fi scal 2007 Share Purchase Loans was determined to be $0.2 (2006 – $0.2) with amortization of the cost over 7 years. The total increase in contributed surplus in relation to the Share Purchase Loan compensation cost for fi scal 2007 is $0.1 (2006 – $0.2). The contributed surplus balance was reduced by $0.1 in relation to shares issued under the Share Purchase Loan that have been treated as stock-based compensation that became fully vested with the employee during fi scal 2007. Shares become vested when the employees’ outstanding loan balance is reduced. The compensation cost was calculated using the Black-Scholes model with the following assumptions:
2007 2006
Expected life 7 years 7 yearsRisk-free interest rate 4.40% 4.25%Expected volatility 19.7% 21.8%Dividend yield 1.4% 1.5%
Note 24 Business Rationalization Costs
Beginning Paid Ending Liability Incurred Written off Liability Anticipated Total
Severance Atlantic $ – $ 4.7 $ 1.5 $ 3.2 $ – $ 4.7 Ontario – 5.3 0.7 4.6 – 5.3 Québec – 4.3 – 4.3 – 4.3Other costs – 1.1 1.1 – – 1.1
– 15.4 3.3 12.1 – 15.4Asset write-offs – 3.4 3.4 – – 3.4
$ – $ 18.8 $ 6.7 $ 12.1 $ – $ 18.8
EMPIRE COMPANY LIMITED 2007 ANNUAL REPORT 95
9928_Back-Eng_Final v1a.indd 959928_Back-Eng_Final v1a.indd 95 7/26/07 8:00:59 AM7/26/07 8:00:59 AM

Note 25 Vendor Allowances
The Company receives allowances from certain vendors whose products are purchased for resale. Included in these vendor programs are allowances for volume purchases, exclusivity allowances, listing fees and other allowances. The Company recognizes these allowances as a reduction of cost of sales, selling and administrative expenses and related inventories in accordance with EIC-144. Certain allowances from vendors are
contingent on the Company achieving minimum purchase levels. These allowances are recognized when it is probable that the minimum purchase level will be met, and the amount of allowance can be estimated. As of the year ended May 5, 2007, the Company has recognized $2.4 (2006 – $3.5) of allowances in income where it is probable that the minimum purchase level will be met and the amount of allowance can be estimated.
Note 26 Variable Interest Entities
Variable interest entities are defi ned under Accounting Guideline (“AcG”)-15, “Consolidation of Variable Interest Entities”, as entities that do not have suffi cient equity at risk to fi nance their activities without additional subordinated fi nancial support, or where the equity holders lack the overall characteristics of a controlling fi nancial interest. The guideline requires that the VIE be consolidated with the fi nancial results of the entity deemed to be the primary benefi ciary of the VIE’s expected losses and its expected residual returns.
The Company implemented AcG-15 on May 7, 2005 retroactively without restatement of prior periods. Entities that have been identifi ed as meeting the characteristics of a VIE were consolidated in the Company’s results effective for the fourth quarter of fi scal 2005.
The Company has identifi ed the following entities as VIEs:
FRANCHISE AFFILIATES
The Company has identifi ed 271 (May 6, 2006 – 300) franchise affi liate stores whose franchise agreements result in the Company being deemed the primary benefi ciary of the entity according to AcG-15. The results for these entities were consolidated with the results of the Company.
WAREHOUSE AND DISTRIBUTION AGREEMENT
The Company has an agreement with an independent entity to provide warehouse and distribution services for one of its distribution centres. The terms of the agreement with this entity require the Company to consolidate its results with those of the Company pursuant to AcG-15.
The Company has consolidated the results of these franchise affi liates and the entity providing warehouse and distribution services effective at the fourth quarter of fi scal 2005.
In the prior year, a charge of $3.6 (net of minority interest of $1.9) to retained earnings was required to refl ect additional minority interest in the VIEs.
96 NOTES TO THE CONSOLIDATED FINANCIAL STATEMENTS
9928_Back-Eng_Final v1a.indd 969928_Back-Eng_Final v1a.indd 96 7/26/07 8:01:00 AM7/26/07 8:01:00 AM
Note 27 Subsequent Events
(a) On April 26, 2007, the Company and Sobeys jointly announcedthat they had entered into an arrangement agreement (“the Arrangement”) pursuant to which the Company would acquire all of the outstanding common shares of Sobeys that it did not then own at a price of $58.00 per share. The transaction valued the Sobeys shares not then owned by the Company at approximately $1.06 billion.
The Arrangement required various approvals to comply with applicable corporate and securities laws: The Sobeys share-holders approved the Arrangement at a special shareholders’ meeting held on June 9, 2007 by the requisite majority; the Supreme Court of Nova Scotia gave its sanction to the Arrangement on June 13, 2007; the Arrangement became effective upon registration of the fi nal Court order with the Nova Scotia Registry of Joint Stock Companies at the close of business on June 15, 2007, at which time the Company acquired all the outstanding shares of Sobeys that it did not previously own. Subsequently, the Sobeys common shares ceased trading on the Toronto Stock Exchange, and were de-listed at the close of business on June 18, 2007.
The acquisition was fi nanced by funds of $278.0, received primarily from sale of certain portfolio investments, and by advances of $784.0 under new credit facilities (the “Credit Facilities”). The Credit Facilities consist of a $950.0 unsecured revolving credit maturing on June 8, 2010 (subject to annual extensions at the request of the Company) and a $50.0 unsecured non-revolving credit maturing June 30, 2007. The Credit Facilities are subject to certain fi nancial covenants. Interest on the debt varies based on the designation of the loan (bankers’ acceptances (“BA”) rate loans, Canadian prime rate loans, U.S. base rate loans or LIBOR loans), fl uctuations in the underlying rates, and in the case of the BA rate loans or LIBOR loans, the margin applicable to the fi nancial covenants.
On June 18, 2007, the Company entered into two delayed fi xed rate interest swaps. The fi rst swap in an amount of $200.0 is for a period of three years at a fi xed interest rate of 5.00%. The second swap in an amount of $200.0 is for a period of fi ve years at a fi xed interest rate of 5.05%. Both swaps became effective on July 23, 2007.
On June 27, 2007, pursuant to the terms of the Credit Facilities, Empire and Sobeys fi led notice with the lenders requesting the establishment of a new $300.0 million fi ve-year credit facility in favour of Sobeys at the same interest rate as the Credit Facilities. On July 23, 2007, Sobeys drew down $300.0 million from the new credit facility, the proceeds of which were used to pay a dividend to Empire. Empire used the proceeds from the dividend to reduce its indebtedness under the Credit Facilities and the Credit Facilities were reduced accordingly. On that date, Empire transferred the second swap to Sobeys.
(b) On July 16, 2007, the Company announced that Sobeys and Thrifty Foods (“Thrifty”) have entered into an agreement that will see Sobeys purchase the British Columbia-based grocery retailer. The transaction is based on an enterprise value of $260.0 and is subject to adjustments for, among other items, assumed liabilities and working capital at closing. Thrifty’s business includes 20 full-service supermarkets, a main distribution centre and a wholesale division on Vancouver Island and the lower mainland of British Columbia. The deal is expectedto close during the Company’s second quarter following receipt of regulatory approval and completion of due diligence. The transaction is expected to be fi nanced with cash and available banking facilities.
Note 28 Comparative Figures
Comparative fi gures have been reclassifi ed, where necessary, to refl ect the current year’s presentation and to record the effects of retroactive application of certain new accounting standards.
EMPIRE COMPANY LIMITED 2007 ANNUAL REPORT 97
9928_Back-Eng_Final v1a.indd 979928_Back-Eng_Final v1a.indd 97 7/26/07 8:01:00 AM7/26/07 8:01:00 AM

Years Ended (1) 2007 2006 2005 2004
Restated Restated
FINANCIAL RESULTS ($ in millions; except ROE)
Revenue $ 13,366.7 $ 13,063.6 $ 12,435.2 $ 11,284.0 Operating income 440.3 491.4 463.7 422.8 Interest expense 60.1 83.8 86.7 92.4 Income taxes 120.2 153.1 131.2 111.0 Minority interest 57.0 67.1 63.6 58.5 Earnings from continuing operations before net capital gains and other items 204.4 202.0 182.9 163.3 Earnings from discontinued operations (2) – – – – Operating earnings (3) 204.4 202.0 182.9 163.3 Capital gains (losses) and other items, net of tax 5.7 94.8 3.7 9.2 Net earnings 210.1 296.8 186.6 172.5 Return on equity 10.3% 16.2% 11.4% 11.6%
FINANCIAL POSITION ($ in millions)
Total assets 5,224.9 5,051.5 4,929.2 4,679.7 Long-term debt (excluding current portion) 792.6 707.3 727.4 913.0 Shareholders’ equity 2,135.4 1,965.2 1,709.0 1,567.6
PER SHARE DATA ON A FULLY DILUTED BASIS ($ per share)
Operating earnings 3.10 3.07 2.78 2.47 Capital gains (losses) and other items, net of tax 0.09 1.44 0.05 0.14 Net earnings 3.19 4.51 2.83 2.61 Dividends Non-Voting Class A shares 0.600 0.560 0.480 0.400 Class B common shares 0.600 0.560 0.480 0.400 Book value 32.37 29.77 25.87 23.67
SHARE PRICE, NON-VOTING CLASS A SHARES ($ per share)
High 45.25 44.35 38.00 29.50 Low 39.49 33.37 24.25 23.10 Close 42.33 43.29 36.66 26.65 Diluted weighted average number of shares outstanding (in millions) 65.7 65.7 65.7 65.8
(1) Fiscal years ended April 30 th except fi scal 2005, which ended May 7, 2005, fi scal 2006, which ended May 6, 2006 and fi scal 2007 which ended May 5, 2007, refl ecting a change in fi scal year end to the fi rst Saturday in May, consistent with the fi scal year end of Sobeys Inc.
(2) Discontinued operations refl ect the fi nancial contribution of SERCA Foodservice operations, which was sold at the end of 2002.(3) Operating earnings equals net earnings before capital gains (losses) and other items.
Eleven-Year Financial Review
98 NOTES TO THE CONSOLIDATED FINANCIAL STATEMENTS
9928_Back-Eng_Final v1a.indd 989928_Back-Eng_Final v1a.indd 98 7/26/07 8:01:00 AM7/26/07 8:01:00 AM

2003 2002 2001 2000 1999 1998 1997
Restated
$ 10,624.2 $ 9,926.5 $ 9,331.1 $ 9,100.1 $ 5,362.7 $ 2,912.2 $ 3,149.7 444.4 416.2 341.1 309.7 184.4 108.6 114.2 93.7 111.6 145.8 159.6 112.6 76.8 79.2 120.0 104.8 131.9 68.1 49.1 17.9 16.9 67.5 50.0 34.3 32.9 9.2 – 0.4
159.3 123.5 78.5 78.8 59.0 56.1 51.5 – 8.7 10.0 5.9 1.1 8.1 – 159.3 132.2 88.5 84.7 60.1 64.2 51.5 (6.0) 63.7 491.5 2.1 74.9 23.6 1.4 153.3 195.9 580.0 86.8 135.0 87.8 52.9 11.4% 16.4% 69.1% 13.3% 21.7% 17.9% 11.9%
4,519.3 4,318.0 4,254.3 4,171.0 4,023.5 1,907.2 1,797.4 923.1 975.0 1,107.2 1,332.0 1,391.8 616.5 606.8 1,418.5 1,290.6 1,115.0 602.8 737.5 558.3 479.6
2.42 2.00 1.33 1.10 0.78 0.85 0.65 (0.09) 0.97 7.49 0.03 1.00 0.32 0.02 2.33 2.97 8.82 1.13 1.78 1.17 0.67
0.330 0.214 0.170 0.140 0.136 0.121 0.110 0.330 0.214 0.170 0.140 0.136 0.116 0.090 21.41 19.47 16.82 8.73 9.03 7.06 5.93
33.25 33.30 18.25 16.98 16.27 14.25 7.85 23.70 15.75 13.88 12.33 12.50 7.80 6.13 23.85 28.88 17.00 16.05 13.00 13.63 7.85
65.8 65.7 65.6 75.6 75.0 73.9 74.0
EMPIRE COMPANY LIMITED 2007 ANNUAL REPORT 99
9928_Back-Eng_Final v1a.indd 999928_Back-Eng_Final v1a.indd 99 7/26/07 8:01:00 AM7/26/07 8:01:00 AM

Glossary
ADJUSTED DEBT
Funded debt plus capitalized value of operating lease payments, which is calculated as six times net annual operating lease payments
ADJUSTED DEBT TO CAPITAL
Adjusted debt divided by the sum of adjusted debt and shareholders’ equity
BOOK VALUE PER SHARE
Shareholders’ equity less preferred shares divided by Non-VotingClass A shares and Class B common shares outstanding
CAPITAL EXPENDITURE
Payments made for the acquisition of property and equipment
COMPANY-WIDE CAPITAL EXPENDITURES
Total investment in property and equipment, which includes investment fi nanced by the Company, third party operating leases, landlords and franchise affi liates
EBITDA
Operating income plus depreciation and amortization
EXPANDED STORES
Stores that undergo construction resulting in a square footage increase during the year
FUNDED DEBT
All interest bearing debt, which includes bank loans, bankers’ acceptances, long-term debt and liabilities relating to assets held for sale
FUNDS FROM OPERATIONS
Operating earnings plus depreciation
HEDGE
A fi nancial instrument used to manage foreign exchange or interest rate risk by making a transaction which offsets the existing position
INTEREST COVERAGE
Operating income divided by interest expense
LETTERS OF CREDIT
Financial instruments issued by a fi nancial institution to guarantee the Company’s payments to a third party
NET DEBT TO TOTAL CAPITAL
Funded debt less cash and cash equivalents divided by funded debt less cash and cash equivalents plus shareholders’ equity
ON BALANCE SHEET INVESTMENT
The Company’s investment in property and equipment that is recorded on the balance sheet
OPERATING EARNINGS
Net earnings before capital gains (losses) and other items, net of tax
OPERATING INCOME
Operating earnings before minority interest, interest expense and income taxes
OPERATING MARGIN
Operating income divided by sales
PRIVATE LABEL
A brand of products that is marketed, distributed and owned by the Company
RENOVATED STORES
Stores that undergo construction, resulting in no increase in square footage
RETURN ON EQUITY
Net earnings divided by average shareholders’ equity
SAME-STORE SALES
Sales from stores in the same location in both reporting periods
TOTAL CAPITAL
Funded debt plus shareholders’ equity
VIE (VARIABLE INTEREST ENTITY)
An entity that does not have suffi cient equity at risk to fi nance its activities without additional subordinated fi nancial support, or where the equity holders lack the overall characteristics of a controlling fi nancial interest
WEIGHTED AVERAGE NUMBER OF SHARES
Number of Non-Voting Class A shares plus Class B common shares outstanding adjusted to take into account the time the shares are outstanding in the reporting period
100
9928_Back-Eng_Final v1a.indd 1009928_Back-Eng_Final v1a.indd 100 7/26/07 8:01:00 AM7/26/07 8:01:00 AM

EMPIRE COMPANY LIMITED
Head Office:115 King St. Stellarton, Nova Scotia B0K 1S0Telephone: (902) 755-4440Fax: (902) 755-6477Website: www.empireco.ca
INVESTOR RELATIONS AND INQUIRIES
Shareholders, analysts, and investors should direct their financial inquiries or requests to:
Stewart H. Mahoney, CFAVice President, Treasury and Investor RelationsE-mail: [email protected]
Communication regarding investor records including changes of address or ownership, lost certificates or tax forms, should be directed to the Company’s transfer agent and registrar, CIBC Mellon Trust Company.
SHAREHOLDERS’ ANNUAL GENERAL MEETING
September 12, 2007 at 11:00 a.m. (ADT)Empire Studio 7 Cinemas610 East River RoadNew Glasgow, Nova Scotia
SUBSIDIARY COMPANY WEB ADDRESSES
www.sobeys.comwww.empiretheatres.com
STOCK EXCHANGE LISTING
The Toronto Stock Exchange
STOCK SYMBOLS
Non-Voting Class A shares – EMP.APreferred shares: Series 2 – EMP.PR.B
AVERAGE DAILY TRADING VOLUME (TSX)
28,814
COMMON DIVIDEND RECORD AND
PAYMENT DATES FOR FISCAL 2008
RECORD DATE PAYMENT DATE
July 16, 2007 July 31, 2007October 15, 2007* October 31, 2007*January 14, 2008* January 31, 2008*April 14, 2008* April 30, 2008*
* Subject to the approval of the Board of Directors
OUTSTANDING SHARES
AS OF JUNE 28, 2007
Non-Voting Class A shares 31,174,037Class B common shares, voting 34,560,763
TRANSFER AGENT
CIBC Mellon Trust CompanyInvestor CorrespondenceP.O. Box 7010Adelaide Street Postal StationToronto, OntarioM5C 2W9Telephone: (800) 387-0825Email: [email protected]
BANKERS
Bank of Montreal Bank of Nova ScotiaBank of Tokyo-MitsubishiCanadian Imperial Bank of CommerceNational Bank of CanadaRabobankRoyal Bank of CanadaTD Canada Trust
SOLICITORS
Stewart McKelvey Halifax, Nova Scotia
AUDITORS
Grant Thornton, LLPNew Glasgow, Nova Scotia
MULTIPLE MAILINGS
If you have more than one account, you may receive a separate mailing for each. If this occurs, please contact CIBC Mellon Trust Company at (800) 387-0825 to eliminate the multiple mailings.
Shareholder and Investor InformationD
ES
IGN
AN
D E
DIT
OR
IAL:
CR
AIB
DE
SIG
N &
CO
MM
UN
ICA
TIO
NS
PR
INC
IPA
L P
HO
TO
GR
AP
HY
: B
RIA
N P
IET
ER
S
P
RIN
TIN
G:
GR
AF
IKO
M.M
IL
7/26/07 7:18:00 AM7/26/07 7:18:00 AM

C O M P A N Y L I M I T E D
www.empireco.ca
9928_Cover-Eng_Final v1a.indd 19928_Cover-Eng_Final v1a.indd 1