& e nv iro m journal of civil & environmental emara et al ... journal of civil &...
TRANSCRIPT

Volume 8 • Issue 2 • 1000301J Civil Environ Eng, an open access journalISSN: 2165-784X
Emara et al., J Civil Environ Eng 2018, 8:2DOI: 10.4172/2165-784X.1000301
Research Article Open Access
Jour
nal o
f Civi
l & Environmental Engineering
ISSN: 2165-784X
Journal of Civil & Environmental Engineering
Prediction of Self-Compacting Rubberized Concrete Mechanical and Fresh Properties using Taguchi MethodEmara MA*, Eid FM, Nasser AA and Safaan MAFaculty of Engineering, Department of Civil Engineering, Menoufia University, Egypt
AbstractThe effect and optimization of using self-compacting rubberized concrete was investigated by using Taguchi method. Design of
experiment was performed via orthogonal array to accommodate four factors with four levels. These factors were the percentage of fine rubber, coarse rubber, fly ash and viscocrete in the concrete mix. The signal-to-noise (S/N) ratio and the analysis of variance (ANOVA) were employed to study the performance characteristics of self-compacting rubberized concrete (SCRC). Rubberized concrete can be improved using the concrete proportioned as self-compacting concrete. The results indicate that there was a reduction in the strength with increasing rubber content but there was an increase in impact resistance. However, the replacement of 10% of coarse aggregate with coarse rubber gave more strength than that of zero rubber mix by 124% at 90 days. Replacement of 20% of both fine and coarse aggregates with fine and coarse rubber respectively, increased impact resistance by 453% compared to the corresponding SCRC control mix.
*Corresponding author: Emara MA, Faculty of Engineering, Department of Civil Engineering, Menoufia University, Gamal Abdul-Nasser Street, Menoufia University, Egypt, Tel: +20 48 2222170; E-mail: [email protected]
Received October 14, 2017; Accepted February 19, 2018; Published February 23, 2018
Citation: Emara MA, Eid FM, Nasser AA, Safaan MA (2018) Prediction of Self-Compacting Rubberized Concrete Mechanical and Fresh Properties using Taguchi Method. J Civil Environ Eng 8: 301. doi: 10.4172/2165-784X.1000301
Copyright: © 2018 Emara MA, et al. This is an open-access article distributed under the terms of the Creative Commons Attribution License, which permits unrestricted use, distribution, and reproduction in any medium, provided the original author and source are credited.
Keywords: Rubber; Recycling; Self-compacting; Taguchi method; ANOVA
IntroductionSelf-Compacting Concrete (SCC) is a sophisticated high-
performance concrete [1] described as the ‘‘most revolutionary step’’ in concrete technology over the last two decades due to its impact on economic and environmental sustainability in the construction industry [2]. It offers the advantages of increased productivity rates, decreased manpower, and elimination of the noise and fuel consumption associated with vibrator plant [3]. In comparison with plain concrete, it has the ability to fully self-compact under its own weight and has high flow ability and filling rates, reduced blocking in congested reinforced areas, and high segregation resistance, as well as high durability, low permeability and high compressive strength [4].
Solid waste disposal is a major environmental issue on cities around the world [5]. The volume of polymeric waste like tire rubber is increasing. The waste tires rubber becomes an environmental problem due to its non-biodegradable nature. Up to now a small part is recycled and millions of tires are just stockpiled; land filled or buried and used as fuel in many industries. Recycling end-of-life vehicle tires as alternative aggregates to produce a new class concrete is an innovative option with environmental, economic and performance benefits [5].
Many researchers have therefore used rubber particles as aggregates in concrete production to eliminate poor deformation capacity, low tensile strength, and improve energy absorption capacity. Aggregate rubber particles enhanced deformation and energy absorption capacities while they decreased workability and mechanical properties [6]. Self-compacting rubberized concrete (SCRC) was produced to diminish the negative effect of rubber aggregate on the mechanical properties and workability of concrete [7]. Due to the high powder content of SCC its microstructure is very compacted and dense, which results in high mechanical strength and brittle failure modes. Therefore, (SCRC) composites could be used for applications requiring deformable (high ductility concrete with high flowability and low/medium strength (<35 MPa), which is difficult to achieve using SCC using alternative aggregates that are environmentally friendly (sustainable concrete). In infrastructure applications the range of strength is usually between 28 and 35 MPa. In applications such as bridge barriers and road foundations, concrete with high deformation and high toughness is desirable while >35 MPa compressive strength is not required [5,8].
Aim of WorkIn the current research fresh and harden properties of (SCRC) were
investigated using Taguchi method. Sixteen different concrete mixes were designed with the same water/powder ratio W/P (P=cement+fly ash). Their self-compacting characteristics and final mechanical behavior are reported and discussed.
Parameter Design MethodologyTaguchi’s parameter design method is a powerful tool for
optimizing the characteristic performance of a product/process. Optimization quality characteristic minimizes Sensitivity to Noise (S/N) (uncontrollable) factors. In the present study, four control factors were chosen with four levels as shown in Table 1.
Design of experiment
The experiment was designed based on the orthogonal array technique. An orthogonal array is a fractional factorial design. It is obtained by assigning the selected factors and their levels to appropriate columns of L16 orthogonal array. This array has 16 rows and 4 columns, each row represents a trial condition and each column accommodates a specific process parameter. The main effects can be estimated. The numbers in each column indicate the levels of specific factors (A, B, C and D). Taguchi Orthogonal Array Design is L16 (4**4). Factors are 4. Runs are 16 [9-11].
Taguchi’s orthogonal array approach of experimental design
Taguchi’s target is developing products that achieve the target value on a consistent basis. The variation around the target value should be minimized. In other words, quality is achieved by minimizing the
Volume 8 • Issue 2 • 1000301J Civil Environ Eng, an open access journalISSN: 2165-784X
Citation: Emara MA, Eid FM, Nasser AA, Safaan MA (2018) Prediction of Self-Compacting Rubberized Concrete Mechanical and Fresh Properties using Taguchi Method. J Civil Environ Eng 8: 301. doi: 10.4172/2165-784X.1000301
Page 2 of 8
Fine aggregate: The sand used was local natural siliceous sand with fineness modulus 2.77 and specific gravity 2.64.
Coarse aggregate: Coarse aggregate used was natural crushed limestone with maximum aggregate size of 12 mm to achieve the requirement of self-compacting concrete.
Super plasticizer: A high range water reducer without retarding was used. (Sika viscocrete 3425) was used as a demand for producing SCC. It meets the requirements for superplasticizers according to ASTM-C- 494 Types G and F and BS EN 934 part 2: 2001.
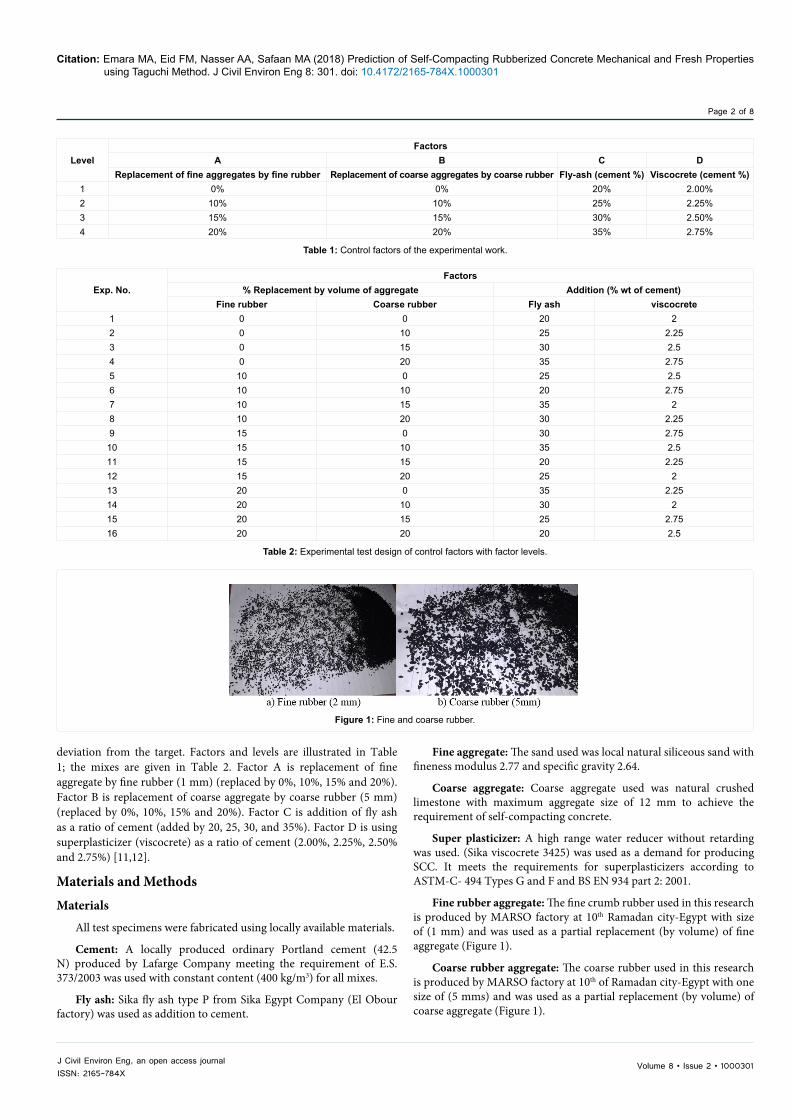
Fine rubber aggregate: The fine crumb rubber used in this research is produced by MARSO factory at 10th Ramadan city-Egypt with size of (1 mm) and was used as a partial replacement (by volume) of fine aggregate (Figure 1).
Coarse rubber aggregate: The coarse rubber used in this research is produced by MARSO factory at 10th of Ramadan city-Egypt with one size of (5 mms) and was used as a partial replacement (by volume) of coarse aggregate (Figure 1).
deviation from the target. Factors and levels are illustrated in Table 1; the mixes are given in Table 2. Factor A is replacement of fine aggregate by fine rubber (1 mm) (replaced by 0%, 10%, 15% and 20%). Factor B is replacement of coarse aggregate by coarse rubber (5 mm) (replaced by 0%, 10%, 15% and 20%). Factor C is addition of fly ash as a ratio of cement (added by 20, 25, 30, and 35%). Factor D is using superplasticizer (viscocrete) as a ratio of cement (2.00%, 2.25%, 2.50% and 2.75%) [11,12].
Materials and MethodsMaterials
All test specimens were fabricated using locally available materials.
Cement: A locally produced ordinary Portland cement (42.5 N) produced by Lafarge Company meeting the requirement of E.S. 373/2003 was used with constant content (400 kg/m3) for all mixes.
Fly ash: Sika fly ash type P from Sika Egypt Company (El Obour factory) was used as addition to cement.
LevelFactors
A B C DReplacement of fine aggregates by fine rubber Replacement of coarse aggregates by coarse rubber Fly-ash (cement %) Viscocrete (cement %)
1 0% 0% 20% 2.00%2 10% 10% 25% 2.25%3 15% 15% 30% 2.50%4 20% 20% 35% 2.75%
Table 1: Control factors of the experimental work.
Exp. No.Factors
% Replacement by volume of aggregate Addition (% wt of cement)Fine rubber Coarse rubber Fly ash viscocrete
1 0 0 20 22 0 10 25 2.253 0 15 30 2.54 0 20 35 2.755 10 0 25 2.56 10 10 20 2.757 10 15 35 28 10 20 30 2.259 15 0 30 2.75
10 15 10 35 2.511 15 15 20 2.2512 15 20 25 213 20 0 35 2.2514 20 10 30 215 20 15 25 2.7516 20 20 20 2.5
Table 2: Experimental test design of control factors with factor levels.
Figure 1: Fine and coarse rubber.

Volume 8 • Issue 2 • 1000301J Civil Environ Eng, an open access journalISSN: 2165-784X
Citation: Emara MA, Eid FM, Nasser AA, Safaan MA (2018) Prediction of Self-Compacting Rubberized Concrete Mechanical and Fresh Properties using Taguchi Method. J Civil Environ Eng 8: 301. doi: 10.4172/2165-784X.1000301
Page 3 of 8
is filled with fresh concrete and the time taken for the concrete to flow out of the funnel is measured and recorded as the V-funnel flow time (Figure 2).
Hardened SCRC
Compressive strength test: Test was carried out on 15 × 15 × 15 cm cubes and according to ASTM C39-86. The capacity of the compression machine used is 2000 KN.
Impact test: Beams 10 cm × 10 cm × 50 cm were prepared for this test. The impact resistance was assessed by measuring the ability of concrete specimens to withstand repeated blows of a free failing load (3 kg) at a constant travelling height of 40 cm above the midpoint of the tested concrete beam which was supported on two ends. The load was then left to fall freely on the top side of the concrete beam and the number of impact blows to cause failure was recorded [14-16]. Figure 3 shows the hardened tests set up.
Results Fresh properties
Experimental test results of fresh properties for slump flow and V-Funnel tests for SCRC are shown in Table 3.
Hardened properties
Experimental test results of compressive strength for SCRC are shown in Table 4. Table 5 shows test results for impact resistance which represented by numbers of blows.
Water: Fresh tap water was used with water /binder ratio w/b=0.37.
Mix contents and procedure
Mix contents: The cement content was constant at 400 kg/m3 for all mixes with water/binder* ratio of 0.37 and the mix proportion ratio (of weight) for cement: sand: dolomite was 1:2.125:2.125 respectively.
*binder=cement + fly ash
Mixing procedure: It was carried out in three stages; dry mix for 2 min, adding 75% of (water+S.P) and mixing for 2 min and a final mix for not less than 3 min after adding the remaining amount of (water+S.P). Subsequently, the fresh properties of SCRC mixes; Flowability and Passing-ability tests (slump flow, T50, V-Funnel and J-Ring) were determined. Concrete specimens were cast in standard steel molds. After 24 h from mixing, all the specimens were de-molded and cured in wet canvas for 7 days.
Tests
Fresh tests: Fresh tests were performed according to the procedure recommended by EFNARC committee (European Federation for Specialist Construction Chemicals and Concrete Systems) [13]. (Figure 2).
Slump flow test: Slump flow value describes the flowability of a fresh mix in unconfined conditions. It is a sensitive test that can normally be specified for all self-compacting concretes, as the primary check that the fresh concrete consistence meets the specification [8] (Figure 2).
V-funnel: When performing the V-funnel test, a V shaped funnel
Figure 2: Fresh tests.
Figure 3: Hardened tests.
Volume 8 • Issue 2 • 1000301J Civil Environ Eng, an open access journalISSN: 2165-784X
Citation: Emara MA, Eid FM, Nasser AA, Safaan MA (2018) Prediction of Self-Compacting Rubberized Concrete Mechanical and Fresh Properties using Taguchi Method. J Civil Environ Eng 8: 301. doi: 10.4172/2165-784X.1000301
Page 4 of 8
Analysis and Discussion Design of experiment data is used to analyze the mean response
function. In Taguchi technique, the variation of the response is examined using an appropriately chosen S/N ratio. This ratio is the mean (signal) to the standard deviation (noise). The ratios, derived from the quadratic loss function, are expressed on a decibel (dB) scale. The formula used to compute the S/N ratio depends on the objective function. Generally, three standard S/N equations are widely used to classify the objective function as: ‘larger the better’, ‘smaller the better’, or ‘nominal the best’. Focusing on the strength characteristic, a larger S/N ratio is always desirable.
In the present study, compressive and impact resistance are ‘larger is better’ types of quality characteristic since the goal is to maximize the strength. The standard S/N ratio computing formula for this type of response is:
21
1 110log (1)n
ji ij
SN n Y=
=−
∑
V-funnel is a ‘smaller is better’ type of quality characteristic since the goal is to minimize them. The standard S/N ratio computing formula for this type of response is:
2
1
110log (2)n
ji
S YN n =
=−
∑
Where ‘i’ is the number of a trial; ‘Yij’ is the measured value of quality characteristic for the ith trial and jth experiment; ‘n’ is the number of repetitions for the experimental combination. Signal-to-noise ratios are computed using Equation (1) for each experimental condition for compressive and impact resistance. The factor effects can be separated out in terms of S/N ratio.
The analysis of variance (ANOVA) is also performed to study the relative significance of the process parameters. The contributions of the various parameters are quantified.
Fresh properties
The filling ability and stability of SCRC in the fresh state can be defined by four key characteristics namely flow ability, viscosity, passing ability, and segregation resistance. Each characteristic can be addressed by one or more test methods [13]. For instance, flow ability can be measured via slump flow test, viscosity can be measured through the V-funnel flow time tests.
Self-compacting concrete requirements in the fresh state that are appropriate for a given application should be selected from one or more of above mentioned four key characteristics and then specified by class or target value. To define the flow ability, viscosity, passing ability, and segregation resistance of the produced SCRC, slump flow diameter and V-funnel flow time of the all produced concretes were measured and presented.
Slump flow test: The average values of S/N ratios of the control
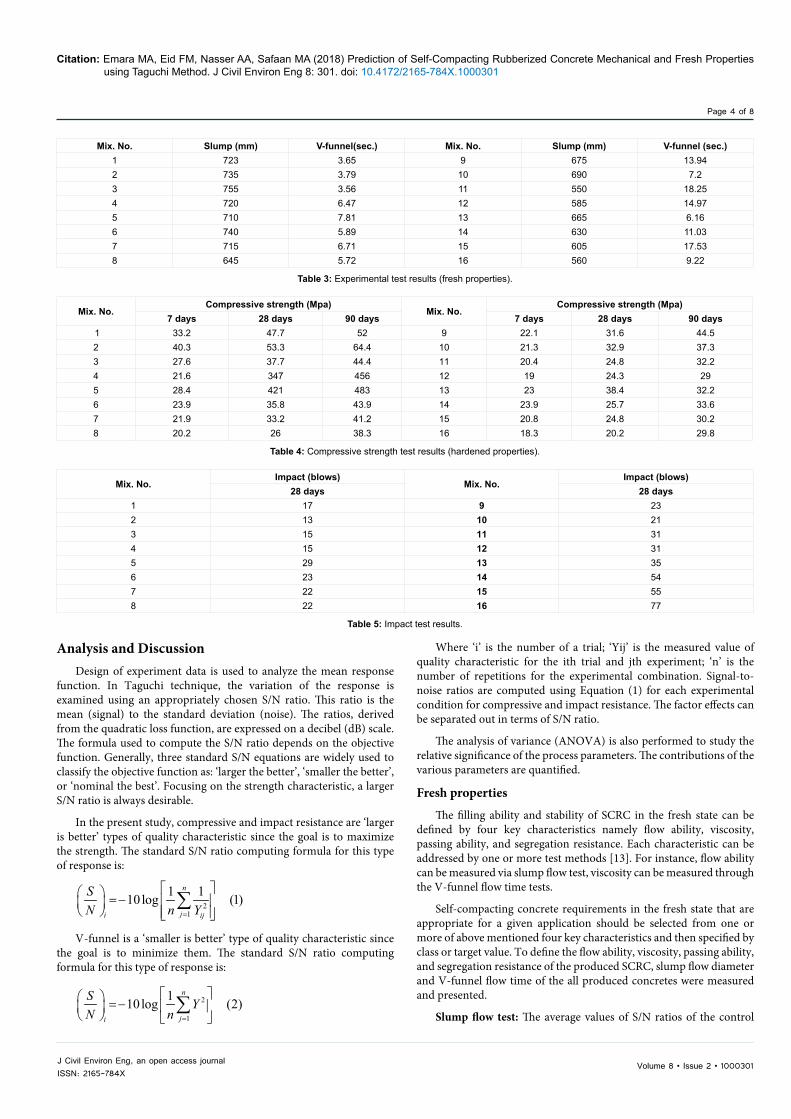
Mix. No. Slump (mm) V-funnel(sec.) Mix. No. Slump (mm) V-funnel (sec.)1 723 3.65 9 675 13.942 735 3.79 10 690 7.23 755 3.56 11 550 18.254 720 6.47 12 585 14.975 710 7.81 13 665 6.166 740 5.89 14 630 11.037 715 6.71 15 605 17.538 645 5.72 16 560 9.22
Table 3: Experimental test results (fresh properties).
Mix. No.Compressive strength (Mpa)
Mix. No.Compressive strength (Mpa)
7 days 28 days 90 days 7 days 28 days 90 days 1 33.2 47.7 52 9 22.1 31.6 44.52 40.3 53.3 64.4 10 21.3 32.9 37.33 27.6 37.7 44.4 11 20.4 24.8 32.24 21.6 347 456 12 19 24.3 295 28.4 421 483 13 23 38.4 32.26 23.9 35.8 43.9 14 23.9 25.7 33.67 21.9 33.2 41.2 15 20.8 24.8 30.28 20.2 26 38.3 16 18.3 20.2 29.8
Table 4: Compressive strength test results (hardened properties).
Mix. No.Impact (blows)
Mix. No.Impact (blows)
28 days 28 days1 17 9 232 13 10 213 15 11 314 15 12 315 29 13 356 23 14 547 22 15 558 22 16 77
Table 5: Impact test results.

Volume 8 • Issue 2 • 1000301J Civil Environ Eng, an open access journalISSN: 2165-784X
Citation: Emara MA, Eid FM, Nasser AA, Safaan MA (2018) Prediction of Self-Compacting Rubberized Concrete Mechanical and Fresh Properties using Taguchi Method. J Civil Environ Eng 8: 301. doi: 10.4172/2165-784X.1000301
Page 5 of 8
compressive strength can logically be attributed to (i) the low modulus of elasticity (E) for rubber particles and high Poisson ratio (υ) which may encourage premature cracking under load, (ii) increased porosity due to air entrainment from rubber particles, and (iii) weak bonding in the interfacial transition zone between the cement paste and rubber particles which could be due to crack initiation from the voids that form between crumb rubber particles and cement paste. Therefore, under compression loading the aggregates can be susceptible to pullout resulting in particle perimeter voids and crack initiation sites. For fly ash, increasing fly ash content increased compressive strength as it works as a filler which fills the voids on concrete. Using 35% of fly ash as addition to the mix gave highest compressive strength. Viscocrete has small effect on compressive strength. It had the 4th rank in S/N analysis. But the addition of super plasticizer in (SCC) gives more strength in early age. The average values of S/N ratios of the control factors for compressive strength test are shown in Table 10 and Figure 6. Table 11 shows the analysis of variance for this test.
Impact resistance: Increasing rubber content led to increase impact resistance. The impact resistance, as a number of blows, increased from 17 blows for mix No.1 (no rubber replacement) to 77 blows for mix No.16 (20% fine rubber and 20% coarse rubber). This gain of impact resistance of SCRC is due to the ability of rubber
factors for slump flow test are shown in Table 6 and Figure 4. Table 7 shows the analysis of variance for this test. Increasing rubber content decreased slump flow diameter but increasing fly ash and/or viscocrete increased slump flow diameter. Addition fly ash to the mix increased cement paste volume which made the mix more flowability. Viscocrete increased the viscosity of concrete which increased the slump flow diameter.
V-Funnel test: As mentioned above, V-Funnel test is measuring the viscosity like T50 test. But here, viscocrete has 2nd rank in S/N analysis which mean that it has a big effect on V-Funnel test. However, using the highest content of viscocrete (2.75%) increased the time of this test as shown in Figure 5. like T50, increasing rubber content increased V-Funnel time. The average values of S/N ratios of the control factors for this test are shown in Table 8 and Figure 5. Table 9 shows the analysis of variance for this test.
Hardened properties
The mean of three tested values at 28 days was recorded to determine the compressive and impact resistance for all mixtures.
Compressive strength: It was found that increasing rubber content decreased the compressive strength. The deterioration in
Level Fine rubber (A) Coarse rubber (B) Fly ash (C) Viscocrete (D)1 57.3 56.81 56.08 56.42 56.92 56.87 56.33 56.23 55.88 56.27 56.58 56.584 55.76 55.91 56.87 56.69
Delta 1.54 0.96 0.78 0.49Rank 1 2 3 4
Table 6: Response of signal to noise ratios for slump flow (larger is better).
Source DF Seq SS Adj SS Adj MS Contribution %Fine rubber 3 40345 40345 13448.3 61.27
Coarse rubber 3 13407 13407 4469.1 20.36Fly ash 3 6557.4 6557.4 2185.8 9.96
Viscocrete 3 3182.4 3182.4 1060.8 4.83Error 3 2344.9 2344.9 781.6 3.56Total 15 65837 - - 100
Table 7: Analysis of Variance for slump flow test, using adjusted SS for tests.
Figure 4: Main effect plot for signal to noise ratio of slump flow (larger is better).

Volume 8 • Issue 2 • 1000301J Civil Environ Eng, an open access journalISSN: 2165-784X
Citation: Emara MA, Eid FM, Nasser AA, Safaan MA (2018) Prediction of Self-Compacting Rubberized Concrete Mechanical and Fresh Properties using Taguchi Method. J Civil Environ Eng 8: 301. doi: 10.4172/2165-784X.1000301
Page 6 of 8
Figure 5: Main effect plot for signal to noise ratio of V-funnel results (smaller is better).
Level Fine rubber (A) Coarse rubber (B) Fly ash (C) Viscocrete (D)1 -12.52 -16.94 -17.79 -18.032 -16.23 -16.24 -19.45 -16.933 -22.19 -19.42 -17.48 -16.334 -20.2 -18.54 -16.42 -19.85
Delta 9.67 3.17 3.03 3.51Rank 1 3 4 2
Table 8: Response of signal to noise ratios for V-funnel (smaller is better).
Source DF Seq SS Adj SS Adj MS Contribution %Fine rubber 3 209.95 209.95 69.984 59.57
Coarse rubber 3 46.302 46.302 15.434 13.13Fly ash 3 39.52 39.52 13.173 11.21
Viscocrete 3 33.017 33.017 11.006 9.36Error 3 23.628 23.628 7.876 6.7Total 15 352.42 - - 100
Table 9: Analysis of variance for V-funnel test, using adjusted SS for tests.
Level Fine rubber (A) Coarse rubber (B) Fly ash (C) Viscocrete (D)1 52.62 51.93 49.66 49.982 50.57 51.04 50.65 50.63 48.98 49.43 49.5 50.124 48.46 48.23 50.82 49.94
Delta 4.15 3.7 1.32 0.66Rank 1 2 3 4
Table 10: Response of signal to noise ratios for compressive strength of 28 days (larger is better).
Figure 6: Main effect plot for signal to noise ratio of compressive strength after 28 days (larger is better).
Volume 8 • Issue 2 • 1000301J Civil Environ Eng, an open access journalISSN: 2165-784X
Citation: Emara MA, Eid FM, Nasser AA, Safaan MA (2018) Prediction of Self-Compacting Rubberized Concrete Mechanical and Fresh Properties using Taguchi Method. J Civil Environ Eng 8: 301. doi: 10.4172/2165-784X.1000301
Page 7 of 8
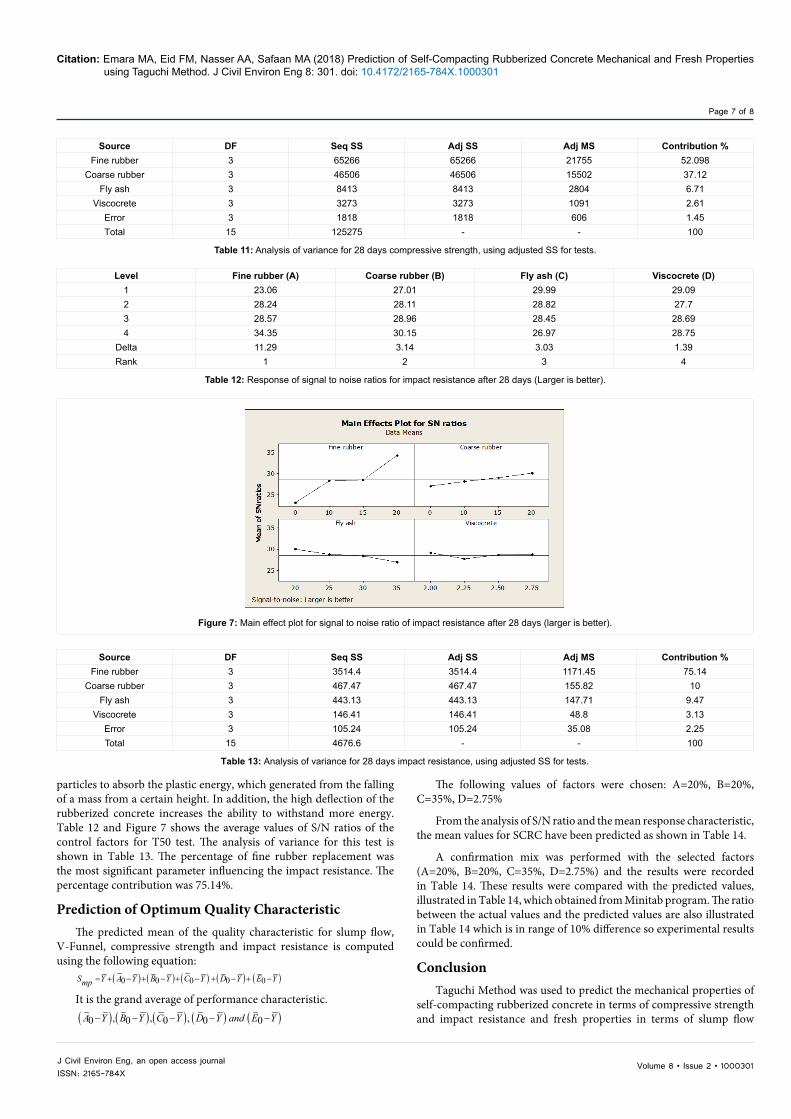
particles to absorb the plastic energy, which generated from the falling of a mass from a certain height. In addition, the high deflection of the rubberized concrete increases the ability to withstand more energy. Table 12 and Figure 7 shows the average values of S/N ratios of the control factors for T50 test. The analysis of variance for this test is shown in Table 13. The percentage of fine rubber replacement was the most significant parameter influencing the impact resistance. The percentage contribution was 75.14%.
Prediction of Optimum Quality CharacteristicThe predicted mean of the quality characteristic for slump flow,
V-Funnel, compressive strength and impact resistance is computed using the following equation:
( ) ( ) ( ) ( ) ( )0 0 0 0 0S Y A Y B Y C Y D Y E Ymp = + − + − + − + − + −
It is the grand average of performance characteristic.( ) ( ) ( ) ( ) ( ), , ,0 0 0 0 0A Y B Y C Y D Y and E Y− − − − −
The following values of factors were chosen: A=20%, B=20%, C=35%, D=2.75%
From the analysis of S/N ratio and the mean response characteristic, the mean values for SCRC have been predicted as shown in Table 14.
A confirmation mix was performed with the selected factors (A=20%, B=20%, C=35%, D=2.75%) and the results were recorded in Table 14. These results were compared with the predicted values, illustrated in Table 14, which obtained from Minitab program. The ratio between the actual values and the predicted values are also illustrated in Table 14 which is in range of 10% difference so experimental results could be confirmed.
ConclusionTaguchi Method was used to predict the mechanical properties of
self-compacting rubberized concrete in terms of compressive strength and impact resistance and fresh properties in terms of slump flow
Figure 7: Main effect plot for signal to noise ratio of impact resistance after 28 days (larger is better).
Source DF Seq SS Adj SS Adj MS Contribution %Fine rubber 3 65266 65266 21755 52.098
Coarse rubber 3 46506 46506 15502 37.12Fly ash 3 8413 8413 2804 6.71
Viscocrete 3 3273 3273 1091 2.61Error 3 1818 1818 606 1.45Total 15 125275 - - 100
Table 11: Analysis of variance for 28 days compressive strength, using adjusted SS for tests.
Level Fine rubber (A) Coarse rubber (B) Fly ash (C) Viscocrete (D)1 23.06 27.01 29.99 29.092 28.24 28.11 28.82 27.73 28.57 28.96 28.45 28.694 34.35 30.15 26.97 28.75
Delta 11.29 3.14 3.03 1.39Rank 1 2 3 4
Table 12: Response of signal to noise ratios for impact resistance after 28 days (Larger is better).
Source DF Seq SS Adj SS Adj MS Contribution %Fine rubber 3 3514.4 3514.4 1171.45 75.14
Coarse rubber 3 467.47 467.47 155.82 10Fly ash 3 443.13 443.13 147.71 9.47
Viscocrete 3 146.41 146.41 48.8 3.13Error 3 105.24 105.24 35.08 2.25Total 15 4676.6 - - 100
Table 13: Analysis of variance for 28 days impact resistance, using adjusted SS for tests.

Volume 8 • Issue 2 • 1000301J Civil Environ Eng, an open access journalISSN: 2165-784X
Citation: Emara MA, Eid FM, Nasser AA, Safaan MA (2018) Prediction of Self-Compacting Rubberized Concrete Mechanical and Fresh Properties using Taguchi Method. J Civil Environ Eng 8: 301. doi: 10.4172/2165-784X.1000301
Page 8 of 8
diameter and V-Funnel time. The analysis shows that the proposed Taguchi technique was adequate to predict the above properties.
The study also considered examining the influence of different concrete mix proportioning parameters that included fine rubber, coarse rubber, fly ash and viscocrete contents on the studied mechanical and fresh properties.
The analysis of variance using ANOVA shows that the percentage of fine rubber replacement was the most significant parameter influencing the studied mechanical and fresh properties. The percentage contribution was 61.3%, 59.6%, 52.1% and 75.14% for slump flow diameter, V-Funnel, compressive strength and impact resistance respectively.
References
1. Taha MMR, El-Dieb AS, Abd El-Wahab MA, Abdel-Hameed ME (2008) Mechanical, fracture, and microstructural investigations of rubber concrete. J Mater Civ Eng 20:640-649.
2. Ouchi M, Okamura H (2003) Self-compacting concrete. J Adv Concrete Technol 1: 5-15.
3. Ouchi M, Okamura H (1999) Self-compacting concrete. Development, present use and fucture. First International RILEM stmposuim on Self-compacting Concrete 3-14.
4. Bignozzi MC, Sandrolini F (2006) Tyre rubber waste recycling in self-compacting concrete. Cem Concr Res 36: 735-739.
5. Najim KB, Hall MR (2012) Mechanical and dynamic properties of self-compacting crumb rubber modified concrete. Constr Build Mater 27:521-530.
6. Mishra M, Panda KC (2015) Influence of rubber on mechanical properties of conventional and self-compacting concrete. Adv Struct Eng 1785-1794.
7. Khalil E, Abd-Elmohsen M, Anwar MA (2015) Impact resistance of rubberized self-compacting concrete. Water Sci 29: 45-53.
8. Güneyisi E (2010) Fresh properties of self-compacting rubberized concrete incorporated with fly ash. Mater Struct 43:1037-1048.
9. Ghazy MF (2012) Effect of using mortar interface and overlays in masonry behavior by using Taguchi method. ACI Mater J 109: 509-516.
10. Ghazy MF, Abd El Hameed MF (2015) Optimization of lightweight concrete process by Gray Taguchi Method. ACI Mater J 112: 365-374.
11. Zahran MA, Nasser AA (2014) Recycling of cement dust for manufacturing cement bricks. The 7th Int Conf for Develop and the Env in the Arab world March. pp. 23-25.
12. Najim KB (2012) Determination and Enhancement of Mechanical and Thermo-physical Behavior of Crumb Rubber-modified Structural Concrete. The University of Nottingham, UK.
13. EFNARC (2005) The European Guidelines for self-compacting concrete: Specification, Production and Use.
14. Eid FM (2003) Properties and fields of application of rubberized concrete. Menofiya University, Egypt.
15. Taha MR, El-Dieb A, Abd El-Wahab M (2003) Fracture toughness of concrete incorporating rubber tire particles. International Conference on Performance of Construction Materials- A new era of building, Cairo, Egypt.
16. Najim, KB, Hall MR (2012) Experimental validation of plain/self-compacting rubberized concrete (PRC/ SCRC) mix designs for structural applications. 14th
International Conference of Structural Faults-Repair, Edinburgh, Scotland, UK.
Test Experimental results of the confirmation mix Taguchi predicted value Ratio of predicted value and actual
valueSlump flow 645 mm 618.28 mm 95.85%
V-funnel 10.224 seconds 11.0663 seconds 108.31%Compression 19.34 MPa 20.1 MPa 96.23%
Impact 51 blows 55 blows 107.85%
Table 14: Taguchi predicted values and actual values for SCRC.