e-prtr review report 2010 - circabc.europa.eu · e-prtr review report 2010 covering the 2008 e-prtr...
TRANSCRIPT

E-PRTR Review Report 2010
covering the 2008 E-PRTR dataset
ETC/ACC Technical Paper 2010/05
October 2010
ETC/ACC: Katarina Mareckova, Nicole Mandl, Stephan Poupa, Katrin Seuss
ETC/SCP: Christian Fischer and Claus Davidsen
ETC/W: Hana Prchalova, Renata Filippi, Pavla Chyska, Silvie Semeradova,
Petra Ronen
European Topic Centre
on Air and Climate Change
European Topic Centre
on Sustainable Consumption and Production
European Environment Agency European Topic Centre on Water
2/162 E-PRTR data review 2009 ETC/ACC - ETC/SCP - ETC/W
Front page picture
waste incineration plant “Spittelau” © Umweltbundesamt/Gröger
Acknowledgements
This report was prepared by
1. The European Environment Agency’s European Topic Centre Air and Climate Change ETC/ACC. The lead author was
Katarina Mareckova. Other authors were, Nicole Mandl, Stephan Poupa and Katrin Seuss all from
Umweltbundesamt Austria. Andreas Borgan, Robert Wankmueller provided the maps, Ute Kutschera from
Umweltbundesamt supported the ETC/ACC by editing the report.
2. The European Environment Agency’s European Topic Centre for Sustainable Consumption and Production (ETC/SCP).
The lead authors were Christian Fischer and Claus Davidsen (both Copenhagen Resource Institute run by the Danish
Ministry of the Environment).
3. The European Environment Agency’s European Topic Centre for Water (ETC/W). The lead authors were Hana
Prchalova, Renata Filippi, Pavla Chyska, Silvie Semeradova, Petra Ronen(all from CENIA, Czech Environmental
Agency.)
The EEA project manager was Eva Goossens.
Disclaimer
© ETC/ACC, 2010. ETC/ACC Technical paper 2010/05
European Topic Centre on Air and Climate Change
PO Box 303
3720 AH Bilthoven
The Netherlands
Phone +31 30 2748562
Fax +31 30 2744433
Email [email protected]
Website http://air-climate.eionet.europa.eu/
This ETC/ACC Technical Paper has not been subjected to European Environment Agency (EEA) member country review. It does not represent the formal views of the EEA.
3
ETC/ACC - ETC/SCP - ETC/W E-PRTR Review 2009 3/162
Executive Summary
The European Pollutant Release and Transfer Register (E-PRTR) has been established by Regulation
166/266/EC from 18 January 20061. The register contains key environmental data from about 25,000
industrial facilities in 65 economic activities in 27 European Union Member States and in Iceland,
Liechtenstein, Norway and Switzerland from 2007 onwards. Switzerland reported for the first time in
2010 and submitted datasets for 2007 and 2008. The register contains data on 91 pollutants released to
air, water and soil and pollutants transferred in water. In addition, both domestic and transboundary
waste transfers are included.
This is the report of the second informal E-PRTR data review that was carried out in 2010 and covers the
reporting year 2008. It has to be pointed out that the second E-PRTR review does not constitute a
formal review as required by Article 17 of the E-PRTR Regulation. While some of the data review checks
performed may be useful as an input for the future review in accordance with Article 17, this informal
review has not been specifically developed to serve this purpose. The main objective of the informal
review organized by the European Environment Agency is to assist countries in the improvement of the
E-PRTR data quality by providing feedback on potential data quality issues and inconsistencies with
other reportings.
The main objective of this report is to provide a summary of information on the 2010 review process
and on the review findings. Detailed results of automated stage 1 test were provided to countries on 30
July 2010 in form of country specific Excel tables and on 1 September in country specific Word files. All
review results can be downloaded from CIRCA by authorized users2 under the following link: http://eea.eionet.europa.eu/Members/irc/eionet-circle/e-prtr/library?l=/e-
prtr/country_feedback/2010_2008_dataset&vm=detailed&sb=Title
The more detailed results of the stage 2 review were provided to the EEA and all countries in form of
Excel files.
The informal review was carried out on the dataset which was published on the E-PRTR website on 8
June 2010 and which included the official submissions of countries by 27/05/20103 and the
resubmissions of the 2007 data (resubmitted by 01/03/2010).
Stage 1 review results
The stage 1 review aimed at providing detailed feedback to countries concerning potential quality issues
in order to assist the countries with future data quality improvement of the E-PRTR dataset. The review
was carried out on the 2008 dataset due for submission by 31 March 2010. The comparison data from
2007 is the dataset that was resubmitted by countries by 1 March 2010.
1 http://eur-lex.europa.eu/LexUriServ/site/en/oj/2006/l_033/l_03320060204en00010017.pdf 2 E-PRTR Regulatory Committee members and E-PRTR data reporters 3 The dataset can be downloaded at the EEA dataservice: http://www.eea.europa.eu/data-and-maps/data/member-states-reporting-
art-7-under-the-european-pollutant-release-and-transfer-register-e-prtr-regulation

4/162 E-PRTR data review 2009 ETC/ACC - ETC/SCP - ETC/W
Number of facilities
The total number of facilities reported under E-PRTR 2008 amounted to 25,162 (EU-27, Iceland,
Liechtenstein, Norway, Switzerland). The total number of facilities reported by these countries in the
resubmitted E-PRTR 2007 was slightly higher with 25,6084 facilities. The reason for this decrease in the
number of facilities of about 2 % in 2008 might be that the 2008 dataset is not yet fully complete. The
experience from the resubmissions of the 2007 dataset has shown that the number of facilities
increased by more than 1,000 facilities after the resubmissions.
Number of release/transfer reports
The total number of release/transfer reports reported under E-PRTR for the media air, water, transfer in
water and soil amounted to 39,861 reports in E-PRTR 2008 compared to 38,328 E-PRTR 2007 reports
submitted in 2009. This is an increase of about 4 %, which indicates improvement in reporting by
countries.
However if we compare E-PRTR 2008 reports with resubmitted 2007 data in 2010 (40,984 release
reports) than we see a decrease of about 3 %. The reason for difference in the number of
release/transfer reports in 2010 might be that the 2008 dataset is not fully complete as of now and will
be improved after the review results have been provided to countries. Another possible reason might be
that more releases/transfers lie below the E-PRTR threshold than in 2007 data set.
Number of facilities reported by countries under E-PRTR 2008 and 2007
17
2
78
2
16
5
66
71
6
40
4
10
5
49
4
3.38
8
4.4
93
15
0
69
2
26
31
3
1.6
85
36 11
8
28 13
71
5
51
3
1.43
3
56
8
48
5
23
9
18
8
3.3
05
510
21
1
3.1
48
0
500
1.000
1.500
2.000
2.500
3.000
3.500
4.000
4.500
5.000
num
ber
of f
acili
ties
E-PRTR 2007 E-PRTR 2008 - old facilities E-PRTR 2008 - new facilities
Note: Numbers above bars indicate sum of E-PRTR 2008 - old facilities and E-PRTR 2008 - new facilities.
4 Total number of facilities reported in 2009 amounted to 24 313 after including Switzerland 24 524. This indicates that reporting under E-PRTR
in 2010 slightly improved (3 %) comparing to 2009.

5
ETC/ACC - ETC/SCP - ETC/W E-PRTR Review 2009 5/162
E-PRTR activities
Countries reported information on facilities altogether for 44 out of the 45 E-PRTR activities. In 2008 like
in 2007 no facilities reported under activity 3.d “Installations for the production of asbestos and the
manufacture of asbestos-based products”. For all the subactivities (defined for 7 activities) facilities
were reported (voluntary level of detail for reporting). All (31) but seven countries provided information
on more than 20 activities. France, Germany, Poland and Spain submitted data for 40 or more activities
(Appendix III).
Pollutants
61 pollutants were reported as releases to air for 2008 compared to only 54 pollutants in 2007. In
general, countries reported between ten and 49 pollutants5 as releases to air. Most countries (30)
reported releases of CO2, CH4 and SO2 , 29 countries of NOx; 28 countries of NH3, CO, Ni and NMVOC and
27 countries releases of As, N2O, PM10 and Zn. On the other hand 6 pollutants (hexabromobiphenyl,
asbestos, total nitrogen, benzo(g,h,i)perylene, xylenes and HCH) have been reported only by one facility.
All countries except for Liechtenstein submitted release reports to water. Releases of altogether 72
pollutants have been reported for 2008 compared to 69 pollutants for 2007. Total nitrogen, total
phosphorus, total organic carbon and heavy metals were reported most frequently as releases to water.
However releases of NH3, HCl, SOx, chlordecone, heptachlor and mirex were submitted only by one
country each.
61 out of the 71 pollutants with a threshold for water in Annex II of the E-PRTR Regulation were
reported as transfers in water for 2008 compared to 53 pollutants for 2007. Most countries (23)
reported transfers in water on total nitrogen and total organic carbon followed by reporting of total
phosphorus, phenols and heavy metals. Transfers in water of 19 different pollutants have been provided
by one or two countries only.
Out of the 61 pollutants with a threshold for soil in Annex II of the E-PRTR Regulation only 21 were
actually reported under E-PRTR 2008 compared to 20 pollutants under E-PRTR 2007.
There might be different reasons for the limited number of release/transfer reports for some pollutants.
Either the E-PRTR threshold is too high or no estimation methodology exists for this pollutant or country
data is incomplete (does not include all relevant E-PRTR facilities).
Waste
14,515 facilities reported domestic transfers of hazardous waste, 7,333 facilities reported transfers of
non-hazardous waste and 1,234 facilities reported transboundary transfers of hazardous waste. The
total quantity of waste reported under E-PRTR 2008 by all countries was about 415 million tonnes.
Hazardous waste within country amounted to about 35.5 million tonnes per year (8.6 % of total) and
hazardous waste outside country to about 7.9 million tonnes per year (1.9 % of total). The quantity of
non-hazardous waste transfers accounted for 371.8 million tonnes per year (89.6 % of total).
5 Except Liechtenstein which did not report any releases to air.

6/162 E-PRTR data review 2009 ETC/ACC - ETC/SCP - ETC/W
Confidentiality
Eight countries (Belgium, Bulgaria, Germany, Greece, Luxembourg, Romania, Sweden, Switzerland)
reported confidential data elements for 2008. 71 facilities reported confidential data related to the
facility report, whereas 110 facilities claimed confidentiality on data related to waste transfer reports.
Accidental releases
19 countries (out of 31) reported accidental releases for 2008 compared to nine countries (out of 30) for
2007. In total, 550 accidental releases of different pollutants for releases to air, water and soil were
reported under E-PRTR in 2008. For 2007, the number of accidental release reports was also 550.
Top polluters
The top 5 polluters for releases to air, water and transfer in water and the top 10 polluters for waste
transfers are presented in this report. For some pollutants and media, facilities with a very high share in
total E-PRTR releases/transfers have been identified in the 2008 data set. Such anomalies might indicate
potential inconsistencies and should be checked by countries.
Stage 2 review findings
The purpose of the stage 2 review was to put the data reported under E-PRTR into context with data
reported under CLRTAP, UNFCCC and EU ETS and to highlight differences between data reported under
different reporting obligations.
Air
Comparison of E-PRTR 2008 with EU ETS 2008
The number of facilities included in EU ETS is about five times higher than the number of facilities
reported under E-PRTR but countries’ total CO2 emissions under both reporting obligations are
comparable. For most of the countries the share of E-PRTR CO2 emissions in the ETS CO2 emissions
ranges between 80 % and 97 %. Five countries, however, reported more emissions under E-PRTR than
under the EU ETS. One of the potential reasons for this is probably that countries have included
emissions from biomass combustion in E-PRTR reporting. Only two countries reported less than 40 %
share of E-PRTR emissions.
Comparison of E-PRTR with CLRTAP/UNFCCC national totals
The releases reported under E-PRTR cover only (large) point sources and should not exceed national
total emissions reported under CLRTAP or UNFCCC, which include all anthropogenic emissions occurring
in the geographical area of the country (large point sources , linear and area sources). If the total E-PRTR
emissions exceed CLRTAP/UNFCCC national total emissions (with or without transport) this indicates
inconsistent reporting of countries under different reporting obligations.
The figures showing the share of different activities in the E-PRTR total releases reflect the structure of
the economies in the individual countries and thus cannot be identical for all countries. The comparison

7
ETC/ACC - ETC/SCP - ETC/W E-PRTR Review 2009 7/162
shows a number of common elements but stage 2 tests also highlighted inconsistencies in reporting
under different obligations such as:
a. Twelve countries reported higher releases under E-PRTR 2008 than their national totals reported
under CLRTAP (SOx – Bulgaria; CO – Iceland; CO2 –Finland, Iceland; HM – Germany, Netherlands,
Portugal; HCB – Belgium, Germany; PCDD/PCDF – Denmark, Iceland, Poland, Portugal, Switzerland;
PCBs – Italy; PAHs – Norway, Portugal, Iceland). In a number of cases the difference is bigger than
200 %.
b. Five countries reported higher emissions under E-PRTR 2008 than their national totals reported
under UNFCCC (PFCs – Belgium, Greece, Norway, Sweden, UK).
c. Eleven countries6, two more than in 2007, did not report emissions to air under CLRTAP 2008 (at
least one pollutant) while reporting such emissions under E-PRTR 2008.
Comparison of E-PRTR with CLRTAP/UNFCCC on the activity level
The comparison of sectoral data has limitations because of the differences between the reporting
obligations under E-PRTR, CLRTAP, UNFCCC and EU ETS. It has to be noted that a) not all E-PRTR
pollutants are reported under CLRTAP/UNFCCC b) a significant share of E-PRTR in CLRTAP/UNFCCC
emissions was observed only in the aggregated sectors A (energy, manufacturing industries and waste
incineration) and C (agriculture) and only for some pollutants.
2008 data are rather comparable to 2007 data. It is a positive development that some inconsistencies
identified in the 2007 datasets do not occur anymore; nevertheless some new anomalies have been
identified in 2008.
SO2, NOx, PM10 and CO2 E-PRTR emissions are occurring mainly in Energy followed by Production of
metals and Mineral industry. Countries reported the highest share of NMVOC emissions from Other
activities, Energy and Chemical Industry. NH3 emissions are reported mainly from Livestock production
and aquaculture and Chemical Industry with the exception of Austria and Switzerland reporting a
significant share of NH3 emissions from Mineral Industry and Sweden from Paper and wood production.
Detailed comparisons on the sectoral level showed that in some cases releases were reported for an E-
PRTR activity (e.g. Energy and heat production) but no emissions were reported under the
corresponding CLRTAP category (in this case 1A1a).
PCDD/PCDF
Reporting of PCDD/PCFD under E-PRTR 2008 is extremely inconsistent between countries. Five countries
have a share of E-PRTR emissions in the national total reported under CLRTAP far above 100 %, while
most other countries have a share below 50 %. In total 212 release reports have been submitted in
2008.
PCDD/PCDF emissions derive from combustion processes. The highest emission factors are reported for
combustion of solid fuels. The most relevant E-PRTR activities that involve releases of PCDD/PCFD are
Production of metals followed by Waste management and Energy.
6 Austria, Belgium, Denmark, France, Hungary, Iceland, Norway, Slovenia, Spain, Switzerland, and United Kingdom

8/162 E-PRTR data review 2009 ETC/ACC - ETC/SCP - ETC/W
Heavy metals
Reporting of heavy metals (HMs) under E-PRTR seems to be relatively frequent compared to other
pollutants. Between 21 and 28 countries reported individual heavy metals in 2008. Reporting of HM
under E-PRTR seems to be even more complete than reporting of HM under the CLRTAP. Germany (Hg),
Malta and Portugal (Zn) reported significantly higher emissions under the E-PRTR than national totals
under CLRTAP, this indicates either incomplete reporting under CLRTAP or errors in the E-PRTR data.
The magnitude of HM emissions in E-PRTR 2008 significantly differs among countries. Reported data
indicate that (large) point sources produce in general between 25 % and 85% of national total HM
emissions. In some cases the share of E-PRTR HM emissions on national totals is more than 90 %.
Waste
The stage 2 review of the E-PRTR dataset for 2008 has been constrained by the fact that other relevant
EU data were not available at the time for the review was conducted. Therefore, the stage 2 review
mainly comprises a comparison between the E-PRTR data for 2008 and 2007, as well as a number of
checks regarding waste incineration plants and landfills.
Comparison of the E-PRTR 2008 data with the 2007 data
The comparison shows that Bulgaria, Denmark, Malta, Slovenia and Spain have, for domestic transfers
of hazardous waste, percentage changes larger than +/-50 %. For transboundary transfers of hazardous
waste Bulgaria, Cyprus, the Czech Republic, Greece, Hungary, Iceland, Italy, Latvia, Luxembourg, the
Netherlands, Portugal, Romania, Spain and Switzerland have changes larger than +/-50 %. For non-
hazardous waste Austria, Cyprus, France, Hungary, Iceland, Latvia, Lithuania, the Netherlands, Norway,
Portugal, Spain and Switzerland have changes larger than +/- 50 %. These large changes in percentage
values might indicate reporting errors in the indicated countries’ reporting, particularly where the
changes in percentage values are related to reasonable high amounts.
The amount of waste reported under most of the included E-PRTR activities has also undergone large
percentage changes between 2007 and 2008. Out of the 44 E-PRTR activities included in the review, 33
reported percentage changes larger than +/-50 % for domestic or transboundary transfer of hazardous
waste or transfer of non-hazardous waste.
A large change in the distribution between disposal and recovery (e.g. the majority of the waste
suddenly goes for disposal in 2008 when in 2007 it was recovered), might also indicate a reporting error
for one of the reporting years. 167 facilities have reported a change in distribution of non-hazardous
waste between disposal and recovery of more than 50 percentage points and more than 5,000 tonnes.
199 facilities have reported a change in distribution of hazardous waste between disposal and recovery
of more than 50 percentage points and more than 1,000 tonnes.
Comparison of E-PRTR data with other sources and estimates
The number of incineration plants of non-hazardous waste reporting to the E-PRTR has been compared
with similar information from the International Solid Waste Association (ISWA). The E-PRTR includes 356
incineration plants and ISWA 377. The net difference of 21 hides a larger gross difference, because not
all facilities reported according to the E-PRTR legislation are included in the ISWA survey and vice versa.

9
ETC/ACC - ETC/SCP - ETC/W E-PRTR Review 2009 9/162
The number of incineration plants reporting CO2 emissions from waste incineration plants has been
compared with CO2 emissions based on ISWA data. Under the E-PRTR only 123 plants reported CO2
emissions, whereas the ISWA survey includes 230 municipal non-hazardous waste incineration plants
with a capacity comparable to the threshold CO2 emission value stipulated by the E-PRTR. This indicates
that a significant number of incineration plants that one would expect to report CO2 emissions under the
E-PRTR are not doing so. This assessment is supported by another check; using the reported amounts of
waste transfers from incineration plants according the E-PRTR to estimate how many incinerations
plants can be expected to report CO2 emissions. The calculation shows that 180 incineration plants
should have reported.
All incineration plants generate hazardous waste from flue gas cleaning. However, 18 incineration plants
have not reported any transfer of hazardous waste.
There is an indication that leachate from landfills has been reported as waste water transfer (reported
as pollutant transfer in water) instead of waste transfer. 74 landfills have reported only waste water
transfer and no waste transfer.
Water
Quality assurance tests were carried out, with the main focus to detect potentially missing urban waste
water treatment plants and inconsistencies between reported UWWTPs in E-PRTR and UWWT Directive
dataset.
Detailed analysis of urban waste water treatment plants for cities with more then 500.000 inhabitants
Detailed analysis of UWWTPs in big cities dealt with the number of reported plants in E-PRTR and
UWWT Directive datasets in cities with more than 500,000 inhabitants. The results indicated that a
number of UWWTPs could potentially be missing from the E-PRTR dataset for 9 out of the 18 countries
covered by the analysis. Other countries either have no cities > 500.000 inhabitants according to the
Urban Audit in the Large City Audit project or they did not report under the UWWT Directive or
information about capacity in the UWWTD dataset was missing.
Identification of corresponding urban waste water treatment plants from E-PRTR and UWWT Directive datasets including comparison of nutrient release data
The comparison of UWWTPs reported to E-PRTR and UWWTD showed that approx. 42 % facilities with
capacity > 100.000 p.e. reported under the UWWTD are not included in E-PRTR. Reasons for this low
percentage could be that a number of the plants covered by the UWWT Directive have only releases
below the pollutant thresholds. This could be due to actual entering loads being below the capacity
and/or treatment efficiencies being higher than the European average.
For a number of countries there are clear indications that the data reported under the E-PRTR
Regulation and the UWWT Directive are inconsistent. The highest inconsistencies can be found in the
United Kingdom (no UWWTP reported under the UWWT Directive although it is covered by the
reporting obligation) and Italy (for which no WWTP are reported under E-PRTR for certain regions).
To obtain a more accurate view, the results were put into context with nutrient release values reported
by twelve countries into the UWWTD dataset. This showed that a large share of potentially missing
facilities in Germany and Denmark and some facilities in Poland have nitrogen and phosphorus releases

10/162 E-PRTR data review 2009 ETC/ACC - ETC/SCP - ETC/W
below the E-PRTR reporting thresholds. However, as reporting of nutrient releases is voluntary under
the UWWTD, most countries have not provided the data and could therefore not be included into the
analysis.
Comparison of E-PRTR total emission load with emissions reported under State of Environment (SoE) emissions reporting
The comparison of the E-PRTR and the SoE dataset focused on total emission load of total nitrogen, total
phosphorus and total organic carbon (TOC) on river basin district level.
Reported industrial releases of nitrogen and phosphorus showed to be significantly higher under E-PRTR
for a number of RBD in Belgium, France, Switzerland and Lithuania. Also when looking at releases from
all sources, a number of countries (Belgium, Bulgaria, France, Iceland and Switzerland) have significantly
higher releases under E-PRTR compared to SoE reporting.
TOC releases were compared for the 4 countries which reported TOC under the SoE reporting. The
comparison showed a high inconsistency for nearly all the RBDs in Belgium, France and Switzerland. For
Austria the data reported under E-PRTR and SoE appear to be consistent.
Identification of potentially missing pollutants in the reported E-PRTR releases to water for urban waste water treatment plants
E-PRTR covers only urban waste water treatment plants (UWWTPs) with a capacity higher than 100.000
p.e. When using average EU treatment efficiencies for N, P and TOC; the total release on an annual basis
of those pollutants will exceed the E-PRTR reporting thresholds if operating with an entering load of at
least 100.000 p.e. and if the UWWTP does not have a significantly higher treatment efficiency than
average efficiencies across Europe.
The evaluation shows that 21%, 30% and 26% of the UWWTP have not reported N, P and TOC releases,
respectively. This is an indication of a potential under reporting of these pollutants.
A further assessment on country level is necessary since no information is available in the E-PRTR
reporting on effective treatment efficiency and entering load (compared to the capacity).
Comparison of IDs reported in the UWWT Directive dataset with the reported E-PRTR IDs
The UWWT directive reporting allows for the reporting of the E-PRTR IDs on national level (voluntary
reporting). For the 4 countries which used this option, the IDs where compared with the national IDs
reported under E-PRTR. For three countries (Portugal, Romania and Slovenia) the reported IDs were
shownto be helpful in the comparison of both datasets. The IDs could be used to confirm the outputs
from the geographical analysis.
For Austria the IDs reported in the UWWT Directive reporting did not correspond to the IDs in the E-
PRTR reporting.

11
ETC/ACC - ETC/SCP - ETC/W E-PRTR Review 2009 11/162
Content
Executive Summary ....................................................................................................................................... 3
Stage 1 review results ................................................................................................................................... 3
Stage 2 review findings ................................................................................................................................. 6
Air .................................................................................................................................................................. 6
Waste .................................................................................................................................................................. 8
Water .................................................................................................................................................................. 9
A Introduction ................................................................................................................................... 14
A.1 Background and objectives ........................................................................................................... 14
A.1.1 Regulation ............................................................................................................................................. 14
A.1.2 Data review ........................................................................................................................................... 14
A.2 Background and objectives ........................................................................................................... 16
A.2.1 Dataset ................................................................................................................................................... 16
A.2.2 Countries covered ................................................................................................................................ 16
A.2.3 Pollutants and waste included in E-PRTR reporting ........................................................................ 16
A.2.4 Activities included in E-PRTR reporting ............................................................................................. 17
A.3 Constraints on the Review ............................................................................................................ 17
B Results of Stage 1 Review ............................................................................................................. 18
B.1 Number of facilities/releases ....................................................................................................... 18
B.1.1 Number of facilities .............................................................................................................................. 19
B.1.2 Number of facilities reporting waste transfers ................................................................................ 21
B.1.3 Number of release/transfer reports .................................................................................................. 22
B.2 Quantity of waste transfers .......................................................................................................... 29
B.3 Reporting of confidential data ..................................................................................................... 32
B.4 Accidental releases ........................................................................................................................ 32
B.5 Top polluting facilities ................................................................................................................... 34
B.5.1 Top polluting facilities for releases to air ......................................................................................... 34
B.5.2 Top polluting facilities for releases to water .................................................................................... 42
B.5.3 Top polluting facilities for transfers in water ................................................................................... 44
B.5.4 Top polluting facilities for waste transfers ....................................................................................... 47
B.6 Contribution of individual facilities to E-PRTR emissions to air for 2008 – sector/activity level ....................................................................................................................... 49
B.6.1 Energy (E-PRTR activity 1) ................................................................................................................... 49
B.6.2 Production and processing of metals (E-PRTR activity 2) ............................................................... 49
B.6.3 Mineral Industry (E-PRTR activity 3) .................................................................................................. 51

12/162 E-PRTR data review 2009 ETC/ACC - ETC/SCP - ETC/W
B.6.4 Chemical Industry (E-PRTR activity 4) ............................................................................................... 51
B.6.5 Waste and Waste Water Handling (E-PRTR Activity 5) ................................................................... 53
B.6.6 Paper and Wood Production and Processing (E-PRTR Activity 6) ................................................. 54
B.6.7 Intensive livestock production and aquaculture (E-PRTR Activity 7)............................................ 54
B.6.8 Animal and vegetable products from the food and beverage sector (E-PRTR Activity 8) ............................................................................................................................................... 55
B.6.9 Other activities (E-PRTR Activity 9) .................................................................................................... 55
C Stage 2 Review – AIR - Comparisons with other data on releases to air ................................. 56
C.1 Comparison of E-PRTR CO2 releases with emissions included in the EU ETS ......................... 60
C.2 Share of main E-PRTR activities in total E-PRTR emissions and comparison of E-PRTR data with national total and sectoral emissions reported under CLRTAP/ UNFCCC ........................................................................................................................................... 62
C.2.1 CO2 .......................................................................................................................................................... 63
C.2.2 SO2 .......................................................................................................................................................... 65
C.2.3 NOx.......................................................................................................................................................... 67
C.2.4 NMVOC .................................................................................................................................................. 69
C.2.5 NH3 ......................................................................................................................................................... 71
C.2.6 PM10 ........................................................................................................................................................ 73
C.2.7 Dioxins and furans (PCDD/PCDF) ....................................................................................................... 74
C.2.8 Mercury (Hg) ......................................................................................................................................... 82
C.2.9 Other heavy metals (HMs) .................................................................................................................. 86
C.3 Refineries, Iron and Steel .............................................................................................................. 90
D Stage 2 Review – Waste- Comparisons with other data on waste transfers .......................... 93
D.1 Comparison of reporting year 2008 with 2007 ........................................................................... 93
D.1.1 Significant changes in distribution of waste transfer for recovery and disposal related to country .............................................................................................................................. 101
D.2 Comparison of E-PRTR data with other sources and estimates ............................................. 103
D.2.1 Capacity of incineration plants (Activity 5.b) compared with the 2006 ISWA survey ................................................................................................................................................... 103
D.2.2 Comparison of CO2 emissions from waste incineration plants (Activity 5.b), with CO2 estimations based on the 2006 ISWA survey data ................................................................ 104
D.2.3 Comparison of CO2 emissions from waste incineration plants of non-hazardous waste (Activity 5.b) with estimations based on E-PRTR waste transfer data ............................ 105
D.2.4 Hazardous waste from incineration plants of non-hazardous waste (Activity 5.b) ................. 106
D.2.5 Leachate from landfills (Activity 5.d) ............................................................................................... 107
E Stage 2 Review – Water Comparisons with other data on releases to water ....................... 109
E.1 Characteristics of the datasets used in the E-PRTR data review ............................................ 109
E.1.1 UWWTD database .............................................................................................................................. 109
E.1.2 SoE Emissions ...................................................................................................................................... 110

13
ETC/ACC - ETC/SCP - ETC/W E-PRTR Review 2009 13/162
E.2 Comparison of E-PRTR data with the Urban Waste Water Treatment Directive data on facility level .................................................................................................................... 111
E.2.1 Data selection criteria for UWWT Directive and E-PRTR datasets .............................................. 112
E.2.2 Analytical procedure used ................................................................................................................ 112
E.2.3 Results of analysis .............................................................................................................................. 114
E.3 SoE emissions and E-PRTR datasets analysis ............................................................................ 121
E.3.1 Data selection criteria and process ................................................................................................. 121
E.4 Identification of pollutants which might be missing for reported E-PRTR facilities ......................................................................................................................................... 124
E.4.1 Expected pollutants in UWWTPs ..................................................................................................... 125
F Lessons learned/ Next steps ....................................................................................................... 132
F.1 Lessons learned ............................................................................................................................ 132
F.2 Next steps ..................................................................................................................................... 133
Units and Abbreviations ........................................................................................................................... 134
APPENDIX I– Pollutants* included in E-PRTR ......................................................................................... 136
APPENDIX II- List of E-PRTR ANNEX I Activities ...................................................................................... 140
APPENDIX III - Number of facilities per activity and country E-PRTR 2008 ......................................... 143
APPENDIX IV – E-PRTR 2008 Number of releases to air per pollutant and country ........................... 145
APPENDIX V – E-PRTR 2008 Number of releases to water per pollutant and per country ................ 148
APPENDIX VI – E-PRTR 2008 Number of transfers in water per pollutant and per country .......................................................................................................................................... 152
APPENDIX VII– Summary table of the number of UWWT plants for each category of the E-PRTR and the UWWT Directive dataset ................................................................................. 156
APPENDIX VIII– Analysis of UWWTPs in big cities - summary results ................................................. 157
APPENDIX IX– Results of total nitrogen emissions comparison SoE and E-PRTR ............................... 158
APPENDIX X– Results of total phosphorus emissions comparison SoE and E-PRTR .......................... 160
APPENDIX XI– Results of total organic carbon emissions comparison SoE and E-PRTR .................... 162
ANNEX A E-PRTR 2008 and 2007 Emissions per pollutant and country (see
separate file)

14/162 E-PRTR data review 2009 ETC/ACC - ETC/SCP - ETC/W
A Introduction
A.1 Background and objectives
A.1.1 Regulation
According to Regulation (EC) No 166/2006 concerning the establishment of a European Pollutant
Release and Transfer Register7 operators that undertake one or more activities specified in Annex I of
the regulation above the capacity threshold have to report their releases to air, water, land, off-site
transfers of waste and of pollutants in waste water if these releases and transfers exceed the thresholds
specified in Annex II of the Regulation. Member States are obliged to submit this data to the European
Commission. E-PRTR is an annual reporting obligation, 2008 was the second reporting year. As
requested by Article 14 of Regulation the European Commission drew up a Guidance Document8, which
supports the implementation of the E-PRTR by addressing among other things the coding of activities,
reporting procedures and the data to be reported. The full dataset is published on the E-PRTR website
http://prtr.ec.europa.eu/.
The European PRTR (E-PRTR) implements at EU level the UNECE PRTR Protocol9, which was signed by
the European Community and 23 Member States in May 2003 in Kiev and which is a Protocol to the
Aarhus Convention10. The E-PRTR succeeds the European Pollutant Emission Register (EPER11), under
which data were reported for the years 200112 and 2004.
A.1.2 Data review
Article 17 of the E-PRTR Regulation7 stipulates that the Commission shall review the data provided by
Member States. However, the 2010 review of E-PRTR data from 2008 is not such a formal review as
required by Article 17. While some of the data review checks performed may be useful as an input for
the future review in accordance with Article 17 this informal review has not been specifically developed
to serve this purpose. The main objective of the informal review organized by the European
Environment Agency is to assist countries in the improvement of the E-PRTR data quality by providing
feedback on potential data quality issues and inconsistencies with other reportings.
EEA has commissioned three of its European topic centers (ETC/ACC13, ETC/SCP14 and ETC/W15) with
checking the E-PRTR data. The review was split up into stage 1 and stage 2. The stage 1 review was
7 http://eur-lex.europa.eu/LexUriServ/site/en/oj/2006/l_033/l_03320060204en00010017.pdf 8 http://prtr.ec.europa.eu/pgDownloadGuidance.aspx 9 UNECE Pollutant Release and Transfer Register (PRTR) Protocol http://www.unece.org/env/pp/prtr.htm 10 UNECE Convention on Access to Information, Public Participation in Decision-making and Access to Justice in Environmental Matters, Aarhus
1998, http://www.unece.org/env/pp/. 11 OJ L 192, 28.7.2000, p. 36 12 Data could, alternatively, be reported for 2000 or 2002 under EPER instead of for 2001. 13 European Topic Centre on Air and Climate Change (ETC/ACC), http://air-climate.eionet.europa.eu/ 14 European Topic Centre on Sustainable Consumption and Production (ETC/SCP), http://scp.eionet.europa.eu/ 15 European Topic Centre on Water (ETC/W), http://water.eionet.europa.eu/

15
ETC/ACC - ETC/SCP - ETC/W E-PRTR Review 2009 15/162
carried out by ETC/ACC for all media. For stage 2, ETC/ACC carried out the review of releases to air,
whereas ETC/W and ETC/SCP reviewed releases to water and transfers of waste, respectively.
As indicated above, the main objective of the 2010 review performed by ETC ACC, ETC/W and ETC/SCP
has been to improve E-PRTR data quality by providing feedback to the countries on their data submitted
under E-PRTR. The E-PRTR data have been reviewed in two stages:
The stage 1 review aimed at providing detailed feedback to countries concerning the quality of the E-
PRTR data reported. The checks cover an evaluation of the number of facilities and release reports,
quantities of releases and transfers reported, confidentiality claims, accidental releases, etc.
The purpose of the stage 2 review was to put the data reported under E-PRTR into context with data
reported under other official or voluntary reporting, and to highlight differences between data
reported under different reporting obligations. The review covered the releases of pollutants to air
and water as well as the waste transfers. The data used for the comparisons are the following:
Stage 2 review covering the releases to air: data reported under CLRTAP, UNFCCC and EU ETS16
Stage 2 review covering the releases to waste: data on transboundary shipments of waste and
The ISWA study ‘Energy from Waste. State‐of‐the‐Art‐Report’ of 2006.
Stage 2 review covering the releases to water: data reported under the UWWTP Directive
reporting and the State of Environment (SoE) reporting.
It has to be pointed out that the stage 1 and 2 review can highlight potential inconsistencies and
anomalies in reported data, but cannot check whether the data that have been submitted by the
countries are correct or not. It is the responsibility of the country to check highlighted issues and
improve submissions where needed.
The main objective of this report is to provide summary information on the review process and the
review findings. Within the review process the following feedback was provided to the countries:
Excel sheets with pre-defined country-specific queries17
Country-specific feedback reports covering the stage 1 and stage 2 review18
Excel sheets and maps covering stage 2 checks for releases to air and water19
All the results can be downloaded from the Eionet CIRCA website by using the Eionet username.
16 CLRTAP and UNFCCC inventories used for comparisons are the ones reported to EEA via CDR. EU ETS data are downloaded from the
Community Independent Transaction Log (CITL). 17 Published on 30 July on the Eionet CIRCA website at: http://eea.eionet.europa.eu/Members/irc/eionet-circle/e-prtr/library?l=/e-
prtr/country_feedback/2010_2008_dataset/stage_stage_august_2010/e-prtr_stage1_uploaded&vm=detailed&sb=Title 18 Published on 1 September on Eionet CIRCA website at: http://eea.eionet.europa.eu/Members/irc/eionet-circle/e-prtr/library?l=/e-
prtr/country_feedback/2010_2008_dataset/stage_stage_august_2010/country-specific&vm=detailed&sb=Title 19 Published on 1 September on Eionet CIRCA website at:http://eea.eionet.europa.eu/Members/irc/eionet-circle/e-prtr/library?l=/e-
prtr/country_feedback/2010_2008_dataset/stage_stage_august_2010/e-prtr_stage_files&vm=detailed&sb=Title

16/162 E-PRTR data review 2009 ETC/ACC - ETC/SCP - ETC/W
A.2 Background and objectives
A.2.1 Dataset
The informal review was carried out on the dataset which was published on the E-PRTR website on 8
June 2010 and which included the official submissions of countries by 27/05/201020 and the
resubmissions of the 2007 data (resubmitted by 01/03/2010).
A.2.2 Countries covered
The 2010 informal E-PRTR data review involved in total 31 countries compared to 30 countries in the
2009 review. Switzerland reported for the first time to E-PRTR in 2010, delivering data for 2007 and
2008 and was thus not covered in the 2009 E-PRTR review.
E-PRTR 2007 and 2008 includes now data from 31 countries; the EU-27 (Austria, Belgium, Bulgaria,
Cyprus, Czech Republic, Denmark, Estonia, Finland, France, Germany, Greece, Hungary, Ireland, Italy,
Latvia, Lithuania, Luxembourg, Malta, the Netherlands, Poland, Portugal, Romania, Slovakia, Slovenia,
Spain, Sweden and the United Kingdom) plus Norway, Iceland, Liechtenstein and Switzerland.
A.2.3 Pollutants and waste included in E-PRTR reporting
The E-PRTR Regulation (No 166/2006/EC)21, lists 91 pollutants in its Annex II; 59 of these concern
emissions to air, 71 emissions to water and 61 emissions to soil. For each of these pollutants threshold
values are defined. If a facility exceeds these threshold values, the release/transfer has to be reported.
The pollutants are grouped as following:
chlorinated organic substances
greenhouse gases
heavy metals
inorganic substances
other gases
other organic substances
pesticides
For the full list of the E-PRTR pollutants including the respective thresholds see Appendix I of this report.
The reporting of carbon dioxide (CO2) under E-PRTR requires the reporting of the total mass of CO2
which indicates that CO2 including releases from biomass have to be reported. In addition, countries
have been given the possibility to report on a voluntary basis (not included in Annex II of the E-PRTR
Regulation) CO2 excluding biomass.
Facilities are required to report on off-side transfers of waste under the E-PRTR Regulation, when the
total transfers of hazardous waste exceed two tonnes or the total transfer of non hazardous waste
exceeds 2,000 tonnes.
20 The dataset can be downloaded at the EEA data service: http://www.eea.europa.eu/data-and-maps/data/member-states-reporting-
art-7-under-the-european-pollutant-release-and-transfer-register-e-prtr-regulation 21 http://eur-lex.europa.eu/LexUriServ/site/en/oj/2006/l_033/l_03320060204en00010017.pdf

17
ETC/ACC - ETC/SCP - ETC/W E-PRTR Review 2009 17/162
A.2.4 Activities included in E-PRTR reporting
E-PRTR includes 65 activities listed in Annex I of the PRTR Regulation21. An operator of a facility that
undertakes one or more activities specified in Annex I of the Regulation above the capacity thresholds
shall report the amounts annually. All releases occurring in individual facilities are recorded under the
main activity. Other activities appearing in the facility are provided as additional information. For a full
list of E-PRTR activities and thresholds see ‘APPENDIX II- List of E-PRTR ANNEX I Activities’ of this
document.
A.3 Constraints on the Review
The stage 1 E-PRTR data review carried out in 2010 has been subject to the following constraints:
Incompleteness of the E-PRTR dataset
Some data were not imported in the E-PRTR register due to technical issues related to the data format,
confidentiality claims or delays in data collection, validation and compilation. This has an effect on the
completeness of the E-PRTR 2008 dataset and thus influences the results of the review. For the E-PRTR
dataset of 8th June 2010, the Commission has received a list of facilities for which the reported data are
incomplete from Germany and Italy22.
Large number of pollutants and activities
Based on the large number of pollutants (91) and (sub-) activities (65) under E-PRTR it is difficult to
follow up all findings highlighted by the automated tests because all pollutants would have to be
selected and analyzed individually. The priority for air emissions has thus been given to the NECD
pollutants, CO2 and PM10. Compared to 2009 review report in this report a few comparisons have been
also performed for HMs and PCDD/PCDF. The priority for water releases has been given to heavy metals,
total nitrogen, total phosphorus and total organic carbon.
22 The overview is available on the Eionet CCIRCA website at: http://eea.eionet.europa.eu/Members/irc/eionet-circle/e-
prtr/library?l=/e-prtr/country_feedback/2010_2008_dataset/stage_stage_august_2010/incompleteness_e-prtr/facilities_germanypdf/_EN_1.0_&a=d

18/162 E-PRTR data review 2009 ETC/ACC - ETC/SCP - ETC/W
B Results of Stage 1 Review
In this chapter selected findings of the stage 1 review are presented. Since there are 91 pollutants
covered under E-PRTR not all findings from the stage 1 review at a pollutant level can be included in this
report. Information on total E-PRTR releases/transfers in (kg/year) per pollutant and media in individual
countries and regions can be found in the Excel files that were provided to the countries23.
The presented figures for 2007 vary from those included in the E-PRTR Review report 2009 for two
reasons. Firstly, data from Switzerland are included already from 2007 onwards and secondly E-PRTR
countries have resubmitted their datasets for 2007 in the meantime and corrected data anomalies that
were identified in last year’s E-PRTR review.
B.1 Number of facilities/releases
A facility refers to one or more installations on the same site that are operated by the same natural or
legal person. A pollutant release/transfer report is defined as a release or transfer reported for a specific
pollutant by a specific facility in a specific year. For example facility ‘A’ reports in 2008 releases to air for
CO2, SO2, NOx and Cd. This means that it reports four pollutants, which equals four release reports for
facility ‘A’ in 2008.
Figure B.1 shows the number of facilities reported by country for E-PRTR 2008 in comparison to E-PRTR
2007. The graph also illustrates the number of new facilities and the number of facilities that had
already reported in previous reporting years.
A comparison of the number of facilities between years might serve as an indicator of completeness of
reported data. The following issues can be observed:
The total number of facilities under E-PRTR 2008 amounted to 25,162 (EU-27, Iceland, Liechtenstein,
Norway, Switzerland) compared to 25,608 facilities reported for 2007 resubmitted in 2010 (this would
represent a decrease in the number of facilities of about 2 %). However, the total number of E-PRTR
2007 facilities initially reported in 2009 amounted to only 24 313 (including Switzerland the number
would be 24,524). This indicates that, comparing the initial data sets, reporting under E-PRTR slightly
improved (3 %) in 2010.
The situation in individual countries differs; seven countries reported fewer facilities in 2008 than in
2007, two countries reported the same number and 20 countries reported more facilities in 2008 than in
2007. The overall number of facilities has declined because the decrease in the number of facilities
reported by the first group of countries is quite significant, e.g. 48 % in Poland and 24 % in Italy.
About 22 % of the facilities that were included under E-PRTR 2007 are not included anymore under E-
PRTR 2008. The highest number of facilities disappeared in Poland with 1,528 facilities.
About 21 % of the facilities reporting in 2008 were reported as new compared to E-PRTR 2007.
23 Published on 30 July on the Eionet CIRCA website at: http://eea.eionet.europa.eu/Members/irc/eionet-circle/e-prtr/library?l=/e-
prtr/country_feedback/2010_2008_dataset/stage_stage_august_2010/e-prtr_stage1_uploaded&vm=detailed&sb=Title
19
ETC/ACC - ETC/SCP - ETC/W E-PRTR Review 2009 19/162
B.1.1 Number of facilities
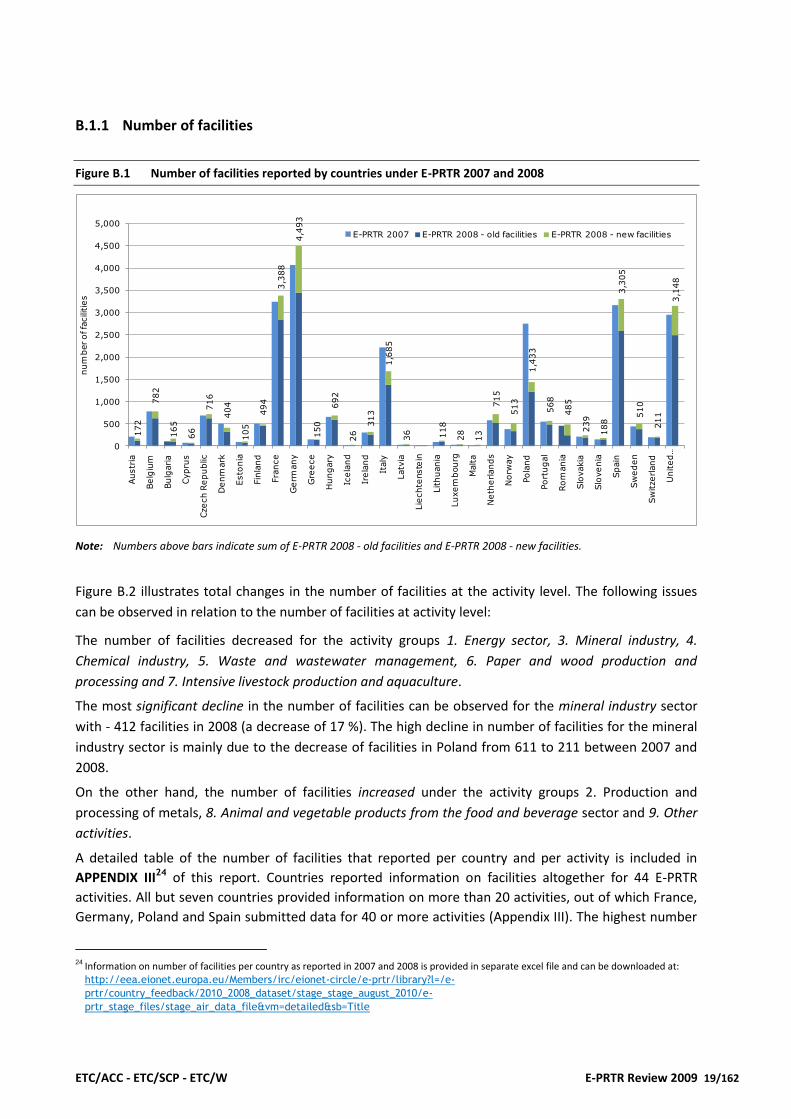
Figure B.1 Number of facilities reported by countries under E-PRTR 2007 and 2008
172
782
165
66
716
404
105
494
3,3
88
4,4
93
150
692
26
313
1,6
85
36 118
28
13
715
513
1,4
33
568
485
239
188
3,3
05
510
211
3,1
48
0
500
1,000
1,500
2,000
2,500
3,000
3,500
4,000
4,500
5,000
Austr
ia
Belg
ium
Bulg
aria
Cypru
s
Czech R
epublic
Denm
ark
Esto
nia
Fin
land
Fra
nce
Germ
any
Gre
ece
Hungary
Icela
nd
Irela
nd
Italy
Latv
ia
Lie
chte
nste
in
Lithuania
Luxem
bourg
Malta
Neth
erlands
Norw
ay
Pola
nd
Port
ugal
Rom
ania
Slo
vakia
Slo
venia
Spain
Sw
eden
Sw
itze
rland
United …
num
ber of fa
cili
ties
E-PRTR 2007 E-PRTR 2008 - old facilities E-PRTR 2008 - new facilities
Note: Numbers above bars indicate sum of E-PRTR 2008 - old facilities and E-PRTR 2008 - new facilities.
Figure B.2 illustrates total changes in the number of facilities at the activity level. The following issues
can be observed in relation to the number of facilities at activity level:
The number of facilities decreased for the activity groups 1. Energy sector, 3. Mineral industry, 4.
Chemical industry, 5. Waste and wastewater management, 6. Paper and wood production and
processing and 7. Intensive livestock production and aquaculture.
The most significant decline in the number of facilities can be observed for the mineral industry sector
with - 412 facilities in 2008 (a decrease of 17 %). The high decline in number of facilities for the mineral
industry sector is mainly due to the decrease of facilities in Poland from 611 to 211 between 2007 and
2008.
On the other hand, the number of facilities increased under the activity groups 2. Production and
processing of metals, 8. Animal and vegetable products from the food and beverage sector and 9. Other
activities.
A detailed table of the number of facilities that reported per country and per activity is included in
APPENDIX III24 of this report. Countries reported information on facilities altogether for 44 E-PRTR
activities. All but seven countries provided information on more than 20 activities, out of which France,
Germany, Poland and Spain submitted data for 40 or more activities (Appendix III). The highest number
24 Information on number of facilities per country as reported in 2007 and 2008 is provided in separate excel file and can be downloaded at:
http://eea.eionet.europa.eu/Members/irc/eionet-circle/e-prtr/library?l=/e-
prtr/country_feedback/2010_2008_dataset/stage_stage_august_2010/e-
prtr_stage_files/stage_air_data_file&vm=detailed&sb=Title

20/162 E-PRTR data review 2009 ETC/ACC - ETC/SCP - ETC/W
of countries (28 or more) reported facilities in activities 1(c), 2 (e), 3(c), 4(a), 5(d) and 5(f). On the other
hand, less than five countries submitted data for activity 1(b), 1(e) and 1(f).
Figure B.2 Change in number of facilities per activity group between E-PRTR 2008 and 2007
-500
-400
-300
-200
-100
0
100
200
1 2 3 4 5 6 7 8 9
Ch
an
ge in
nu
mb
er
of
facil
itie
s
Activities
Activities:
1 – Energy
2 – Production and processing of metals
3 – Mineral industry
4 – Chemical industry
5 – Waste and wastewater management
6 – Paper and wood production and processing
7 – Intensive livestock production and aquaculture
8 – Animal and vegetable products from the food and beverage sector
9 – Other activities
Another interesting finding concerning the number of facilities is that eight countries reported in total
433 facilities for 2008 without any release/transfer report attached to them (Table B.1). In 2007, the
number of facilities without any release/transfer report attached to them was even higher with 1,530
facilities mostly reported by Poland. The reasons for this can be either that the facility actually did not
report any release/transfer report or that the facility reported releases below the threshold. Only in the
first case facilities without any release/transfer report attached to them are an issue that should be
checked by countries because those facilities should not have been reported to E-PRTR.25 Table
illustrates the number of facilities without any release/transfer report attached to them by E-PRTR
country.
25 Since the E-PRTR review is carried out on the public E-PRTR database, which does not include releases/transfers below the threshold, it is not
possible for the ETC/ACC to distinguish between facilities without any release/transfer report and facilities with releases/transfers below the
threshold.

21
ETC/ACC - ETC/SCP - ETC/W E-PRTR Review 2009 21/162
Table B.1 Number of facilities without any release/transfer report per country
Country No of facilities without release/transfer report
2007
% of total no of facilities in
2007
No of facilities without release/transfer report
2008
% of total no of facilities in 2008
Hungary 1 0.1%
Iceland 4 15.4%
Netherlands 1 0.1%
Norway 15 3.9% 130 25.3%
Poland 1,510 54.8% 145 10.1%
Slovenia 10 5.3%
Switzerland 5 2.6% 7 3.3%
United Kingdom 134 4.3%
Total 1,530 6.0% 433 1.7%
B.1.2 Number of facilities reporting waste transfers
Figure B.3 Number of facilities reporting waste under E-PRTR 2008
0
500
1,000
1,500
2,000
2,500
3,000
3,500
Austr
ia
Belg
ium
Bulg
aria
Cypru
s
Czech R
epublic
Denm
ark
Esto
nia
Fin
land
Fra
nce
Germ
any
Gre
ece
Hungary
Icela
nd
Irela
nd
Italy
Latv
ia
Lie
chte
nste
in
Lithuania
Luxem
bourg
Malta
Neth
erlands
Norw
ay
Pola
nd
Port
ugal
Rom
ania
Slo
vakia
Slo
venia
Spain
Sw
eden
Sw
itzerland
United K
ingdom
Num
ber of fa
cilitie
s
Hazardous waste
outside country
Hazardous waste
within country
Non-hazardous
waste
Figure B.3 presents the number of facilities reporting waste per country under E-PRTR 2008. The waste
types are non-hazardous waste, hazardous waste within country and hazardous waste outside country.
In total, 14,515 facilities reported transfers of hazardous waste within country, 7,333 facilities reported
transfers of non-hazardous waste and only 1,234 facilities reported transfers of hazardous waste outside
country.

22/162 E-PRTR data review 2009 ETC/ACC - ETC/SCP - ETC/W
The number of facilities reporting waste has changed considerably for some countries. For example, in
Norway the number of facilities reporting waste increased by 80 % between 2007 and 2008. Figure B.4
illustrates the change in the number of facilities reporting waste between 2007 and 2008 for all
countries. In most countries the changes are in the range of +/- 20 %. However, in 10 E-PRTR countries
changes are higher.
Figure B.4 Change in number of facilities reporting waste between 2007 and 2008
-22
35
26
-3
63
-15
15
9
268
473
15
30
-2
11
-494
6
0
21
-1
2
166
88
68 31
22
46
50
201
138
121
22
-40%
-20%
0%
20%
40%
60%
80%
100%
Austr
ia
Belg
ium
Bulg
ari
a
Cypru
s
Czech R
epublic
Denm
ark
Esto
nia
Fin
land
Fra
nce
Germ
any
Gre
ece
Hungary
Icela
nd
Irela
nd
Italy
Latv
ia
Lie
chte
nste
in
Lithuania
Luxem
bourg
Malta
Neth
erl
ands
Norw
ay
Pola
nd
Port
ugal
Rom
ania
Slo
vakia
Slo
venia
Spain
Sw
eden
Sw
itzerl
and
United K
ingdom
Note: The bars indicate the relative change in the number of facilities whereas the numbers attached to the bars indicate the
absolute change in number of facilities reporting waste between 2007 and 2008.
B.1.3 Number of release/transfer reports
The total number of release/transfer reports reported under E-PRTR for the media air, water, transfer in
water and soil amounted to 39,861 reports in E-PRTR 2008 compared to 38,328 E-PRTR 2007 reports
submitted in 2009. This is an increase of about 4 %, which indicates improvement in reporting by
Comparing E-PRTR 2008 reports with resubmitted 2007 data in 2010 (40,984 release reports), however,
a decrease of about 3 % can be seen. Possible reasons for the difference in the number of
release/transfer reports in 2010 are a potential lower level of completeness of the reporting in 2008, a
higher number of releases/transfers below the E-PRTR threshold compared to in 2007, etc.
Figure B.5 illustrates the total number of release/transfer reports for air, water, transfer in water and
soil under E-PRTR 2008 compared to E-PRTR 2007. Several countries, e.g. Iceland, Denmark, Estonia,
Malta, the Netherlands and Portugal reported more release/transfer reports than under E-PRTR 2007.
On the other hand, several countries reported fewer release/transfer reports under E-PRTR 2008, e.g.
Ireland, Italy, Latvia and Norway. The number of release/transfer reports in Italy for 2008 fell under 50 %
of the number of release/transfer reports for 2007.

23
ETC/ACC - ETC/SCP - ETC/W E-PRTR Review 2009 23/162
Figure B.5 Total number of release/transfer reports under E-PRTR 2008 compared to E-PRTR 2007 (air, water, transfer in water, soil)
0%
50%
100%
150%
200%
250%
300%
350%
Austr
ia
Belg
ium
Bulg
ari
a
Cypru
s
Czech R
epublic
Denm
ark
Esto
nia
Fin
land
Fra
nce
Germ
any
Gre
ece
Hungary
Icela
nd
Irela
nd
Italy
Latv
ia
Lithuania
Luxem
bourg
Malta
Neth
erl
ands
Norw
ay
Pola
nd
Port
ugal
Rom
ania
Slo
vakia
Slo
venia
Spain
Sw
eden
Sw
itzerl
and
United K
ingdom
All c
ountr
ies
E-PRTR 2008 E-PRTR 2007
Note: Due to the fact that Liechtenstein did not report any release/transfer reports to air, water, transfer in water or soil it is
not included in this graph.
B.1.3.1 Number of release reports to air
Figure B.6 presents the number of release reports to air per country for E-PRTR 2007 and E-PRTR 2008.
The total number of release reports to air for all countries under E-PRTR 2008 amounted to 22,257
compared to 23,146 under E-PRTR 2007 indicating a decrease in release reports to air of about 4 %. The
situation varies between individual countries – some submitted more release reports to air for 2008 and
some fewer (see Figure B.6). The decrease in the number of release reports to air was most significant in
Italy where the number of release reports to air in 2008 fell to only 50 % of the number in 2007.
A detailed table of the number of release reports to air per country and pollutant is included in
APPENDIX IV – E-PRTR 2008 Number of releases to air per pollutant and country of this report.

24/162 E-PRTR data review 2009 ETC/ACC - ETC/SCP - ETC/W
Figure B.6 Number of release reports to air under E-PRTR 2008 and E-PRTR 2007
129
829
224
98
781
260
99
558
2808
2801
304 529
43 2
40
937
31 103
45
22
734
266
1464
696
579
212
137
3534
617
147
3030
0
500
1000
1500
2000
2500
3000
3500
4000
Austr
ia
Belg
ium
Bulg
ari
a
Cypru
s
Czech R
epublic
Denm
ark
Esto
nia
Fin
land
Fra
nce
Germ
any
Gre
ece
Hungary
Icela
nd
Irela
nd
Italy
Latv
ia
Lic
hte
nste
in
Lithuania
Luxem
bourg
Malta
Neth
erl
ands
Norw
ay
Pola
nd
Port
ugal
Rom
ania
Slo
vakia
Slo
venia
Spain
Sw
eden
Sw
itzerl
and
United K
ingdom
num
ber
of re
lease
s
Air
E-PRTR 2007 E-PRTR 2008
Note: Liechtenstein did not report any release report to air and is thus not included in this graph.
Individual countries provided release reports to air for ten to 49 pollutants with the exception of
Liechtenstein, which did not report any releases to air. Most countries (30) reported releases of CO2, CH4
and SOx; 29 countries of NOx; 28 countries of NH3, CO, Ni and NMVOC and 27 countries releases of As,
N2O, PM10 and Zn. Release reports for other heavy metals (Hg, Cd, Cr, and Cu) were also provided by
more than 20 countries. On the other hand, ten pollutants (Aldrin, Chlordane, Chlordecone, DDT,
Dieldrin, Endrin, Heptachlor, Lindane, Mirex, Toxaphene) out of the 60 with a threshold for releases to
air in Annex II of the E-PRTR Regulation were not reported by any E-PRTR facility. Eight pollutants
(Benzo(g,h,i)perylene, Chlorides, Fluorides, Phenols, Toluene, Total nitrogen, Total organic carbon (TOC),
Xylenes) were reported as releases to air although there was no threshold to air included in Annex II of
the E-PRTR Regulation for these pollutants. This might be a potential anomaly in data and should be
checked by the countries concerned (Netherlands, Norway, United Kingdom).
Ten pollutants were reported by only one country in one or more release reports to air. The number in
the brackets indicates the number of release reports: Belgium – Hexabromobiphenyl (1); France – HCH
(1); Germany – Asbestos (1); Netherlands – Benzo(g,h,i)perylene (1); United Kingdom – Toluene (5),
Xylenes (1); Norway - Chlorides (4), Fluorides (14), Total Nitrogen (1), Total Organic Carbon (19).
There might be different reasons for the limited number of release reports for some pollutants. Either
the E-PRTR threshold is too high or no estimation methodology exists for this pollutant or country data
is incomplete (does not include all relevant E-PRTR facilities or not all relevant releases for all E-PRTR
facilities).

25
ETC/ACC - ETC/SCP - ETC/W E-PRTR Review 2009 25/162
Detailed maps showing the distribution of facilities reported per country, per media, per activity or per
pollutant can be visited at E-PRTR web site http://prtr.ec.europa.eu/MapSearch.aspx. The map in
Figure C.7 illustrates the density of E-PRTR facilities (small black dots) with releases to air in individual
countries. The map also indicates sources allocated outside country borders (bigger colorful dots). Most
of the E-PRTR sources placed outside country borders seem to have correct coordinates (e.g. fisheries or
drilling platforms) but some might be misplaced. However ETC/ACC does not have enough information
to check the coordinates. Austria, France, Italy, Malta, Norway, Poland, Romania, Spain and United
Kingdom might consider checking sources reported outside their borders.

26/162 E-PRTR data review 2009 ETC/ACC - ETC/SCP - ETC/W
Figure B.7 Facilities with releases to air in E-PRTR 2008; inside country (small black dots) and outside county (see legend)
ETC/ACC - ETC/SCP - ETC/W E-PRTR Review 2009 27/162
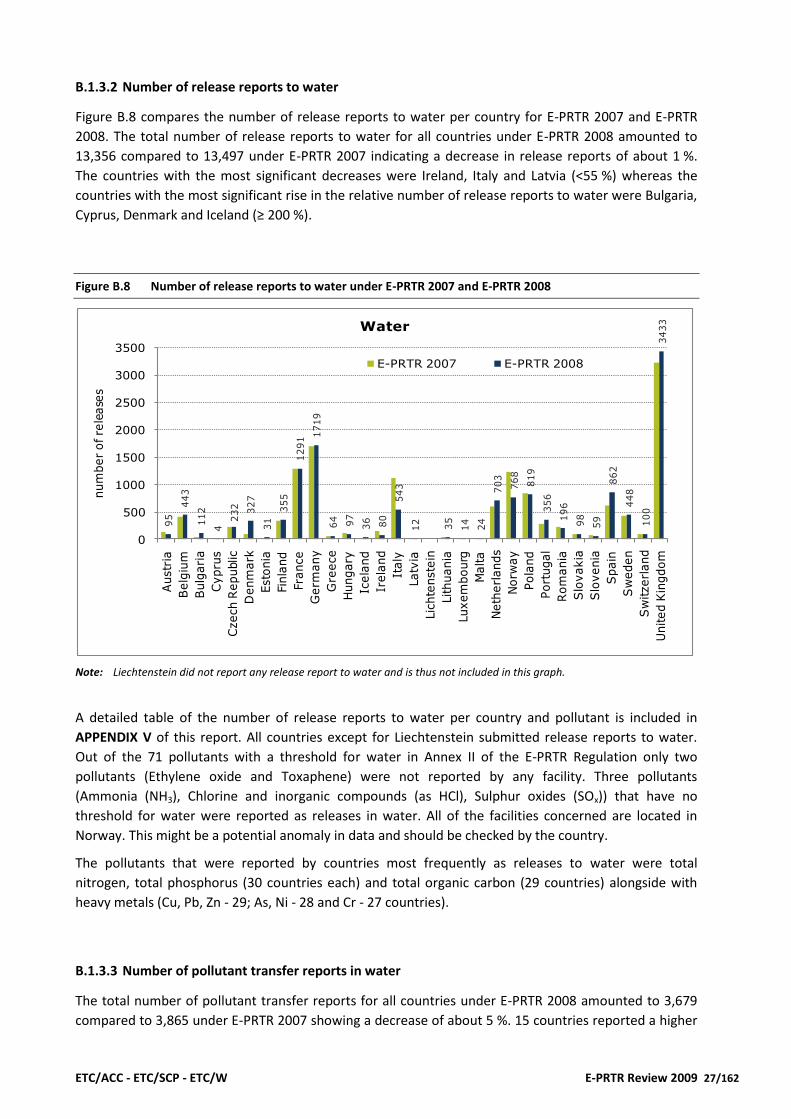
B.1.3.2 Number of release reports to water
Figure B.8 compares the number of release reports to water per country for E-PRTR 2007 and E-PRTR
2008. The total number of release reports to water for all countries under E-PRTR 2008 amounted to
13,356 compared to 13,497 under E-PRTR 2007 indicating a decrease in release reports of about 1 %.
The countries with the most significant decreases were Ireland, Italy and Latvia (<55 %) whereas the
countries with the most significant rise in the relative number of release reports to water were Bulgaria,
Cyprus, Denmark and Iceland (≥ 200 %).
Figure B.8 Number of release reports to water under E-PRTR 2007 and E-PRTR 2008
95
443
112
4
232 327
31
355
1291
1719
64 97
36 80
543
12
35
14
24
703
768
819
356
196
98
59
862
448
100
3433
0
500
1000
1500
2000
2500
3000
3500
Austr
ia
Belg
ium
Bulg
ari
a
Cypru
s
Czech R
epublic
Denm
ark
Esto
nia
Fin
land
Fra
nce
Germ
any
Gre
ece
Hungary
Icela
nd
Irela
nd
Italy
Latv
ia
Lic
hte
nste
in
Lithuania
Luxem
bourg
Malta
Neth
erl
ands
Norw
ay
Pola
nd
Port
ugal
Rom
ania
Slo
vakia
Slo
venia
Spain
Sw
eden
Sw
itzerl
and
United K
ingdom
num
ber
of re
lease
s
Water
E-PRTR 2007 E-PRTR 2008
Note: Liechtenstein did not report any release report to water and is thus not included in this graph.
A detailed table of the number of release reports to water per country and pollutant is included in
APPENDIX V of this report. All countries except for Liechtenstein submitted release reports to water.
Out of the 71 pollutants with a threshold for water in Annex II of the E-PRTR Regulation only two
pollutants (Ethylene oxide and Toxaphene) were not reported by any facility. Three pollutants
(Ammonia (NH3), Chlorine and inorganic compounds (as HCl), Sulphur oxides (SOx)) that have no
threshold for water were reported as releases in water. All of the facilities concerned are located in
Norway. This might be a potential anomaly in data and should be checked by the country.
The pollutants that were reported by countries most frequently as releases to water were total
nitrogen, total phosphorus (30 countries each) and total organic carbon (29 countries) alongside with
heavy metals (Cu, Pb, Zn - 29; As, Ni - 28 and Cr - 27 countries).
B.1.3.3 Number of pollutant transfer reports in water
The total number of pollutant transfer reports for all countries under E-PRTR 2008 amounted to 3,679
compared to 3,865 under E-PRTR 2007 showing a decrease of about 5 %. 15 countries reported a higher
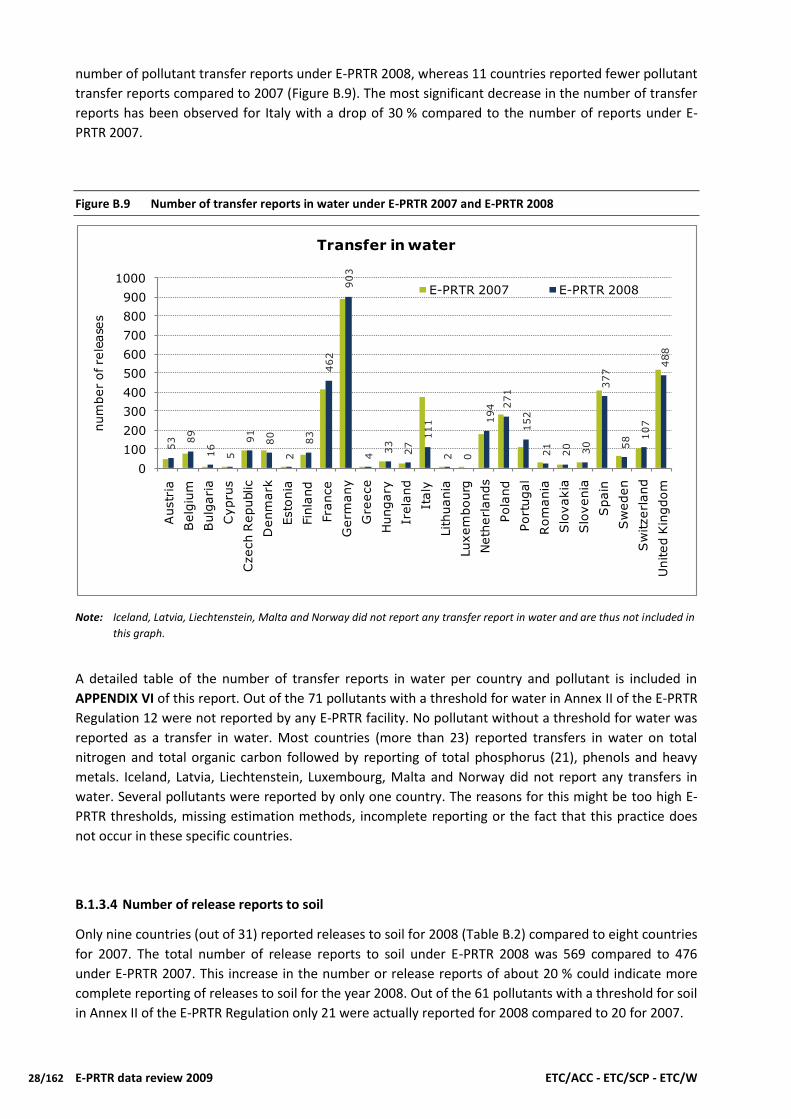
28/162 E-PRTR data review 2009 ETC/ACC - ETC/SCP - ETC/W
number of pollutant transfer reports under E-PRTR 2008, whereas 11 countries reported fewer pollutant
transfer reports compared to 2007 (Figure B.9). The most significant decrease in the number of transfer
reports has been observed for Italy with a drop of 30 % compared to the number of reports under E-
PRTR 2007.
Figure B.9 Number of transfer reports in water under E-PRTR 2007 and E-PRTR 2008
53 89
16
5
91
80
2
83
462
903
4
33
27
111
2 0
194 2
71
152
21
20 30
377
58 1
07
488
0
100
200
300
400
500
600
700
800
900
1000
Austr
ia
Belg
ium
Bulg
ari
a
Cypru
s
Czech R
epublic
Denm
ark
Esto
nia
Fin
land
Fra
nce
Germ
any
Gre
ece
Hungary
Irela
nd
Italy
Lithuania
Luxem
bourg
Neth
erl
ands
Pola
nd
Port
ugal
Rom
ania
Slo
vakia
Slo
venia
Spain
Sw
eden
Sw
itzerl
and
United K
ingdom
num
ber
of re
lease
s
Transfer in water
E-PRTR 2007 E-PRTR 2008
Note: Iceland, Latvia, Liechtenstein, Malta and Norway did not report any transfer report in water and are thus not included in
this graph.
A detailed table of the number of transfer reports in water per country and pollutant is included in
APPENDIX VI of this report. Out of the 71 pollutants with a threshold for water in Annex II of the E-PRTR
Regulation 12 were not reported by any E-PRTR facility. No pollutant without a threshold for water was
reported as a transfer in water. Most countries (more than 23) reported transfers in water on total
nitrogen and total organic carbon followed by reporting of total phosphorus (21), phenols and heavy
metals. Iceland, Latvia, Liechtenstein, Luxembourg, Malta and Norway did not report any transfers in
water. Several pollutants were reported by only one country. The reasons for this might be too high E-
PRTR thresholds, missing estimation methods, incomplete reporting or the fact that this practice does
not occur in these specific countries.
B.1.3.4 Number of release reports to soil
Only nine countries (out of 31) reported releases to soil for 2008 (Table B.2) compared to eight countries
for 2007. The total number of release reports to soil under E-PRTR 2008 was 569 compared to 476
under E-PRTR 2007. This increase in the number or release reports of about 20 % could indicate more
complete reporting of releases to soil for the year 2008. Out of the 61 pollutants with a threshold for soil
in Annex II of the E-PRTR Regulation only 21 were actually reported for 2008 compared to 20 for 2007.

ETC/ACC - ETC/SCP - ETC/W E-PRTR Review 2009 29/162
Table B.2 Number of facilities and release reports to soil under E-PRTR 2007 and 2008
Country Number of
facilities 2007 Number of facility
reports 2007
Number of facilities 2008
Number of facility reports 2008
Bulgaria 0 0 4 4
France 370 94 460 118
Germany 18 2 28 6
Ireland 2 2 0 0
Italy 3 1 4 1
Norway 1 1 7 3
Poland 0 0 1 1
Portugal 1 1 0 0
Slovakia 3 2 15 2
Spain 0 0 6 1
United Kingdom 78 19 44 9
Although only nine countries report releases to soil, is it not possible to draw any conclusions on the completeness of reporting across countries. In some countries releases to land as described in the E-PRTR Guidance document are namely not allowed under national legislation.
B.2 Quantity of waste transfers
The waste types that are reported under E-PRTR are hazardous waste within country, hazardous waste
outside country (transboundary movement of hazardous waste) and non-hazardous waste. The waste
treatment types are disposal and recovery.
Figure B.10 Total quantity of waste by waste types under E-PRTR 2007 and 2008
0
50
100
150
200
250
300
350
400
450
2007 2008
Mil
lio
n t
/a
Hazardous waste outside country
Hazardous waste within country
Non-hazardous waste

30/162 E-PRTR data review 2009 ETC/ACC - ETC/SCP - ETC/W
The total quantity of waste reported under E-PRTR 2008 by all countries was about 415 million tonnes
per year compared to 362 million tonnes under E-PRTR 2007 (Figure B.10). This represents an increase
of about 15 % in the total quantity of reported waste. For 2008, hazardous waste within country
amounted to about 35.5 million tonnes per year (8 % of total) and hazardous waste outside country to
about 7.9 million tonnes per year (2 % of total). The quantity of non-hazardous waste transfers
accounted for 371.8 million tonnes per year (90 % of total). Figure B.10 shows that the amount of non-
hazardous waste and hazardous waste outside country increased significantly between 2007 and 2008.
The distribution between waste types differs between countries, but non-hazardous waste is generally
the dominant waste type that has been reported by all countries (Figure B.10). Norway is the only
country where non-hazardous and hazardous waste have about an equal share.
Figure B.11 Total quantity of waste reported by countries under E-PRTR 2007 and 2008
0
10 000 000
20 000 000
30 000 000
40 000 000
50 000 000
60 000 000
70 000 000
80 000 000
90 000 000
Austr
ia
Belg
ium
Bulg
ari
a
Cypru
s
Czech R
epublic
Denm
ark
Esto
nia
Fin
land
Fra
nce
Germ
any
Gre
ece
Hungary
Icela
nd
Irela
nd
Italy
Latv
ia
Lie
chte
nste
in
Lithuania
Luxem
bourg
Malta
Neth
erl
ands
Norw
ay
Pola
nd
Port
ugal
Rom
ania
Slo
vakia
Slo
venia
Spain
Sw
eden
Sw
itzerl
and
United K
ingdom
in k
t/a
2007 2008
In most countries there was only little change in total quantity of waste between 2007 and 2008 (Figure
B.11). In the Netherlands, Malta, Spain and Sweden, however, the total quantity of waste more than
doubled in 2008 compared to 2007, whereas in Austria and Portugal it more than halved. Cyprus
reported a decrease of nearly 100 % of total quantity of waste in 2008. These striking changes indicate
potential inconsistencies in reporting and should be checked by countries.
Generally the quantity of hazardous waste transferred within the country is higher than the quantity
transferred outside the country, except for the Netherlands (Figure B.12). This might indicate an
inconsistency in reporting (mainly due to the transfer from one facility) and should be checked by the
country. Hazardous waste within country has been reported by all countries except Liechtenstein,

ETC/ACC - ETC/SCP - ETC/W E-PRTR Review 2009 31/162
whereas hazardous waste outside country was not reported by Finland, Liechtenstein and Norway. A
more in-depth analysis is provided in the chapter on the stage 2 review on the waste data.
Figure B.12 Total quantity of hazardous waste reported by countries under E-PRTR 2008
0
2 000 000
4 000 000
6 000 000
8 000 000
10 000 000
12 000 000
Austr
ia
Belg
ium
Bulg
ari
a
Cypru
s
Cze
ch R
epublic
Denm
ark
Est
onia
Fin
land
Fra
nce
Germ
any
Gre
ece
Hungary
Icela
nd
Irela
nd
Italy
Latv
ia
Lie
chte
nste
in
Lithuania
Luxem
bourg
Malta
Neth
erl
ands
Norw
ay
Pola
nd
Port
ugal
Rom
ania
Slo
vakia
Slo
venia
Spain
Sw
eden
Sw
itze
rland
United K
ingdom
in k
t/a
Hazardous waste outside country
Hazardous waste within country
Figure B.13 shows the percentage of waste that has been disposed or recovered for the different waste
types. 81 % of the hazardous waste transferred outside the country is destined for recovery under E-
PRTR 2008 compared to 85 % under E-PRTR 2007 whereas hazardous waste transferred inside the
country in 2008 is mainly disposed of (58 %). In 2008, recovery is the dominant waste treatment option
for non-hazardous waste with 74 % of being recovered compared to only 66 % in 2007.
Figure B.13 Percentage of disposed or recovered waste for different waste types under E-PRTR 2008
19%
81%
Hazardous waste
outside country
58%
42%
Hazardous waste within
country
Destined for disposal Destined for recovery
26%
74%
Non-hazardous waste
Note: Total amount of hazardous waste outside country: 7.9 million t/a, total amount of hazardous waste within country: 35.5 million t/a, total amount of non-hazardous waste: 371.8 million t/a

32/162 E-PRTR data review 2009 ETC/ACC - ETC/SCP - ETC/W
B.3 Reporting of confidential data
Article 11 of the E-PRTR Regulation provides the option of claiming confidentiality for certain data
elements in E-PRTR reports in accordance with Article 4 of Directive 2003/4/EC26 of the European
Parliament and of the Council of 28 January 2003 on public access to environmental information. If
confidentiality is claimed the country has to indicate separately for each facility the type of information
that has been withheld and the reason why it has been withheld.
Table B.3 Facilities reporting confidential data in E-PRTR 2008
Country 2007 2008 2007 2008 2007 2008 2007 2008
Belgium 63 63 94 79
Bulgaria 4 4
Germany 15 3 2 4 1 2 38 13
Greece 1 1
Luxembourg 5 3
Romania 4 4
Sweden 1 1
Switzerland 6 6
All countries 79 71 2 8 1 2 144 110
Facility Report Pollutant Release Report Pollutant Transfer Report Waste Transfer Report
Confidential data has been evaluated at four different levels: the level of the facility report, the
pollutant release report, the pollutant transfer report and the waste transfer report. The review did not
investigate which specific data element was kept confidential. Only eight countries reported confidential
data referring either to the facility report, pollutant release report, pollutant transfer report or to the
waste transfer report. Confidentiality related to the facility report refers to data elements that identify
the facility (e.g. address). Confidentiality related to the pollutant release report, pollutant transfer
report or waste transfer report refers to confidential data elements regarding the release/transfer
reports, e.g. the pollutant.
Table B.3 illustrates the countries and number of facilities reporting confidential data on the level of the
facility and the release/transfer report. 71 facilities reported confidential data related to the facility
report, 8 facilities related to the pollutant release report, two facilities related to the pollutant transfer
report and 110 facilities claimed confidentiality on data related to waste transfer reports.
Compared to E-PRTR 2007 the number of countries reporting confidential data has increased from six
(Belgium, Germany, Greece, Luxembourg, Sweden, Switzerland) to eight countries (see Table B.3) for
2008. However, the number of confidentiality claims fell by 15% from 226 for 2007 to 191 for 2008. The
most significant decline in confidentiality claims between 2007 and 2008 occurred related to the waste
transfer report with 144 reports containing confidential elements in 2007 compared to only 110 in 2008.
B.4 Accidental releases
Under E-PRTR operators are required to report all releases and transfers resulting as totals of all
deliberate, accidental, routine and non-routine activities. 19 countries (out of 31 countries) reported
26 OJ L 41, 14.2.2003, p. 26

ETC/ACC - ETC/SCP - ETC/W E-PRTR Review 2009 33/162
accidental releases under E-PRTR for 2008 compared to 17 countries for 2007. In total, 550 accidental
releases to air, water and soil of different pollutants were reported under E-PRTR in 2008 compared to
exactly the same number under E-PRTR 2007. Table B.4 illustrates the total number of accidental release
reports by country for all media. Countries that are not included in this list did not report any accidental
releases.
Table B.4 Number of accidental release reports (for all pollutants) by country in E-PRTR 2008
Country Number of accidental
release reports Country
Number of accidental release reports
Netherlands 101 Ireland 5
Spain 146 Austria 1
France 72 Romania 6
Poland 65 Switzerland 2
United Kingdom 48 Bulgaria 3
Germany 30 Greece 2
Belgium 22 Sweden 2
Italy 28 Slovakia 1
Slovenia 7 Portugal 7
Norway 3 All countries 550
Countries can find detailed information on the quantity of the accidental releases for every pollutant
and medium in the stage 1 Excel tool (Test 6).
Table B.5 provides an overview of the pollutants for which the highest accidental releases to air have
been reported under E-PRTR 2008. All pollutants with a share in total E-PRTR releases to air of ≤ 1 % for
the respective pollutant have been included in the table. The total number of accidental release reports
to air amounted to 307 under E-PRTR 2008 compared to 322 under E-PRTR 2007.
Table B.5 Pollutants with high accidental quantity of releases to air
Pollutant Quantity of accidental
releases kg/a
Total quantity kg/a
Number of accidental releases
% share of accidental releases in total E-
PRTR releases
Chlorofluorocarbons (CFC) 1,176 120,933 8 1.0 %
Hydrochlorofluorocarbons(HCFC) 105,228 974,359 104 10.8 %
Hydro-fluorocarbons (HFC) 29,657 956,683 31 3.1 %
Sulphur hexafluoride (SF6) 522 24,293 1 2.1 %
The share of accidental releases for these pollutants differs between countries but is very high for some
countries. For example, Norway and Greece reported 100 % accidental releases for HFC; Italy and
Poland reported more than 50 % accidental releases for HFC. For the pollutant HCFC Ireland, Italy,
Poland and Switzerland reported accidental releases between 50 % and 95 % of their total HCFC
releases.
Concerning accidental releases to water only one pollutant has a share in total E-PRTR releases to water
of ≤ 1 % being 1,2-dichloroethane (DCE) with a share of accidental releases of 1.4 % coming from just

34/162 E-PRTR data review 2009 ETC/ACC - ETC/SCP - ETC/W
one release report. The total number of accidental release reports to water amounted to 243 for 2008
compared to 225 for 2007.
Concerning accidental release reports to soil there were none reported under E-PRTR 2008 compared to
3 accidental release reports to soil reported under E-PRTR 2007.
B.5 Top polluting facilities
The lists of top polluting facilities in this chapter identify those facilities which have the highest releases
and/or transfers. The fact that a facility is amongst the highest polluters, does not provide any
information concerning the environmental performance of those facilities. The necessary background
information related to the facilities to perform such an assessment (e.g. capacity, fuel use, etc.) is not
reported under E-PRTR.
B.5.1 Top polluting facilities for releases to air
Table B.6 below provides information for selected pollutants27 on the five facilities with the highest
share of total E-PRTR releases to air per pollutant. The selected pollutants are:
main GHGs reported also under UNFCCC; carbon dioxide (CO2), methane (CH4), nitrous oxide (N2O)
acidifying pollutants and ozone precursors; ammonia (NH3), carbon monoxide (CO), nitrogen oxides
(NOx/NO2), non-methane volatile organic compounds (NMVOC), sulphur oxides (SOx/SO2) and
other pollutants reported under CLRTAP
particulate matter (PM10)
heavy metals; arsenic and compounds (as As), cadmium and compounds (as Cd), chromium and
compounds (as Cr), copper and compounds (as Cu), lead and compounds (as Pb), mercury and
compounds (as Hg), nickel and compounds (as Ni), zinc and compounds (as Zn), and
persistent organic pollutants (POPs); polycyclic aromatic hydrocarbons (PAHs), hexachloro-
benzene (HCB), PCDD/PCDF (dioxins /furans) (as Teq)
The complete list of facilities ranked among the E-PRTR top 20 polluting facilities including information
on their share in total E-PRTR emission is provided in the stage 1 Excel tool, sheet “E-PRTR TOP20”.
Distribution of emissions for some pollutants like CO2, and NOx/NO2 seem to be more or less evenly –
the share of the top five polluting facilities in Europe is mostly around 1 % each. The situation for SO2,
CO, NMVOC and PM10 is slightly different; the share of the biggest sources in E-PRTR totals lies in a
range from 2 % to 10 %. The share of the biggest sources for the pollutants N2O and HM lies between
2 % and 17 %. The test also identified a number of potential anomalies, particularly in reporting of
PCDD/PCDF, PAHs, HCB and CH4, for which the share of some individual sources resulted to be higher
than 20 % or sometimes even higher than 50 %. This findings should be further investigated by countries
and data corrected where needed for the next resubmission. A possible reason for the anomalies could
be wrong reporting units.
The test also identified that a number of pollutants is reported only by one facility or just by one country
e.g. Hexabromobiphenyl, Asbestos, Chlorides and Fluorides. This might indicate that either the
threshold for these pollutants is too high and/or the reporting of countries is not complete.
27 The list of top 20 E-PRTR facilities for each pollutant (91 in total) can be produced with the Stage1 tool distributed to all countries on 30 July
2010 and available at the Eionet CIRCA website at: http://eea.eionet.europa.eu/Members/irc/eionet-circle/e-prtr/library?l=/e-
prtr/country_feedback/2010_2008_dataset/stage_stage_august_2010/e-prtr_stage1_uploaded&vm=detailed&sb=Title

ETC/ACC - ETC/SCP - ETC/W E-PRTR Review 2009 35/162
Table B.6 Facilities with the highest releases to air of selected pollutants under E-PRTR 2008
Pollutant group/ Pollutant
Facility ID National ID Country Facility Name
Main Activity
Total Quantity kg/a
All countries share
Chlorinated organic substances
Hexachlorobenzene (HCB)
65164 W197 Belgium ARCELORMITTAL-STAINLESS BELGIUM Chatelet 2.(b) 477 64,82%
73896
03-03-03030273580 Germany
DOW Deutschland Anlagengesellschaft Werk Stade mbH
4.(a).(viii) 212 28,81%
9378 4168 Spain MIVISA ENVASES 9.(c) 22 3,00%
15036 W020 Belgium CCB sa - site de GAURAIN-RAMECROIX 3.(c).(i) 15 1,97%
67343 100186331 Finland
Yara Suomi Oy, Kokkolan tehtaat / Kaliumsulfaattitehdas 4.(b).(i) 10 1,40%
Hexachlorobenzene (HCB) total "top5" 736 100,00%
PCDD + PCDF (dioxins + furans) (as Teq) 81722 100001395 Portugal
Ambimed - Unidade de Tratamento de Resíduos Hospitalares do Barreiro 5.(a) 7,00 77,09%
48966 570297-2609 Iceland Norðurál Grundartanga 2.(e).(i) 0,44 4,85%
6497 12S000298 Poland
Południowy Koncer Energetyczny S.A., Elektrownia Jaworzno III - Elektrownia III 1.(c) 0,26 2,86%
4675 06K000440 Poland Zakłady Azotowe w Tarnowie-Mościcach S.A. 4.(a) 0,20 2,20%
85905 206 Switzerland Les Cheneviers / UIOM 5.(b) 0,16 1,71%
PCDD + PCDF (dioxins + furans) (as Teq) total "top5" 8,06 88,71%
Greenhouse gases
Carbon dioxide (CO2) 1298 05E000016 Poland
PGE Elektrownia Bełchatów S.A. 1.(c) 30.900.000.000 1,56%
70824 06-05-300-0326774 Germany
RWE Power AG Kraftwerk Niederaußem 1.(c) 24.900.000.000 1,26%
73175
12-40710010000 Germany
Vattenfall Europe Generation AG Kraftwerk Jänschwalde 1.(c) 23.500.000.000 1,19%
13777 EW_EA-67 United Kingdom
Drax Power Limited, Drax Power Ltd 1.(c) 23.000.000.000 1,16%
70870 06-05-300-0877384 Germany RWE Power AG 1.(c) 21.600.000.000 1,09%
Carbon dioxide (CO2) total "top5" 123.900.000.000 6,25%
Methane (CH4) 68311 065.00370 France COVED S.A. 5.(d) 722.000.000 23,31%
7032 2007000340 Italy MINERMIX Srl 3.(c) 118.000.000 3,81%

36/162 E-PRTR data review 2009 ETC/ACC - ETC/SCP - ETC/W
Pollutant group/ Pollutant
Facility ID National ID Country Facility Name
Main Activity
Total Quantity kg/a
All countries share
79563 12S000505 Poland
Jastrzębska Spółka Węglowa S.A. Kopalnia Węgla Kamiennego "Pniówek" 3.(a) 63.700.000 2,06%
79564 12S000503 Poland
Jastrzębska Spółka Węglowa S.A. Kopalnia Węgla Kamiennego "Krupioski" 3.(a) 56.400.000 1,82%
79548 06K000511 Poland
Kompania Węglowa S.A. Oddział Kopalnia Węgla Kamiennego "Brzeszcze-Silesia" - Ruch Brzeszcze 3.(a) 53.600.000 1,73%
Methane (CH4) total "top5" 1.013.700.000 32,72%
Nitrous oxide (N2O)
81024 01D001427 Poland
FERMY DROBIU WOŹNIAK Sp. z o.o.,Fermy drobiu w Gądkowie 7.(a) 19.600.000 13,17%
80890 01D001426 Poland
FERMY DROBIU WOŹNIAK Sp. z o.o., Fermy drobiu w Bielanach 7.(a) 12.000.000 8,06%
74403 13-30-1101002 Germany
YARA Rostock Zweigniederlassung der YARA GmbH & Co. KG 4.(c) 8.480.000 5,70%
509 03L000438 Poland Zakłady Azotowe "Puławy" S.A. 4.(c) 6.800.000 4,57%
2 000000002 Lithuania AB"Achema" 4.(c) 5.590.000 3,76%
Nitrous oxide (N2O) total "top5" 52.470.000 35,25%
Heavy metals
Arsenic and compounds (as As) 5952 EE147275 Estonia
Eesti Energia Narva Elektrijaamad AS, Eesti Elektrijaam 1.(c) 7.240 16,85%
4717 070.00621 France ARC INTERNATIONAL.- Site industriel d'Arques 3.(e) 2.520 5,86%
5951 EE051174 Estonia
Eesti Energia Narva Elektrijaamad AS, Balti Elektrijaam 1.(c) 1.780 4,14%
8893 3421 Spain FÁBRICA DE HUELVA 2.(e).(i) 1.580 3,68%
14192 EL1201188 Greece PPC S.A. SES MEGALOPOLIS A’ 1.(c) 1.530 3,56%
Arsenic and compounds (as As) total "top5" 14.650 34,09%
Cadmium and compounds (as Cd)
8129 CZ33698019
Czech Republic Elektrárna Mělník I - EMĚ I 1.(c) 1.270 6,69%
10557 CZ95150686
Czech Republic ArcelorMittal Ostrava a.s. 2.(c).(i) 1.060 5,59%
81860 100003698 Portugal
Petróleos de Portugal- Petrogal, S.A. (Refinaria de Sines) 1.(a) 804 4,24%
10218 56121 Netherlands ThermPhos International BV 4.(b) 782 4,12%
7974 23301 Netherlands Corus Staal BV 2.(b) 730 3,85%
Cadmium and compounds (as Cd) total "top5" 4.646 24,49%

ETC/ACC - ETC/SCP - ETC/W E-PRTR Review 2009 37/162
Pollutant group/ Pollutant
Facility ID National ID Country Facility Name
Main Activity
Total Quantity kg/a
All countries share
Chromium and compounds (as Cr) 67133 2110 Finland
Outokumpu Chrome Oy, Outokumpu Stainless Oy, Tornion tehtaat 2.(b) 10.300 8,79%
6811 1487-1120 Sweden Vargön Alloys AB 2.(e).(ii) 6.500 5,55%
5952 EE147275 Estonia
Eesti Energia Narva Elektrijaamad AS, Eesti Elektrijaam 1.(c) 6.440 5,50%
72998 06-10-0033945 Germany
Saarstahl AG, Werk Völklingen 2.(b) 6.130 5,23%
15021 W005 Belgium ARCELORMITTAL UPSTREAM sa (COKE FONTE) 2.(b) 4.340 3,70%
Chromium and compounds (as Cr) total "top5" 33.710 28,77%
Copper and compounds (as Cu)
484 100423302 Hungary ISD Dunaferr Zrt. Vasmű 2.(b) 19.300 12,20%
8893 3421 Spain FÁBRICA DE HUELVA 2.(e).(i) 10.700 6,76%
73883
06-02-B2C100A009 Germany Norddeutsche Affinerie AG 2.(e).(i) 8.430 5,33%
71496 06-05-900-0877505 Germany
Aurubis AG Recyclingzentrum Lünen 2.(e).(i) 6.120 3,87%
79571 01D002750 Poland KGHM POLSKA MIEDŹ S.A., Zakłady Górnicze RUDNA 3.(a) 6.080 3,84%
Copper and compounds (as Cu) total "top5" 50.630 32,00%
Lead and compounds (as Pb)
10251 57002803 Slovakia U.S.Steel s.r.o. 2.(b) 38.900 7,94%
70572 06-05-100-0209686 Germany
ThyssenKrupp Steel AG Werk Schwelgern 2.(a) 37.600 7,68%
15021 W005 Belgium ARCELORMITTAL UPSTREAM sa (COKE FONTE) 2.(b) 28.600 5,84%
5952 EE147275 Estonia
Eesti Energia Narva Elektrijaamad AS, Eesti Elektrijaam 1.(c) 24.100 4,92%
6488 12S000241 Poland
ArcelorMittal Poland S.A., Oddział w Dąbrowie Górniczej 2.(a) 24.000 4,90%
Lead and compounds (as Pb) total "top5" 153.200 31,27%
Mercury and compounds (as Hg)
1298 05E000016 Poland PGE Elektrownia Bełchatów S.A. 1.(c) 2.600 6,87%
82918 RO4VL_41 Romania SC OLTCHIM SA 4.(b).(iii) 1.410 3,73%
85936 EW_EA-1451
United Kingdom
INEOS CHLOR LTD, Runcorn Halochemicals 4.(a) 950 2,51%
14245 EL5800876 Greece PPC S.A. SES AGIOY DHMHTRIOY 1.(c) 932 2,46%
7119 16Z000477 Poland
PGE Zespół Elektrowni Dolna Odra S.A., Elektrownia Szczecin 1.(c) 859 2,27%
Mercury and compounds (as Hg) total "top5" 6.751 17,84%
Nickel and compounds (as Ni)
14245 EL5800876 Greece PPC S.A. SES AGIOY DHMHTRIOY 1.(c) 19.100 4,98%
6897 1527 Spain
REPSOL YPF REFINO ESPAÑA. COMPLEJO INDUSTRIAL DE TARRAGONA 1.(a) 13.500 3,52%
88303 P0126/06A United Kingdom Coolkeeragh ESB Ltd 1.(c) 11.800 3,08%
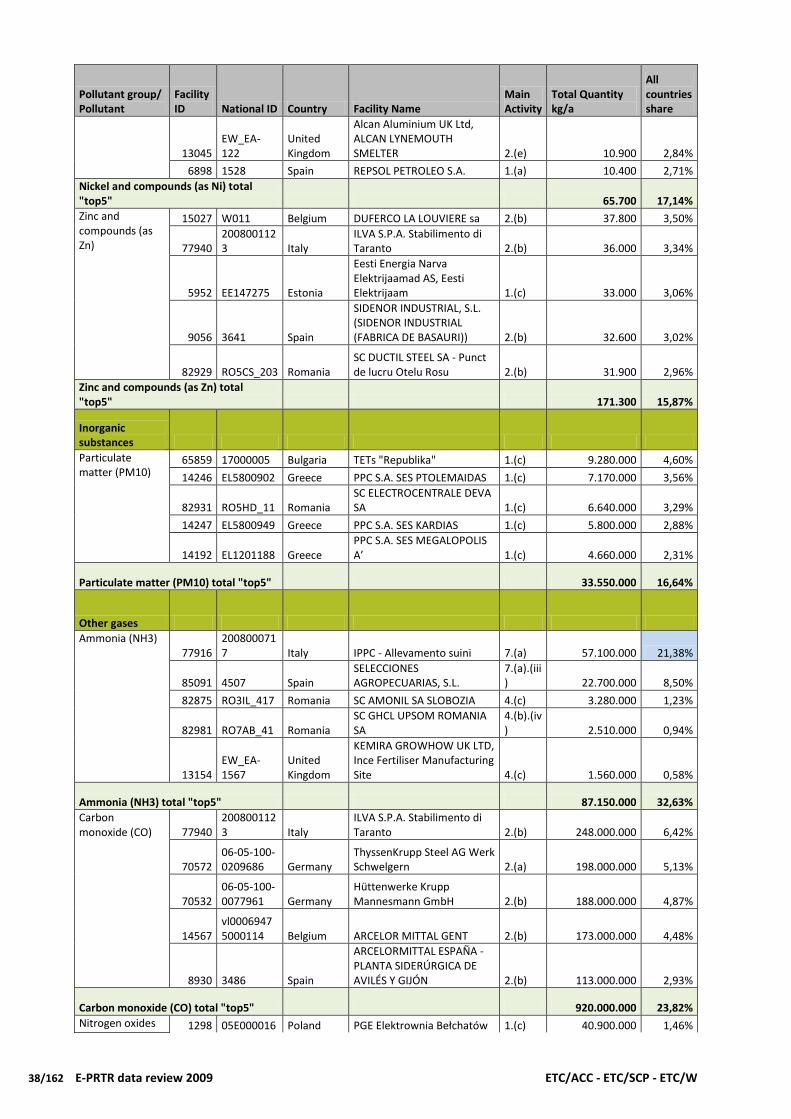
38/162 E-PRTR data review 2009 ETC/ACC - ETC/SCP - ETC/W
Pollutant group/ Pollutant
Facility ID National ID Country Facility Name
Main Activity
Total Quantity kg/a
All countries share
13045 EW_EA-122
United Kingdom
Alcan Aluminium UK Ltd, ALCAN LYNEMOUTH SMELTER 2.(e) 10.900 2,84%
6898 1528 Spain REPSOL PETROLEO S.A. 1.(a) 10.400 2,71%
Nickel and compounds (as Ni) total "top5" 65.700 17,14%
Zinc and compounds (as Zn)
15027 W011 Belgium DUFERCO LA LOUVIERE sa 2.(b) 37.800 3,50%
77940 2008001123 Italy
ILVA S.P.A. Stabilimento di Taranto 2.(b) 36.000 3,34%
5952 EE147275 Estonia
Eesti Energia Narva Elektrijaamad AS, Eesti Elektrijaam 1.(c) 33.000 3,06%
9056 3641 Spain
SIDENOR INDUSTRIAL, S.L. (SIDENOR INDUSTRIAL (FABRICA DE BASAURI)) 2.(b) 32.600 3,02%
82929 RO5CS_203 Romania SC DUCTIL STEEL SA - Punct de lucru Otelu Rosu 2.(b) 31.900 2,96%
Zinc and compounds (as Zn) total "top5" 171.300 15,87%
Inorganic substances
Particulate matter (PM10)
65859 17000005 Bulgaria TETs "Republika" 1.(c) 9.280.000 4,60%
14246 EL5800902 Greece PPC S.A. SES PTOLEMAIDAS 1.(c) 7.170.000 3,56%
82931 RO5HD_11 Romania SC ELECTROCENTRALE DEVA SA 1.(c) 6.640.000 3,29%
14247 EL5800949 Greece PPC S.A. SES KARDIAS 1.(c) 5.800.000 2,88%
14192 EL1201188 Greece PPC S.A. SES MEGALOPOLIS A’ 1.(c) 4.660.000 2,31%
Particulate matter (PM10) total "top5" 33.550.000 16,64%
Other gases
Ammonia (NH3) 77916
2008000717 Italy IPPC - Allevamento suini 7.(a) 57.100.000 21,38%
85091 4507 Spain SELECCIONES AGROPECUARIAS, S.L.
7.(a).(iii) 22.700.000 8,50%
82875 RO3IL_417 Romania SC AMONIL SA SLOBOZIA 4.(c) 3.280.000 1,23%
82981 RO7AB_41 Romania SC GHCL UPSOM ROMANIA SA
4.(b).(iv) 2.510.000 0,94%
13154 EW_EA-1567
United Kingdom
KEMIRA GROWHOW UK LTD, Ince Fertiliser Manufacturing Site 4.(c) 1.560.000 0,58%
Ammonia (NH3) total "top5" 87.150.000 32,63%
Carbon monoxide (CO) 77940
2008001123 Italy
ILVA S.P.A. Stabilimento di Taranto 2.(b) 248.000.000 6,42%
70572 06-05-100-0209686 Germany
ThyssenKrupp Steel AG Werk Schwelgern 2.(a) 198.000.000 5,13%
70532 06-05-100-0077961 Germany
Hüttenwerke Krupp Mannesmann GmbH 2.(b) 188.000.000 4,87%
14567 vl00069475000114 Belgium ARCELOR MITTAL GENT 2.(b) 173.000.000 4,48%
8930 3486 Spain
ARCELORMITTAL ESPAÑA - PLANTA SIDERÚRGICA DE AVILÉS Y GIJÓN 2.(b) 113.000.000 2,93%
Carbon monoxide (CO) total "top5" 920.000.000 23,82%
Nitrogen oxides 1298 05E000016 Poland PGE Elektrownia Bełchatów 1.(c) 40.900.000 1,46%

ETC/ACC - ETC/SCP - ETC/W E-PRTR Review 2009 39/162
Pollutant group/ Pollutant
Facility ID National ID Country Facility Name
Main Activity
Total Quantity kg/a
All countries share
(NOx/NO2) S.A.
13777 EW_EA-67 United Kingdom
Drax Power Limited, Drax Power Ltd 1.(c) 38.600.000 1,37%
73894
03-02-02221253020 Germany
Drewsen Spezialpapiere GmbH&Co. KG Papierfabrik 6.(b) 30.800.000 1,10%
13368 EW_EA-2316
United Kingdom
RWE npower plc, Aberthaw Power Station 1.(c) 26.100.000 0,93%
14245 EL5800876 Greece PPC S.A. SES AGIOY DHMHTRIOY 1.(c) 22.600.000 0,80%
Nitrogen oxides (NOx/NO2) total "top5" 159.000.000 5,66%
Non-methane volatile organic compounds (NMVOC)
14463 Scotland-153
United Kingdom Sullom Voe Terminal 1.(a) 11.800.000 2,18%
14537 Scotland-73
United Kingdom Glass Factory 3.(e) 11.200.000 2,07%
18 000000019 Lithuania AB "Mažeikių nafta" 1.(a) 11.100.000 2,05%
78682 1263.0002.01 Norway STATOIL ASA, Mongstad 1.(a) 9.520.000 1,76%
14524 Scotland-52
United Kingdom
Ineos Manufacturing Scotland Ltd 1.(a) 7.520.000 1,39%
Non-methane volatile organic compounds (NMVOC) total "top5" 51.140.000 9,45%
Sulphur oxides (SOx/SO2)
65850 13000002 Bulgaria "TETs Maritsa iztok 2" EAD 1.(c) 402.000.000 9,74%
14192 EL1201188 Greece PPC S.A. SES MEGALOPOLIS A’ 1.(c) 210.000.000 5,09%
82906 RO4GJ_11 Romania COMPLEXUL ENERGETIC TURCENI 1.(c) 134.000.000 3,25%
65771 13000004 Bulgaria
Gorivna instalatsias nominalna toplinna moshtnost 1020MWt 1.(c) 109.000.000 2,64%
6995 15P000483 Poland
Zespól Elektrowni Pątnów-Adamów -Konin S.A., Elektrownia Pątnów 1.(c) 86.600.000 2,10%
Sulphur oxides (SOx/SO2) total "top5" 941.600.000 22,81%
Other organic substances
Polycyclic aromatic hydrocarbons (PAHs)
78619 1149.0029.01 Norway Hydro Aluminium AS Karmøy 2.(e).(i) 57.400 24,22%
6961 15P000003 Poland Impexmetal S.A. Zakład Aluminium Konin 2.(e) 38.100 16,08%
6789 1478 Spain ALCOA INESPAL, S.A. - LA CORUÑA 2.(e).(i) 18.700 7,89%
81803 100005851 Portugal Lisgráfica, Impressão e Artes Gráficas, S.A. 9.(c) 12.200 5,15%
80120 12S002419 Poland
SITA Starol Sp. z o.o., Zakład Produkcji Paliw Alternatywnych 5.(a) 11.100 4,68%
Polycyclic aromatic hydrocarbons (PAHs) total "top5" 137.500 58,03%

40/162 E-PRTR data review 2009 ETC/ACC - ETC/SCP - ETC/W
Pollutant group/
Pollutant
Facility
ID National ID Country Facility Name
Main
Activity Total Quantity kg/a
All
countries
share
Heavy metals
5952 EE147275 Estonia
Eesti Energia Narva Elektrijaamad
AS, Eesti Elektrijaam 1.(c) 7,240.00 16.85%
4717 070.00621 France
ARC INTERNATIONAL.- Site
industriel d'Arques 3.(e) 2,520.00 5.86%
5951 EE051174 Estonia
Eesti Energia Narva Elektrijaamad
AS, Balti Elektrijaam 1.(c) 1,780.00 4.14%
8893 3421 Spain FÁBRICA DE HUELVA 2.(e).(i) 1,580.00 3.68%
14192 EL1201188 Greece PPC S.A. SES MEGALOPOLIS A’ 1.(c) 1,530.00 3.56%
14,650 34.09%
8129 CZ33698019
Czech
Republic Elektrárna Mělník I ‐ EMĚ I 1.(c) 1,270.00 6.69%
10557 CZ95150686
Czech
Republic ArcelorMittal Ostrava a.s. 2.(c).(i) 1,060.00 5.59%
81860 100003698 Portugal
Petróleos de Portugal- Petrogal,
S.A. (Refinaria de Sines) 1.(a) 804.00 4.24%
10218 56121 Netherlands ThermPhos International BV 4.(b) 782.00 4.12%
7974 23301 Netherlands Corus Staal BV 2.(b) 730.00 3.85%
4,646 24.49%
67133 2110 Finland
Outokumpu Chrome Oy,
Outokumpu Stainless Oy, Tornion
tehtaat 2.(b) 10,300.00 8.79%
6811 1487-1120 Sweden Vargön Alloys AB 2.(e).(ii) 6,500.00 5.55%
5952 EE147275 Estonia
Eesti Energia Narva Elektrijaamad
AS, Eesti Elektrijaam 1.(c) 6,440.00 5.50%
72998
06-10-
0033945 Germany Saarstahl AG, Werk Völklingen 2.(b) 6,130.00 5.23%
15021 W005 Belgium
ARCELORMITTAL UPSTREAM sa
(COKE FONTE) 2.(b) 4,340.00 3.70%
33,710 28.77%
484 100423302 Hungary ISD Dunaferr Zrt. Vasmű 2.(b) 19,300.00 12.20%
8893 3421 Spain FÁBRICA DE HUELVA 2.(e).(i) 10,700.00 6.76%
73883
06-02-
B2C100A009 Germany Norddeutsche Affinerie AG 2.(e).(i) 8,430.00 5.33%
71496
06-05-900-
0877505 Germany
Aurubis AG Recyclingzentrum
Lünen 2.(e).(i) 6,120.00 3.87%
79571 01D002750 Poland
KGHM POLSKA MIEDŹ S.A.,
Zakłady Górnicze RUDNA 3.(a) 6,080.00 3.84%
50,630 32.00%
10251 57002803 Slovakia U.S.Steel s.r.o. 2.(b) 38,900.00 7.94%
70572
06-05-100-
0209686 Germany
ThyssenKrupp Steel AG Werk
Schwelgern 2.(a) 37,600.00 7.68%
15021 W005 Belgium
ARCELORMITTAL UPSTREAM sa
(COKE FONTE) 2.(b) 28,600.00 5.84%
5952 EE147275 Estonia
Eesti Energia Narva Elektrijaamad
AS, Eesti Elektrijaam 1.(c) 24,100.00 4.92%
6488 12S000241 Poland
ArcelorMittal Poland S.A., Oddział
w Dąbrowie Górniczej 2.(a) 24,000.00 4.90%
153,200 31.27%
1298 05E000016 Poland PGE Elektrownia Bełchatów S.A. 1.(c) 2,600.00 6.87%
82918 RO4VL_41 Romania SC OLTCHIM SA 4.(b).(iii) 1,410.00 3.73%
85936 EW_EA-1451
United
Kingdom
INEOS CHLOR LTD, Runcorn
Halochemicals 4.(a) 950.00 2.51%
14245 EL5800876 Greece PPC S.A. SES AGIOY DHMHTRIOY 1.(c) 932.00 2.46%
7119 16Z000477 Poland
PGE Zespół Elektrowni Dolna Odra
S.A., Elektrownia Szczecin 1.(c) 859.00 2.27%
6,751 17.84%
Chromium and
compounds (as Cr)
Cadmium and compounds (as Cd) total "top5"
Chromium and compounds (as Cr) total "top5"
Cadmium and
compounds (as Cd)
Arsenic and
compounds (as As)
Arsenic and compounds (as As) total "top5"
Copper and
compounds (as Cu)
Lead and
compounds (as Pb)
Mercury and
compounds (as Hg)
Mercury and compounds (as Hg) total "top5"
Lead and compounds (as Pb) total "top5"
Copper and compounds (as Cu) total "top5"

ETC/ACC - ETC/SCP - ETC/W E-PRTR Review 2009 41/162
Pollutant group/
Pollutant
Facility
ID National ID Country Facility Name
Main
Activity Total Quantity kg/a
All
countries
share
14245 EL5800876 Greece PPC S.A. SES AGIOY DHMHTRIOY 1.(c) 19,100.00 4.98%
6897 1527 Spain
REPSOL YPF REFINO ESPAÑA.
COMPLEJO INDUSTRIAL DE
TARRAGONA 1.(a) 13,500.00 3.52%
88303 P0126/06A
United
Kingdom Coolkeeragh ESB Ltd 1.(c) 11,800.00 3.08%
13045 EW_EA-122
United
Kingdom
Alcan Aluminium UK Ltd, ALCAN
LYNEMOUTH SMELTER 2.(e) 10,900.00 2.84%
6898 1528 Spain REPSOL PETROLEO S.A. 1.(a) 10,400.00 2.71%
65,700 17.14%
15027 W011 Belgium DUFERCO LA LOUVIERE sa 2.(b) 37,800.00 3.50%
77940 2008001123 Italy
ILVA S.P.A. Stabilimento di
Taranto 2.(b) 36,000.00 3.34%
5952 EE147275 Estonia
Eesti Energia Narva Elektrijaamad
AS, Eesti Elektrijaam 1.(c) 33,000.00 3.06%
9056 3641 Spain
SIDENOR INDUSTRIAL, S.L.
(SIDENOR INDUSTRIAL (FABRICA
DE BASAURI)) 2.(b) 32,600.00 3.02%
82929 RO5CS_203 Romania
SC DUCTIL STEEL SA - Punct de
lucru Otelu Rosu 2.(b) 31,900.00 2.96%
171,300 15.87%
Inorganic
substances
65859 17000005 Bulgaria TETs "Republika" 1.(c) 9,280,000.00 4.60%
14246 EL5800902 Greece PPC S.A. SES PTOLEMAIDAS 1.(c) 7,170,000.00 3.56%
82931 RO5HD_11 Romania SC ELECTROCENTRALE DEVA SA 1.(c) 6,640,000.00 3.29%
14247 EL5800949 Greece PPC S.A. SES KARDIAS 1.(c) 5,800,000.00 2.88%
14192 EL1201188 Greece PPC S.A. SES MEGALOPOLIS A’ 1.(c) 4,660,000.00 2.31%
33,550,000 16.64%
Other gases
77916 2008000717 Italy IPPC - Allevamento suini 7.(a) 57,100,000.00 21.38%
85091 4507 Spain
SELECCIONES AGROPECUARIAS,
S.L. 7.(a).(iii) 22,700,000.00 8.50%
82875 RO3IL_417 Romania SC AMONIL SA SLOBOZIA 4.(c) 3,280,000.00 1.23%
82981 RO7AB_41 Romania SC GHCL UPSOM ROMANIA SA 4.(b).(iv) 2,510,000.00 0.94%
13154 EW_EA-1567
United
Kingdom
KEMIRA GROWHOW UK LTD, Ince
Fertiliser Manufacturing Site 4.(c) 1,560,000.00 0.58%
87,150,000.00 32.63%
77940 2008001123 Italy
ILVA S.P.A. Stabilimento di
Taranto 2.(b) 248,000,000.00 6.42%
70572
06-05-100-
0209686 Germany
ThyssenKrupp Steel AG Werk
Schwelgern 2.(a) 198,000,000.00 5.13%
70532
06-05-100-
0077961 Germany
Hüttenwerke Krupp Mannesmann
GmbH 2.(b) 188,000,000.00 4.87%
14567
vl0006947500
0114 Belgium ARCELOR MITTAL GENT 2.(b) 173,000,000.00 4.48%
8930 3486 Spain
ARCELORMITTAL ESPAÑA -
PLANTA SIDERÚRGICA DE AVILÉS Y
GIJÓN 2.(b) 113,000,000.00 2.93%
920,000,000.00 23.82%
1298 05E000016 Poland PGE Elektrownia Bełchatów S.A. 1.(c) 40,900,000.00 1.46%
13777 EW_EA-67
United
Kingdom
Drax Power Limited, Drax Power
Ltd 1.(c) 38,600,000.00 1.37%
73894
03-02-
02221253020 Germany
Drewsen Spezialpapiere
GmbH&Co. KG Papierfabrik 6.(b) 30,800,000.00 1.10%
13368 EW_EA-2316
United
Kingdom
RWE npower plc, Aberthaw
Power Station 1.(c) 26,100,000.00 0.93%
14245 EL5800876 Greece PPC S.A. SES AGIOY DHMHTRIOY 1.(c) 22,600,000.00 0.80%
159,000,000.00 5.66%
Nickel and
compounds (as Ni)
Zinc and compounds
(as Zn)
Particulate matter
(PM10)
Nitrogen oxides (NOx/NO2) total "top5"
Carbon monoxide (CO) total "top5"
Ammonia (NH3) total "top5"
Particulate matter (PM10) total "top5"
Zinc and compounds (as Zn) total "top5"
Nickel and compounds (as Ni) total "top5"
Ammonia (NH3)
Carbon monoxide
(CO)
Nitrogen oxides
(NOx/NO2)

42/162 E-PRTR data review 2009 ETC/ACC - ETC/SCP - ETC/W
Pollutant group/
Pollutant
Facility
ID National ID Country Facility Name
Main
Activity Total Quantity kg/a
All
countries
share
14463 Scotland-153
United
Kingdom Sullom Voe Terminal 1.(a) 11,800,000.00 2.18%
14537 Scotland-73
United
Kingdom Glass Factory 3.(e) 11,200,000.00 2.07%
18 000000019 Lithuania AB "Mažeikių nafta" 1.(a) 11,100,000.00 2.05%
78682 1263.0002.01 Norway STATOIL ASA, Mongstad 1.(a) 9,520,000.00 1.76%
14524 Scotland-52
United
Kingdom Ineos Manufacturing Scotland Ltd 1.(a) 7,520,000.00 1.39%
Non-methane volatile organic compounds (NMVOC) total "top5" 51,140,000.00 9.45%
65850 13000002 Bulgaria "TETs Maritsa iztok 2" EAD 1.(c) 402,000,000.00 9.74%
14192 EL1201188 Greece PPC S.A. SES MEGALOPOLIS A’ 1.(c) 210,000,000.00 5.09%
82906 RO4GJ_11 Romania COMPLEXUL ENERGETIC TURCENI 1.(c) 134,000,000.00 3.25%
65771 13000004 Bulgaria
Gorivna instalatsias nominalna
toplinna moshtnost 1020MWt 1.(c) 109,000,000.00 2.64%
6995 15P000483 Poland
Zespól Elektrowni Pątnów‐
Adamów -Konin S.A., Elektrownia
Pątnów 1.(c) 86,600,000.00 2.10%
941,600,000.00 22.81%
Other organic
substances
78619 1149.0029.01 Norway Hydro Aluminium AS Karmøy 2.(e).(i) 57,400.00 24.22%
6961 15P000003 Poland
Impexmetal S.A. Zakład
Aluminium Konin 2.(e) 38,100.00 16.08%
6789 1478 Spain ALCOA INESPAL, S.A. - LA CORUÑA 2.(e).(i) 18,700.00 7.89%
81803 100005851 Portugal
Lisgráfica, Impressão e Artes
Gráficas, S.A. 9.(c) 12,200.00 5.15%
80120 12S002419 Poland
SITA Starol Sp. z o.o., Zakład
Produkcji Paliw Alternatywnych 5.(a) 11,100.00 4.68%
137,500.00 58.03%
Sulphur oxides
(SOx/SO2)
Polycyclic aromatic
hydrocarbons
(PAHs)
Sulphur oxides (SOx/SO2) total "top5"
Polycyclic aromatic hydrocarbons (PAHs) total "top5"
Non-methane
volatile organic
compounds
(NMVOC)
Note: Contributions of single facilities of over 10 % to the total E-PRTR emissions are highlighted in blue. Contributions of single
facilities of over 50 % to the total E-PRTR emissions are highlighted in red.
B.5.2 Top polluting facilities for releases to water
Table B.7 below provides information for selected pollutants28 on the five facilities with the highest
share of total E-PRTR releases to water per pollutant. The selected pollutants are:
Heavy metals
Total nitrogen
Total phosphorus
Total organic carbon (TOC)
The complete list of facilities ranked among the E-PRTR top 20 polluting facilities including information
on their share in total E-PRTR emission is provided in the stage 1 Excel tool, sheet “E-PRTR TOP20”.
The top polluting facilities releasing heavy metals to water mostly have a share between 0 % and 15 %
(Cadmium). However, there are outliers for Chromium and Lead and compounds with a share of 92 %
and 54 %, respectively, of the top polluting facility. This high share of the top polluter could indicate an
anomaly in data and should be checked by countries. For total nitrogen, total phosphorus and total
28 The list of top 20 E-PRTR facilities for each pollutant (91 in total) can be produced with the Stage1 tool distributed to all countries on 30 July
2010 and available at the Eionet CIRCA website at: http://eea.eionet.europa.eu/Members/irc/eionet-circle/e-prtr/library?l=/e-
prtr/country_feedback/2010_2008_dataset/stage_stage_august_2010/e-prtr_stage1_uploaded&vm=detailed&sb=Title

ETC/ACC - ETC/SCP - ETC/W E-PRTR Review 2009 43/162
organic carbon (TOC) the share of the top five polluters are more evenly distributed in a range between
1 % and 6 %.
Table B.7 Facilities with the highest releases to water of selected pollutants under E-PRTR 2008
Pollutant group/
Pollutant
Facility
ID National ID Country Facility Name
Main
Activity Total Quantity kg/a
All
countries
share
Heavy metals
76453 2007000688 Italy
Impianto di Depurazione di
Merone (località Baggero) 5.(f) 3,640 7.91%
65900 12000024 Bulgaria
Sofiyska prechistvatelna stantsia
za otpadachni vodi Kubratovo 5.(f) 1,500 3.26%
79524 06K001688 Poland
Zakłady Górniczo‐Hutnicze
BOLESŁAW S.A., Pion Górniczo ‐
Przeróbczy - Kopalnia 3.(a) 1,240 2.70%
12857 CZ39774818
Czech
Republic
Sokolovská uhelná,právní
nástupce,a.s.‐zpracovatelská část 1.(c) 1,030 2.24%
65668 Bxl12 Belgium
Station d'épuration De Bruxelles
Nord 5.(f) 996 2.17%
8,406 18.27%
69191 759.17800 France STEP - Douai 5.(f) 3,320 15.36%
65900 12000024 Bulgaria
Sofiyska prechistvatelna stantsia
za otpadachni vodi Kubratovo 5.(f) 2,530 11.71%
80657 01D000706 Poland
Miejskie Przedsiębiorstwo
Wodociągów i Kanalizacji Sp. z
o.o., Wrocławska Oczyszczalnia
Ścieków Janówek 5.(f) 1,740 8.05%
82353 RO1IS_51 Romania
SC APAVITAL SA IASI-STATIA DE
EPURARE IASI 5.(f) 1,320 6.11%
79524 06K001688 Poland
Zakłady Górniczo‐Hutnicze
BOLESŁAW S.A., Pion Górniczo ‐
Przeróbczy - Kopalnia 3.(a) 991 4.59%
Cadmium and compounds (as Cd) total "top5" 9,901 45.81%
65668 Bxl12 Belgium
Station d'épuration De Bruxelles
Nord 5.(f) 8,410,000 92.49%
4200 064.00001 France
Aluminium Pechiney Usine de
Gardanne 2.(e).(i) 446,000 4.90%
69191 759.17800 France STEP - Douai 5.(f) 75,900 0.83%
4788 070.00922 France TIOXIDE EUROPE S.A.S 4.(a).(x) 15,000 0.16%
65771 13000004 Bulgaria
Gorivna instalatsias nominalna
toplinna moshtnost 1020MWt 1.(c) 6,490 0.07%
8,953,390 98.46%
69191 759.17800 France STEP - Douai 5.(f) 344,000 46.98%
82688 RO7AB_313 Romania
SC ENERGO MINERAL SA -
Depozite de sterile 3.(b) 20,800 2.84%
77940 2008001123 Italy
ILVA S.P.A. Stabilimento di
Taranto 2.(b) 9,590 1.31%
12893
DECCOffsh-
Brent-Charlie
United
Kingdom Brent Charlie 1.(c) 9,310 1.27%
4200 064.00001 France
Aluminium Pechiney Usine de
Gardanne 2.(e).(i) 6,400 0.87%
390,100 53.27%
69191 759.17800 France STEP - Douai 5.(f) 159,000 54.24%
79524 06K001688 Poland
Zakłady Górniczo‐Hutnicze
BOLESŁAW S.A., Pion Górniczo ‐
Przeróbczy - Kopalnia 3.(a) 24,500 8.36%
4200 064.00001 France
Aluminium Pechiney Usine de
Gardanne 2.(e).(i) 16,300 5.56%
65900 12000024 Bulgaria
Sofiyska prechistvatelna stantsia
za otpadachni vodi Kubratovo 5.(f) 7,120 2.43%
66241 CZ37836663
Czech
Republic Provoz ČOV 5.(f) 2,770 0.94%
209,690 71.53%
Arsenic and compounds (as As) total "top5"
Copper and compounds (as Cu) total "top5"
Lead and compounds (as Pb) total "top5"
Lead and
compounds (as
Pb)
Copper and
compounds (as
Cu)
Chromium and
compounds (as
Cr)
Cadmium and
compounds (as
Cd)
Arsenic and
compounds (as
As)
Chromium and compounds (as Cr) total "top5"
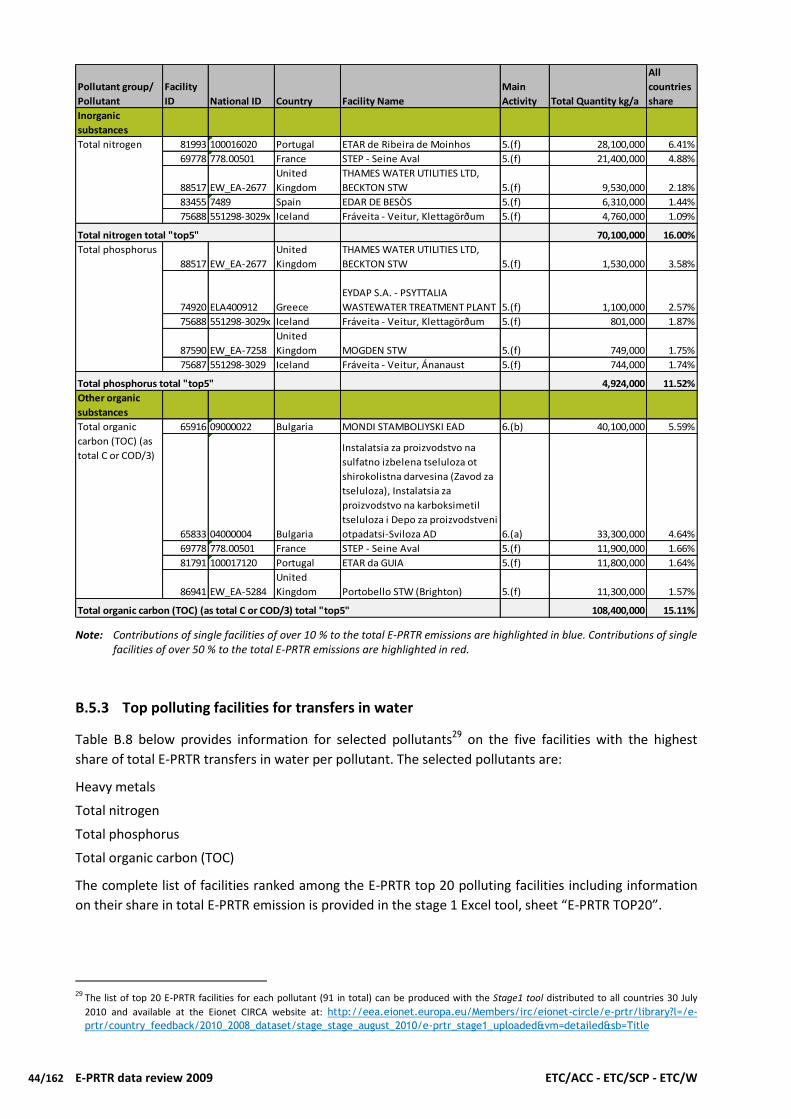
44/162 E-PRTR data review 2009 ETC/ACC - ETC/SCP - ETC/W
Pollutant group/
Pollutant
Facility
ID National ID Country Facility Name
Main
Activity Total Quantity kg/a
All
countries
share
Inorganic
substances
81993 100016020 Portugal ETAR de Ribeira de Moinhos 5.(f) 28,100,000 6.41%
69778 778.00501 France STEP - Seine Aval 5.(f) 21,400,000 4.88%
88517 EW_EA-2677
United
Kingdom
THAMES WATER UTILITIES LTD,
BECKTON STW 5.(f) 9,530,000 2.18%
83455 7489 Spain EDAR DE BESÒS 5.(f) 6,310,000 1.44%
75688 551298-3029x Iceland Fráveita - Veitur, Klettagörðum 5.(f) 4,760,000 1.09%
70,100,000 16.00%
88517 EW_EA-2677
United
Kingdom
THAMES WATER UTILITIES LTD,
BECKTON STW 5.(f) 1,530,000 3.58%
74920 ELA400912 Greece
EYDAP S.A. - PSYTTALIA
WASTEWATER TREATMENT PLANT 5.(f) 1,100,000 2.57%
75688 551298-3029x Iceland Fráveita - Veitur, Klettagörðum 5.(f) 801,000 1.87%
87590 EW_EA-7258
United
Kingdom MOGDEN STW 5.(f) 749,000 1.75%
75687 551298-3029 Iceland Fráveita - Veitur, Ánanaust 5.(f) 744,000 1.74%
4,924,000 11.52%
Other organic
substances
65916 09000022 Bulgaria MONDI STAMBOLIYSKI EAD 6.(b) 40,100,000 5.59%
65833 04000004 Bulgaria
Instalatsia za proizvodstvo na
sulfatno izbelena tseluloza ot
shirokolistna darvesina (Zavod za
tseluloza), Instalatsia za
proizvodstvo na karboksimetil
tseluloza i Depo za proizvodstveni
otpadatsi-Sviloza AD 6.(a) 33,300,000 4.64%
69778 778.00501 France STEP - Seine Aval 5.(f) 11,900,000 1.66%
81791 100017120 Portugal ETAR da GUIA 5.(f) 11,800,000 1.64%
86941 EW_EA-5284
United
Kingdom Portobello STW (Brighton) 5.(f) 11,300,000 1.57%
108,400,000 15.11%Total organic carbon (TOC) (as total C or COD/3) total "top5"
Total nitrogen total "top5"
Total phosphorus total "top5"
Total organic
carbon (TOC) (as
total C or COD/3)
Total phosphorus
Total nitrogen
Note: Contributions of single facilities of over 10 % to the total E-PRTR emissions are highlighted in blue. Contributions of single facilities of over 50 % to the total E-PRTR emissions are highlighted in red.
B.5.3 Top polluting facilities for transfers in water
Table B.8 below provides information for selected pollutants29 on the five facilities with the highest
share of total E-PRTR transfers in water per pollutant. The selected pollutants are:
Heavy metals
Total nitrogen
Total phosphorus
Total organic carbon (TOC)
The complete list of facilities ranked among the E-PRTR top 20 polluting facilities including information
on their share in total E-PRTR emission is provided in the stage 1 Excel tool, sheet “E-PRTR TOP20”.
29 The list of top 20 E-PRTR facilities for each pollutant (91 in total) can be produced with the Stage1 tool distributed to all countries 30 July
2010 and available at the Eionet CIRCA website at: http://eea.eionet.europa.eu/Members/irc/eionet-circle/e-prtr/library?l=/e-
prtr/country_feedback/2010_2008_dataset/stage_stage_august_2010/e-prtr_stage1_uploaded&vm=detailed&sb=Title

ETC/ACC - ETC/SCP - ETC/W E-PRTR Review 2009 45/162
Table B.8 Facilities with the highest transfers to water of selected pollutants under E-PRTR 2008
Pollutant group/
Pollutant
Facility
ID National ID Country Facility Name
Main
Activity Total Quantity kg/a
All
countries
share
Heavy metals
214 01D000168 Poland
KGHM POLSKA MIEDŹ S.A., Huta
Miedzi GŁOGÓW 2.(e) 220,000 93.09%
212 01D000166 Poland
KGHM POLSKA MIEDŹ S.A., Huta
Miedzi LEGNICA 5.(d) 13,300 5.63%
211 01D000161 Poland
Instytut Metali Nieżelaznych
Oddział Legnica 2.(e) 384 0.16%
70223
03-09-
09090117300 Germany Weser - Metall GmbH 2.(e).(i) 303 0.13%
83541 7376 Spain
AQUALIA - EDAR TALAVERA DE LA
REINA 5.(f) 287 0.12%
Arsenic and compounds (as As) total "top5" 234,274 99.13%
211 01D000161 Poland
Instytut Metali Nieżelaznych
Oddział Legnica 2.(e) 2,520 45.67%
70223
03-09-
09090117300 Germany Weser - Metall GmbH 2.(e).(i) 1,050 19.03%
88304 P0127/06A
United
Kingdom
Langford Lodge Engineering Co.
Ltd 2.(f) 340 6.16%
212 01D000166 Poland
KGHM POLSKA MIEDŹ S.A., Huta
Miedzi LEGNICA 5.(d) 335 6.07%
214 01D000168 Poland
KGHM POLSKA MIEDŹ S.A., Huta
Miedzi GŁOGÓW 2.(e) 327 5.93%
Cadmium and compounds (as Cd) total "top5" 4,572 82.85%
5209 09R000054 Poland Delphi Poland S.A. Oddział Krosno 2.(f) 19,500 33.71%
4131 063.01099 France
COMPAGNIE EUROPEENNE DE
TANNAGE 9.(b) 7,920 13.69%
87726 EW_EA-958
United
Kingdom
DMI (UK) Ltd , North Shields
Surface Treatment Plant 2.(f) 3,250 5.62%
77908 2008000702 Italy
NUOVA CONCERIA PELLIZZARI SPA
UNIPERSONALE 9.(c) 3,180 5.50%
12860 CZ53884341
Czech
Republic Synthesia a. s. 4.(a).(x) 2,720 4.70%
Chromium and compounds (as Cr) total "top5" 36,570 63.23%
86427 EW_EA-2564
United
Kingdom
St. Regis Paper Company Limited,
Kemsley Paper Mill 6.(a) 25,900 22.74%
214 01D000168 Poland
KGHM POLSKA MIEDŹ S.A., Huta
Miedzi GŁOGÓW 2.(e) 23,900 20.98%
212 01D000166 Poland
KGHM POLSKA MIEDŹ S.A., Huta
Miedzi LEGNICA 5.(d) 10,600 9.31%
9031 3615 Spain FINITEXTIL, S.L. 9.(a) 9,230 8.10%
70960
06-05-300-
9047821 Germany Saltigo GmbH 4.(a) 3,410 2.99%
Copper and compounds (as Cu) total "top5" 73,040 64.12%
214 01D000168 Poland
KGHM POLSKA MIEDŹ S.A., Huta
Miedzi GŁOGÓW 2.(e) 62,200 64.14%
65875 12000014 Bulgaria Kremikovtsi AD 2.(b) 15,100 15.57%
212 01D000166 Poland
KGHM POLSKA MIEDŹ S.A., Huta
Miedzi LEGNICA 5.(d) 4,140 4.27%
70223
03-09-
09090117300 Germany Weser - Metall GmbH 2.(e).(i) 1,870 1.93%
79969 02C 000447 Poland Zakłady Chemiczne ZACHEM S.A. 4.(b) 1,050 1.08%
Lead and compounds (as Pb) total "top5" 84,360 86.99%
Arsenic and
compounds (as As)
Cadmium and
compounds (as Cd)
Chromium and
compounds (as Cr)
Copper and
compounds (as Cu)
Lead and
compounds (as Pb)

46/162 E-PRTR data review 2009 ETC/ACC - ETC/SCP - ETC/W
Pollutant group/
Pollutant
Facility
ID National ID Country Facility Name
Main
Activity Total Quantity kg/a
All
countries
share
70223
03-09-
09090117300 Germany Weser - Metall GmbH 2.(e).(i) 712 33.52%
71023
06-05-500-
0152577 Germany Infracor GmbH 1.(c) 504 23.73%
212 01D000166 Poland
KGHM POLSKA MIEDŹ S.A., Huta
Miedzi LEGNICA 314 14.78%
87221 EW_EA-6111
United
Kingdom
Novartis Vaccines and Diagnostics
Limited, Chiron Vaccines Site
1,2,3,4 4.(e) 80 3.77%
83135 77070511 Slovakia Kia Motors Slovakia, s.r.o. 9.(c) 80 3.75%
Mercury and compounds (as Hg) total "top5" 1,690 79.54%
214 01D000168 Poland
KGHM POLSKA MIEDŹ S.A., Huta
Miedzi GŁOGÓW 2.(e) 13,800 24.50%
74041
06-05-500-
0053929 Germany RUHR OEL GMBH Werk Scholven 1.(a) 3,820 6.78%
12849 CZ86757407
Czech
Republic závod Mladá Boleslav 2.(e).(ii) 3,320 5.89%
79969 02C 000447 Poland Zakłady Chemiczne ZACHEM S.A. 4.(b) 2,160 3.83%
70955
06-05-300-
9047369 Germany LANXESS Deutschland GmbH 4.(a) 2,080 3.69%
Nickel and compounds (as Ni) total "top5" 25,180 44.70%
5763 20000.00002 Austria Lenzing AG 4.(a) 1,290,000 69.73%
214 01D000168 Poland
KGHM POLSKA MIEDŹ S.A., Huta
Miedzi GŁOGÓW 2.(e) 204,000 11.03%
66097 CZ56976407
Czech
Republic Glanzstoff - Bohemia s.r.o. 4.(a).(viii) 39,800 2.15%
65902 04000028 Bulgaria zavod za izkustvena koprina 4.(a).(viii) 34,400 1.86%
212 01D000166 Poland
KGHM POLSKA MIEDŹ S.A., Huta
Miedzi LEGNICA 5.(d) 33,100 1.79%
Zinc and compounds (as Zn) total "top5" 1,601,300 86.56%
Inorganic
substances
13144 EW_EA-1545
United
Kingdom
Johnson Matthey plc, CLITHEROE
CATALYST FACTORY 4.(a) 4,370,000 9.68%
74175
07-04-
6388757 Germany Sutter 8.(b).(i) 2,180,000 4.83%
13836 EW_EA-811
United
Kingdom
Corus UK Limited, TEESSIDE
INTEGRATED IRON AND
STEELWORKS 2.(c) 1,730,000 3.83%
73964
06-05-100-
0006538 Germany ThyssenKrupp Nirosta GmbH 2.(b) 1,490,000 3.30%
13539 EW_EA-2791
United
Kingdom
United Utilities Water Plc, Mersey
Valley Processing Centre (MVPC) 5.(b) 1,390,000 3.08%
Total nitrogen total "top5" 11,160,000 24.72%
71787
06-
70007370412 Germany
Clariant Produkte (Deutschland)
GmbH, Standort Rhein-Main,
Betriebsteil Frankfurt-Höchst 4.(a).(x) 505,000 6.52%
5679 10006 Nether-lands
Shell Nederland Chemie BV
(Hoogvliet) 4.(a) 353,000 4.56%
69378 059.01243 France EUROSERUM 8.(c) 268,000 3.46%
74175
07-04-
6388757 Germany Sutter 8.(b).(i) 222,000 2.87%
86386 EW_EA-2213
United
Kingdom
Thermphos Ltd, Widnes
Phosphates 4.(b) 205,000 2.65%
Total phosphorus total "top5" 1,553,000 20.04%
Zinc and compounds
(as Zn)
Total nitrogen
Total phosphorus
Mercury and
compounds (as Hg)
Nickel and
compounds (as Ni)
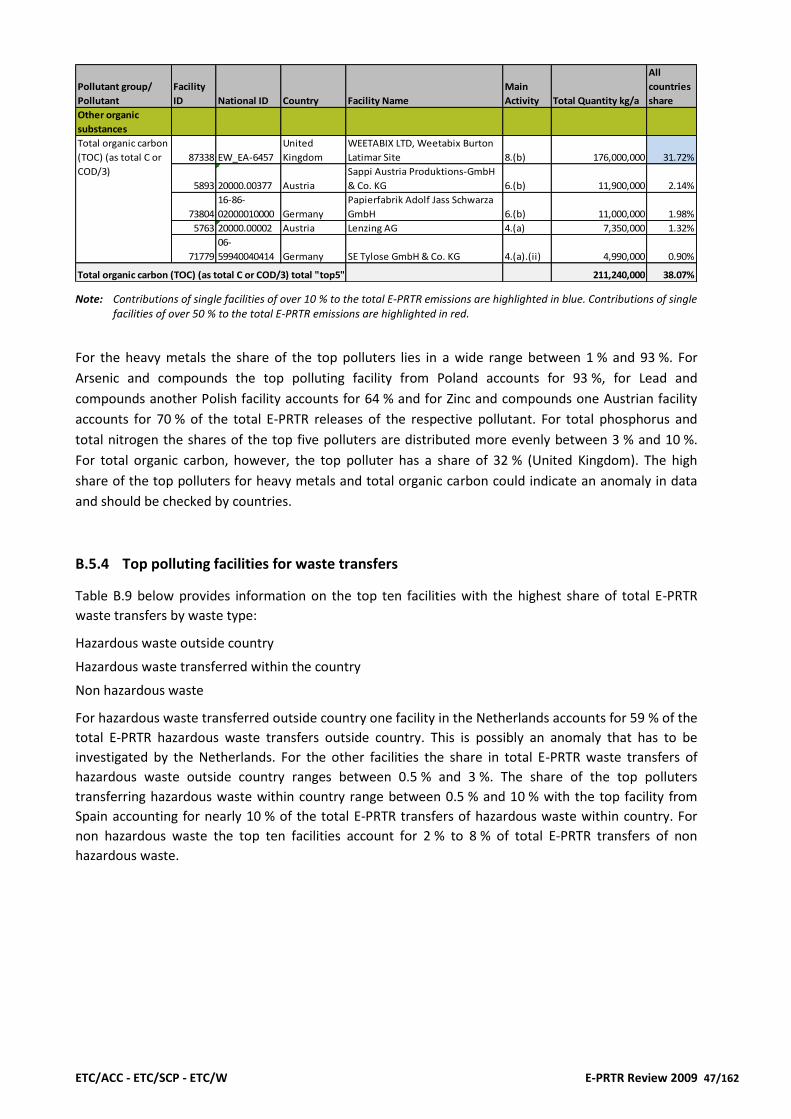
ETC/ACC - ETC/SCP - ETC/W E-PRTR Review 2009 47/162
Pollutant group/
Pollutant
Facility
ID National ID Country Facility Name
Main
Activity Total Quantity kg/a
All
countries
share
Other organic
substances
87338 EW_EA-6457
United
Kingdom
WEETABIX LTD, Weetabix Burton
Latimar Site 8.(b) 176,000,000 31.72%
5893 20000.00377 Austria
Sappi Austria Produktions-GmbH
& Co. KG 6.(b) 11,900,000 2.14%
73804
16-86-
02000010000 Germany
Papierfabrik Adolf Jass Schwarza
GmbH 6.(b) 11,000,000 1.98%
5763 20000.00002 Austria Lenzing AG 4.(a) 7,350,000 1.32%
71779
06-
59940040414 Germany SE Tylose GmbH & Co. KG 4.(a).(ii) 4,990,000 0.90%
Total organic carbon (TOC) (as total C or COD/3) total "top5" 211,240,000 38.07%
Total organic carbon
(TOC) (as total C or
COD/3)
Note: Contributions of single facilities of over 10 % to the total E-PRTR emissions are highlighted in blue. Contributions of single facilities of over 50 % to the total E-PRTR emissions are highlighted in red.
For the heavy metals the share of the top polluters lies in a wide range between 1 % and 93 %. For
Arsenic and compounds the top polluting facility from Poland accounts for 93 %, for Lead and
compounds another Polish facility accounts for 64 % and for Zinc and compounds one Austrian facility
accounts for 70 % of the total E-PRTR releases of the respective pollutant. For total phosphorus and
total nitrogen the shares of the top five polluters are distributed more evenly between 3 % and 10 %.
For total organic carbon, however, the top polluter has a share of 32 % (United Kingdom). The high
share of the top polluters for heavy metals and total organic carbon could indicate an anomaly in data
and should be checked by countries.
B.5.4 Top polluting facilities for waste transfers
Table B.9 below provides information on the top ten facilities with the highest share of total E-PRTR
waste transfers by waste type:
Hazardous waste outside country
Hazardous waste transferred within the country
Non hazardous waste
For hazardous waste transferred outside country one facility in the Netherlands accounts for 59 % of the
total E-PRTR hazardous waste transfers outside country. This is possibly an anomaly that has to be
investigated by the Netherlands. For the other facilities the share in total E-PRTR waste transfers of
hazardous waste outside country ranges between 0.5 % and 3 %. The share of the top polluters
transferring hazardous waste within country range between 0.5 % and 10 % with the top facility from
Spain accounting for nearly 10 % of the total E-PRTR transfers of hazardous waste within country. For
non hazardous waste the top ten facilities account for 2 % to 8 % of total E-PRTR transfers of non
hazardous waste.

48/162 E-PRTR data review 2009 ETC/ACC - ETC/SCP - ETC/W
Table B.9 Top 10 facilities with the highest waste transfers per waste type under E-PRTR 2008
WasteType
Facility
ID National ID Country Facility Name
Main
Activity Total Quantity [t/a]
All
countries
share [%]
9538 44009 Netherlands
NV Afvalverbranding Zuid-
Nederland 5.(b) 4,638,000 59.06%
75733 P0164 Ireland Becbay Limited 3.(e) 224,400 2.86%
68145 062.01748 France URSA FRANCE 3.(e) 123,000 1.57%
77796 2008000490 Italy
AZ. AGRICOLA BOLDINI ALBINO E
ALBERTO SS 7.(a) 112,009 1.43%
77774 2008000447 Italy
Systema Ambiente unità
operativa ex Ecoservizi 5.(a) 111,380 1.42%
82056 100004258 Portugal Central Termoeléctrica de Sines 1.(c) 80,100 1.02%
5868 20000.00256 Austria voestalpine Stahl GmbH 2.(b) 79,000 1.01%
78468 41521 Netherlands
Afvalstoffen Terminal Moerdijk
BV (ATM) 5.(a) 67,642 0.86%
65403
vl0060679500
0156 Belgium APPAREC 5.(a) 59,100 0.75%
75828 W0050 Ireland
Veolia Environmental Services
Technical Solutions Ltd 5.(a) 49,420 0.63%
Hazardous waste outside country - top 10 total 5,544,051 70.60%
84713 5272 Spain
ECOCAT (ANTIGUO CESPA
CONTEN) 5.(a) 3,471,460 9.78%
77750 2008000372 Italy
SMORLESI GAETANA, CECILIA & C
SPA 3.(g) 1,316,517 3.71%
5953 EE147276 Estonia
Eesti Energia Õlitööstus AS,
Õlitehas 1.(a) 647,200 1.82%
67285 1376 Finland Boliden Kokkola Oy, Sinkkitehdas 2.(a) 593,570 1.67%
72418
06-08-
9483519 Germany
Albert Huthmann GmbH & Co. KG
Spezialbaustoffe 5.(a) 542,000 1.53%
77322 2007001989 Italy LAGOR SPA 4.(a) 489,900 1.38%
67155 1152 Finland
Boliden Harjavalta Oy, Harjavallan
tehtaat 2.(e).(ii) 379,005 1.07%
82301 100004423 Portugal
Gamil - Galvanização do Minho,
Lda. 2.(f) 340,000 0.96%
498 03L000044 Poland
Krajowa Spółka Cukrowa S.A.,
Oddział Cukrownia Krasnystaw 8.(b) 264,570 0.75%
78537 0106.0083.01 Norway KRONOS TITAN AS 4.(a).(x) 222,010 0.63%
Hazardous waste within country - top 10 total 8,266,232 23.29%
78448 203417 Netherlands Van Rooi Meat BV (Helmond) 8.(a) 28,600,000 7.69%
79399 01D002751 Poland
KGHM POLSKA MIEDŹ S.A.,
Zakłady Wzbogacania Rud ‐ Rejon
RUDNA 3.(a) 13,730,000 3.69%
78459 220480 Netherlands RWZI Zwanenburg 5.(f) 9,460,000 2.54%
85772 187 Switzerland
DSM Nutritional Products AG -
Werk Lalden /
Zweigniederlassung Werk Lalden 4.(a).(i) 8,510,000 2.29%
8857 3367 Spain AZUCARERA DE LA BAÑEZA 8.(b).(ii) 8,420,000 2.26%
85610 2313-60-001 Sweden Lidens avfallsanläggning 5.(a) 7,780,000 2.09%
213 01D000167 Poland
KGHM POLSKA MIEDŹ S.A.,
Zakłady Wzbogacania Rud ‐ Rejon
POLKOWICE 5.(a) 7,480,000 2.01%
84946 2081 Spain INDUSTRIAS HERGOM 2.(d) 7,096,400 1.91%
79523 01D001462 Poland
KGHM POLSKA MIEDŹ S.A.,
Zakłady Wzbogacania Rud ‐ Rejon
Lubin 3.(a) 6,490,000 1.75%
65850 13000002 Bulgaria "TETs Maritsa iztok 2" EAD 1.(c) 3,340,000 0.90%
Non-hazardous waste - top 10 total 100,906,400 27.14%
Hazardous waste
outside country
Hazardous waste
within country
Non-hazardous
waste
Note: Contributions of single facilities of over 50 % to the total E-PRTR emissions are highlighted in red.

ETC/ACC - ETC/SCP - ETC/W E-PRTR Review 2009 49/162
B.6 Contribution of individual facilities to E-PRTR emissions to air for 2008 – sector/activity level
This section shows top three E-PRTR 2008 facilities for selected pollutants (CO2, SOx, NOx, NMVOC, NH3
and PM10) for each of the E-PRTR activities plus the list of facilities which contribute more than 20 % to
total E-PRTR emissions of other pollutants.
B.6.1 Energy (E-PRTR activity 1)
Table B.10 shows three facilities with the highest releases to air for CO2, NOx/NO2, SOx/SO2 and PM10
reported in Sector 1 (Energy). For CO2 and NOx/NO2 individual facilities contribute to activity 1 E-PRTR
emissions with less than 2 % (‘all countries share’).
For SO2 and PM10 the top three facilities produce together almost 18 % and 14 % respectively of total
SO2 and PM10 E-PRTR Energy emissions. Releases of 1,1,2,2-tetrachloroethane in activity 1 are reported
by only one facility in the United Kingdom.
Table B.10 Facilities with the highest releases to air of selected pollutants reported in E-PRTR Activity 1 - Energy under E-PRTR 2008
Pollutant Facility ID National ID Country Facility Name
Main
Activity Total Quantity kg/a
All
countries
share
1298 05E000016 Poland PGE Elektrownia Bełchatów S.A. 1.(c) 30.900.000.000,000 1,56%
70824
06-05-300-
0326774 Germany
RWE Power AG Kraftwerk
Niederaußem 1.(c) 24.900.000.000,000 1,26%
73175
12-
40710010000 Germany
Vattenfa l l Europe Generation AG
Kraftwerk Jänschwalde 1.(c) 23.500.000.000,000 1,19%
1298 05E000016 Poland PGE Elektrownia Bełchatów S.A. 1.(c) 40.900.000,000 1,46%
13777 EW_EA-67
United
Kingdom
Drax Power Limited, Drax Power
Ltd 1.(c) 38.600.000,000 1,37%
13368 EW_EA-2316
United
Kingdom
RWE npower plc, Aberthaw Power
Station 1.(c) 26.100.000,000 0,93%
65859 17000005 Bulgaria TETs "Republ ika" 1.(c) 9.280.000,000 6,85%
14246 EL5800902 Greece PPC S.A. SES PTOLEMAIDAS 1.(c) 7.170.000,000 3,56%
82931 RO5HD_11 Romania SC ELECTROCENTRALE DEVA SA 1.(c) 6.640.000,000 3,29%
65850 13000002 Bulgaria "TETs Mari tsa i ztok 2" EAD 1.(c) 402.000.000,000 9,74%
14192 EL1201188 Greece PPC S.A. SES MEGALOPOLIS A’ 1.(c) 210.000.000,000 5,09%
82906 RO4GJ_11 Romania COMPLEXUL ENERGETIC TURCENI 1.(c) 134.000.000,000 3,25%Other
pollutants
1,1,2,2-
tetrachloroet
hane 88468 EW_EA-10174
United
Kingdom Total Uk Ltd, Lindsey Oi l Refinery 1.(a) 16.000,000 58,85%Ethylene
oxide 9119 37012102 Slovakia Slovnaft, a .s . 1.(a) 21.200,000 27,02%
Carbon
dioxide (CO2)
Nitrogen
oxides
(NOx/NO2)
Particulate
matter (PM10)
Sulphur
oxides
(SOx/SO2)
Note: Contributions of over 50 % to the total E-PRTR emissions are highlighted in red, those over 2 % are highlighted in blue.
B.6.2 Production and processing of metals (E-PRTR activity 2)
Table B.11 shows the three facilities with the highest releases to air for CO2, NOx/NO2, CO, heavy metals
and other selected pollutants reported in Sector 2 – Production and processing of metals. For CO2 and
NOx/NO2 the share of the top three polluters lies below 1 %. For CO and heavy metals the share of the
top polluters lies in the range between 1 % and 6 %. The pollutants Chlorides (as total Cl),
Hexabromobiphenyl and Hexachlorobenzene (HCB) are only reported by one facility each.

50/162 E-PRTR data review 2009 ETC/ACC - ETC/SCP - ETC/W
Table B.11 Facilities with the highest releases to air of selected pollutants reported in Activity 2 - Production and processing of metals under E-PRTR 2008
Pollutant Facility ID National ID Country Facility Name
Main
Activity
Total Quantity
kg/a
All
countries
8893 3421 Spain FÁBRICA DE HUELVA 2.(e).(i ) 1.580 3,68%
71035 06-05-500-0279116 Germany Ruhr-Zink GmbH Zinkhütte 2.(a) 1.290 3,00%
10251 57002803 Slovakia U.S.Steel s .r.o. 2.(b) 1.240 2,89%
10557 CZ95150686 Czech ArcelorMitta l Ostrava a .s . 2.(c).(i ) 1.060 5,59%
7974 23301 Netherland Corus Staa l BV 2.(b) 730 3,85%
6488 12S000241 Poland
ArcelorMitta l Poland S.A.,
Oddzia ł w Dąbrowie Górniczej 2.(a) 684 3,60%
4797 070.00956 France ARCELORMITTAL SITE DE 2.(c).(i ) 11.500.000.000 0,58%
77940 2008001123 Ita ly ILVA S.P.A. Stabi l imento di 2.(b) 10.700.000.000 0,54%
10251 57002803 Slovakia U.S.Steel s .r.o. 2.(b) 8.960.000.000 0,45%
77940 2008001123 Ita ly ILVA S.P.A. Stabi l imento di 2.(b) 248.000.000 6,42%
70572 06-05-100-0209686 Germany
ThyssenKrupp Steel AG Werk
Schwelgern 2.(a) 198.000.000 5,13%
70532 06-05-100-0077961 Germany
Hüttenwerke Krupp
Mannesmann GmbH 2.(b) 188.000.000 4,87%
66379 CZ40779097 Czech ŽELEZÁRNY Hrádek a . s . 2.(b) 381 1,01%
10557 CZ95150686 Czech ArcelorMitta l Ostrava a .s . 2.(c).(i ) 330 0,87%
7974 23301 Netherland Corus Staa l BV 2.(b) 258 0,68%
77940 2008001123 Ita ly ILVA S.P.A. Stabi l imento di 2.(b) 12.500.000 0,44%
13045 EW_EA-122
United
Kingdom
Alcan Aluminium UK Ltd, ALCAN
LYNEMOUTH SMELTER 2.(e) 7.800.000 0,28%
8930 3486 Spain
ARCELORMITTAL ESPAÑA -
PLANTA SIDERÚRGICA DE AVILÉS 2.(b) 6.920.000,00 0,25%
7917 2281-103 Sweden Kubikenborg Aluminium AB 2.(e).(i ) 3.990,00 42,00%
15021 W005 Belgium
ARCELORMITTAL UPSTREAM sa
(COKE FONTE) 2.(b) 2.890,00 30,42%
15022 W006 Belgium CARSID S.A. (coke-fonte 2.(b) 1.850,00 19,47%
78619 1149.0029.01 Norway Hydro Aluminium AS Karmøy 2.(e).(i ) 131.000,00 25,26%
78752 1563.0008.01 Norway Hydro Aluminium AS Sunndal 2.(e).(i ) 114.000,00 21,98%
78647 1224.0008.01 Norway Sør-Norge Aluminium 2.(e).(i ) 70.700,00 13,63%
15104 W092 Belgium
ARCELORMITTAL UPSTREAM
LIEGE sa - Cherta l (Acierie, CC,
Laminoir a chaud) 2.(b) 981 53,07%
67074 1257 Finland Ovako Bar Oy Ab, Imatran 2.(b) 640 34,62%
15021 W005 Belgium
ARCELORMITTAL UPSTREAM sa
(COKE FONTE) 2.(b) 158 8,55%
15104 W092 Belgium
ARCELORMITTAL UPSTREAM
LIEGE sa - Cherta l (Acierie, CC,
Laminoir a chaud) 2.(b) 981 53,69%
65164 W197 Belgium
ARCELORMITTAL-STAINLESS
BELGIUM Chatelet 2.(b) 685 37,49%
15021 W005 Belgium
ARCELORMITTAL UPSTREAM sa
(COKE FONTE) 2.(b) 113 6,19%
Other pollutants
1,1,2,2-
tetrachloroethane 15021 W005 Belgium
ARCELORMITTAL UPSTREAM sa
(COKE FONTE) 2.(b) 7.640,0 28,10%
Chlorides (as tota l
Cl ) 78584 1001.0099.01 Norway Xstrata Nikkelverk 2.(e).(i ) 5.500,0 99,32%
Hexabromobiphen
yl 65204 Bxl02 Belgium
Fonderie et Manufacture des
Métaux 2.(e).(i ) 2,9 100,00%
Hexachlorobenzen
e (HCB) 65164 W197 Belgium
ARCELORMITTAL-STAINLESS
BELGIUM Chatelet 2.(b) 477,0 64,82%
Polychlorinated
biphenyls (PCBs) 77940 2008001123 Ita ly
ILVA S.P.A. Stabi l imento di
Taranto 2.(b) 30,8 21,46%
Polycycl ic aromatic
hydrocarbons
(PAHs) 78619 1149.0029.01 Norway Hydro Aluminium AS Karmøy 2.(e).(i ) 57.400,0 24,22%
Tetrachloroethylen
e (PER) 15119 W113 Belgium SONACA sa 2.(f) 234.000,0 37,45%
Mercury and
compounds (as
Hg)
Nitrogen oxides
(NOx/NO2)
Anthracene
Fluorides (as tota l
F)
Pentachlorobenze
ne
Pentachloropheno
l (PCP)
Arsenic and
compounds (as As)
Cadmium and
compounds (as Cd)
Carbon dioxide
(CO2)
Carbon monoxide
(CO)
Note: Contributions of over 50 % to the total E-PRTR emissions are highlighted in red, those over 2 % are highlighted in blue.

ETC/ACC - ETC/SCP - ETC/W E-PRTR Review 2009 51/162
B.6.3 Mineral Industry (E-PRTR activity 3)
E-PRTR 2008 releases from CO2, NMVOC and PM10 are distributed evenly between the number of
facilities with a share of top three of a maximum of 2.1 %. However, 1,2,3,4,5,6-hexachlorocyclohexane
(HCH) was only reported by one facility in France and all top polluters for Phenols and Total organic
carbon (TOC) were reported by Norway.
Table B.12 Facilities with the highest releases to air of selected pollutants reported in Activity 3 – Mineral industry under E-PRTR 2008
Pollutant
Facility
ID National ID Country Facility Name
Main
Activity
Total Quantity
kg/a
All
countries
share
14213 EL4301082 Greece HERACLES G.C.Co, VOLOS PLANT 3.(c) 2.630.000.000 0,13%
70595
06-05-100-
0238246 Germany
Rheinkalk GmbH Werk
Flandersbach 3.(c).(ii) 2.330.000.000 0,12%
7040 162 Denmark Aalborg Portland 3.(c) 2.240.000.000 0,11%
14537 Scotland-73
United
Kingdom Glass Factory 3.(e) 11.200.000 2,07%
6908 1535 Spain
CASTELLAR VIDRIO, S.A. (ABANS
VALVITRUM S.A.) 3.(e) 2.480.000 0,46%
13067 EW_EA-1269
United
Kingdom
Hanson Building Products
Limited, WHITTLESEY
BRICKWORKS 3.(g) 1.190.000 0,22%
9891 50 Cyprus
VASSILIKO CEMENT WORKS
PUBLIC COMPANY LTD, Vassilikos
Plant 3.(c).(i) 1.260.000 0,63%
9968 51 Cyprus
VASSILIKO CEMENT WORKS
PUBLIC COMPANY LTD, Moni Plant 3.(c).(i) 652.000 0,32%
83955 2624 Spain
CERÁMICAS ALONSO, S.L.
CASTELLO DE RUGAT 3.(g) 462.000 0,23%
78540 0124.0008.01 Norway GLAVA AS, Askim 3.(e) 24.000 69,93%
78808 1714.0031.01 Norway GLAVA AS, Stjørdal 3.(e) 3.900 11,36%
78765 1601.0117.01 Norway ROCKWOOL AS, Trondheim 3.(f) 3.060 8,92%
78568 0805.0028.01 Norway Norcem A.S, Brevik 3.(c) 29.700 63,41%
78867 1850.0002.01 Norway NORCEM AS, Kjøpsvik 3.(c) 6.630 14,16%
79057 1729.0010.01 Norway Verdalskalk A.S 3.(c).(ii) 639 1,36%
Other pollutants
1,2,3,4,5,6-
hexachlorocyclohex 4823 070.01209 France IMERYS TC - SITE DE PHALEMPIN 3.(g) 100 100,00%
Carbon dioxide
(CO2)
Non-methane
volatile organic
compounds
(NMVOC)
Particulate matter
(PM10)
Phenols (as total C)
Total organic carbon
(TOC) (as total C or
COD/3)
Note: Contributions of over 50 % to the total E-PRTR emissions are highlighted in red, those over 2 % are highlighted in blue.
B.6.4 Chemical Industry (E-PRTR activity 4)
The share of the releases of the top three facilities from the chemical industry in total E-PRTR releases
(‘All countries share’) for the pollutants NH3, NMVOC, NOx/NO2 and SOx/SO2 is distributed evenly and
lies in a range from 0.15 % to 1.3 %. However, facilities/pollutants with an all countries share above 20 %
are listed in Table B.13. The top polluter for Xylenes (United Kingdom) and Total nitrogen (Norway) had
both a share of 100 % of the in total E-PRTR emissions to air for the respective pollutant. These
pollutants are not included in the E-PRTR Regulation as pollutants which are normally released to air and
these releases could therefore be reporting mistakes.

52/162 E-PRTR data review 2009 ETC/ACC - ETC/SCP - ETC/W
Table B.13 Facilities with the highest releases to air of selected pollutants reported in Activity 4 – Chemical industry under E-PRTR 2008
Pollutant
Facility
ID National ID Country Facility Name
Main
Activity
Total
Quantity
kg/a
All
countries
share
82875 RO3IL_417 Romania SC AMONIL SA SLOBOZIA 4.(c) 3.280.000 1,23%
82981 RO7AB_41 Romania SC GHCL UPSOM ROMANIA SA 4.(b).(iv) 2.510.000 0,94%
13154 EW_EA-1567
United
Kingdom
KEMIRA GROWHOW UK LTD, Ince
Fertiliser Manufacturing Site 4.(c) 1.560.000 0,58%
4675 06K000440 Poland
Zakłady Azotowe w Tarnowie‐
Mościcach S.A. 4.(a) 6.320.000 0,22%
6838 CZ17751142 Czech RepublicCHEMOPETROL 4.(a).(i) 5.690.000 0,20%
83004 RO7MS_43 Romania SC AZOMURES SA 4.(c) 5.280.000 0,19%
72840
06-09-676-
0081-0001 Germany Cordenka GmbH 4.(a).(viii) 7.170.000 1,32%
82918 RO4VL_41 Romania SC OLTCHIM SA 4.(b).(iii) 7.080.000 1,31%
86052 E247_73
United
Kingdom Interfloor Ltd 4.(a).(v) 4.690.000 0,87%
509 03L000438 Poland Zakłady Azotowe "Puławy" S.A. 4.(c) 8.300.000 0,20%
80049 02C 000165 Poland
Soda Polska CIECH Sp. z o.o.,
Zakład Produkcyjny
JANIKOSODA w Janikowie 4.(b) 6.300.000 0,15%
6838 CZ17751142 Czech RepublicCHEMOPETROL 4.(a).(i) 6.140.000 0,15%
4260 064.00982 France VINYLFOS 4.(a).(vi) 379.000 28,44%
4256 064.00942 France ARKEMA 4.(a).(vi) 236.000 17,71%
85936 EW_EA-1451 United Kingdom
INEOS CHLOR LTD, Runcorn
Halochemicals 4.(a) 166.000 12,46%
4462 066.01578 France RHODIA OPERATIONS 4.(a).(vi) 42.900 35,47%
13650 EW_EA-3070 United Kingdom
Syngenta Ltd, Huddersfield
Chemical Industry 4.(d) 39.900 32,99%
5741 10079 Netherlands Du Pont de Nemours (Ned.) BV 4.(a) 6.280 5,19%
14597
vl0010645100
0188 Belgium BP CHEMBEL Geel 4.(a) 5.790 67,09%
3030 061.03685 France ARKEMA Pierre-Bénite 4.(b).(i) 2.070 23,98%
85879 56 Switzerland Dottikon Exclusive Synthesis AG 4.(e) 7 0,08%
Other pollutants
Di-(2-ethyl hexyl)
phthalate (DEHP) 75120 100339472 Hungary Graboplast Zrt. 4.(a).(viii) 5.460 33,91%
Ethylene oxide 83697 3205 Spain COGNIS IBERIA, S.A.U. 4.(a).(ii) 19.300 24,60%
Hexachlorobenzene
(HCB) 73896
03-03-
03030273580 Germany
DOW Deutschland Anlagen-
gesellschaft Werk Stade mbH 4.(a).(viii) 212 28,81%
Hydro-fluorocarbons
(HFCs) 14650
vl0030299000
0147 Belgium ABRISO Bevrijdingslaan 4.(a) 367.000 38,36%
Naphthalene
14158 CZ11453276
Czech
Republic DEZA, a.s., Valašské Meziříčí 4.(a).(i) 55.300 28,86%
Total nitrogen 78852 1837.0006.01 Norway Yara Norge AS, Yara Glomfjord 4.(c) 39.700 100,00%
Trichlorobenzenes
(TCBs) (all isomers) 14764
vl0178716400
0134 Belgium VOPAK TERMINAL ACS 4.(a) 87 21,10%
Trichloroethylene
85936 EW_EA-1451
United
Kingdom
INEOS CHLOR LTD, Runcorn
Halochemicals 4.(a) 300.000 27,58%
Trichloromethane 4256 064.00942 France ARKEMA 4.(a).(vi) 57.000 34,16%
Xylenes
88265 P0057/04A
United
Kingdom Michelin Tyre PLC 4.(a) 3.490 100,00%
Chlorofluorocarbons
(CFCs)
Halons
Ammonia (NH3)
Nitrogen oxides
(NOx/NO2)
Non-methane
volatile organic
compounds
(NMVOC)
Sulphur oxides
(SOx/SO2)
1,2-dichloroethane
(DCE)
Note: Contributions of over 50 % to the total E-PRTR emissions are highlighted in red, those over 2 % are highlighted in blue.

ETC/ACC - ETC/SCP - ETC/W E-PRTR Review 2009 53/162
B.6.5 Waste and Waste Water Handling (E-PRTR Activity 5)
Releases reported to air from Waste and waste water management seem to be distributed evenly
between facilities for the pollutants NH3, NMVOC and the heavy metals Arsenic, Cadmium and Mercury.
E-PRTR 2008 releases from the top three facilities do not exceed 1.25 % for these pollutants (Table
B.14). However, the share of the top polluting facility for methane in France is as high as 23 %. Some
other potential anomalies have been identified; e.g. one facility in Germany reported 100 % of asbestos
releases and a facility in Bulgaria reported 97 % of 1,1,1-trichloro-ethane emissions.
Table B.14 Facilities with the highest releases to air of selected pollutants reported in Activity 5 – Waste and waste water management under E-PRTR 2008
Pollutant
Facility
ID National ID Country Facility Name
Main
Activity
Total
Quantity
kg/a
All
countries
share
10245 5698 Spain
DESIMPACTE DE PURINS
ALCARRÀS S.A. (DDP-ALCARRÀS) 5.(c) 365.000 0,14%
65819 10000013 Bulgaria
Regionalno depo za neopasni,
inertnr i opasni otpadatsi za
obshtinite Ruse, Vetovo, Ivanovo,
Slivo pole i Tutrakan 5.(d) 241.000 0,09%
65818 03000022 Bulgaria
Depo za neopasni otpadatsi na
gr.Dobrich pri s.Bogdan 5.(d) 216.000 0,08%
212 01D000166 Poland
KGHM POLSKA MIEDŹ S.A., Huta
Miedzi LEGNICA 5.(d) 88,00 0,20%
81710 100005858 Portugal Maxit, Argilas Expandidas, S.A. 5.(a) 86,00 0,20%
6639 1380-60-001 Sweden
Avfallskraftvärmeverket
Kristinehed 5.(b) 83,00 0,19%
81835 100003383 Portugal Enviroil- Resíduos e Energia, Lda 5.(a) 238,00 1,25%
65641 W001 Belgium ICDI sc - Usine d'incineration 5.(b) 152,00 0,80%
5734 10063 Netherlands AVR NV (Rijnmond) 5.(b) 42,70 0,23%
218 01D000268 Poland PCC Rokita SA 5.(g) 106,00 0,28%
4746 070.00750 France RECYTECH sa 5.(a) 82,30 0,22%
83187 77018511 Slovakia
A.S.A. Slovensko, spol.s.r.o., OZ
Žilina 5.(a) 68,80 0,18%
68311 065.00370 France COVED S.A. 5.(d) 722.000.000 23,31%
6888 1516 Spain
CENTRO DE ELIMINACION DE
RESIDUOS "CER" 5.(c) 21.400.000 0,69%
82648 RO6CJ_512 Romania
SC SALPREST RAMPA SA CLUJ-
NAPOCA - Rampa de deseuri Pata
Rat 5.(d) 17.700.000 0,57%
81969 100005294 Portugal Aterro de Palmela 5.(d) 2.580.000 0,48%
13013 EW_EA-1089
United
Kingdom
Esso Petroleum Company Ltd ,
Fawley Refinery 5.(a) 2.010.000 0,37%
79022 1503.0029.01 Norway GC Rieber Oils AS 5.(e) 342.000 0,06%
Other pollutants
1,1,1-
trichloroethane
65907 13000051 Bulgaria depo za tvardi bitovi otpadatsi 5.(f) 2.680.000 97,31%
Asbestos
70476
06-04-11/
2013754/1/0 Germany
ANO Abfallbehandlung Nord
GmbH 5.(b) 2,00 100,00%
PCDD + PCDF
(dioxins + furans)
(as Teq) 81722 100001395 Portugal
Ambimed - Unidade de
Tratamento de Resíduos
Hospitalares do Barreiro 5.(a) 7,00 77,09%
Toluene
88849 WA_6435_2007
United
Kingdom Culmore WWTWs 5.(f) 7.900,00 30,28%
Non-methane
volatile organic
compounds
(NMVOC)
Ammonia (NH3)
Arsenic and
compounds (as
As)
Cadmium and
compounds (as
Cd)
Mercury and
compounds (as
Hg)
Methane (CH4)
Note: Contributions of over 50 % to the total E-PRTR emissions are highlighted in red, those over 2 % are highlighted in blue.

54/162 E-PRTR data review 2009 ETC/ACC - ETC/SCP - ETC/W
B.6.6 Paper and Wood Production and Processing (E-PRTR Activity 6)
In general, the share of the releases of the top three E-PRTR 2008 facilities in Paper and wood
production does not exceed 1 % (Table B.15). No data anomalies have been identified for this E-PRTR
activity.
Table B.15 Facilities with the highest releases to air of selected pollutants reported in Activity 6 – Paper and wood production under E-PRTR 2008
Pollutant Facility ID National ID Country Facility Name
Main
Activity
Total Quantity
kg/a
All
countries
share
5099 0861-101 Sweden Södra Cell Mönsterås 6.(a) 202.000 0,08%
7756 2180-103 Sweden Korsnäsverken 6.(b) 200.000 0,07%
7189 1764-101 Sweden Gruvöns bruk 6.(a) 200.000 0,07%
67082 1254 Finland Stora Enso Oyj, Imatran tehtaat 6.(a) 2.900.000.000 0,15%
5099 0861-101 Sweden Södra Cell Mönsterås 6.(a) 2.170.000.000 0,11%
7924 2284-108 Sweden M-real Sverige AB, Husums fabrik 6.(a) 1.850.000.000 0,09%
73894
03-02-
02221253020 Germany
Drewsen Spezialpapiere GmbH&Co.
KG Papierfabrik 6.(b) 30.800.000 1,10%
67082 1254 Finland Stora Enso Oyj, Imatran tehtaat 6.(a) 1.940.000 0,07%
6221 11G000163 Poland
INTERNATIONAL PAPER - KWIDZYN
SP. Z O.O. 6.(b) 1.920.000 0,07%
67082 1254 Finland Stora Enso Oyj, Imatran tehtaat 6.(a) 4.860.000 0,90%
7924 2284-108 Sweden M-real Sverige AB, Husums fabrik 6.(a) 1.120.000 0,21%
5099 0861-101 Sweden Södra Cell Mönsterås 6.(a) 1.090.000 0,20%
6221 11G000163 Poland
INTERNATIONAL PAPER - KWIDZYN
SP. Z O.O. 6.(b) 3.800.000 0,09%
14532 Scotland-62
United
Kingdom Markinch Papermill 6.(b) 2.010.000 0,05%
85909 3 Switzerland Borregaard Schweiz AG 6.(a) 1.270.000 0,03%
Ammonia (NH3)
Carbon dioxide
(CO2)
Nitrogen oxides
(NOx/NO2)
Non-methane
volatile organic
compounds
(NMVOC)
Sulphur oxides
(SOx/SO2)
B.6.7 Intensive livestock production and aquaculture (E-PRTR Activity 7)
The share of the NH3 releases of the top three E-PRTR 2007 facilities in Intensive livestock production
and aquaculture range from as low as 0.3 % for the third biggest polluter to as much as 21.4 % reported
for a facility in Italy. The share of the top three facilities reporting N2O lies in the range of 0.9 % to
13.2 % (Table B.16).
Table B.16 Facilities with the highest releases to air of selected pollutants reported in Activity 7 - Intensive livestock production and aquaculture under E-PRTR 2008
Pollutant Facility ID National ID Country Facility Name
Main
Activity
Total Quantity
kg/a
All
countries
share
77916 2008000717 Italy IPPC - Allevamento suini 7.(a) 57.100.000 21,38%
85091 4507 Spain SELECCIONES AGROPECUARIAS, S.L. 7.(a).(i i i) 22.700.000 8,50%
65813 13000008 Bulgaria ploshtadka s.Rupkite 7.(a).(i) 735.000 0,28%
81024 01D001427 Poland
FERMY DROBIU WOŹNIAK Sp. z
o.o.,Fermy drobiu w Gądkowie 7.(a) 19.600.000 13,17%
80890 01D001426 Poland
FERMY DROBIU WOŹNIAK Sp. z o.o.,
Fermy drobiu w Bielanach 7.(a) 12.000.000 8,06%
8048 2414 Spain PROCOBER, S.A. 7.(a).(i) 1.290.000 0,87%
Ammonia
(NH3)
Nitrous oxide
(N2O)
Note: Contributions of over 2 % to the total E-PRTR emissions are highlighted in blue.

ETC/ACC - ETC/SCP - ETC/W E-PRTR Review 2009 55/162
B.6.8 Animal and vegetable products from the food and beverage sector (E-PRTR Activity 8)
In general, the share of the releases of the top three E-PRTR 2008 facilities in Animal and vegetable
products from the food and beverage sector does not exceed 0.5 %. The maximum share is 1.5 % for
Hydrofluorcarbons (HCFCs). Therefore, no table of the top polluting facilities is provided for this E-PRTR
Activity.
B.6.9 Other activities (E-PRTR Activity 9)
In general, the share of the releases of the top three E-PRTR 2008 facilities in Other activities does not
exceed 1.5 % (Table B.17). However, the review identified one facility with a share of 100 % for
Benzo(g,h,i)perylene in the Netherlands and top polluting facilities with a share above 20 % for the
pollutants Hydrogen cyanide (HCN), Toluene and Trichloroethylene.
Table B.17 Facilities with the highest releases to air of selected pollutants reported in Activity 9 – Other activities under E-PRTR 2008
Pollutant Facility ID National ID Country Facility Name
Main
Activity
Total
Quantity
kg/a
All
countries
share
85063 7614 Spain HEXCEL FIBERS S.L. 9.(d) 43.400 24,18%
14461 Scotland-150 United Kingdom Carbon Fibers Plant 9.(d) 5.470 3,05%
65723
vl0033685600
0167 Belgium
DE WITTE-LIETAER
INDUSTRIES 9.(a) 266 0,15%
Benzo(g,h,i)
perylene 6020 10928 Netherlands
Aluminium & Chemie
Rotterdam BV 9.(d) 23 100,00%
Toluene 88663 P0118/06A United Kingdom 3M (UK) PLC 9.(c) 12.300 47,14%
13432 EW_EA-247 United Kingdom
Allunna Tubes Limited,
ALUnna Tubes Limited 9.(c) 236.000 21,70%
5336 100.04249 France HUTCHINSON SNC 9.(c) 23.300 2,14%
9548 44162 Netherlands Vlisco Helmond BV 9.(a) 18.300 1,68%
Hydrogen
cyanide (HCN)
Trichloroethyl
ene
Note: Contributions of over 50 % to the total E-PRTR emissions are highlighted in red, those over 2 % are highlighted in blue.

56/162 E-PRTR data review 2009 ETC/ACC - ETC/SCP - ETC/W
C Stage 2 Review – AIR - Comparisons with other data on releases to air
The purpose of these tests is to put the data reported under E-PRTR into context and assess the
comparability of reported E-PRTR data with other data officially reported by countries. Emissions
reported under E-PRTR have been compared with emissions reported by countries under CLRTAP/NECD
and under UNFCCC/EU MM. However, not all pollutants which are covered by E-PRTR are included
under CLRTAP/UNFCCC. Also the direct comparison of these emissions is impossible because the
structure of reported data under E-PRTR and both Conventions differs significantly. The national
emission inventories are reported in source categories30, whereas the E-PRTR system identifies
individual facilities. Each individual facility might include several activities, which are in national
inventories reported under different categories.
The reporting obligations under E-PRTR and the EU ETS overlap for CO2 emissions. However, the
capacity for combustion installations is 50 MW under E-PRTR and 20 MW under the ETS. In addition, the
boundaries of an installation under E-PRTR do not always fully match the boundaries of the
corresponding ETS installation. These differences constitute limitations when comparing E-PRTR to EU
ETS data. Another difference between the two reporting obligations is that for the purposes of the EU
ETS CO2 emissions are reported excluding biomass emissions whereas under E-PRTR total CO2 including
emissions from biomass has to be reported.
To enable comparisons data reported under different obligations sectors/activities have been
aggregated and these aggregated sectors have been linked. Afterwards, three types of comparisons
could be performed:
a. Comparison of E-PRTR national totals with totals of EU ETS (CO2)
b. Comparison of E-PRTR emissions per country with national totals reported under CLRTAP/ NECD
directive (NOx, SO2, NMVOC, NH3 ,CO, PM10, POPs, HMs) and with national totals reported under
UNFCCC/EU MM (CO2, CH4, N2O, F-gases)
c. Comparison of E-PRTR emissions reported per aggregated activity with (aggregated) sectoral
emissions reported under CLRTAP and UNFCCC (NOx, SO2, NMVOC, NH3 ,CO, PM10, POPs, HMs, CO2,
CH4, N2O, F-gases)
CLRTAP emissions and UNFCCC emissions used in this report have been provided by EEA31 (ETC/ACC
database, task 1.2.1.1 and task 1.4.1.1). The EU ETS emissions have been downloaded from the
Community Independent Transaction Log (CITL)32.
The overview of differences in national total emissions reported under E-PRTR 2008 and
CLRTAP/UNFCCC 2008 is presented in Table C.1 and Table C.2. These two tables show:
d. Eleven countries33 (2 more than in the previous year) did not report emissions to air under CLRTAP
2008 (particularly HMs and POPs) but they report these emissions under E-PRTR 2008.
30 Most disaggregated level in CLRTAP/UNFCCC is the one where emissions are calculated 31 Inventories as submitted by countries can be downloaded from: http://cdr.eionet.europa.eu/,
http://rod.eionet.europa.eu/obligations/357/deliveries and http://rod.eionet.europa.eu/obligations/384/deliveries?d-4014547-p=1 32 http://ec.europa.eu/environment/ets/

ETC/ACC - ETC/SCP - ETC/W E-PRTR Review 2009 57/162
e. Twelve countries reported higher emissions under E-PRTR 2008 than their national totals reported
under CLRTAP (SOx – Bulgaria; CO – Iceland; CO2 – Finland, Iceland; HM – Germany, Netherlands,
Portugal; HCB – Belgium, Germany, PCDD/PCDF – Denmark, Iceland, Poland, Portugal, Switzerland;
PCBs – Italy, PAHs –Norway, Portugal, Iceland). In a number of cases the difference is bigger than
200 %.
f. Five countries reported higher emissions under E-PRTR 2008 than their national totals reported
under UNFCCC (PFCs – Belgium, Greece, Norway, Sweden, UK).
g. In most of the countries SO2 and CO2 E-PRTR emissions accounted for more than 50 % (up to 90 %)
of the national total emissions. E-PRTR facilities also contribute significantly to national total
emissions of NOx and heavy metals.
h. Sources of NMVOC, NH3, CH4, and N2O seem to be in general under the E-PRTR thresholds. Share of
these E-PRTR emissions on national totals rarely exceeds 20%.
i. Reporting of POPs is rather incomplete, particularly under CLRTAP, therefore options for data
comparisons are limited. Nevertheless the results indicate inconsistencies in reporting of number of
countries.
33 Austria, Belgium, Denmark, France, Hungary, Iceland, Norway, Slovenia, Spain, Switzerland, and United Kingdom

58/162 E-PRTR data review 2009 ETC/ACC - ETC/SCP - ETC/W
Table C.1 Share of E-PRTR 2008 releases in UNFCCC/CLRTAP totals 2008 (Main pollutants, PM and GHGs)
NOx/
NO2
NM
VOC
SOx/
SO2 NH3 CO PM10 CO2 CH4 N2O SF6 HFCs PFCs
Austria 8% 1% 32% 0.2% 19% 2% 35% 5% 0.3% 0% 0% 0%
Belgium 29% 33% 73% 6% 68% 15% 44% 3% 33% 3% 32% 102%
Bulgaria 42% 3% 101% 11% 10% 30% 58% 11% 4% 0% 0% 0%
Cyprus 45% 1% 90% 38% 14% 61% 64% 3% 2% 0% 0% 0%
Czech Rep. 47% 4% 80% 11% 28% 15% 66% 0% 5% 0% 0% 0%
Denmark 19% 5% 65% 2% 1% 3% 43% 6% 1% 0% 0% 0%
Estonia 36% 6% 89% 5% 10% 21% 73% 7% 5% 0% 0% 0%
Finland 37% 10% 63% 6% 23% 5% 104% 18% 25% 0% 0% 0%
France 17% 7% 80% 2% 5% 1% 36% 33% 8% 23% 3% 52%
Germany 27% 4% 53% 3% 26% 6% 55% 14% 10% 3% 1% 44%
Greece 45% 2% 83% 0.4% 7% 0% 62% 8% 8% 0% 0% 100%
Hungary 15% 1% 18% 16% 6% 1% 47% 1% 0% 0% 0% 0%
Iceland 0% 0% 16% EPRTR 165% EPRTR 145% 21% 11% 0% 0% 71%
Ireland 32% 2% 69% 1% 2% 5% 41% 6% 2% 51% 1% 99%
Italy 9% 1% 18% 17% 9% 2% 18% 11% 0.4% 8% 0.1% 0%
Latvia 10% 0.3% 23% 3% 0% 6% 7% 0% 1% 0% 0% 0%
Lithuania 12% 16% 50% 13% 3% 8% 42% 4% 30% 0% 0% 0%
Luxembourg 0% 0% 0% 0% 0% 0% 18% 8% 0% 0% 0% 0%
Malta 49% 0% 64% 0% 0% 36% 76% 39% 0% 0% 0% 0%
Netherlands 21% 11% 85% 2% 25% 6% 51% 5% 10% 0% 5% 69%
Norway 9% 10% 58% 3% 1% 10% 29% 3% 25% 0% 0.1% 100%
Poland 37% 2% 57% 3% 10% 12% 59% 30% 46% 0% 1% 64%
Portugal 29% 6% 64% 15% 8% 4% 48% 11% 14% 0% 0.02% 0%
Romania 41% 4% 88% 13% 8% 19% 59% 9% 8% 0% 0% 2%
Slovakia 34% 5% 90% 3% 52% 0% 62% 2% 0% 0% 0% 0%
Slovenia 28% 8% 63% 4% 12% 3% 44% 20% 3% 0% 1% 100%
Spain 31% 8% 60% 18% 17% 13% 44% 11% 12% 0% 3% 50%
Sweden 19% 14% 49% 5% 8% 10% 95% 7% 8% 32% 1% 117%
Switzerland 6% 2% 22% 0% 3% 0% 16% 0% 3% 12% 0% 0%
UK 31% 15% 74% 5% 12% 12% 48% 23% 13% 14% EPRTR 179%
All countries 25% 6% 59% 7% 18% 10% 53% 11% 10% 5% 2% 38%
Country
Other GHGs
E-PRTR Data reported under E-PRTR but not under CLRTAP/UNFCCC
0% No data reported under E-PRTR (and under CLRTAP/UNFCCC).
25% Neutral/unsuspicious: E-PRTR total contributes between > 0% and 50 % to protocol total.
75% Significant: E-PRTR total contributes between 50 and 100 % to protocol total.
150% Outlier: E-PRTR total is greater than CLRTAP/UNFCCC total

ETC/ACC - ETC/SCP - ETC/W E-PRTR Review 2009 59/162
Table C.2 Share of E-PRTR 2007 on UNFCCC/CLRTAP totals 2008 (Heavy meatls and POPs)
As Cd Pb Hg Ni Cr Cu Zn HCB HCH
PCDD +
PCDF PCBs PAHs
Austria 0% 0% 9% 21% EPRTR EPRTR 0% EPRTR 0% 0% 0% 0% 0%
Belgium 58% 76% 93% 45% 46% 74% 27% 84% 6222% 0% 47% EPRTR 11%
Bulgaria 6% 27% 8% 10% 2% 24% 5% 11% 0% 0% 0% 0% 0%
Cyprus 91% 57% 0% 92% 86% 0% 3% 73% 0% 0% 0% 0% 0%
Czech Rep. 74% 83% 66% 92% 63% 8% 36% 11% 0% 0% 54% 0% 11%
Denmark 17% 0% 0% 38% 6% 0% 0% 10% 0% 0% 138% EPRTR 0%
Estonia 98% 84% 90% 91% 84% 92% 51% 88% 0% 0% 0% 0% 0%
Finland 21% 13% 7% 50% 29% 44% 3% 13% 40% 0% 31% 5% 3%
France 59% 57% 46% 76% 64% 53% 9% 80% EPRTR 0% 35% 0% 42%
Germany 94% 42% 58% 195% 15% 46% 1% 5% 11011% 0% 81% 27% 3%
Greece 0% 0% 0% 0% 0% 0% 0% 0% 0% 0% EPRTR 0% 0%
Hungary 1% 0% 8% 9% 2% 2% 88% 2% 0% 0% 10% EPRTR 2%
Iceland EPRTR 0% 0% 0% 0% 0% 0% 0% 0% 0% 11326% 0% 1040%
Ireland 3% 4% 1% 5% 5% 2% 0% 4% 0% 0% 9% 0% 31%
Italy 1% 2% 6% 2% 7% 2% 1% 5% 0% 0% 32% 15584% 1%
Latvia 0% 0% 0% 0% 0% 0% 0% 0% 0% 0% 0% 0% 0%
Lithuania 0% 0% 0% 0% 1% 0% 4% 0% 0% 0% 0% 0% 0%
Luxembourg 0% 0% 0% 0% 0% 0% 0% 0% 0% 0% EPRTR 0% 0%
Malta 38% 6% 0% 0% 29% 0% 0% 271% 0% 0% 0% 0% 0%
Netherlands 40% 94% 59% 58% 89% 47% 2% 41% 0% 0% 20% 0% 2%
Norway 29% 19% 36% 20% EPRTR 14% 11% EPRTR 0% 0% 0% EPRTR 453%
Poland 7% 3% 8% 35% 4% 19% 8% 7% 0% 0% 231% 0% 43%
Portugal 48% 56% 16% 41% 55% 35% 23% 129% 0% 0% 77703% 0% 143%
Romania 0% 3% 9% 22% 5% 5% 0% 52% 0% 0% 53% 0% 0%
Slovakia 10% 2% 50% 23% 13% 20% 16% 14% 0% 0% 0% 0% 0%
Slovenia EPRTR 0% 6% 2% EPRTR EPRTR EPRTR EPRTR 0% 0% 5% 0% 1%
Spain 26% 12% 15% 35% 31% 23% 7% 22% 6% 0% 32% EPRTR 13%
Sweden 61% 12% 31% 20% 18% 81% 3% 15% 0% 0% 13% 0% 37%
Switzerland EPRTR 1% 13% 30% EPRTR 0% 0% EPRTR 0% 0% 870% EPRTR 35%
UK 10% 16% 56% 50% 54% 28% 17% 16% 0% 0% 12% 1% 12%
All countries 26% 22% 23% 35% 24% 21% 11% 32% 576% 0% 3023% 521% 63%
Country
HM POPS
E-PRTR Data reported under E-PRTR but not under CLRTAP/UNFCCC
0% No data reported under E-PRTR (and under CLRTAP/UNFCCC).
25% Neutral/unsuspicious: E-PRTR total contributes between > 0% and 50 % to protocol total.
75% Significant: E-PRTR total contributes between 50 and 100 % to protocol total.
150% Outlier: E-PRTR total is greater than CLRTAP/UNFCCC total

60/162 E-PRTR data review 2009 ETC/ACC - ETC/SCP - ETC/W
C.1 Comparison of E-PRTR CO2 releases with emissions included in the EU ETS
A comparison of total CO2 releases reported under E-PRTR with emissions reported under the EU ETS
provides interesting information (Figure C.1, Figure C.3 and Figure C.4). The assessment of the results is
however limited by the different definition of sectors (EU ETS) and activities (E-PRTR) (see Table C.3).
Boundaries of facilities/installations differ under E-PRTR and ETS, capacity for combustion
facilities/installations is 50 MW under E-PRTR and 20 MW under the ETS reporting. In addition, the E-
PRTR reporting obligation requires CO2 to be reported including releases from biomass whereas under
the EU ETS only CO2 emissions from fossil fuels have to be reported. A more detailed comparison (on the
activity level) of CO2 emissions is provided in stage 1 Excel files submitted to countries.
Table C.3 Sectors included in comparison of ETS and E-PRTR CO2 emissions
EU ETS sector
EU ETS sector description (Annex I)
E-PRTR activity codes
Description
1 Combustion installations 1.(c) Thermal power stations and other combustion installations
2 Mineral oil refineries 1.(a) Mineral oil and gas refineries
3 Coke ovens 1.(d) Coke ovens
4 Metal ore roasting or sintering installations
2.(a) Metal ore (including sulphide ore) roasting or sintering installations
5 Production of pig iron or steel 2.(b) Installations for the production of pig iron or steel (primary or secondary melting) including continuous casting
6 Production of cement clinker or lime
3.(c) Installations for the production of: Cement clinker in rotary kilns + Lime in rotary kilns + Cement clinker or lime in other furnaces
7 Manufacture of glass including glass fibre
3.(e) Installations for the manufacture of glass, including glass fibre
8 Manufacture of ceramic products by firing
3.(g) Installations for the manufacture of ceramic products by firing, in particular roofing tiles, bricks, refractory bricks, tiles, stoneware or porcelain
9 Production of pulp, paper and board
6.(a) + 6.(b)
Industrial plants for the production of pulp from timber or similar fibrous materials + production of paper and board and other primary wood products
99 Other activity opted-in - -
In general, the number of facilities included in E-PRTR is about five times lower than the number of
installations in the EU ETS but countries’ total CO2 emissions under both reporting obligations are
comparable. For most of the countries the share of E-PRTR CO2 emissions compared to the ETS CO2
emissions is between 80 % and 97 %. Only two countries (Italy and Latvia) reported less than 40 % share
of E-PRTR emissions on EU ETS emissions. Five countries (France, Finland, Lithuania, the Netherlands
and Sweden), reported more emissions under E-PRTR than under the EU ETS.
It is the responsibility of the countries to check whether such differences between the two sets of
emission data are reasonable. One potential reason for higher E-PRTR emissions is the inclusion of
emissions from biomass combustion in the reporting. However, there is no complete information

ETC/ACC - ETC/SCP - ETC/W E-PRTR Review 2009 61/162
available for the 2008 E-PRTR dataset on which countries have reported CO2 including releases from
biomass and which ones reported CO2 excluding releases from biomass. Nine countries (Cyprus, Estonia,
Malta, Netherlands, Norway, Romania, Slovenia, Sweden, United Kingdom) have reported the voluntary
pollutant CO2 excluding biomass under E-PRTR 2008. For these countries there is certainty that they
have reported the mandatory pollutant CO2 as total CO2 including biomass. Consequently, for the
Netherlands, Sweden and the United Kingdom the reason for the higher E-PRTR CO2 releases compared
to the ETS CO2 emissions is very likely to be the reporting of CO2 from biomass combustion under E-
PRTR.
Figure C.1 Comparison of CO2 emissions and number of facilities reported under E-PRTR 2008 and ETS
32
66
28
5
73
24
9
81
224
387
36
37
4
20
109
2
5
7
2
82
29
136
28
57
29
7
202
90
28
250
216
302
128
13
401
378
50
600
1016
1668
139
237
105
1048
86
2
11
15
2
375
113
858
213
252
179
91
1039
770
952
0 50,000 100,000 150,000 200,000 250,000 300,000 350,000 400,000 450,000 500,000
Austria
Belgium
Bulgaria
Cyprus
Czech Republic
Denmark
Estonia
Finland
France
Germany
Greece
Hungary
Iceland
Ireland
Italy
Latvia
Liechtenstein
Lithuania
Luxembourg
Malta
Netherlands
Norway
Poland
Portugal
Romania
Slovakia
Slovenia
Spain
Sweden
Switzerland
United Kingdom
Gg
E-PRTR CO2 emissions (2008) ETS CO2 emissions 2008
Notes: Iceland did not report CO2 emissions under the EU ETS (Emissions Trading Scheme) and Switzerland is not included in EU ETS in 2008. Liechtenstein did not report CO2 emissions under E-PRTR 2008.
Numbers in green and blue indicate how many facilities were reported under E-PRTR 2008 and EU ETS 2008 respectively.
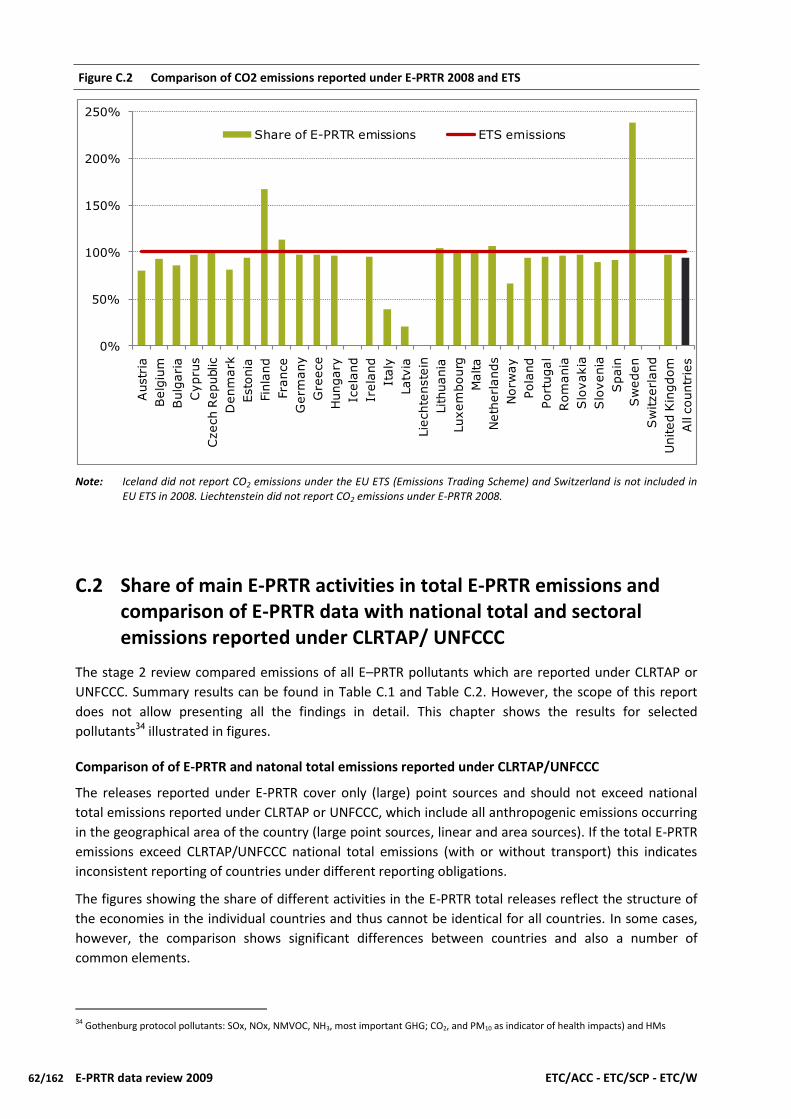
62/162 E-PRTR data review 2009 ETC/ACC - ETC/SCP - ETC/W
Figure C.2 Comparison of CO2 emissions reported under E-PRTR 2008 and ETS
0%
50%
100%
150%
200%
250%
Austr
ia
Belg
ium
Bulg
ari
a
Cypru
s
Czech R
epublic
Denm
ark
Esto
nia
Fin
land
Fra
nce
Germ
any
Gre
ece
Hungary
Icela
nd
Irela
nd
Italy
Latv
ia
Lie
chte
nste
in
Lithuania
Luxem
bourg
Malta
Neth
erl
ands
Norw
ay
Pola
nd
Port
ugal
Rom
ania
Slo
vakia
Slo
venia
Spain
Sw
eden
Sw
itzerl
and
United K
ingdom
All c
ountr
ies
Share of E-PRTR emissions ETS emissions
Note: Iceland did not report CO2 emissions under the EU ETS (Emissions Trading Scheme) and Switzerland is not included in EU ETS in 2008. Liechtenstein did not report CO2 emissions under E-PRTR 2008.
C.2 Share of main E-PRTR activities in total E-PRTR emissions and comparison of E-PRTR data with national total and sectoral emissions reported under CLRTAP/ UNFCCC
The stage 2 review compared emissions of all E–PRTR pollutants which are reported under CLRTAP or
UNFCCC. Summary results can be found in Table C.1 and Table C.2. However, the scope of this report
does not allow presenting all the findings in detail. This chapter shows the results for selected
pollutants34 illustrated in figures.
Comparison of of E-PRTR and natonal total emissions reported under CLRTAP/UNFCCC
The releases reported under E-PRTR cover only (large) point sources and should not exceed national
total emissions reported under CLRTAP or UNFCCC, which include all anthropogenic emissions occurring
in the geographical area of the country (large point sources, linear and area sources). If the total E-PRTR
emissions exceed CLRTAP/UNFCCC national total emissions (with or without transport) this indicates
inconsistent reporting of countries under different reporting obligations.
The figures showing the share of different activities in the E-PRTR total releases reflect the structure of
the economies in the individual countries and thus cannot be identical for all countries. In some cases,
however, the comparison shows significant differences between countries and also a number of
common elements.
34 Gothenburg protocol pollutants: SOx, NOx, NMVOC, NH3, most important GHG; CO2, and PM10 as indicator of health impacts) and HMs

ETC/ACC - ETC/SCP - ETC/W E-PRTR Review 2009 63/162
Comparison of aggregated sectoral data of E-PRTR and CLRTAP
The comparison of sectoral data has limitations because of the differences between the reporting
obligations under E-PRTR, CLRTAP, UNFCCC and EU ETS as explained earlier in this report. It has to be
noted that a) not all E-PRTR pollutants are reported under CLRTAP/UNFCCC and b) a significant share of
E-PRTR in CLRTAP/UNFCCC was observed only in sectors A (Energy, manufacturing industries and waste
incineration) and C (Agriculture (poultry, pigs) and only for some pollutants.
A list of the aggregated E-PRTR sectors used for comparison with the national totals reported under
CLRTAP/ UNFCCC are shown in Table C.4
Table C.4 Aggregated E-PRTR sectors as used for comparison with national totals reported under CLRTAP/UNFCCC
Aggregated sector
Description E-PRTR CLRTAP/UNFCCC
A Energy, manufacturing industries and waste incineration
1 (a-f), 2 (a-f), 3(c-g) 4 (a –f), 5 (a-b), 5 (e), 6 (a-c), 8(a-c), 9 (b-e)
1A1, 1A2, 1B1, 1B2, 2A – 2G, 3A, 3B, 3C, 3D1, 3D2, 6C
B Fugitive emissions from mining 3(a), 3 (b) 1B1a, 2A7 a-d
C Agriculture (poultry, pigs) 7(a) , 7(a) i-iii 4B8, 4B9 a-d
D1 Landfills/waste disposal 5 (c), 5 (d) 6A
D2 Waste water treatment 5 (f), 5 (g) 6B
The mapping of energy and industry sectors between E-PRTR and CLRTAP/UNFCCC is difficult because
under the LRTAP/UNFCCC conventions emissions occurring in industrial processes are reported
separately from combustion emissions in the industrial sector whereas under E-PRTR all emissions
occurring in one facility are reported as sum under the main activity. To enable at least some
comparisons, combined emissions of key pollutants from energy, manufacturing industries and waste
incineration are compared (Figure C.10, For PM10 the results differ widely for individual countries. Only
four countries (Cyprus, Latvia, Malta, Romania) have a share of PM10 E-PRTR releases in sectoral
CLRTAP emissions between 80 % and 100 %; while in five countries the share accounted for less than
10 % (Figure C.18).
Figure C.18, Figure C.24). In addition, a few activities (e.g. Iron and steel, Refineries) for which the
mapping was feasible are compared at a more disaggregated level.
C.2.1 CO2
The total CO2 emissions reported by all countries under E-PRTR amount to 62 % of the sum of all
national totals (without transport) reported under UNFCCC. Finland, Iceland and Sweden reported
higher emissions under E-PRTR than national totals without transport under UNFCCC. This might
indicate inconsistent reporting at national level. While E-PRTR releases do not include sources below the
threshold such as residential heating, E-PRTR includes CO2 emissions from biomass combustion for most
countries, which might explain some of the anomalies (e.g. for Sweden). There is, however, no complete
information available which countries included CO2 from biomass combustion in E-PRTR 2008. Nine

64/162 E-PRTR data review 2009 ETC/ACC - ETC/SCP - ETC/W
countries (Cyprus, Estonia, Malta, Netherlands, Norway, Romania, Slovenia, Sweden, the United
Kingdom) have reported the voluntary pollutant CO2 excluding biomass under E-PRTR 2008. For these
countries there is certainty that they have reported the mandatory pollutant CO2 as total CO2 including
biomass.
For individual countries the total percentage of CO2 emissions accounted for is on average 73 % (minimum 12 % for Latvia, maximum 195 % for Iceland, standard deviation 37 %) (Figure C.3). This confirms that most of the CO2 emissions emitted in Europe come from large point sources.
Figure C.3 Share of E-PRTR CO2 releases in the national total reported under UNFCCC (national totals without transport)
0%
50%
100%
150%
200%
250%
Austr
ia
Belg
ium
Bulg
ari
a
Cypru
s
Czech R
epublic
Denm
ark
Esto
nia
Fin
land
Fra
nce
Germ
any
Gre
ece
Hungary
Icela
nd
Irela
nd
Italy
Latv
ia
Lie
chte
nste
in
Lithuania
Luxem
bourg
Malta
Neth
erl
ands
Norw
ay
Pola
nd
Port
ugal
Rom
ania
Slo
vakia
Slo
venia
Spain
Sw
eden
United K
ingdom
All c
ountr
ies
CO2 emissions (National total w/o transport) reported under UNFCCC
Share
of E
-PR
TRC
O2
em
issi
on
s
Note: Cyprus, Estonia, Malta, Netherlands, Norway, Romania, Slovenia, Sweden, United Kingdom included CO2 from biomass
combustion in E-PRTR 2008. Information on inclusion/non-inclusion of CO2 from biomass combustion in other countries
is not available.
Liechtenstein did not report CO2 emissions under E-PRTR 2008.
In most countries the energy sector has the highest share on total CO2 emissions reported under E-PRTR.
In Austria and Iceland Production of metals has the highest share, in Latvia and Luxembourg Mineral
industry, in Sweden Paper and wood production and in Switzerland Waste management (Figure C.4).
Iceland is the only country that did not report any CO2 emissions in the E-PRTR Energy sector.

ETC/ACC - ETC/SCP - ETC/W E-PRTR Review 2009 65/162
Figure C.4 Contribution of E-PRTR main activities to total CO2 emissions reported under E-PRTR 2008
0%
10%
20%
30%
40%
50%
60%
70%
80%
90%
100%
Austr
ia
Belg
ium
Bulg
ari
a
Cypru
s
Czech R
epublic
Denm
ark
Esto
nia
Fin
land
Fra
nce
Germ
any
Gre
ece
Hungary
Icela
nd
Irela
nd
Italy
Latv
ia
Lie
chte
nste
in
Lithuania
Luxem
bourg
Malta
Neth
erl
ands
Norw
ay
Pola
nd
Port
ugal
Rom
ania
Slo
vakia
Slo
venia
Spain
Sw
eden
Sw
itzerl
and
United K
ingdom
All c
ountr
ies
CO
2em
issio
ns %
(E-P
RTR 2
008)
Other activities
Food/ beverage production
Paper and wood production
Waste management
Chemical Industry
Mineral Industry
Production of metals
Energy
Note: Liechtenstein did not report CO2 emissions under E-PRTR 2008.
C.2.2 SO2
The total SO2 emissions reported by all countries under E-PRTR amount to 73 % of the sum of all
national totals (without transport) reported under CLRTAP (Figure C.5). The results in Figure C.5 confirm
that large facilities (e.g. power plants) are the main source of SO2 emissions in Europe. The five facilities
with the highest SO2 releases under E-PRTR contributed altogether 23 % of total E-PRTR releases for SO2
(Table B.6). For individual countries the total percentage of SO2 emissions reported under E-PRTR is on
average 63 % of the national CLRTAP total (minimum 18 % for Hungary, maximum 106 % for Bulgaria,
standard deviation 28 %), with 11 countries reporting more than 80 % of SO2 releases occurring in E-
PRTR.
As indicated in the introduction, E-PRTR emissions should not exceed national total emissions, therefore
the 106 % E-PRTR share of Bulgaria should be further investigated and a revision of either the CLRTAP or
E-PRTR dataset should be considered by the country. Rather low E-PRTR shares compared to the
average share of 63 % should be checked by the countries concerned (Austria, Hungary, Iceland, Italy,
Latvia, Switzerland).
The main source of SO2 emissions is Energy, followed by Production of metals and Mineral industry
(Figure C.6). Sweden and Switzerland reported a significant share of SO2 emissions from Paper and wood
production.

66/162 E-PRTR data review 2009 ETC/ACC - ETC/SCP - ETC/W
Figure C.5 Share of E-PRTR SO2 releases in the national total reported under CLRTAP (total of all sources)
0%
20%
40%
60%
80%
100%
120%
Austr
ia
Belg
ium
Bulg
ari
a
Cypru
s
Czech R
epublic
Denm
ark
Esto
nia
Fin
land
Fra
nce
Germ
any
Gre
ece
Hungary
Icela
nd
Irela
nd
Italy
Latv
ia
Lie
chte
nste
in
Lithuania
Luxem
bourg
Malta
Neth
erl
ands
Norw
ay
Pola
nd
Port
ugal
Rom
ania
Slo
vakia
Slo
venia
Spain
Sw
eden
Sw
itzerl
and
United K
ingdom
All c
ountr
ies
Share
of E-P
RTR SO
2em
issio
ns
SO2 emissions (National total w/o transport) reported under CLRTAP
Note: Liechtenstein did not report SO2 emissions under E-PRTR 2008. Luxembourg did not submit emissions under CLRTAP
2008.
Figure C.6 Contribution of E-PRTR main activities to the total SO2 releases reported under E-PRTR 2008
0%
10%
20%
30%
40%
50%
60%
70%
80%
90%
100%
Austr
ia
Belg
ium
Bulg
ari
a
Cypru
s
Czech R
epublic
Denm
ark
Esto
nia
Fin
land
Fra
nce
Germ
any
Gre
ece
Hungary
Icela
nd
Irela
nd
Italy
Latv
ia
Lie
chte
nste
in
Lithuania
Luxem
bourg
Malta
Neth
erl
ands
Norw
ay
Pola
nd
Port
ugal
Rom
ania
Slo
vakia
Slo
venia
Spain
Sw
eden
Sw
itzerl
and
United K
ingdom
All c
ountr
ies
SO
2em
issio
ns %
(E-P
RTR 2
008)
Other activities
Food/ baverage production
Paper and wood production
Waste management
Chemical Industry
Mineral industry
Production of metals
Energy
Note: Liechtenstein did not report SO2 emissions under E-PRTR 2008.

ETC/ACC - ETC/SCP - ETC/W E-PRTR Review 2009 67/162
The comparison between SO2 emissions of the aggregated sector A with sectoral CLRTAP emissions
shows very similar results to the comparison of total SO2 E-PRTR emissions with the national total
(without transport) reported under CLRTAP. This confirms that most of the SO2 emissions occur from
combustion processes in large point sources. Fourteen countries have a share of E-PRTR releases of the
aggregated sector A in sectoral emissions reported under CLRTAP between 80 % and 100 % (Figure C.7).
Bulgaria is the only country that reported higher emissions under E-PRTR than their national total
reported under CLRTAP (107 %).
Figure C.7 Share of E-PRTR SO2 releases (Energy, manufacturing industries and waste incineration) in sectoraL emissions reported under CLRTAP
0%
20%
40%
60%
80%
100%
120%
Aus
tria
Bel
gium
Bul
gari
a
Cypr
us
Czec
h R
epub
lic
Den
mar
k
Esto
nia
Finl
and
Fran
ce
Ger
man
y
Gre
ece
Hun
gary
Icel
and
Irel
and
Ital
y
Latv
ia
Lith
uani
a
Mal
ta
Net
herl
ands
Nor
way
Pola
nd
Port
ugal
Rom
ania
Slov
akia
Slov
enia
Spai
n
Swed
en
Swit
zerl
and
Uni
ted
King
dom
All
coun
trie
s
Shar
e o
f E-
PR
TR S
O2
em
issi
on
s
SO2
Share of E-
PRTR
CLRTAP emissions
Note: Liechtenstein did not report SO2 emissions under E-PRTR 2008.
C.2.3 NOx
The share of E-PRTR releases in the national total is significant for NOx – the total percentage of NOx
emissions accounted for in E-PRTR reporting for all countries is 67 % of the national total without
transport reported under CLRTAP (Figure C.8). For individual countries the total percentage of NOx
emissions accounted for is on average 57 % (minimum 14 % for Switzerland, maximum 99 % for Malta,
standard deviation 23 %).
The very high share of E-PRTR NOx releases of Cyprus and Malta may indicate that transport emissions
under CLRTAP are overestimated and/or national total emissions are underestimated and/or E-PRTR
releases are incorrect. On the other hand some countries have a very low share of E-PRTR NOx emissions
(Austria, Italy, Latvia, Norway, Switzerland). This indicates possible underreporting and should be
checked by the countries concerned.
E-PRTR NOx releases mainly stem from Energy, followed by Mineral industry, Production of metals,
Paper and wood processing and Chemical industry. As expected the share of Energy in E-PRTR NOx
releases is lower than the share of Energy in SO2 E-PRTR releases (compare Figure C.9).

68/162 E-PRTR data review 2009 ETC/ACC - ETC/SCP - ETC/W
Figure C.8 Share of E-PRTR NOx releases in the national total reported under CLRTAP (national total without transport)
0%
20%
40%
60%
80%
100%
120%
Austr
ia
Belg
ium
Bulg
ari
a
Cypru
s
Czech R
epublic
Denm
ark
Esto
nia
Fin
land
Fra
nce
Germ
any
Gre
ece
Hungary
Icela
nd
Irela
nd
Italy
Latv
ia
Lie
chte
nste
in
Lithuania
Luxem
bourg
Malta
Neth
erl
ands
Norw
ay
Pola
nd
Port
ugal
Rom
ania
Slo
vakia
Slo
venia
Spain
Sw
eden
Sw
itzerl
and
United K
ingdom
All c
ountr
ies
Share
of E-P
RTR N
Ox
em
issio
ns
National total NOx emissions w/o transport reported under CLRTAP
Note: Iceland and Liechtenstein did not report NOx emissions under CLRTAP. Luxembourg did not submit emissions under
CLRTAP 2008.
Figure C.9 Contribution of E-PRTR main activities to the total NOx releases reported under E-PRTR 2008
0%
10%
20%
30%
40%
50%
60%
70%
80%
90%
100%
Austr
ia
Belg
ium
Bulg
ari
a
Cypru
s
Czech R
epublic
Denm
ark
Esto
nia
Fin
land
Fra
nce
Germ
any
Gre
ece
Hungary
Icela
nd
Irela
nd
Italy
Latv
ia
Lie
chte
nste
in
Lithuania
Luxem
bourg
Malta
Neth
erl
ands
Norw
ay
Pola
nd
Port
ugal
Rom
ania
Slo
vakia
Slo
venia
Spain
Sw
eden
Sw
itzerl
and
United K
ingdom
All c
ountr
ies
NO
x e
mis
sio
ns %
(E-P
RTR 2
008)
Other activities
Food/ baverage production
Paper and wood production
Waste management
Chemical Industry
Mineral industry
Production of metals
Energy

ETC/ACC - ETC/SCP - ETC/W E-PRTR Review 2009 69/162
In 15 countries the share of NOx E-PRTR aggregated sector A releases in sectoral emissions reported
under CLRTAP is between 80 % and 100 % (Figure C.10). In Malta E-PRTR NOx releases account for 102 %
of the national total reported under CLRTAP.
Figure C.10 Share of E-PRTR NOx releases (Energy, manufacturing industries and waste incineration) in sectoral emissions reported under CLRTAP
0%
20%
40%
60%
80%
100%
120%
Aus
tria
Bel
giu
m
Bu
lgar
ia
Cypr
us
Cze
ch R
epu
blic
Den
mar
k
Esto
nia
Fin
lan
d
Fran
ce
Ger
man
y
Gre
ece
Hun
gary
Irel
and
Ital
y
Latv
ia
Lith
uan
ia
Mal
ta
Net
her
lan
ds
Nor
way
Pola
nd
Port
ugal
Rom
ania
Slov
akia
Slov
enia
Spai
n
Swed
en
Swit
zerl
and
Uni
ted
King
dom
All
Coun
trie
s
Shar
e o
f E-
PR
TR N
Ox
em
issi
on
s
NOx
Share of E-PRTR
CLRTAP emissions
Note: Iceland and Liechtenstein and Luxembourg did not report NOx emissions for Energy sector under E-PRTR 2008.
C.2.4 NMVOC
The total percentage of NMVOC emissions accounted for in E-PRTR reporting for all countries is 8 % of
the national total reported under CLRTAP (Figure C.11). For individual countries the total percentage of
NMVOC emissions accounted for is on average 9 % (minimum 0.3 % for Latvia, maximum 38 % for
Belgium, standard deviation 8 %). This finding is consistent with the results of the CLRTAP key category
analyses indicating that in general NMVOC emissions are occurring from a number of (small) area
(diffuse) sources35 like residential heating and domestic solvent and other product use.
Figure C.12 shows that Energy and Other activities are the most important activities for NMVOC releases
under E-PRTR. Belgium, Czech Republic and Luxembourg, also report significant NMVOC emissions from
Production of metals, while in Cyprus relevant NMVOC emissions only occur in Mineral industry.
35 See results of KCA analyses in CEIP &EEA report; Inventory Review 2009. http://www.ceip.at/review-process/review-2009/

70/162 E-PRTR data review 2009 ETC/ACC - ETC/SCP - ETC/W
Figure C.11 Share of E-PRTR NMVOC emissions in the national total reported under CLRTAP (national total without transport)
0.3
%
0%
20%
40%
60%
80%
100%
Austr
ia
Belg
ium
Bulg
ari
a
Cypru
s
Czech R
epublic
Denm
ark
Esto
nia
Fin
land
Fra
nce
Germ
any
Gre
ece
Hungary
Icela
nd
Irela
nd
Italy
Latv
ia
Lie
chte
nste
in
Lithuania
Luxem
bourg
Malta
Neth
erl
ands
Norw
ay
Pola
nd
Port
ugal
Rom
ania
Slo
vakia
Slo
venia
Spain
Sw
eden
Sw
itzerl
and
United K
ingdom
All c
ountr
ies
Share
of E-P
RTR
NM
VO
C e
mis
sio
ns
NMVOC emissions (National total w/o transport) reported under CLRTAP
Note: Iceland, Liechtenstein and Malta did not report NMVOC emissions under E-PRTR 2008. Luxembourg did not submit
emissions under CLRTAP 2008.
Figure C.12 Contribution of E-PRTR main activities to the total NMVOC releases reported under E-PRTR 2008
0%
10%
20%
30%
40%
50%
60%
70%
80%
90%
100%
Austr
ia
Belg
ium
Bulg
ari
a
Cypru
s
Czech R
epublic
Denm
ark
Esto
nia
Fin
land
Fra
nce
Germ
any
Gre
ece
Hungary
Icela
nd
Irela
nd
Italy
Latv
ia
Lie
chte
nste
in
Lithuania
Luxem
bourg
Malta
Neth
erl
ands
Norw
ay
Pola
nd
Port
ugal
Rom
ania
Slo
vakia
Slo
venia
Spain
Sw
eden
Sw
itzerl
and
United K
ingdom
All c
ountr
ies
NM
VO
C e
mis
sio
ns %
(E-P
RTR 2
008)
Other activities
Food/ baverage production
Paper and wood production
Waste management
Chemical Industry
Mineral industry
Production of metals
Energy
Note: Iceland, Liechtenstein and Malta did not report NMVOC emissions under E-PRTR 2008.

ETC/ACC - ETC/SCP - ETC/W E-PRTR Review 2009 71/162
C.2.5 NH3
Figure C.13 Share of E-PRTR NH3 emissions in the national total reported under CLRTAP (national total without transport)
0.2
%
0.4
%
0.4
%
0%
20%
40%
60%
80%
100%
Austr
ia
Belg
ium
Bulg
ari
a
Cypru
s
Czech R
epublic
Denm
ark
Esto
nia
Fin
land
Fra
nce
Germ
any
Gre
ece
Hungary
Icela
nd
Irela
nd
Italy
Latv
ia
Lie
chte
nste
in
Lithuania
Luxem
bourg
Malta
Neth
erl
ands
Norw
ay
Pola
nd
Port
ugal
Rom
ania
Slo
vakia
Slo
venia
Spain
Sw
eden
Sw
itzerl
and
United K
ingdom
All c
ountr
ies
Share
of E-P
RTR
NH
3 e
mis
sions
NH3 emissions (National total w/o transport) reported under CLRTAP
Note: Liechtenstein did not report NH3 emissions under E-PRTR 2008. Luxembourg and Malta reported zero emissions. Iceland
did not report NH3 emissions under CLRTAP 2008
Figure C.14 Contribution of E-PRTR main activities to the total NH3 releases reported under E-PRTR 2008
0%
10%
20%
30%
40%
50%
60%
70%
80%
90%
100%
Austr
ia
Belg
ium
Bulg
ari
a
Cypru
s
Czech R
epublic
Denm
ark
Esto
nia
Fin
land
Fra
nce
Germ
any
Gre
ece
Hungary
Icela
nd
Irela
nd
Italy
Latv
ia
Lie
chte
nste
in
Lithuania
Luxem
bourg
Malta
Neth
erl
ands
Norw
ay
Pola
nd
Port
ugal
Rom
ania
Slo
vakia
Slo
venia
Spain
Sw
eden
Sw
itzerl
and
United K
ingdom
All c
ountr
ies
NH
3em
issio
ns
% (E-P
RTR 2
008)
Other activities
Food/ baverage production
Livestock production and aquaculture
Paper and wood production
Waste management
Chemical Industry
Mineral industry
Production of metals
Energy
Note: Liechtenstein did not report NH3 emissions under E-PRTR 2008. Luxembourg and Malta reported zero emissions.
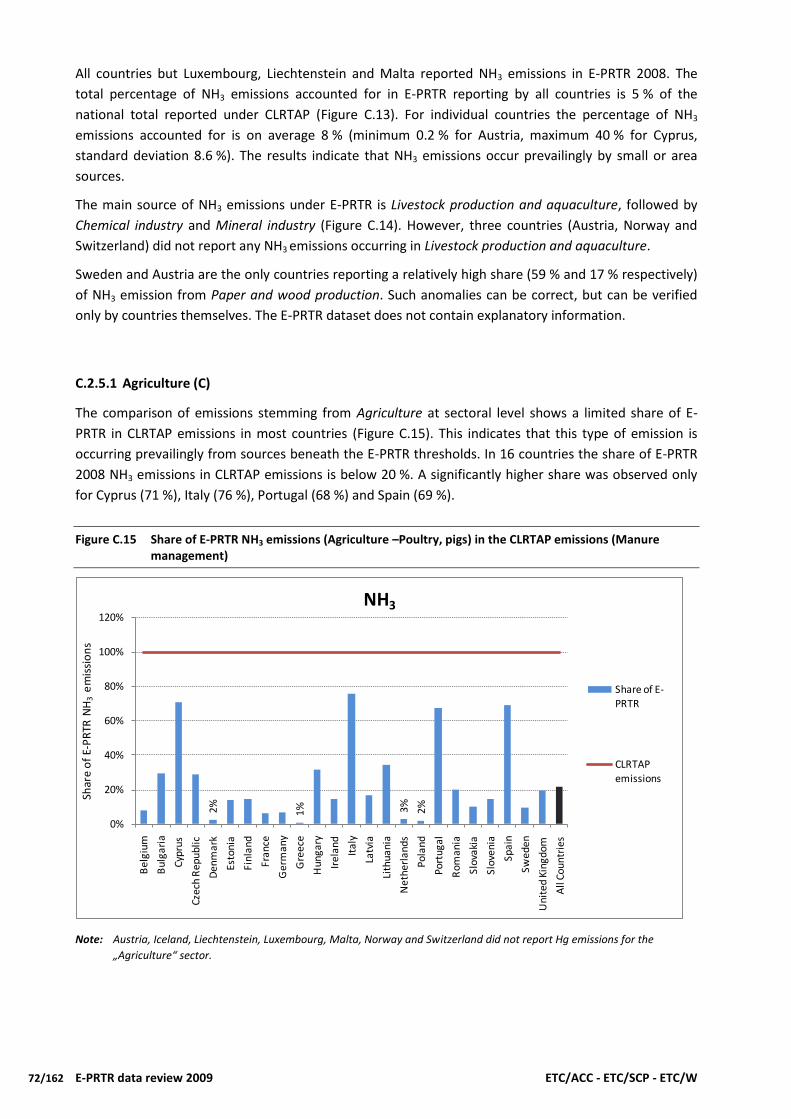
72/162 E-PRTR data review 2009 ETC/ACC - ETC/SCP - ETC/W
All countries but Luxembourg, Liechtenstein and Malta reported NH3 emissions in E-PRTR 2008. The
total percentage of NH3 emissions accounted for in E-PRTR reporting by all countries is 5 % of the
national total reported under CLRTAP (Figure C.13). For individual countries the percentage of NH3
emissions accounted for is on average 8 % (minimum 0.2 % for Austria, maximum 40 % for Cyprus,
standard deviation 8.6 %). The results indicate that NH3 emissions occur prevailingly by small or area
sources.
The main source of NH3 emissions under E-PRTR is Livestock production and aquaculture, followed by
Chemical industry and Mineral industry (Figure C.14). However, three countries (Austria, Norway and
Switzerland) did not report any NH3 emissions occurring in Livestock production and aquaculture.
Sweden and Austria are the only countries reporting a relatively high share (59 % and 17 % respectively)
of NH3 emission from Paper and wood production. Such anomalies can be correct, but can be verified
only by countries themselves. The E-PRTR dataset does not contain explanatory information.
C.2.5.1 Agriculture (C)
The comparison of emissions stemming from Agriculture at sectoral level shows a limited share of E-
PRTR in CLRTAP emissions in most countries (Figure C.15). This indicates that this type of emission is
occurring prevailingly from sources beneath the E-PRTR thresholds. In 16 countries the share of E-PRTR
2008 NH3 emissions in CLRTAP emissions is below 20 %. A significantly higher share was observed only
for Cyprus (71 %), Italy (76 %), Portugal (68 %) and Spain (69 %).
Figure C.15 Share of E-PRTR NH3 emissions (Agriculture –Poultry, pigs) in the CLRTAP emissions (Manure management)
2%
1% 3%
2%
0%
20%
40%
60%
80%
100%
120%
Be
lgiu
m
Bu
lga
ria
Cyp
rus
Cze
ch R
ep
ub
lic
De
nm
ark
Est
onia
Fin
lan
d
Fra
nce
Ge
rma
ny
Gre
ece
Hu
ng
ary
Ire
lan
d
Ita
ly
Latv
ia
Lith
ua
nia
Ne
the
rla
nd
s
Po
lan
d
Po
rtu
ga
l
Ro
ma
nia
Slo
vaki
a
Slo
ven
ia
Sp
ain
Sw
ed
en
Un
ite
d K
ing
do
m
All
Co
un
trie
s
Shar
e o
f E-
PR
TR N
H3
em
issi
on
s
NH3
Share of E-PRTR
CLRTAP emissions
Note: Austria, Iceland, Liechtenstein, Luxembourg, Malta, Norway and Switzerland did not report Hg emissions for the
„Agriculture“ sector.

ETC/ACC - ETC/SCP - ETC/W E-PRTR Review 2009 73/162
C.2.6 PM10
Figure C.16 Share of E-PRTR PM10 emissions in the national total reported under CLRTAP (national total without transport)
0%
20%
40%
60%
80%
100%
120%
Austr
ia
Belg
ium
Bulg
ari
a
Cypru
s
Czech R
epublic
Denm
ark
Esto
nia
Fin
land
Fra
nce
Germ
any
Gre
ece
Hungary
Icela
nd
Irela
nd
Italy
Latv
ia
Lie
chte
nste
in
Lithuania
Luxem
bourg
Malta
Neth
erl
ands
Norw
ay
Pola
nd
Port
ugal
Rom
ania
Slo
vakia
Slo
venia
Spain
Sw
eden
Sw
itzerl
and
United K
ingdom
All c
ountr
ies
Share
of E-P
RTR
PM
10em
issi
ons PM10 emissions (National total w/o transport) reported under CLRTAP
Note: Liechtenstein, Luxembourg and Slovakia and Switzerland did not report PM10 emissions under E-PRTR 2008. Greece and
Iceland did not report PM10 emissions under CLRTAP 2008
Figure C.17 Contribution of E-PRTR main activities to the total PM10 releases reported under E-PRTR 2008
0%
10%
20%
30%
40%
50%
60%
70%
80%
90%
100%
Austr
ia
Belg
ium
Bulg
ari
a
Cypru
s
Czech R
epublic
Denm
ark
Esto
nia
Fin
land
Fra
nce
Germ
any
Gre
ece
Hungary
Icela
nd
Irela
nd
Italy
Latv
ia
Lie
chte
nste
in
Lithuania
Luxem
bourg
Malta
Neth
erl
ands
Norw
ay
Pola
nd
Port
ugal
Rom
ania
Slo
vakia
Slo
venia
Spain
Sw
eden
Sw
itzerl
and
United K
ingdom
All c
ountr
ies
PM
10 e
mis
sio
ns %
(E-P
RTR 2
008)
Other activities
Food/ baverage production
Livestock production and aquaculture
Paper and wood production
Waste management
Chemical Industry
Mineral industry
Production of metals
Energy
Note: Liechtenstein, Luxembourg and Slovakia and Switzerland did not report PM10 emissions under E-PRTR 2008.
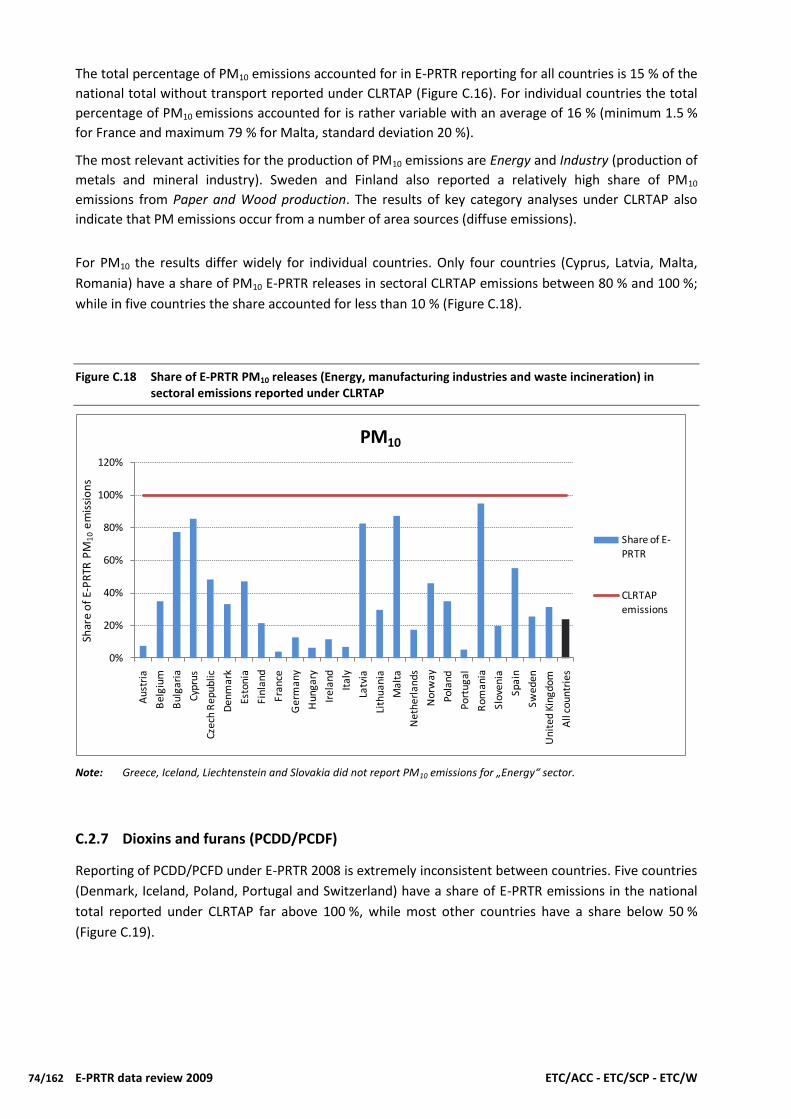
74/162 E-PRTR data review 2009 ETC/ACC - ETC/SCP - ETC/W
The total percentage of PM10 emissions accounted for in E-PRTR reporting for all countries is 15 % of the
national total without transport reported under CLRTAP (Figure C.16). For individual countries the total
percentage of PM10 emissions accounted for is rather variable with an average of 16 % (minimum 1.5 %
for France and maximum 79 % for Malta, standard deviation 20 %).
The most relevant activities for the production of PM10 emissions are Energy and Industry (production of
metals and mineral industry). Sweden and Finland also reported a relatively high share of PM10
emissions from Paper and Wood production. The results of key category analyses under CLRTAP also
indicate that PM emissions occur from a number of area sources (diffuse emissions).
For PM10 the results differ widely for individual countries. Only four countries (Cyprus, Latvia, Malta,
Romania) have a share of PM10 E-PRTR releases in sectoral CLRTAP emissions between 80 % and 100 %;
while in five countries the share accounted for less than 10 % (Figure C.18).
Figure C.18 Share of E-PRTR PM10 releases (Energy, manufacturing industries and waste incineration) in sectoral emissions reported under CLRTAP
0%
20%
40%
60%
80%
100%
120%
Au
stri
a
Be
lgiu
m
Bu
lga
ria
Cyp
rus
Cze
ch R
ep
ub
lic
Den
mar
k
Esto
nia
Fin
lan
d
Fran
ce
Ge
rma
ny
Hu
nga
ry
Ire
lan
d
Ita
ly
Latv
ia
Lith
ua
nia
Ma
lta
Ne
the
rla
nd
s
No
rwa
y
Po
lan
d
Po
rtu
ga
l
Ro
ma
nia
Slo
ven
ia
Sp
ain
Sw
eden
Un
ited
Kin
gd
om
All
co
un
trie
s
Shar
e o
f E-
PR
TR P
M1
0e
mis
sio
ns
PM10
Share of E-
PRTR
CLRTAP emissions
Note: Greece, Iceland, Liechtenstein and Slovakia did not report PM10 emissions for „Energy“ sector.
C.2.7 Dioxins and furans (PCDD/PCDF)
Reporting of PCDD/PCFD under E-PRTR 2008 is extremely inconsistent between countries. Five countries
(Denmark, Iceland, Poland, Portugal and Switzerland) have a share of E-PRTR emissions in the national
total reported under CLRTAP far above 100 %, while most other countries have a share below 50 %
(Figure C.19).

ETC/ACC - ETC/SCP - ETC/W E-PRTR Review 2009 75/162
Figure C.19 Share of E-PRTR PCDD/PCFD emissions in the national total reported under CLRTAP (national total without transport)
11574%
231%
80872%
955%
480%
0%
20%
40%
60%
80%
100%
120%
140%
160%
180%
200%
Belg
ium
Czech R
epublic
Denm
ark
Fin
land
Fra
nce
Germ
any
Hungary
Icela
nd
Irela
nd
Italy
Neth
erl
ands
Pola
nd
Port
ugal
Rom
ania
Slo
venia
Spain
Sw
eden
Sw
itzerl
and
United K
ingdom
All c
ountr
ies
PCDD/PCDF emissions (National total w/o transport) reported under CLRTAP
Share
of E-P
RTR
PCD
D/P
CD
Fem
issi
ons
Note: Austria, Bulgaria, Cyprus, Estonia, Latvia, Liechtenstein, Lithuania, Malta, Norway and Slovakia did not report
PCDD/PCFD emissions under E-PRTR 2008.
Greece, Luxembourg and Malta did not report PCDD/PCFD emissions under CLRTAP 2008.
Figure C.20 Contribution of E-PRTR main activities to the total PCDD/PCFD releases reported under E-PRTR 2008
0%
10%
20%
30%
40%
50%
60%
70%
80%
90%
100%
Belg
ium
Czech R
epublic
Denm
ark
Fin
land
Fra
nce
Germ
any
Gre
ece
Hungary
Icela
nd
Irela
nd
Italy
Luxem
bourg
Neth
erl
ands
Pola
nd
Port
ugal
Rom
ania
Slo
venia
Spain
Sw
eden
Sw
itzerl
and
United K
ingdom
All c
ountr
ies
PCD
D/P
CD
F e
mis
sio
ns %
(E-P
RTR 2
008)
Food/ beverage production
Paper and wood production
Waste management
Chemical Industry
Mineral Industry
Production of metals
Energy
Note: Austria, Bulgaria, Cyprus, Estonia, Latvia, Liechtenstein, Lithuania, Norway, Romania and Slovakia did not report
PCDD/PCFD emissions under E-PRTR 2008.

76/162 E-PRTR data review 2009 ETC/ACC - ETC/SCP - ETC/W
The most relevant activities that involve releases of PCDD/PCFD are Production of metals followed by
Waste management and Energy (Figure C.20). Ireland reported 100 % of their PCDD/PCFD emissions
from Chemical Industry and Germany reported a relatively high share of emissions from Paper and
Wood production. Poland did not report any PCDD/PCFD emissions from Production of metals although
the sector contains 241 facilities for 2008 in the E-PRTR dataset. This might indicate under-reporting and
should be checked by Poland.
It is known that PCDD/PCDF emissions occur by combustion processes, particularly by combustion of
solid fuels. The E-PRTR database does not contain information on fuel consumption in individual
facilities. In order to assess the completeness of PCDD/PCDF reporting CO2 emissions (occurring as well
by combustion of fossil fuels) are consequently selected as indicator for potential releases of
PCDD/PCDF. Fuel consumption is calculated from CO2 emissions with emission factors from EMEP/EEA
Inventory guidebook36.
C.2.7.1 Thermal power stations and other combustion installations , 1.(c)
It could be proved that all the top 20 E-PRTR CO2 emitters are coal plants. Fuel consumption used in this
comparison has been calculated from CO2 emissions by means of the default CO2-EF (110 t/TJ for brown
coal, 95 t/TJ for hard coal). Potential PCDD/PCDF emissions have been calculated with the estimated fuel
consumption and an emission factor of 10 µg/TJ (EMEP/EEA-Guidebook 2009 tier1 EF). Resulting
potential emissions of PCDD/PCFD for the top 20 E-PRTR CO2 emitting facilities range from 0.8 g to 2.8 g
and would therefore exceed the reporting threshold. This might indicate that operators underestimate
or do not estimate at all releases of PCDD/PCDF in these facilities.
Table C.5 compares PCDD/PCDF emissions in activity 1.(a) NACE 35.11, 35.30 with emissions reported
under CLRTAP NFR 1 A 1 a Public Electricity and Heat. E.g.in Austria, most of NFR category 1 A 1 a
PCDD/PCDF emissions derive from small biomass plants with emissions below the threshold. The same
may apply to other countries.
Poland and Spain reported PCDD/PCDF releases under E-PRTR that are 70 and 5 times higher,
respectively, than under CLRTAP. The Netherlands reported emissions as “not occurring” under CLRTAP
and did not report any emissions under E-PRTR although they reported about 220 PJ of coal
consumption in the CRF. It is not clear whether this amount stems from coal power plants or from the
iron and steel industry and whether this could consequently indicate a gap in reporting. Potential gaps in
reporting were also identified for Bulgaria, Germany, Estonia, Italy, Romania, Slovakia and Switzerland.
The very low PCDD/PCDF emissions reported by the Czech Republic under CLRTAP could indicate an
error in magnitude.
About 7 % (654 g) of total PCDD/PCFD E-PRTR 2008 emissions were reported from activity 1.(c). Out of
the 51 facilities that reported PCDD/PCFD releases only six plants did not report any CO2 emissions. On
the other hand, out of 940 facilities that reported CO2 emissions only 46 also reported PCDD/PCFD
emissions. Only three top 20 CO2 polluters reported PCDD/PCFD emissions which indicates a potential
gap in reporting.
Ten facilities reported more than 10 g PCDD/PCFD releases in 2008 (nine from Poland and one from
Spain) and only three facilities with relatively high PCDD/PCFD emissions were also among the top 50
CO2 emitters of activity 1.(c) (Table C.6).
36 E..g EMEP/EEA air pollutant emission inventory guidebook-2010 http://www.eea.europa.eu/publications/emep-eea-emission-
inventory-guidebook-2009

ETC/ACC - ETC/SCP - ETC/W E-PRTR Review 2009 77/162
Poland reported less than 9 g PCDD/PCFD emissions from NFR 1 A 1 a power plants under CLRTAP 2008
but 622 g under E-PRTR 2008 with only a few reports that are based on measured data. This indicates a
potential inconsistency in reporting and should be checked by the country.
Table C.5 Comparison of PCDD/PCDF emissions reported under activity 1.(a) NACE 35.11, 35.30 and under CLRTAP NFR 1 A 1 a Public Electricity and Heat
Country 1 A 1 a
[g PCDD/PCDF] E-PRTR 1.(a)
NACE 35.11, 35.30 [g PCDD/PCDF]
Share E-PRTR [%]
Austria 0,89 0,00 0%
Belgium 1,09 0,00 0%
Bulgaria 2,26 0,00 0%
Cyprus 0,13 0,00 0%
Czech Republic 0,00273 2,98 109229%
Germany 4,86 0,91 19%
Denmark 1,19 0,00 0%
Estonia 2,25 0,00 0%
Spain 2,49 13,50 543%
Finland 5,82 3,40 58%
France 2,49 0,11 4%
Hungary 12,31 0,00 0%
Ireland 0,42 0,00 0%
Italy 5,68 0,00 0%
Lithuania 0,93 0,00 0%
Latvia 0,24 0,00 0%
Netherlands 0,00 0,00 -
Norway 0,46 0,00 0%
Poland 8,79 611,09 6951%
Portugal 1,62 0,20 12%
Romania 3,23 0,20 6%
Sweden 19,81 0,11 1%
Slovenia 0,74 0,00 0%
Slovakia 1,79 0,00 0%
United Kingdom 5,66 4,15 73%
Iceland 0,55 0,00 0%
Switzerland 4,96 0,00 0%
There is no clear correlation between high PCDD/PCFD and high CO2 emissions in data reported under E-
PRTR. High PCDD/PCFD emissions may result from waste co-incineration or biomass plants without flue
gas cleaning. Due to a lack of knowledge about fuel type and flue gas cleaning technologies of individual
facilities no clear-cut conclusion about possible over- or underestimation of PCDD/PCFD emissions can
be drawn. However, PCDD/PCFD releases above 5 g from individual plants should be double-checked to
avoid overestimations.

78/162 E-PRTR data review 2009 ETC/ACC - ETC/SCP - ETC/W
Table C.6 Activity 1.(c): Top 50 CO2 emitters which reported high PCDD/PCFD emissions in E-PRTR 2008
National-ID Country Facility name Rank mio t CO2
PCDD/PCFD [g ]
07W000084 Poland Elektrownia "KOZIENICE" S.A. 15 10.00 39.00
03-01-01211092310 Germany Salzgitter Flachstahl GmbH
25 7.48 7.00
12S000298 Poland Południowy Koncer Energetyczny S.A., Elektrownia Jaworzno III - Elektrownia III
43 5.64 260.00
C.2.7.2 Installations for the production of pig iron or steel (primary or secondary melting) including continuous casting, 2.(b)
About 3 % (242 g) of PCDD/PCFD E-PRTR 2008 releases were reported from activity 2.(b). Out of 69
facilities that reported PCDD/PCFD 40 plants also reported CO2 releases. On the other hand, out of 68
facilities that reported CO2 releases 40 facilities also reported releases of PCDD/PCFD (Figure C.21).
Figure C.21 Activity 2.(b) top 150 CO2 emitters: CO2 and PCDD/PCFD releases into air
0
20
40
60
80
100
120
0
2
4
6
8
10
12
g P
CD
D/
PC
FD
mio
t C
O2
mio t CO2 g PCDD/PCFD
Six out of the top 20 CO2 emitters did not report any PCDD/PCFD releases which indicates a potential
gap in reporting (Table C.7). This affects the countries Slovakia, Austria, Romania, France and Germany.
Due to the heterogeneous production and abatement techniques of iron plants it is not possible to
assess the magnitude of the gap in reporting.
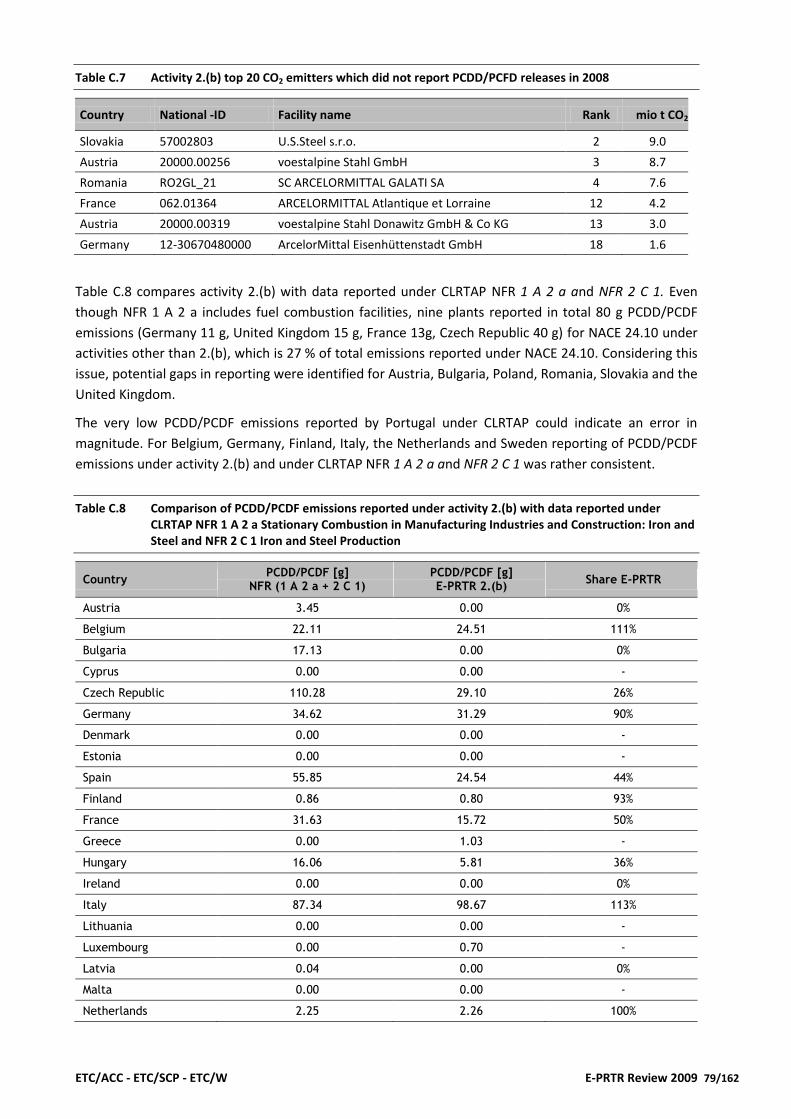
ETC/ACC - ETC/SCP - ETC/W E-PRTR Review 2009 79/162
Table C.7 Activity 2.(b) top 20 CO2 emitters which did not report PCDD/PCFD releases in 2008
Country National -ID Facility name Rank mio t CO2
Slovakia 57002803 U.S.Steel s.r.o. 2 9.0
Austria 20000.00256 voestalpine Stahl GmbH 3 8.7
Romania RO2GL_21 SC ARCELORMITTAL GALATI SA 4 7.6
France 062.01364 ARCELORMITTAL Atlantique et Lorraine 12 4.2
Austria 20000.00319 voestalpine Stahl Donawitz GmbH & Co KG 13 3.0
Germany 12-30670480000 ArcelorMittal Eisenhüttenstadt GmbH 18 1.6
Table C.8 compares activity 2.(b) with data reported under CLRTAP NFR 1 A 2 a and NFR 2 C 1. Even
though NFR 1 A 2 a includes fuel combustion facilities, nine plants reported in total 80 g PCDD/PCDF
emissions (Germany 11 g, United Kingdom 15 g, France 13g, Czech Republic 40 g) for NACE 24.10 under
activities other than 2.(b), which is 27 % of total emissions reported under NACE 24.10. Considering this
issue, potential gaps in reporting were identified for Austria, Bulgaria, Poland, Romania, Slovakia and the
United Kingdom.
The very low PCDD/PCDF emissions reported by Portugal under CLRTAP could indicate an error in
magnitude. For Belgium, Germany, Finland, Italy, the Netherlands and Sweden reporting of PCDD/PCDF
emissions under activity 2.(b) and under CLRTAP NFR 1 A 2 a and NFR 2 C 1 was rather consistent.
Table C.8 Comparison of PCDD/PCDF emissions reported under activity 2.(b) with data reported under CLRTAP NFR 1 A 2 a Stationary Combustion in Manufacturing Industries and Construction: Iron and Steel and NFR 2 C 1 Iron and Steel Production
Country PCDD/PCDF [g]
NFR (1 A 2 a + 2 C 1) PCDD/PCDF [g] E-PRTR 2.(b)
Share E-PRTR
Austria 3.45 0.00 0%
Belgium 22.11 24.51 111%
Bulgaria 17.13 0.00 0%
Cyprus 0.00 0.00 -
Czech Republic 110.28 29.10 26%
Germany 34.62 31.29 90%
Denmark 0.00 0.00 -
Estonia 0.00 0.00 -
Spain 55.85 24.54 44%
Finland 0.86 0.80 93%
France 31.63 15.72 50%
Greece 0.00 1.03 -
Hungary 16.06 5.81 36%
Ireland 0.00 0.00 0%
Italy 87.34 98.67 113%
Lithuania 0.00 0.00 -
Luxembourg 0.00 0.70 -
Latvia 0.04 0.00 0%
Malta 0.00 0.00 -
Netherlands 2.25 2.26 100%

80/162 E-PRTR data review 2009 ETC/ACC - ETC/SCP - ETC/W
Country PCDD/PCDF [g]
NFR (1 A 2 a + 2 C 1) PCDD/PCDF [g] E-PRTR 2.(b)
Share E-PRTR
Norway 1.21 0.00 0%
Poland 22.17 0.00 0%
Portugal 0.0037 0.10 2733%
Romania 25.59 0.50 2%
Sweden 2.99 3.07 103%
Slovenia 1.35 0.00 0%
Slovakia 27.05 0.00 0%
United Kingdom 31.03 3.58 12%
Liechtenstein 0.00 0.00 -
Iceland 0.00 0.00 0%
Switzerland 0.55 0.00 0%
C.2.7.3 Production of non ferrous metals – Aluminum Production, 2.(e)
According to the Emission Inventory Guidebook PCCD/PCDF emissions occur during aluminum
production. Seven facilities reported PCCD/PCDF releases for NACE 24.42 Aluminum Production under
activity 2.(e) Production of non ferrous metals. Table C.9 shows a comparison of these facilities with data
reported under CLRTAP NFR 2 C 3 Aluminum Production.
The extremely high PCCD/PCDF releases of Iceland reported under E-PRTR seem to be an error in
magnitude. In case of Germany, Norway and United Kingdom a gap in reporting could be possible.
Table C.9 Comparison of PCDD/PCDF emissions under activity 2.(b) with data reported under CLRTAP NFR 1 A 2 a Stationary Combustion in Manufacturing Industries and Construction: Iron and Steel and NFR 2 C 1 Iron and Steel Production.
Country PCDD/PCDF [g]
CLRTAP PCDD/PCDF [g]
E-PRTR Share E-PRTR
Austria NO
Belgium NO
Bulgaria 0.15
Cyprus NO
Czech Republic -
Germany 1.84 0.00%
Estonia NO
Spain NE
Finland NA
France NA 0.48
Hungary NA 0.93
Ireland NO
Italy NA
Lithuania NO
Latvia NO
Netherlands IE
Norway 1.19
Poland 0.09
Portugal NO

ETC/ACC - ETC/SCP - ETC/W E-PRTR Review 2009 81/162
Country PCDD/PCDF [g]
CLRTAP PCDD/PCDF [g]
E-PRTR Share E-PRTR
Romania NA
Sweden NA
Slovenia 0.07
Slovakia IE
United Kingdom 5.93 0.19 3.3%
Iceland 0.53 440.00 83341%
Switzerland NA
Croatia NO
C.2.7.4 Production of non ferrous metals – Other non ferrous metals,2.(e)
According the Emission Inventory Guidebook PCCD/PCDF emissions occur from all types of primary
production of non ferrous metals.
The following comparison related to the production and casting of other non ferrous metals. 21 facilities
reported PCCD/PCDF releases under activity 2.(e) Production of non ferrous metals for the following
NACE codes:
24.51 Casting of iron
24.44 Copper production
24.53 Casting of light metals
29.32 Manufacture of other parts and accessories for motor vehicles
24.43 Lead, zinc and tin production
24.54 Casting of other non-ferrous metals
24.44 Copper production
24.41 Precious metals production
Table C.10 Comparison of PCCD/PCDF releases under activity 2.(b) with data reported under CLRTAP NFR 1 A 2 a Stationary Combustion in Manufacturing Industries and Construction: Iron and Steel and NFR 2 C 1 Iron and Steel Production
Country PCDD/PADS [g]
CLRTAP PCDD/PCDF [g]
E-PRTR Share E-PRTR
Belgium 0.21
Bulgaria 1.03
Czech Republic 8.23
Germany 1.85 0.63 34.2%
Spain 0.59
Finland 0.58
Portugal 0.10
Romania 0.48 89.00 18426.5%
Sweden 0.63 0.74 117.0%
Slovenia 1.18 0.53 44.9%
United Kingdom 38.13 2.20 5.8%
Switzerland 0.74

82/162 E-PRTR data review 2009 ETC/ACC - ETC/SCP - ETC/W
Table C.10 shows the comparison of PCCD/PCDF releases and emissions reported under CLRTAP for NFR
2 C 5 b Lead Production, 2 C 5 c Nickel Production, 2 C 5 d Zinc Production, 2 C 5 e Other metal
production for countries that reported emissions either under CLRTAP or E-PRTR.
In case of Romania, a possible error of magnitude in reporting was identified. The very low PCCD/PCDF
releases reported under E-PRTR by the United Kingdom might indicate a potential gap in reporting.
C.2.8 Mercury (Hg)
The total percentage of Hg emissions accounted for in E-PRTR reporting for all countries is 43 % of the
national total without transport reported under CLRTAP (Figure C.22). For individual countries the total
percentage of Hg emissions accounted for is rather variable (minimum 2 % for Italy and maximum 200 %
for Germany, standard deviation 43 %).
E-PRTR Hg releases mainly stem from Energy, Production of metals, Mineral industry and Chemical
industry. Switzerland, Denmark and Norway also reported a relatively high share of Hg emissions from
Waste management (Figure C.23).
Figure C.22 Share of E-PRTR Hg emissions in the national total reported under CLRTAP (national total without transport)
200%
0%
20%
40%
60%
80%
100%
120%
140%
160%
180%
200%
Austr
ia
Belg
ium
Bulg
ari
a
Cypru
s
Czech R
epublic
Denm
ark
Esto
nia
Fin
land
Fra
nce
Germ
any
Hungary
Irela
nd
Italy
Neth
erl
ands
Norw
ay
Pola
nd
Port
ugal
Rom
ania
Slo
vakia
Slo
venia
Spain
Sw
eden
Sw
itzerl
and
United K
ingdom
All c
ountr
ies
Hg emissions (National total w/o transport) reported under CLRTAP
Share
of E-P
RTR
Hg
em
issi
ons
Note: Greece, Iceland, Latvia, Liechtenstein, Lithuania, Luxembourg and Malta did not report Hg emissions under E-PRTR 2008.
Greece, Iceland, Latvia, Liechtenstein and Luxembourg did not report Hg emissions under CLRTAP 2008
For mercury (Hg) the results also differ very much between countries. In Germany the share of Hg E-
PRTR releases in sectoral CLRTAP emissions is 224 %; in Cyprus, the Czech Republic, Estonia and France
the share is between 80 % and 100 % and in Ireland, Italy and Slovenia less than 10 % (Figure C.24).

ETC/ACC - ETC/SCP - ETC/W E-PRTR Review 2009 83/162
Figure C.23 Contribution of E-PRTR main activities to the total Hg releases reported under E-PRTR 2008
0%
10%
20%
30%
40%
50%
60%
70%
80%
90%
100%
Austr
ia
Belg
ium
Bulg
ari
a
Cypru
s
Czech R
epublic
Denm
ark
Esto
nia
Fin
land
Fra
nce
Germ
any
Gre
ece
Hungary
Irela
nd
Italy
Luxem
bourg
Neth
erl
ands
Norw
ay
Pola
nd
Port
ugal
Rom
ania
Slo
vakia
Slo
venia
Spain
Sw
eden
Sw
itzerl
and
United K
ingdom
All c
ountr
ies
Hg e
mis
sio
ns %
(E-P
RTR 2
008)
Other activities
Paper and wood production
Waste management
Chemical Industry
Mineral Industry
Production of metals
Energy
Figure C.24 Share of E-PRTR Hg releases (Energy, manufacturing industries and waste incineration) in sectoral emissions reported under CLRTAP
0%
50%
100%
150%
200%
250%
Aus
tria
Bel
gium
Bul
gari
a
Cypr
us
Czec
h R
epub
lic
Den
mar
k
Esto
nia
Finl
and
Fran
ce
Ger
man
y
Hun
gary
Irel
and
Ital
y
Net
herl
ands
Nor
way
Pola
nd
Port
ugal
Rom
ania
Slov
akia
Slov
enia
Spai
n
Swed
en
Swit
zerl
and
Uni
ted
King
dom
All
Coun
trie
s
Shar
e o
f E-
PR
TR H
g e
mis
sio
ns
Hg & compounds
Share of E-PRTR
CLRTAP emissions
Note: Bulgaria, Greece, Iceland and Latvia, Lithuania, Liechtenstein and Malta did not report Hg emissions for „Energy“ sector.

84/162 E-PRTR data review 2009 ETC/ACC - ETC/SCP - ETC/W
C.2.8.1 Thermal power stations and other combustion installations, 1.(c)
The most important activity for Hg emissions is 1.(c) thermal power stations and other combustion
installations which is responsible for 53 % (20.218 kg) of the total E-PRTR Hg emissions. In total 195
facilities were reporting Hg emissions under 1.(c) but only 6 facilities were reporting Hg emissions
without reporting of any CO2 emissions. Figure C.25 shows the top 100 CO2 emitters for activity 1.(c)
contributing 55 % (691 mio t) of total CO2 emissions reported under 1.(c).
It is assumed that the largest thermal power plants are coal-fired (which could be verified for at least
the top 20 facilities) and that Hg emissions were above the threshold of 10 kg. Hg emissions of the top
100 CO2 emitters contributed 71 % (14.143 kg) to total 1.(c) Hg emissions and 37 % of total Hg E-PRTR
emissions, respectively. A rather high percentage (68 %) of the top 100 CO2 emitters was also reporting
Hg emissions.
Within the top 20 CO2 emitters of activity 1.(c) three facilities did not report Hg emissions (Figure C.26).
This may indicate inconsistencies in reporting and should be checked by countries.
Figure C.25 Activity 1.(c) top 100 CO2 emitters: CO2 and Hg emissions into air
0
500
1000
1500
2000
2500
3000
0.00
5.00
10.00
15.00
20.00
25.00
30.00
35.00
kg
Hg
mio
t C
O2
mio t CO2 kg Hg
Figure C.26 Activity 1.(c) top 20 CO2 emitters which did not report Hg emissions
National-ID Country Facility name Rank mio t CO2
EW_EA-67 United Kingdom Drax Power Limited, Drax Power Ltd 4 23.00
01D000018 Poland PGE Elektrownia Turów S.A. 9 12.90
2007000042 Italy CENTRALI TERMOELETTRICHE DI TARANTO 19 9.27

ETC/ACC - ETC/SCP - ETC/W E-PRTR Review 2009 85/162
C.2.8.2 Installations for the production of pig iron or steel (primary or secondary melting) including continuous casting, 2.(b)
Another important activity for Hg emissions is 2.(b) which accounted for 10 % (3.635 kg) of total Hg E-
PRTR emissions in 2008. Forty percent of CO2 emitters of this activity were also reporting Hg emissions.
Within the top 20 CO2 emitters only 9 plants were reporting Hg emissions, which possibly indicates a gap
in reporting.
In total 53 facilities were reporting Hg emissions of which 26 are not reporting CO2 emissions. Especially
the largest Hg emitter (384 kg) did not report any CO2 emissions. A certain correlation of large CO2 with
large Hg emissions is given but due to the heterogenic structure of this activity it is not possible to show
any discrepancies.
C.2.8.3 Installations for the production of: cement clinker in rotary kilns 3.(c).(i), (NACE 23.51)
Activity 3.(c).(i) is also an important source for Hg emissions accounting for 9 % (3.588kg) of total Hg E-
PRTR emissions in 2008.
Figure C.27 shows the top 150 CO2 emitters of NACE 23.51, which were responsible for 84 % (126 mio t)
of total CO2 emissions reported under NACE 23.51 in 2008. Fifty percent of the top 150 CO2 emitters
were also reporting Hg emissions. Within the top 20 CO2 emitters 7 plants were not reporting Hg
emissions, which could indicate a gap in reporting and should consequently be checked by the countries
concerned (Denmark, Ireland, Portugal, Romania, Spain, Sweden, the United Kingdom).
In total 91 facilities were reporting Hg emissions under NACE 23.51 and only one facility reported Hg
emissions without reporting any CO2 emissions.
Figure C.27 Activity 3.(c).(i) top 150 CO2 emitters: CO2 and Hg emissions into air
0
50
100
150
200
250
0.00
0.50
1.00
1.50
2.00
2.50
3.00
kg
Hg
mio
t C
O2
mio t CO2 kg Hg

86/162 E-PRTR data review 2009 ETC/ACC - ETC/SCP - ETC/W
C.2.9 Other heavy metals (HMs)
All countries reported releases of at least one heavy metal (HM) under E-PRTR. Reporting of HM under
E-PRTR seems to be more complete than reporting of HM under CLRTAP. Large point sources produce
on average more than 20 % of national total HM emissions. For individual HMs between seven and eight
countries have a share of E-PRTR emissions above 50 %. Germany, Hungary, Lithuania, Malta and
Portugal reported significantly higher emissions under the E-PRTR than national totals under CLRTAP,
this indicates either incomplete reporting under CLRTAP or errors in E-PRTR data.
The total percentage of As emissions accounted for in E-PRTR reporting for all countries is 17 % of the
national total without transport reported under CLRTAP (Figure C.28). For individual countries the total
percentage of As emissions accounted for is rather variable with a minimum of 0.1 % for Romania and a
maximum of 104 % for Germany (standard deviation 33 %).
Figure C.28 Share of E-PRTR As emissions in the national total reported under CLRTAP (national total without transport)
0%
20%
40%
60%
80%
100%
120%
Belg
ium
Bulg
ari
a
Cypru
s
Czech R
epublic
Denm
ark
Esto
nia
Fin
land
Fra
nce
Germ
any
Hungary
Irela
nd
Italy
Malta
Neth
erl
ands
Norw
ay
Pola
nd
Port
ugal
Rom
ania
Slo
vakia
Spain
Sw
eden
United K
ingdom
All c
ountr
ies
As emissions (National total w/o transport) reported under CLRTAP
Share
of E-P
RTR
As
em
issio
ns
Note: Austria, Greece, Latvia, Liechtenstein, Lithuania and Luxembourg did not report As emissions under
E-PRTR 2008. Austria, Greece, Iceland, Latvia, Liechtenstein, Luxembourg, Slovenia and Switzerland did not report As
emissions under CLRTAP 2008
The total percentage of Cd emissions accounted for in E-PRTR reporting for all countries is 17 % of the
national total without transport reported under CLRTAP (Figure C.29). For individual countries the total
percentage of Cd emissions accounted for is rather variable with a minimum of 1 % for Switzerland and a
maximum of 96 % for the Netherlands (standard deviation 33 %).
The total percentage of Cr emissions accounted for in E-PRTR reporting for all countries is 33 % of the
national total without transport reported under CLRTAP (Figure C.30). For individual countries the total
percentage of Cr emissions accounted for is rather variable with a minimum of 2 % for Italy and a
maximum of 225 % for Germany (standard deviation 52 %).
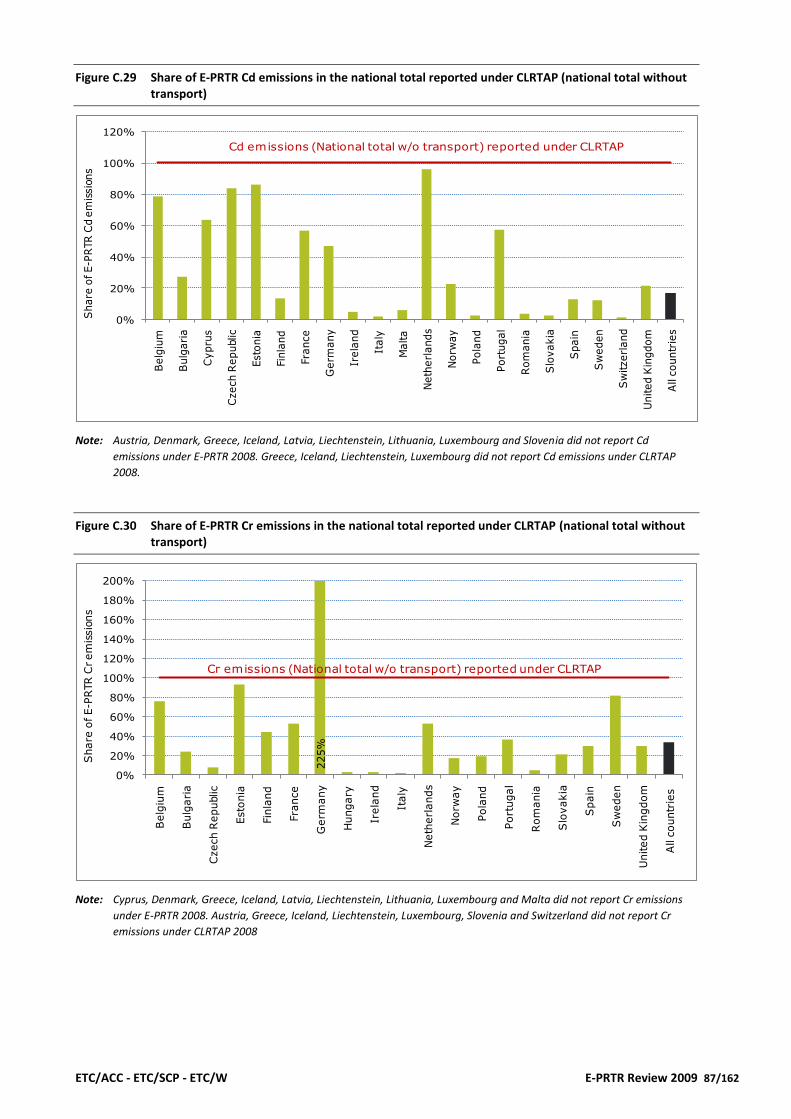
ETC/ACC - ETC/SCP - ETC/W E-PRTR Review 2009 87/162
Figure C.29 Share of E-PRTR Cd emissions in the national total reported under CLRTAP (national total without transport)
0%
20%
40%
60%
80%
100%
120%
Belg
ium
Bulg
ari
a
Cypru
s
Czech R
epublic
Esto
nia
Fin
land
Fra
nce
Germ
any
Irela
nd
Italy
Malta
Neth
erl
ands
Norw
ay
Pola
nd
Port
ugal
Rom
ania
Slo
vakia
Spain
Sw
eden
Sw
itzerl
and
United K
ingdom
All c
ountr
ies
Cd emissions (National total w/o transport) reported under CLRTAP
Share
of E-P
RTR
Cd e
mis
sio
ns
Note: Austria, Denmark, Greece, Iceland, Latvia, Liechtenstein, Lithuania, Luxembourg and Slovenia did not report Cd
emissions under E-PRTR 2008. Greece, Iceland, Liechtenstein, Luxembourg did not report Cd emissions under CLRTAP
2008.
Figure C.30 Share of E-PRTR Cr emissions in the national total reported under CLRTAP (national total without transport)
225%
0%
20%
40%
60%
80%
100%
120%
140%
160%
180%
200%
Belg
ium
Bulg
ari
a
Czech R
epublic
Esto
nia
Fin
land
Fra
nce
Germ
any
Hungary
Irela
nd
Italy
Neth
erl
ands
Norw
ay
Pola
nd
Port
ugal
Rom
ania
Slo
vakia
Spain
Sw
eden
United K
ingdom
All c
ountr
ies
Cr emissions (National total w/o transport) reported under CLRTAP
Share
of E-P
RTR
Crem
issio
ns
Note: Cyprus, Denmark, Greece, Iceland, Latvia, Liechtenstein, Lithuania, Luxembourg and Malta did not report Cr emissions
under E-PRTR 2008. Austria, Greece, Iceland, Liechtenstein, Luxembourg, Slovenia and Switzerland did not report Cr
emissions under CLRTAP 2008

88/162 E-PRTR data review 2009 ETC/ACC - ETC/SCP - ETC/W
The total percentage of Cu emissions accounted for in E-PRTR reporting for all countries is 22 % of the
national total without transport reported under CLRTAP (Figure C.31). For individual countries the total
percentage of Cu emissions accounted for is highly variable with a minimum of 5 % for Bulgaria and a
maximum of 226 % for Germany (standard deviation 69 %).
Figure C.31 Share of E-PRTR Cu emissions in the national total reported under CLRTAP (national total without transport)
226%
219%
0%
20%
40%
60%
80%
100%
120%
140%
160%
180%
200%
Belg
ium
Bulg
ari
a
Cypru
s
Czech R
epublic
Esto
nia
Fin
land
Fra
nce
Germ
any
Hungary
Italy
Lithuania
Neth
erl
ands
Norw
ay
Pola
nd
Port
ugal
Slo
vakia
Spain
Sw
eden
United K
ingdom
All c
ountr
ies
Cu emissions (National total w/o transport) reported under CLRTAP
Share
of E-P
RTR
Cu
em
issio
ns
Note: Austria, Denmark, Greece, Iceland, Ireland, Latvia, Liechtenstein, Luxembourg, Malta and Romania did not report Cu
emissions under E-PRTR 2008. Austria, Greece, Iceland, Liechtenstein, Luxembourg, Slovenia and Switzerland did not
report Cu emissions under CLRTAP 2008
Figure C.32 Share of E-PRTR Ni emissions in the national total reported under CLRTAP (national total without transport)
0%
20%
40%
60%
80%
100%
120%
Belg
ium
Bulg
ari
a
Cypru
s
Czech R
epublic
Denm
ark
Esto
nia
Fin
land
Fra
nce
Germ
any
Hungary
Irela
nd
Italy
Lithuania
Malta
Neth
erl
ands
Pola
nd
Port
ugal
Rom
ania
Slo
vakia
Spain
Sw
eden
United K
ingdom
All c
ountr
ies
Ni emissions (National total w/o transport) reported under CLRTAP
Share
of E-P
RTR
Ni em
issio
ns
Note: Greece, Iceland, Latvia, Liechtenstein and Luxembourg did not report Ni emissions under E-PRTR 2008. Austria, Greece,
Iceland, Liechtenstein, Luxembourg, Norway, Slovenia and Switzerland did not report Ni emissions under CLRTAP 2008

ETC/ACC - ETC/SCP - ETC/W E-PRTR Review 2009 89/162
The total percentage of Ni emissions accounted for in E-PRTR reporting for all countries is 30 % of the
national total without transport reported under CLRTAP (Figure C.32). For individual countries the total
percentage of Ni emissions accounted for is rather variable with a minimum of 1 % for Lithuania and a
maximum of 92 % for the Netherlands (standard deviation 31 %).
The total percentage of Pb emissions accounted for in E-PRTR reporting for all countries is 25 % of the
national total without transport reported under CLRTAP (Figure C.33). For individual countries the total
percentage of Pb emissions accounted for is rather variable with a minimum of 4 % for Ireland and a
maximum of 237 % for Germany (standard deviation 53 %).
Figure C.33 Share of E-PRTR Pb emissions in the national total reported under CLRTAP (national total without transport)
237%
0%
20%
40%
60%
80%
100%
120%
140%
160%
180%
200%
Austr
ia
Belg
ium
Bulg
ari
a
Czech R
epublic
Esto
nia
Fin
land
Fra
nce
Germ
any
Hungary
Irela
nd
Italy
Neth
erl
ands
Norw
ay
Pola
nd
Port
ugal
Rom
ania
Slo
vakia
Slo
venia
Spain
Sw
eden
Sw
itzerl
and
United K
ingdom
All c
ountr
ies
Pb emissions (National total w/o transport) reported under CLRTAP
Share
of E-P
RTR
Pb
em
issio
ns
Note: Cyprus, Denmark, Greece, Iceland, Latvia, Liechtenstein, Luxembourg and Malta did not report Pb emissions under E-
PRTR 2008. Greece, Iceland, Liechtenstein and Luxembourg did not report Pb emissions under CLRTAP 2008

90/162 E-PRTR data review 2009 ETC/ACC - ETC/SCP - ETC/W
C.3 Refineries, Iron and Steel
A more detailed comparison was performed for Electricity and heat production (Table C.11), Refineries
(Table C.12) and the Iron and steel industry (Table C.13), while these sectors contribute significantly to E-
PRTR SOx, NOx and PM10 emissions. These are the sectors for which also under CLRTAP emissions are
occurring from large point sources, however not all of them necessarily exceed E-PRTR thresholds. The
tables show identical figures reported under CLRTAP and E-PRTR in a number of countries.
Table C.11 Comparison of E-PRTR and CLRTAP emissions (NOx, SOx and PM10) occurring in Electricity and heat production
E-PRTR CLRTAP E-PRTR CLRTAP E-PRTR CLRTAP
NOx/NO2 NOx/NO2 SOx/SO2 SOx/SO2 PM10 PM10
Country Gg Gg % Gg Gg % Gg Gg %
Austria 3.23 10.81 30% 0.68 2.31 29% 0.08 1.04 7%
Belgium 11.19 16.57 68% 7.42 7.91 94% 0.20 0.43 46%
Bulgaria 64.42 56.82 113% 721.32 663.22 109% 16.86 9.79 172%
Cyprus 6.33 6.32 100% 19.00 20.52 93% 0.59 0.59 100%
Czech Republ ic 83.81 83.74 100% 106.90 105.32 101% 2.55 2.62 97%
Denmark 15.68 24.06 65% 4.99 6.28 79% 0.23 0.65 35%
Estonia 10.68 11.94 89% 56.57 61.69 92% 5.04 6.13 82%
Finland 30.54 35.78 85% 19.49 26.52 73% 0.72 2.03 35%
France 94.99 69.16 137% 100.56 79.44 127% 4.35 4.06 107%
Germany 201.79 277.44 73% 138.64 204.09 68% 3.97 9.68 41%
Greece 126.76 133.62 95% 338.19 331.50 102% 21.27
Hungary 15.52 28.01 55% 12.20 10.20 120% 0.24
Iceland 21.13 21.98 96% 25.06 25.19 99% 0.49 4.25 12%
Ireland 31.84 58.75 54% 16.41 57.98 28% 0.19 2.02 9%
Italy 1.74 5.49 32% 0.65 0.38 170% 0.22
Latvia 2.36 6.79 35% 1.28 5.21 25% 2.13
Liechtenstein 0.41
Li thuania 5.60 5.19 108% 10.44 10.47 100% 0.75 0.91 82%
Luxembourg 24.29 24.69 98% 5.82 6.08 96% 0.14 0.27 52%
Malta 232.36 260.83 89% 477.39 542.17 88% 18.26 17.39 105%
Netherlands 45.19 35.29 128% 38.46 33.74 114% 1.34 1.60 84%
Norway 82.21 83.45 99% 450.53 451.10 100% 20.21 6.58 307%
Poland 9.50 10.64 89% 40.12 40.36 99% 0.82
Portugal 10.89 12.11 90% 7.03 7.43 95% 0.20 0.40 50%
Romania 182.43 205.63 89% 123.40 187.90 66% 6.38 8.52 75%
Slovakia 3.27 12.94 25% 0.68 7.67 9% 0.05 4.58 1%
Slovenia 276.66 278.52 99% 214.04 213.09 100% 6.98 8.55 82%
Spain 0.09 0.02
Sweden 0.01 0.00 0.00
Switzerland 0.20 1.59 12% 1.02 0.18
United Kingdom 2.21 0.27 0.29
Share E-
PRTR in
CLRTAP
Share E-
PRTR in
CLRTAP
Share E-
PRTR in
CLRTAP
Note: E-PRTR activities 1.(c) Thermal power stations and other combustion installations and 5.(b) Installations for the
incineration of non-hazardous waste (NACE 35.11 Production of electricity and 35.30 Steam and air conditioning supply )
are compared with CLRTAP/UNFCCC sector 1 A1a Public Electricity and Heat production.
Shares of E-PRTR emissions in emissions reported under CLRTAP between 90 % and 100 % are highlighted in green; those
exceeding 100 % are highlighted in red.

ETC/ACC - ETC/SCP - ETC/W E-PRTR Review 2009 91/162
Table C.12 Comparison of E-PRTR and CLRTAP NOx and SOx, emissions occurring in Refineries, 2008
E-PRTR CLRTAP E-PRTR CLRTAP
NOx/NO2 NOx/NO2 SOx/SO2 SOx/SO2
Country Gg Gg % Gg Gg %
Austria 1.20 0.85
Belgium 6.26 4.69 133% 20.91 21.01 100%
Bulgaria 4.08 0.01 30753% 6.55 0.06 10982%
Cyprus
Czech Republ ic 0.74 0.52 142% 5.79 0.81 713%
Denmark 1.39 1.49 93% 1.56 0.32 493%
Estonia 0.24 0.00 9042% 0.00
Finland 3.85 3.05 126% 6.72 1.08 621%
France 23.60 17.79 133% 92.84 49.32 188%
Germany 15.41 20.60 75% 32.44 48.64 67%
Greece 6.24 6.09 103% 12.10 34.36 35%
Hungary 1.14 0.58
Iceland 0.77 0.77 100% 0.98 0.98 100%
Ireland 2.48 23.52 11% 8.35 45.44 18%
Italy
Latvia 2.84 1.23 231% 12.30 3.42 360%
Liechtenstein
Li thuania
Luxembourg 8.52 8.62 99% 25.76 25.71 100%
Malta 8.14 8.17 100% 25.64 25.72 100%
Netherlands 4.75 6.71 71% 21.37 20.73 103%
Norway 5.57 1.29 431% 15.99 2.03 787%
Poland 2.55 1.04 245% 8.10 1.48 548%
Portugal 0.00 0.00
Romania 23.49 22.13 106% 71.16 47.32 150%
Slovakia 1.35 1.47 92% 0.51 0.47 108%
Slovenia 11.69 24.58 48% 27.21 72.01 38%
Spain
Sweden
Switzerland 1.94 1.03 189% 1.39 0.52 270%
United Kingdom 0.30 1.26 24% 1.99
Share E-
PRTR in
CLRTAP
Share E-
PRTR in
CLRTAP
Note: E-PRTR activity 1.(a) Mineral oil and gas refineries (NACE 19.20 Manufacture of refined petroleum products) is compared
with CLRTAP sector 1A1b Petroleum refining
Shares of E-PRTR emissions in emissions reported under CLRTAP between 90 % and 100 % are highlighted in green; those
exceeding 100 % are highlighted in red.

92/162 E-PRTR data review 2009 ETC/ACC - ETC/SCP - ETC/W
Table C.13 Comparison of NOx and CO emissions occurring in Iron and steel industry
E-PRTR CLRTAP E-PRTR CLRTAP
NOx/NO2 NOx/NO2 CO CO
Country Gg Gg % Gg Gg %
Austria 4.43 5.19 85% 124.60 127.24 98%
Belgium 10.91 14.56 75% 257.64 329.64 78%
Bulgaria 0.15 6.03 3% 0.00 28.61 0%
Cyprus 0.00 0.00
Czech Republ ic 7.01 7.08 99% 109.17 110.95 98%
Denmark 0.11
Estonia 0.02 0.06
Finland 3.99 4.22 95% 2.96 9.63 31%
France 18.13 18.83 96% 101.09 1,470.79 7%
Germany 19.12 30.60 62% 656.93 1,064.60 62%
Greece 0.14 0.76 19% 0.82 0.06 1495%
Hungary 1.03 4.81 21% 23.23 42.28 55%
Iceland 0.00 0.00
Ireland 12.75 2.57 496% 249.42 79.30 315%
Italy 1.63 3.50 47% 0.14
Latvia
Liechtenstein 0.72 4.04
Li thuania
Luxembourg 5.92 5.31 112% 67.10 74.31 90%
Malta 7.00 2.20 317% 133.39 3.67 3633%
Netherlands 0.38 0.33 115% 0.63 13.70 5%
Norway 4.70 17.02 28% 103.50 81.20 127%
Poland 6.58 5.89 112% 91.20 80.08 114%
Portugal 0.15 0.29 51% 1.92 0.36 540%
Romania 9.56 14.52 66% 124.13 460.31 27%
Slovakia 2.28 2.24 102% 14.00 2.60 539%
Slovenia 11.53 19.45 59% 184.40 298.07 62%
Spain 1.08 0.16
Sweden
Switzerland 6.24 0.02
United Kingdom 0.22 0.41 54% 0.50 1.78 28%
Share E-
PRTR in
CLRTAP
Share E-
PRTR in
CLRTAP
Note: E-PRTR activities: 2.(a) Metal ore (including sulphide ore) roasting or sintering installations, 2.(b) Installations for the
production of pig iron or steel (primary or secondary melting) including continuous casting and 2.(c) Installations for the
processing of ferrous metals (NACE 24.10 Manufacture of basic iron and steel and of ferro-alloys and 24.20 Manufacture
of tubes, pipes, hollow profiles and related fittings, of steel) are compared with CLRTAP categories 1 A 2 a Stationary
combustion in manufacturing industries and construction: Iron and steel, 2 C 1 Iron and steel production and 2 C 2
Ferroalloys Production.
Shares of E-PRTR emissions in emissions reported under CLRTAP between 90 % and 100 % are highlighted in green; those
exceeding 100 % are highlighted in red.

ETC/ACC - ETC/SCP - ETC/W E-PRTR Review 2009 93/162
D Stage 2 Review – Waste- Comparisons with other data on waste transfers
The stage 2 review of the E-PRTR dataset for waste comprises a comparison of the 2007 with the 2008
data on waste transfers as well as a number of checks regarding waste incineration plants and landfills.
The checks included the following:
1. Significant changes in the reported amount of waste transfers
2. Significant changes in the distribution of waste transfer for recovery and disposal
3. Number of incineration plants reporting
4. Number of incineration plants reporting CO2 emissions
5. Number of incineration plants reporting CO2 emissions compared with the amount of waste
transferred from the plants
6. Number of incineration plants reporting generation of hazardous waste
7. Landfills reporting leachate as “waste water transfer” under the category pollutant transfer instead
of the category “waste transfer”
The stage 2 review of the E-PRTR dataset for waste for the reporting year 2008 was constraint by the
fact that other relevant waste data were not available at the time the review was conducted. The
Eurostat waste generation data for 2008 were reported by Member States according to the EU Waste
Statistical Regulation37 by the end of June 2010, but will not become available until the end of 2010 or
by the beginning of 2011. Regarding transboundary shipments of waste the deadline for reporting of
notified waste was by the end of 2009, but several Member States have still not reported.
D.1 Comparison of reporting year 2008 with 2007
The number of reported waste transfers (waste streams) was reviewed. In total 42,163 waste streams
were included in the database in 2008 compared with 38,125 in 2007.
Altogether 17,205 facilities reported waste data in 2008 compared with 16,283 facilities in 2007.
Hazardous waste reporting is divided into transfer within the country (domestic) and transfer out of the
country (transboundary). In 2008, a total of 14,515 facilities reported data on domestically transferred
hazardous waste and 1,234 reported data on transboundary transferred hazardous waste. A total of
7,333 facilities reported data on non-hazardous waste.
The different orders of magnitude for the hazardous waste and the non-hazardous waste data are partly
due to the different reporting threshold for operators. Off-site transfers of non-hazardous waste must
be reported if the facility transfers more than 2000 tonnes per year. For hazardous waste the threshold
is 2 tonnes per year.
Figure B.11 in part B shows the distribution between countries of total combined waste transfer of
hazardous waste and non-hazardous waste in million tonnes. Germany and Poland have the largest
37
Waste Regulation: Regulation (EC) No 2150/2002 of the European Parliament and of the Council of 25 November 2002 on
waste statistics, (http://eur-lex.europa.eu/LexUriServ/LexUriServ.do?uri=OJ:L:2002:332:0001:0036:EN:PDF)

94/162 E-PRTR data review 2009 ETC/ACC - ETC/SCP - ETC/W
reported amounts, whereas the Netherlands, Spain and Sweden have the absolute largest increases,
when the 2008 reporting is compared with 2007 data.
Figure D.1 shows the overall development in percentage change from 2007 to 2008. The figure shows
that the Netherlands, Sweden, Malta, Spain, Latvia, Iceland, Lithuania and Norway have reported an
increase of more than 50 %, whereas Austria, Portugal and Cyprus have reported decreases larger then
50 %. These very large changes might indicate reporting errors.
Figure D.1 Development from 2007 to 2008 of total amounts of off-side waste transfers (hazardous+ non-hazardous waste) related to country (in %)
-100%
-50%
0%
50%
100%
150%
200%
250%
300%
350%
Neth
erlands
Sw
eden
Malta
Spain
Latv
ia
Icela
nd
Lithuania
Norw
ay
Hungary
Fra
nce
Sw
itzerland
Slo
vakia
Esto
nia
Bulg
aria
Slo
venia
Gre
ece
Luxem
bourg
Belg
ium
Czech R
epublic
United K
ingdom
Pola
nd
Fin
land
Denm
ark
Germ
any
Lie
chte
nste
in
Rom
ania
Irela
nd
Italy
Austr
ia
Port
ugal
Cypru
s
Change from 2007 to 2008
Table D.1 shows that total amount of domestically transferred hazardous waste increased by 2.8 million
tonnes from 2007 to 2008. The overall is mainly due to increases reported by Germany and Spain, which
more than offset the major declines reported by Italy and the Netherlands.
Table D.1 also shows that 1,234 facilities have reported 7.9 million tonnes of transboundary shipment of
hazardous waste in 2008 compared with 999 facilities and 2.2 million tonnes in 2007. The large increase
is mainly due to a huge increase in the amount reported by the Netherlands. This might indicate a
reporting error since one facility38 alone accounted for about 60 % of the total amount of transboundary
waste in Europe.
7,333 facilities have reported transfer of non-hazardous waste of 371.8 million tonnes in 2008 compared
with 6,860 facilities and 326.8 million tonnes in 2007. The absolute increase of non-hazardous waste
transfer means that the increase in non-hazardous waste transfer by the likes of France, the
Netherlands, Spain and Sweden, outweigh the major decrease in non-hazardous waste transfer in
Austria, Germany, Italy, Poland and Portugal.
38 NV Afvalverbranding Zuid-Nederland; National ID 44009

ETC/ACC - ETC/SCP - ETC/W E-PRTR Review 2009 95/162
Table D.1 Number of facilities reporting waste data and quantities of off-side waste transfers related to hazardous waste, domestic and transboundary shipment, and non-hazardous waste in 2007 and 2008
Waste
transfer
Waste
transfer
Waste
transfer
Waste
transfer
Waste
transfer
Waste
transfer
(tonnes) (tonnes) (tonnes) (tonnes) (tonnes) (tonnes)
Austria 184,920 124 256,900 108 147,677 17 128,134 18 5,213,304 73 1,747,585 66
Belgium 1,329,275 509 1,562,821 563 332,693 129 311,496 118 12,928,012 347 13,335,040 339
Bulgaria 53,538 40 187,449 56 182 2 3,870 4 7,404,040 32 8,018,750 40
Cyprus 661 11 858 10 27 1 0 0 1,081,830 4 17,220 3
Czech Republic 326,598 399 332,716 439 421 7 1,158 11 3,819,667 166 3,900,390 185
Denmark 246,979 202 436,559 223 103,765 30 77,290 27 3,131,866 136 2,756,854 103
Estonia 551,656 63 746,777 75 907 10 601 7 1,310,911 31 1,362,688 37
Finland 1,340,128 335 1,416,881 338 0 0 0 0 10,549,611 223 9,838,554 229
France 2,765,127 1,969 2,894,013 2,091 261,745 263 375,853 258 9,746,963 505 15,421,897 656
Germany 9,166,780 2,955 10,261,153 3,226 0 6 103,676 70 72,232,030 1,512 65,923,262 1,650
Greece 55,527 89 61,052 99 2,451 11 461 10 2,770,780 34 2,973,508 40
Hungary 264,634 247 219,109 262 6,235 7 673 6 1,565,872 104 2,487,216 120
Iceland 5,514 3 3,171 2 218 1 3,320 1 31,879 3 66,605 2
Ireland 77,368 161 54,993 165 250,087 119 435,104 118 4,475,753 102 3,434,359 110
Italy 4,342,345 1,514 3,789,978 1,189 422,499 79 582,518 65 20,706,625 768 14,539,377 613
Latvia 5,584 17 8,023 21 11,340 3 5,410 2 47,448 7 113,534 10
Liechtenstein 0 0 0 0 0 0 0 0 2,430 1 2,180 1
Lithuania 7,216 31 7,924 48 2,238 2 2,881 3 203,213 17 344,967 20
Luxembourg 98,197 21 101,368 21 7,607 13 46,502 11 1,097,937 16 1,114,766 17
Malta 1,531 3 14,705 4 642 2 916 3 5,131 1 2,960 1
Netherlands 3,456,637 355 1,801,426 454 291,337 88 5,043,973 92 9,955,055 214 51,094,135 277
Norway 529,818 85 666,433 147 0 0 0 0 583,547 25 1,123,436 51
Poland 1,336,262 705 1,150,012 754 11,634 18 12,235 19 78,690,917 654 74,755,642 672
Portugal 553,786 301 576,747 330 85,269 30 174,562 26 11,560,691 129 3,102,536 135
Romania 183,485 109 261,136 116 60 1 301 2 9,714,148 176 7,995,827 190
Slovakia 117,768 173 124,127 202 5,626 5 5,080 5 3,371,333 65 4,004,840 82
Slovenia 121,293 87 51,508 108 21,874 40 27,934 55 923,974 51 1,092,148 65
Spain 2,279,042 1,181 4,816,571 1,147 31,722 18 254,356 184 13,561,434 391 30,897,967 460
Sweden 363,073 304 461,793 379 85,939 22 94,032 37 3,018,485 144 12,397,910 192
Switzerland 389,056 146 515,053 165 46,314 37 84,551 36 8,134,850 51 9,557,107 55
United Kingdom 2,597,027 1,694 2,717,329 1,773 76,788 38 76,249 46 28,899,267 878 28,334,564 912
Total 32,750,824 13,833 35,498,583 14,515 2,207,296 999 7,853,135 1,234 326,739,002 6,860 371,757,825 7,333
Country
Hazardous waste Non-hazardous waste
Domestic Transboundary
2007 2008 2007 2008 2007 2008
Facilities Facilities Facilities Facilities Facilities Facilities
Some countries have high percentual changes even if the change in amount might be small. Table D.2
shows that Bulgaria, Denmark, Malta, Slovenia and Spain have for domestic transfers of hazardous
waste percentage changes larger than +/- 50 %. For transboundary transfers of hazardous waste
Bulgaria, Cyprus, the Czech Republic, Greece, Hungary, Iceland, Ireland, Latvia, Luxembourg, the
Netherlands, Portugal, Romania, Spain and Switzerland have changes larger than +/- 50 %. Table E.2
shows that the total amount of transferred hazardous waste (domestic plus transboundary transfer) has
also changed considerably for some countries. Bulgaria, Malta, the Netherlands and Spain have for total
amount of hazardous waste changes larger than 50 %.
For non-hazardous waste transfers Austria, Cyprus, France, Hungary, Iceland, Latvia, Lithuania, the
Netherlands, Norway, Portugal, Spain and Switzerland have changes larger than +/- 50 %.

96/162 E-PRTR data review 2009 ETC/ACC - ETC/SCP - ETC/W
Table D.2 Amount of waste in 2008 and the percentage change compared with 2007 related to country, hazardous waste domestic and transboundary transferred, total transfers of hazardous waste, and non-hazardous waste
Domestic
transfer
Change
compared
with 2007
Transboundary
transfer
Change
compared
with 2007
Total
Change
compared
with 2007
Total
Change
compared
with 2007tonnes % tonnes % tonnes % tonnes %
Austria 256,900 39 128,134 -13 385,072 16 1,747,585 -66
Belgium 1,562,821 18 311,496 -6 1,874,334 13 13,335,040 3
Bulgaria 187,449 250 3,870 2,031 191,569 257 8,018,750 8
Cyprus 858 30 -100 887 29 17,220 -98
Czech Republic 332,716 2 1,158 175 333,875 2 3,900,390 2
Denmark 436,559 77 77,290 -26 513,926 47 2,756,854 -12
Estonia 746,777 35 601 -34 747,413 35 1,362,688 4
Finland 1,416,881 6 1,416,886 6 9,838,554 -7
France 2,894,013 5 375,853 44 3,269,871 8 15,421,897 58
Germany 10,261,153 12 103,676 10,364,841 13 65,923,262 -9
Greece 61,052 10 461 -81 61,523 6 2,973,508 7
Hungary 219,109 -17 673 -89 219,764 -19 2,487,216 59
Iceland 3,171 -42 3,320 1,423 6,449 12 66,605 109
Ireland 54,993 -29 435,104 74 490,068 50 3,434,359 -23
Italy 3,789,978 -13 582,518 38 4,372,484 -8 14,539,377 -30
Latvia 8,023 44 5,410 -52 13,477 -20 113,534 139
Liechtenstein 0 2,180 -10
Lithuania 7,924 10 2,881 29 10,815 14 344,967 70
Luxembourg 101,368 3 46,502 511 147,873 40 1,114,766 2
Malta 14,705 860 916 43 16,481 658 2,960 -42
Netherlands 1,801,426 -48 5,043,973 1,631 6,845,351 83 51,094,135 413
Norway 666,433 26 666,458 26 1,123,436 93
Poland 1,150,012 -14 12,235 5 1,162,233 -14 74,755,642 -5
Portugal 576,747 4 174,562 105 751,313 18 3,102,536 -73
Romania 261,136 42 301 402 261,479 42 7,995,827 -18
Slovakia 124,127 5 5,080 -10 129,212 5 4,004,840 19
Slovenia 51,508 -58 27,934 28 79,385 -45 1,092,148 18
Spain 4,816,571 111 254,356 702 5,071,039 119 30,897,967 128
Sweden 461,793 27 94,032 9 555,852 24 12,397,910 311
Switzerland 515,053 32 84,551 83 599,636 38 9,557,107 17
United Kingdom 2,717,329 5 76,249 -1 2,793,582 4 28,334,564 -2
Change more than +/- 75%
Non-hazardous waste 2008
Country
Change more than +/- 25%
Change more than +/- 50%
Hazardous waste 2008
These large changes in absolute and percentage values might indicate reporting errors in the indicated
countries’ reporting, particularly when the change is larger than +/- 50 %, and even more so if the
changes in percentage values are based on reasonable high amounts. Table E.4 below indicates some
more detailed country comments, which might be relevant for explaining the stated changes.
Figure D.2 shows the amounts of hazardous waste transferred per country in 2007 and 2008 and related
in percentage to transfer inside (HWIC) and outside the country (HWOC). There is a huge variety among
the countries regarding how much of the hazardous waste is transferred transboundary. Countries like
Germany, the Czech Republic, Estonia, Finland, Germany, Norway and Romania hardly export any,
whereas countries like Ireland has reported export of up to almost 80 % of the total transferred
hazardous waste. The Netherlands has had a significant change in the distribution from 2007 to 2008,
which might be due to an error in reporting.
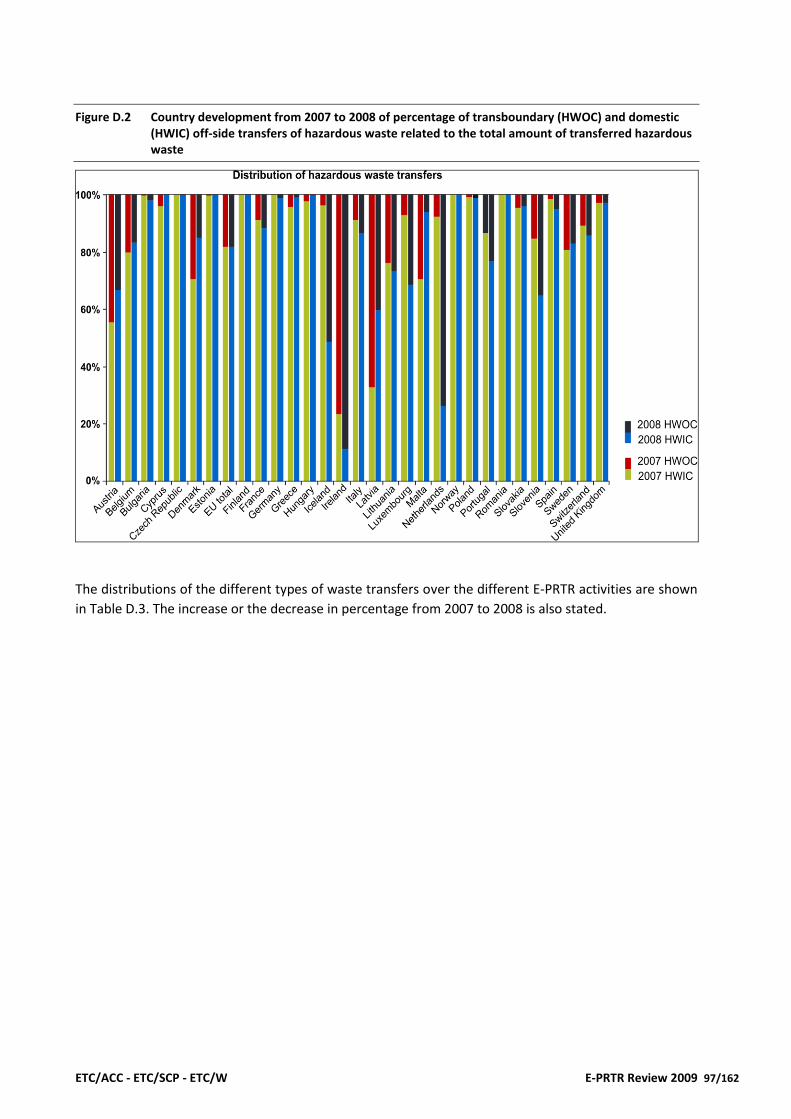
ETC/ACC - ETC/SCP - ETC/W E-PRTR Review 2009 97/162
Figure D.2 Country development from 2007 to 2008 of percentage of transboundary (HWOC) and domestic (HWIC) off-side transfers of hazardous waste related to the total amount of transferred hazardous waste
The distributions of the different types of waste transfers over the different E-PRTR activities are shown
in Table D.3. The increase or the decrease in percentage from 2007 to 2008 is also stated.
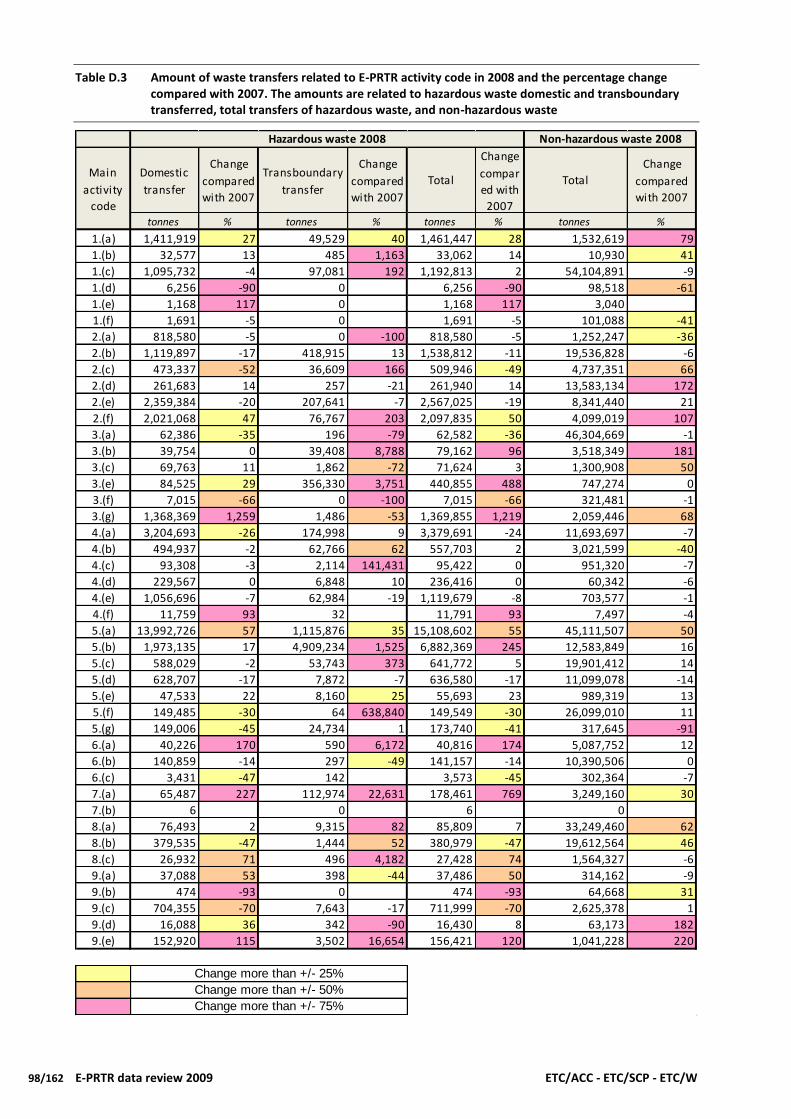
98/162 E-PRTR data review 2009 ETC/ACC - ETC/SCP - ETC/W
Table D.3 Amount of waste transfers related to E-PRTR activity code in 2008 and the percentage change compared with 2007. The amounts are related to hazardous waste domestic and transboundary transferred, total transfers of hazardous waste, and non-hazardous waste
Domestic
transfer
Change
compared
with 2007
Transboundary
transfer
Change
compared
with 2007
Total
Change
compar
ed with
2007
Total
Change
compared
with 2007
tonnes % tonnes % tonnes % tonnes %
1.(a) 1,411,919 27 49,529 40 1,461,447 28 1,532,619 79
1.(b) 32,577 13 485 1,163 33,062 14 10,930 41
1.(c) 1,095,732 -4 97,081 192 1,192,813 2 54,104,891 -9
1.(d) 6,256 -90 0 6,256 -90 98,518 -61
1.(e) 1,168 117 0 1,168 117 3,040
1.(f) 1,691 -5 0 1,691 -5 101,088 -41
2.(a) 818,580 -5 0 -100 818,580 -5 1,252,247 -36
2.(b) 1,119,897 -17 418,915 13 1,538,812 -11 19,536,828 -6
2.(c) 473,337 -52 36,609 166 509,946 -49 4,737,351 66
2.(d) 261,683 14 257 -21 261,940 14 13,583,134 172
2.(e) 2,359,384 -20 207,641 -7 2,567,025 -19 8,341,440 21
2.(f) 2,021,068 47 76,767 203 2,097,835 50 4,099,019 107
3.(a) 62,386 -35 196 -79 62,582 -36 46,304,669 -1
3.(b) 39,754 0 39,408 8,788 79,162 96 3,518,349 181
3.(c) 69,763 11 1,862 -72 71,624 3 1,300,908 50
3.(e) 84,525 29 356,330 3,751 440,855 488 747,274 0
3.(f) 7,015 -66 0 -100 7,015 -66 321,481 -1
3.(g) 1,368,369 1,259 1,486 -53 1,369,855 1,219 2,059,446 68
4.(a) 3,204,693 -26 174,998 9 3,379,691 -24 11,693,697 -7
4.(b) 494,937 -2 62,766 62 557,703 2 3,021,599 -40
4.(c) 93,308 -3 2,114 141,431 95,422 0 951,320 -7
4.(d) 229,567 0 6,848 10 236,416 0 60,342 -6
4.(e) 1,056,696 -7 62,984 -19 1,119,679 -8 703,577 -1
4.(f) 11,759 93 32 11,791 93 7,497 -4
5.(a) 13,992,726 57 1,115,876 35 15,108,602 55 45,111,507 50
5.(b) 1,973,135 17 4,909,234 1,525 6,882,369 245 12,583,849 16
5.(c) 588,029 -2 53,743 373 641,772 5 19,901,412 14
5.(d) 628,707 -17 7,872 -7 636,580 -17 11,099,078 -14
5.(e) 47,533 22 8,160 25 55,693 23 989,319 13
5.(f) 149,485 -30 64 638,840 149,549 -30 26,099,010 11
5.(g) 149,006 -45 24,734 1 173,740 -41 317,645 -91
6.(a) 40,226 170 590 6,172 40,816 174 5,087,752 12
6.(b) 140,859 -14 297 -49 141,157 -14 10,390,506 0
6.(c) 3,431 -47 142 3,573 -45 302,364 -7
7.(a) 65,487 227 112,974 22,631 178,461 769 3,249,160 30
7.(b) 6 0 6 0
8.(a) 76,493 2 9,315 82 85,809 7 33,249,460 62
8.(b) 379,535 -47 1,444 52 380,979 -47 19,612,564 46
8.(c) 26,932 71 496 4,182 27,428 74 1,564,327 -6
9.(a) 37,088 53 398 -44 37,486 50 314,162 -9
9.(b) 474 -93 0 474 -93 64,668 31
9.(c) 704,355 -70 7,643 -17 711,999 -70 2,625,378 1
9.(d) 16,088 36 342 -90 16,430 8 63,173 182
9.(e) 152,920 115 3,502 16,654 156,421 120 1,041,228 220
Hazardous waste 2008 Non-hazardous waste 2008
Main
activity
code
Change more than +/- 25%
Change more than +/- 50%
Change more than +/- 75%
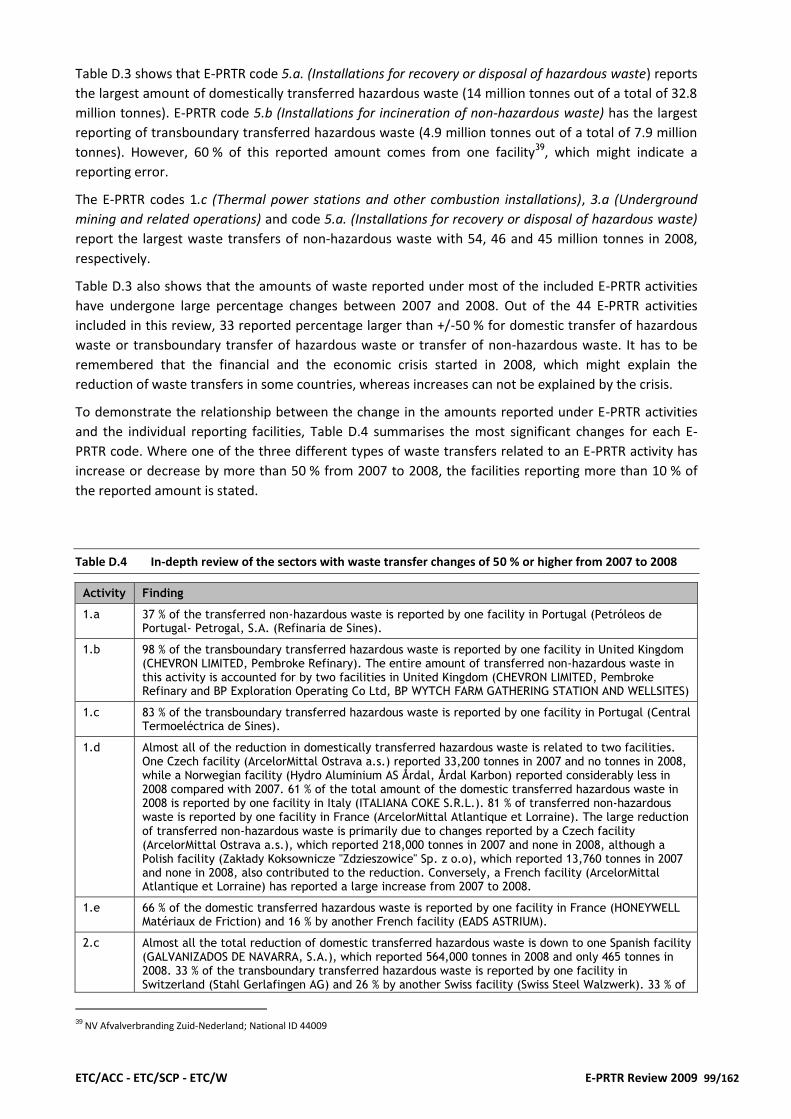
ETC/ACC - ETC/SCP - ETC/W E-PRTR Review 2009 99/162
Table D.3 shows that E-PRTR code 5.a. (Installations for recovery or disposal of hazardous waste) reports
the largest amount of domestically transferred hazardous waste (14 million tonnes out of a total of 32.8
million tonnes). E-PRTR code 5.b (Installations for incineration of non-hazardous waste) has the largest
reporting of transboundary transferred hazardous waste (4.9 million tonnes out of a total of 7.9 million
tonnes). However, 60 % of this reported amount comes from one facility39, which might indicate a
reporting error.
The E-PRTR codes 1.c (Thermal power stations and other combustion installations), 3.a (Underground
mining and related operations) and code 5.a. (Installations for recovery or disposal of hazardous waste)
report the largest waste transfers of non-hazardous waste with 54, 46 and 45 million tonnes in 2008,
respectively.
Table D.3 also shows that the amounts of waste reported under most of the included E-PRTR activities
have undergone large percentage changes between 2007 and 2008. Out of the 44 E-PRTR activities
included in this review, 33 reported percentage larger than +/-50 % for domestic transfer of hazardous
waste or transboundary transfer of hazardous waste or transfer of non-hazardous waste. It has to be
remembered that the financial and the economic crisis started in 2008, which might explain the
reduction of waste transfers in some countries, whereas increases can not be explained by the crisis.
To demonstrate the relationship between the change in the amounts reported under E-PRTR activities
and the individual reporting facilities, Table D.4 summarises the most significant changes for each E-
PRTR code. Where one of the three different types of waste transfers related to an E-PRTR activity has
increase or decrease by more than 50 % from 2007 to 2008, the facilities reporting more than 10 % of
the reported amount is stated.
Table D.4 In-depth review of the sectors with waste transfer changes of 50 % or higher from 2007 to 2008
Activity Finding
1.a 37 % of the transferred non-hazardous waste is reported by one facility in Portugal (Petróleos de Portugal- Petrogal, S.A. (Refinaria de Sines).
1.b 98 % of the transboundary transferred hazardous waste is reported by one facility in United Kingdom (CHEVRON LIMITED, Pembroke Refinary). The entire amount of transferred non-hazardous waste in this activity is accounted for by two facilities in United Kingdom (CHEVRON LIMITED, Pembroke Refinary and BP Exploration Operating Co Ltd, BP WYTCH FARM GATHERING STATION AND WELLSITES)
1.c 83 % of the transboundary transferred hazardous waste is reported by one facility in Portugal (Central Termoeléctrica de Sines).
1.d Almost all of the reduction in domestically transferred hazardous waste is related to two facilities. One Czech facility (ArcelorMittal Ostrava a.s.) reported 33,200 tonnes in 2007 and no tonnes in 2008, while a Norwegian facility (Hydro Aluminium AS Årdal, Årdal Karbon) reported considerably less in 2008 compared with 2007. 61 % of the total amount of the domestic transferred hazardous waste in 2008 is reported by one facility in Italy (ITALIANA COKE S.R.L.). 81 % of transferred non-hazardous waste is reported by one facility in France (ArcelorMittal Atlantique et Lorraine). The large reduction of transferred non-hazardous waste is primarily due to changes reported by a Czech facility (ArcelorMittal Ostrava a.s.), which reported 218,000 tonnes in 2007 and none in 2008, although a Polish facility (Zakłady Koksownicze "Zdzieszowice" Sp. z o.o), which reported 13,760 tonnes in 2007 and none in 2008, also contributed to the reduction. Conversely, a French facility (ArcelorMittal Atlantique et Lorraine) has reported a large increase from 2007 to 2008.
1.e 66 % of the domestic transferred hazardous waste is reported by one facility in France (HONEYWELL Matériaux de Friction) and 16 % by another French facility (EADS ASTRIUM).
2.c Almost all the total reduction of domestic transferred hazardous waste is down to one Spanish facility (GALVANIZADOS DE NAVARRA, S.A.), which reported 564,000 tonnes in 2008 and only 465 tonnes in 2008. 33 % of the transboundary transferred hazardous waste is reported by one facility in Switzerland (Stahl Gerlafingen AG) and 26 % by another Swiss facility (Swiss Steel Walzwerk). 33 % of
39 NV Afvalverbranding Zuid-Nederland; National ID 44009

100/162 E-PRTR data review 2009 ETC/ACC - ETC/SCP - ETC/W
Activity Finding
transferred non-hazardous waste is reported by one facility in France (ARCELORMITTAL SITE DE DUNKERQUE).
2.d 52 % of the transferred non-hazardous waste is reported by one facility in Spain (INDUSTRIAS HERGOM).
2.f 52 % of the transboundary transferred hazardous waste is reported by one facility in Italy (BONETTO DANIELE SRL.) 17 % of the total amount of transferred non-hazardous waste is reported by one facility in Italy (Margaritelli S.p.A. - Divisione Veicoli Industriali) and 15 % by a facility in United Kingdom (BMW (UK) Manufacturing Ltd).
3.b 99 % of the total amount of the transboundary transferred hazardous waste is reported by one facility in Spain (CORTA BALLESTA OESTE). 56 % of transferred non-hazardous waste is reported by one facility in Spain (PIZARRAS VILLAR DEL REY, S.L.).
3.c 40 % of the transferred non-hazardous waste is reported by one facility in Belgium (CARMEUSE sa - Site d'Aisemont) and 10 % by one facility in United Kingdom (Corus UK Limited, SHAPFELL WORKS).
3.e 63 % of the transboundary transferred hazardous waste is reported by one facility in Ireland (Becbay Limited) and 35 % by a facility in France (URSA FRANCE).
3.g 96 % of the domestic transferred hazardous waste is reported by one facility in Italy (SMORLESI GAETANA, CECILIA & C SPA). The high percentage reduction of hazardous waste transboundary transferred is based on a small absolute amount. 40 % of the transferred non-hazardous waste is reported by one facility in Italy (SMORLESI GAETANA, CECILIA & C SPA).
4.b 31 % of the transboundary transferred hazardous waste is reported by one facility in Spain (TIOXIDE EUROPE, S.L.) and 26 % by a facility in the Netherlands (Chemelot Site Permit BV).
4.c 78 % of the transboundary transferred hazardous waste is reported by one facility in Spain (FÁBRICA DE HUELVA) and 14 % by another Spanish facility (FÁBRICA DE PALOS).
5.a 25 % of the domestic transferred hazardous waste is reported by one facility in Spain (ECOCAT (ANTIGUO CESPA CONTEN)). 17 % of transferred non-hazardous waste is reported by one facility in Sweden (Lidens avfallsanläggning) and 17 % by a facility In Poland (KGHM POLSKA MIEDŹ S.A., Zakłady Wzbogacania Rud - Rejon POLKOWICE).
5.b 94 % of the transboundary transferred hazardous waste is reported by one facility in the Netherlands (NV Afvalverbranding Zuid-Nederland).
5.c 46 % of the transboundary transferred hazardous waste is reported by one facility in Italy (RA.RI. LIVORNO S.R.L.), 20 % by a facility in the Netherlands (Environmental Centre Europoort) and 12 % by a facility in France (SANINORD).
5.f The % changes are based on very low amounts
6.a 52 % of the domestic transferred hazardous waste is reported by one facility in United Kingdom (Aylesford Newsprint Ltd , AYLESFORD NEWSPRINT PAPER MILL). 99 % of the transboundary transferred hazardous waste is reported by one facility in Spain (COMPLEJO INDUSTRIAL DE HUELVA).
7.a 25 % of the domestic transferred hazardous waste is reported by one facility in Poland (Fermy Drobiu Woźniak Sp. z o.o. Ferma Bałdrzychów); and by three Italian facilities with respectively 17 % (FABEMOLI GIOVANNI E GIUSEPPE SOCIETA' SEMPLICE SOCIETA' AGRICOLA), 13 % (AZ. AGRICOLA BOLDINI ALBINO E ALBERTO SS) and 10 % (LATTERIA AGRICOLA DEL PO). 99 % of the transboundary transferred hazardous waste is reported by one facility in Italy (AZ. AGRICOLA BOLDINI ALBINO E ALBERTO SS).
8.a 46 % of the transboundary transferred hazardous waste is reported by one facility in Austria (Rudolf Großfurtner GmbH), 43 % by one facility in the Netherlands (Slachthuis Nijmegen BV) and 10 % by one facility in Slovakia (SK) (TAURIS DANUBIUS). 86 % of transferred non-hazardous waste is reported by one facility in the Netherlands (Van Rooi Meat BV (Helmond)).
8.b 39 % of the transboundary transferred hazardous waste is reported by one facility in France (ROQUETTE Frères), 15 % by one facility in the Netherlands (Cargill Refined Oils Europe) and 13 % by one facility in Spain (AZUCARERA DE JEREZ - CENTRO DE GUADALCACÍN).
8.c 81 % of the domestic transferred hazardous waste is reported by one facility in the Netherlands (FrieslandCampina Kievit (Meppel)). 66 % of the transboundary transferred hazardous waste is reported by one facility in Ireland (Cadbury Ireland Limited), 17 % by one facility in United Kingdom (Dairy Farmers of Britain Ltd, Blaydon Dairy) and 12 % by one facility in Spain (FÁBRICA DE GRANADA).
9.a 26 % of the domestic transferred hazardous waste is reported by one facility in United Kingdom (Waddington & Ledger Ltd), 25 % by one facility in Italy (TEXFER S.P.A. IN LIQUIDAZIONE E AMMINISTRAZIONE STRAORDINARIA) and 10 % by one facility United Kingdom (Polestar UK Print Ltd (Sheffield)).

ETC/ACC - ETC/SCP - ETC/W E-PRTR Review 2009 101/162
Activity Finding
9.c Almost all the total reduction in domestic transferred hazardous waste is related to the reporting of one facility in the Netherlands (DAF Trucks N.V.). The facility reported 1,885,000 tonnes in 2007 and 2617 tonnes in 2008.
9.d 65 % of the transferred non-hazardous waste is reported by one facility in the Netherlands (Aluminium & Chemie Rotterdam BV).
9.e 43 % of the domestic transferred hazardous waste is reported by one facility in the Netherlands (Breko) and 17 % by one facility in Poland (Gdańska Stocznia "Remontowa" im. J. Piłsudskiego S.A.). 64 % of the transboundary transferred hazardous waste is reported by one facility in Spain (NAVANTIA CADIZ) and 25 % by another Spanish facility (NAVANTIA SAN FERNANDO). 63 % of the transferred non-hazardous waste is reported by one facility in Sweden (Götaverken Cityvarvet AB).
Figure D.3 illustrates the distribution of the overall amount of transferred hazardous waste between
recovery and disposal by E-PRTR activity code. In general E-PRTR activity code 2.b (Installations for the
production of pig iron or steel (primary or secondary melting) including continuous casting) has a quite
low disposal rate (15-20 %) in both 2007 and 2008. E-PRTR activities 9.c (Installations for the surface
treatment of substances, objects or products using organic solvents) and 8.b (Treatment and processing
intended for the production of food and beverage) both have significantly different disposal rates in
2007 and 2008. This might indicate reporting errors.
Figure D.3 Distribution of overall hazardous waste transfers on disposal and recovery and development from 2007 to 2008
D.1.1 Significant changes in distribution of waste transfer for recovery and disposal related to country
In this check the distribution of a facility’s waste transfer between disposal and recovery is compared for
2007 and 2008. A large change in the distribution between disposal and recovery (e.g. the majority of
the waste suddenly goes for disposal in 2008 when in 2007 it was recovered), might indicate a reporting

102/162 E-PRTR data review 2009 ETC/ACC - ETC/SCP - ETC/W
error for one of the reporting years. If the distribution changes by at least 50 percentage points and the
total quantity changes at least by 1000 or 5000 tonnes, for hazardous and non-hazardous waste
respectively, the change is considered to be significant. The number of facilities with significant changes
per country is shown in Table D.5.
Table D.5 Number of facilities, where the distribution of waste transfer for disposal and recovery for non-hazardous waste and hazardous waste respectively has changed significantly in the reporting from 2007 to 2008.
Country Number of facilities with changes more than 50 %
and 5000 tonnes
Number of facilities with changes more than 50 % and 1000 tonnes
Austria 1
Belgium 8 8
Cyprus 1
Czech Republic 7 2
Denmark 3 6
Estonia 1
Finland 13 7
France 17 34
Germany 15 37
Greece 1 2
Hungary 6 5
Ireland 5 2
Italy 9 12
Lithuania 2
Luxembourg 1 2
Netherlands 12 8
Norway 6
Poland 12 10
Portugal 5
Romania 1
Sweden 1 2
Slovakia 2 2
Slovenia 1 1
Spain 14 17
Switzerland 0 3
United Kingdom 36 26
Total 167 199
As a part of the stage 2 review process, the countries have received the names and the national identity
code of the facilities that reported major changes between 2007 and 2008 in the distribution of disposal
and recovery of the transferred waste.

ETC/ACC - ETC/SCP - ETC/W E-PRTR Review 2009 103/162
D.2 Comparison of E-PRTR data with other sources and estimates
A number of data review checks have been undertaken by comparing the waste data reported under E-
PRTR with other available information. These checks have been done on facility level for each country
and detailed results at facility level have been reported to each country. The following checks have been
undertaken:
Capacity of incineration plants (E-PRTR Activity 5.b) compared with the 2006 ISWA survey
Comparison of CO2 emissions from waste incineration plants (E-PRTR Activity 5.b), with CO2 estimations
based on the 2006 ISWA survey data
Comparison of CO2 emissions from waste incineration plants (E-PRTR Activity 5.b) with estimations
based on E-PRTR waste transfer data for the same facility
Hazardous waste from incineration plants (E-PRTR Activity 5.b)
Leachate from landfills (E-PRTR Activity 5.d)
The different checks and the review results are presented in the following sections.
D.2.1 Capacity of incineration plants (Activity 5.b) compared with the 2006 ISWA survey
According to the E-PRTR legislation, incineration plants of non-hazardous waste with a capacity of more
than three tonnes per hour have to report releases and transfers, where thresholds are exceeded. The
International Solid Waste Association’s (ISWA) survey from 200640 gives information about each
municipal non-hazardous waste incineration plant in a country related to capacity per hour on each line.
The ISWA survey therefore gives a good indication on whether all 3-ton capacity incineration plants
have reported to the E-PRTR register. The ISWA survey does not cover special plants for hazardous
waste, sewage sludge, agricultural and hospital waste.
In 2008, a total of 356 European facilities reported waste transfer on activity code 5.(b) according to the
E-PRTR. ISWA found 377 plants with a capacity of at least 3 tonnes per hour. The net difference of 21
incineration plants hides a larger gross difference, because not all facilities reported according to the E-
PRTR legislation are included in the ISWA survey and vice versa. Table D.6 shows that for some countries
like Belgium, Denmark, Italy and Sweden the E-PRTR reporting includes a considerably lower number of
incineration plants than the ISWA survey. The explanation for this difference could be that these
facilities are no longer in operation or have releases/transfers below the reporting threshold, but the
difference might also be due to missing reporting.
As a part of the stage 2 review process, the countries have received a link to the name of the
incineration plants of non-hazardous waste included in the ISWA survey.
40 Energy from Waste. State-of-the-Art-Report, 5
th Edition 2006, ISWA.
https://www.iswa.org/en/290/iswa_publications_detailview/publicationdetail/energy-from-waste-state-of-the-art-report-
statistics-5th-edition.html

104/162 E-PRTR data review 2009 ETC/ACC - ETC/SCP - ETC/W
Table D.6 Number of incineration plants of non-hazardous waste reported in 2008 according to the E-PRTR legislation compared with the ISWA survey from 2006.
Country
Capacity higher than 3 tonnes/hour E-PRTR minus ISWA
Number of E-PRTR facilities reporting on activity code
5.(b)
ISWA Waste-to-Energy Plants in Europe operating in 2005 -
capacity > 3tonnes/h Difference
Austria 6 4 2
Belgium 10 18 -8
Czech Republic 3 3 0
Denmark 20 28 -8
Finland 2 1 1
France 126 119 7
Germany 76 59 17
Hungary 1 1 0
Italy 20 45 -25
Netherlands 10 11 -1
Norway 10 8 2
Poland 1 1
Portugal 1 3 -2
Slovak Republic 1 1
Spain 8 10 -2
Sweden 16 23 -7
Switzerland 27 29 -2
United Kingdom 18 15 3
Total 356 377 -21
D.2.2 Comparison of CO2 emissions from waste incineration plants (Activity 5.b), with CO2 estimations based on the 2006 ISWA survey data
The ISWA survey includes the capacity of municipal waste incinerators (non-hazardous waste plants).
Taking into account that the incineration of one metric tonne of waste generates approximately one
tonne of CO2 (sum of fossil and biogenic)41, it could be assumed that an incineration plant with a load
from 11.4 tonnes of waste per hour or above normally produces above 100,000 tonnes CO2 per year (E-
PRTR reporting threshold).
Table D.7 shows that the ISWA survey includes 230 municipal non-hazardous waste incineration plants
with a capacity of at least 12 tonnes per hour (and therefore with an expected CO2 release above the
reporting threshold if working at full capacity). Under E-PRTR, only 123 non-hazardous waste
incineration plants reported CO2 emissions in 2008. This could indicate missing reporting of CO2
emissions, but also that some facilities operate below capacity and therefore produce less CO2.
41 Good Practice Guidance and Uncertainty Management in National Greenhouse Gas Inventories. Emissions from waste incineration
http://www.ipcc-nggip.iges.or.jp/public/gp/bgp/5_3_Waste_Incineration.pdf

ETC/ACC - ETC/SCP - ETC/W E-PRTR Review 2009 105/162
Table D.7 Comparison of CO2 emissions from incineration plants of non-hazardous waste (Activity 5.b), with CO2 estimations based on the 2006 ISWA survey.
E-PRTR ISWA E-PRTR minus ISWA
Country Facilities with activity code 5.(b)
reporting CO2 emissions
Waste-to-Energy Plants 100,000 tonnes CO2 equivalents per year Difference
Capacity higher than 12 tonnes/h
Austria 4 3 1
Belgium 4 9 -5
Czech Republic 2 3 -1
Denmark 1 13 -12
France 32 62 -30
Germany 30 53 -23
Hungary 0 1 -1
Italy 5 21 -16
Luxembourg 1 1
Netherlands 8 10 -2
Norway 0 3 -3
Portugal 0 3 -3
Spain 4 8 -4
Sweden 6 13 -7
Switzerland 18 15 3
United Kingdom 8 13 -5
Total 123 230 -107
As a part of the stage 2 review process, the Member Countries have received the names of plants
included in the ISWA survey with a capacity of at least 12 tonnes per hour that could not be linked to
CO2 emissions reported by facilities under E-PRTR.
D.2.3 Comparison of CO2 emissions from waste incineration plants of non-hazardous waste (Activity 5.b) with estimations based on E-PRTR waste transfer data
The residual waste fraction after incineration will normally amount to 25 - 30 % of the original waste
mass. Taking into account that the incineration of one metric tonne of waste generates approximately
one tonne of CO2 (sum of fossil and biogenic), a facility with a residual waste fraction of more than
25,000 tonnes could therefore be assumed to be above the reporting threshold for CO2 emissions. Table
D.8 shows that 180 incineration plants of non-hazardous waste reported under E-PRTR a waste transfer
of more than 25,000 tonnes. These waste transfers could correspond to transfers of residual waste after
incineration and could therefore indicate missing CO2 emission reporting, as only 123 records of CO2
emissions were reported to the register.
As a part of the stage 2 review process, the countries have received the names and the national identity
code of incineration plants that reported at least 25,000 tonnes of waste transfer to the E-PRTR in 2008
but did not report any CO2 emissions in 2008.

106/162 E-PRTR data review 2009 ETC/ACC - ETC/SCP - ETC/W
Table D.8 Comparison of CO2 emissions from waste incineration plants of non-hazardous waste (Activity 5.b) with CO2 estimations based on E-PRTR waste transfer data for the same facility.
Country 5.(b) Facilities
reporting CO2 emissions
5.(b) facilities reporting waste equal to > incineration of 100,000 tonnes
waste per year ( > 25,000 tonnes residuals/year)
Difference
Austria 4 5 -1
Belgium 4 6 -2
Czech Republic 2 2 0
Denmark 1 10 -9
Finland 0 0 0
France 32 41 -9
Germany 30 56 -26
Hungary 0 1 -1
Italy 5 10 -5
Luxembourg 1 0 1
Netherlands 8 8 0
Norway 0 1 -1
Portugal 0 0 0
Spain 4 7 -3
Sweden 6 7 -1
Switzerland 18 13 5
Poland 0 1 -1
Slovakia 0 1 -1
United Kingdom 8 11 -3
Total 123 180 -57
D.2.4 Hazardous waste from incineration plants of non-hazardous waste (Activity 5.b)
All incineration plants generate hazardous waste from flue gas cleaning. Taking into account that this
waste fraction amounts to approximately 1 % to 5 % of the original waste mass42, the reporting
threshold for E-PRTR (2 tonnes hazardous waste) would be reached for a waste incineration plant with
an annual load between 40 and 200 tonnes (at 5 % and 1 % respectively). Therefore it could be assumed
that all waste incineration plants under activity code 5.(b) should report hazardous waste unless there is
a hazardous waste disposal site at the site of the facility. Table D.9 shows that all together 18 facilities
have not reported any transfer of hazardous waste.
As a part of the stage 2 review process, the countries have received the names and the national identity
code of incineration plants, which have not reported hazardous waste transfers to the E-PRTR in 2008
42 Affaldsteknologi, Copenhagen 1998. Edited by Thomas H. Christensen

ETC/ACC - ETC/SCP - ETC/W E-PRTR Review 2009 107/162
Table D.9 Number of non-hazardous waste incineration plants (Activity 5.b) not reporting generation of hazardous waste
Country Number of plants
Denmark 3
Finland 1
France 1
Germany 1
Norway 1
Poland 1
Sweden 1
Switzerland 7
United Kingdom 2
Total 18
D.2.5 Leachate from landfills (Activity 5.d)
Table D.10 Number of landfills (Activity 5.d) reporting only pollutant transfers in water and no waste transfers or reporting both pollutant transfers in water and waste transfers
Country Landfills reporting
only pollutant transfers and no waste transfers
Landfills reporting both pollutant transfers
and waste transfers
Bulgaria 1
Czech Republic 1
Denmark 1 1
Finland 5
France 10
Germany 13 4
Greece 1
Ireland 1 1
Italy 1 4
Netherlands 1 3
Poland 3 1
Portugal 5 6
Romania 1
Sweden 4 1
Slovakia 1
Slovenia 1 1
Spain 15 2
United Kingdom 10 1
Total 74 26
108/162 E-PRTR data review 2009 ETC/ACC - ETC/SCP - ETC/W
There is an indication that leachate from some landfills has been reported as waste water transfer
(reported as pollutant transfer in water) instead of waste transfer. Landfills that report waste water
transfer could therefore indicate a reporting error. Table D.10 below states the number of landfills that
have reported either only “pollutant transfer in water” or which have reported both “pollutant transfer
in water” and “waste transfer”. In both cases there might be an error in the reporting.
As a part of the stage 2 review process, the countries have received the names and the national identity
code of landfills that reported only pollutant transfer in water or which have reported both pollutant
transfer and waste transfer.

ETC/ACC - ETC/SCP - ETC/W E-PRTR Review 2009 109/162
E Stage 2 Review – Water Comparisons with other data on releases to water
This chapter covers the Stage 2 review of the E-PRTR dataset for the releases to water. The chapter
contains a description of the methodology used and of the summary results obtained in this part of the
informal review.
The Stage 2 review for water covered the following comparisons/evaluations:
Comparison of E-PRTR data with the Urban Waste Water Treatment Directive43 (UWWTD) data on
facility level.
The analysis is focused on
identification of UWWTPs which are potentially missing from the E-PRTR dataset (based on the
reported information under the UWWTP Directive) and
comparison of the release data from both datasets.
Comparison of the E-PRTR data with the State of Environment (SoE) emissions data44 set on River Basin
District (RBD) level.
The analysis deals with identification of possible inconsistencies between the E-PRTR and SoE emissions
datasets in total release data on nutrients (Total N, Total P) and TOC.
Evaluation of pollutants which might be missing for reported E-PRTR facilities (with a main focus on
UWWTP).
E.1 Characteristics of the datasets used in the E-PRTR data review
E.1.1 UWWTD database
The database contains data selected from the annual reporting of Member States (MS) as part of the
UWWTD implementation. The UWWTD dataset contains information on agglomerations with generated
load ≥ 2,000 p.e., or < 2,000 p.e. if the load is generated trough a collecting system, UWWTPs connected
to these agglomerations, and the size of the UWWTP according to its entering load and capacity (in p.e.).
Discharges of nutrients (N and P) and organic matter (BOD and COD) (expressed as total annual loads in
tonnes per year) from the UWWTP can be reported on a voluntary basis.
The ID codes are different from those used in the E-PRTR database. However, under the latest reporting
exercise it was made possible to include also E-PRTR facility ID coding (on a voluntary basis). Only three
countries used this option in the 2009 reporting (Portugal, Romania and Slovenia). The dataset used is
the latest dataset available at the time of this report and covers the data from 2007 / 200845 (Table E.1).
The dataset contains reports from 26 of the 27 EU countries (no data was available from the UK at the
time of the analysis).
43 http://rod.eionet.europa.eu/obligations/613 44 http://rod.eionet.europa.eu/obligations/632 45 Publication by end 2010 on: http://www.eea.europa.eu/data-and-maps/data#c5=all&c11=&c17=&c0=5

110/162 E-PRTR data review 2009 ETC/ACC - ETC/SCP - ETC/W
Table E.1 Reported year of the UWWT Directive dataset
Reported year Countries
2007 Cyprus, Denmark, Estonia, Finland, Greece, Hungary, Ireland, Italy, Latvia, Lithuania, Netherlands, Portugal, Romania and Slovenia
2008 Austria, Belgium, Bulgaria, Czech Republic, France, Germany, Luxembourg, Malta, Poland, Slovakia, Spain and Sweden
E.1.2 SoE Emissions
State of Environment (SoE) emissions data is submitted on an annual basis through the Water
Information System for Europe (WISE)-SoE voluntary reporting process. It contains nutrient (total N,
total P), organic matter (BOD, COD) and hazardous substances emissions discharged to water from point
and diffuse sources, aggregated at the national RBD level. List of hazardous pollutants was published
25.8.2010 in Data Dictionary: Definition of WISE-SoE Reporting: Emissions dataset Version: July 201046.
For the comparative analysis, the most relevant is the data on point sources of pollution, which fall into
3 categories: urban, industrial and other waste-water discharges. Data on the following pollutants has
been used for the comparison: total N, total P and TOC. No other pollutants were included due to the
fact that the year 2008 was the first regular reporting year and the quality of the data for the hazardous
substances was not sufficient to carry out the analysis.
Table E.2 The most frequent pollutants in SoE emissions reporting
Pollutant SoE - number of countries
Ammonium 5
Total nitrogen 13
Total phosphorus 13
Biochemical oxygen demand (BOD) 10
Chemical oxygen demand (COD) 10
Total organic carbon 4
Cadmium 12
Zinc 12
Copper 11
Lead 11
Mercury 11
Nickel 11
total suspended solids 6
1,2-dichloroethane 5
Anthracene 5
Benzene 5
Cyanide 5
Toluene 5
46 http://dd.eionet.europa.eu/dataset.jsp?mode=view&ds_idf=Emissions.
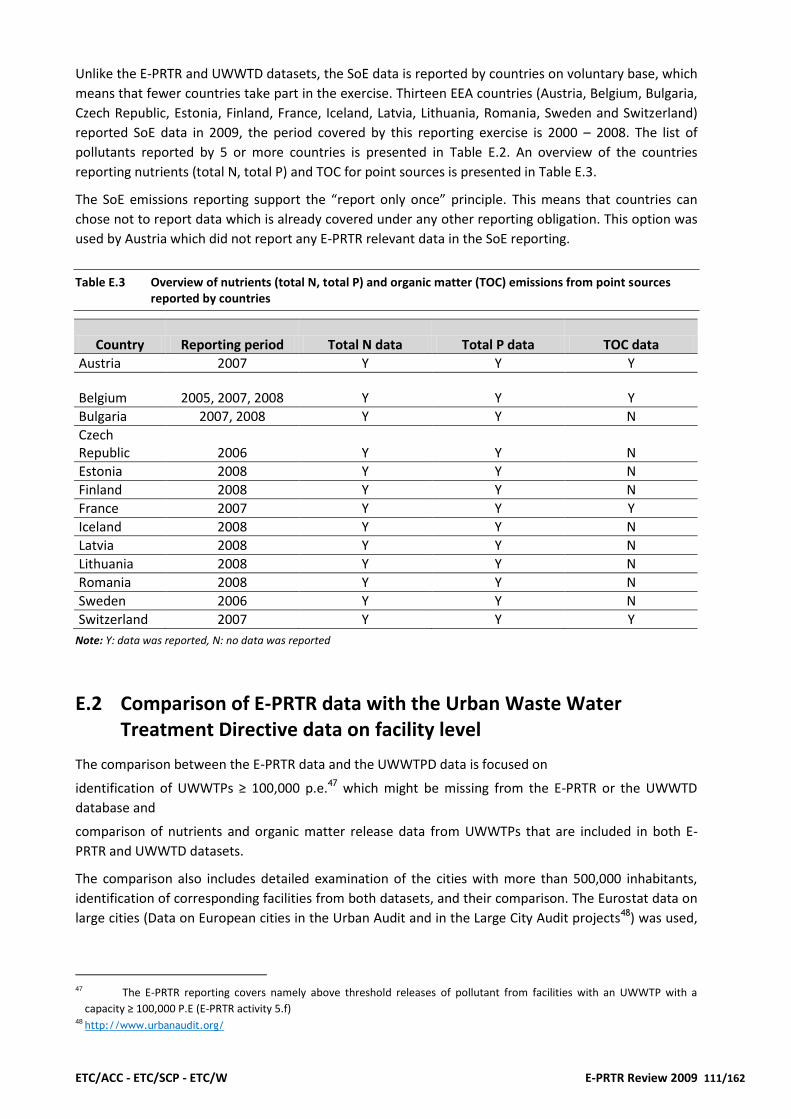
ETC/ACC - ETC/SCP - ETC/W E-PRTR Review 2009 111/162
Unlike the E-PRTR and UWWTD datasets, the SoE data is reported by countries on voluntary base, which
means that fewer countries take part in the exercise. Thirteen EEA countries (Austria, Belgium, Bulgaria,
Czech Republic, Estonia, Finland, France, Iceland, Latvia, Lithuania, Romania, Sweden and Switzerland)
reported SoE data in 2009, the period covered by this reporting exercise is 2000 – 2008. The list of
pollutants reported by 5 or more countries is presented in Table E.2. An overview of the countries
reporting nutrients (total N, total P) and TOC for point sources is presented in Table E.3.
The SoE emissions reporting support the “report only once” principle. This means that countries can
chose not to report data which is already covered under any other reporting obligation. This option was
used by Austria which did not report any E-PRTR relevant data in the SoE reporting.
Table E.3 Overview of nutrients (total N, total P) and organic matter (TOC) emissions from point sources reported by countries
Country Reporting period Total N data Total P data TOC data
Austria 2007 Y Y Y
Belgium 2005, 2007, 2008 Y Y Y
Bulgaria 2007, 2008 Y Y N
Czech Republic 2006 Y Y N
Estonia 2008 Y Y N
Finland 2008 Y Y N
France 2007 Y Y Y
Iceland 2008 Y Y N
Latvia 2008 Y Y N
Lithuania 2008 Y Y N
Romania 2008 Y Y N
Sweden 2006 Y Y N
Switzerland 2007 Y Y Y
Note: Y: data was reported, N: no data was reported
E.2 Comparison of E-PRTR data with the Urban Waste Water Treatment Directive data on facility level
The comparison between the E-PRTR data and the UWWTPD data is focused on
identification of UWWTPs ≥ 100,000 p.e.47 which might be missing from the E-PRTR or the UWWTD
database and
comparison of nutrients and organic matter release data from UWWTPs that are included in both E-
PRTR and UWWTD datasets.
The comparison also includes detailed examination of the cities with more than 500,000 inhabitants,
identification of corresponding facilities from both datasets, and their comparison. The Eurostat data on
large cities (Data on European cities in the Urban Audit and in the Large City Audit projects48) was used,
47 The E-PRTR reporting covers namely above threshold releases of pollutant from facilities with an UWWTP with a
capacity ≥ 100,000 P.E (E-PRTR activity 5.f) 48 http://www.urbanaudit.org/

112/162 E-PRTR data review 2009 ETC/ACC - ETC/SCP - ETC/W
including the city boundaries geographical layer. Also, the E-PRTR IDs were compared for those
countries/facilities that reported them under the UWWTD.
E.2.1 Data selection criteria for UWWT Directive and E-PRTR datasets
For the comparison between the E-PRTR and UWWT Directive data on UWWTP, the specific selection
criteria were used for both datasets:
The UWWTPs were divided into categories by size:
Category I – capacity ≥ 100,000 p.e.
Category II – capacity 50,000 – 100,000 p.e. with entering load > 100,000 p.e.
Category III – capacity and entering load > 50,000 p.e., but not covered in I or II Category IV – the
rest of facilities (with only a small probability to be found in E-PRTR dataset)
Some countries have not provided any data on capacity or UWWTP entering load. In these cases,
all data has been used.
For the E-PRTR data selection the following criteria were applied:
Category A - facilities with E-PRTR main industrial activity 5.f (UWWTP)
Category B - facilities with E-PRTR secondary industrial49 activity 5.f
Category C - facilities without an E-PRTR activity 5.f, but with NACE-codes (economic activity)
36.00 (Water collection, treatment and supply) or 37.00 (Sewerage)
The E-PRTR data were not divided into categories according to size (no information about the
exact size is available under E-PRTR), instead the criteria reflect the probability of the facility
serving as UWWTP.
A summary table of the number of UWWT plants for each category of the E-PRTR and the UWWT
Directive dataset is included in Appendix VII.
E.2.2 Analytical procedure used
The procedure contains 4 steps:
Step 1: Detailed analysis of UWWTPs for cities with more than 500.000 inhabitants.
Step 2: Comparative geographical analysis - identification of corresponding UWWTPs from E-PRTR and
UWWT Directive datasets.
Step 3: Comparison of nutrient release data for the identified corresponding UWWTPs (if available in the
UWWT Directive dataset).
Step 4: Comparison of IDs reported in the UWWTD dataset with the reported E-PRTR IDs.
Step 1: Detailed analysis of UWWTPs for cities with more than 500.000 inhabitants
Detailed analysis was done for cities with more than 500,000 inhabitants, as these cities are likely to
have at least one UWWTP ≥ 100,000 p.e. The following steps were applied:
From the Eurostat data on large cities (Data on European cities in the Urban Audit and in the Large City
Audit project50), the cities with more than 500.000 inhabitants were selected. These were
complemented with cities with more than 500.000 inhabitants which were reported under UWWTD.
49 Secondary activity refers to the fact that the E-PRTR activity was reported as an activity taking place at the site of the facility
but that the activity was not reported as the main activity of the facility

ETC/ACC - ETC/SCP - ETC/W E-PRTR Review 2009 113/162
The UWWTPs found both in the E-PRTR and UWWTD datasets were assigned to the cities polygons (ESRI
maps 1 : 1,000,00051).
Step 2: Geographical analysis
In Step 2, the analysis deals with other E-PRTR and UWWTD facilities, which were not covered by Step 1.
The geographical analysis was carried out in 3 rounds. Again, the UWWTPs which were positively
interconnected in round 1 were not included in round 2. The same applies for round 2 and 3. In each
run, the locations of selected E-PRTR facilities were compared with those of UWWTPs from the UWWTD
dataset, followed by a manual check of the facility name or other data of the city or agglomeration level.
The buffer for the analysis has been set to 5 km. (This rather large buffer area around the E-PRTR
facilities was used since a buffer of 1 km could only link 68 % of the UWWTPs under both reporting
schemes (although the reporting precision under E-PRTR is set to 500m). Using the 5km buffer, 95 % of
the UWWTP in E-PRTR could be linked to plants in the UWWTP Directive dataset.
Round 1: Interconnection of E-PRTR facilities falling into Category A, B or C (see para 2.1 for definition)
with UWWTPs falling into Category I of the UWWTD dataset (UWWTP with a capacity > 100,000 p.e.).
Round 2: Interconnection of E-PRTR facilities falling into Category A, B or C (see para 2.1 for definition)
with UWWTPs falling into Category II and III of the UWWTD dataset (see para 2.1 for definition).
Round 3: Interconnection of E-PRTR facilities falling into Category A, B or C with UWWTPs falling into
Category IV of the UWWTD dataset (UWWTP with a capacity and entering load < 50,000 p.e. or missing
information).
A specific approach had to be applied for the 35 Romanian facilities. Their coordinate’s format was
broken during the UWWTD reporting procedure, so the facilities needed to be identified manually.
Step 3: Comparison of nutrient release data for the identified corresponding UWWTPs
The comparison of nutrient release data was done only for those countries that reported in the UWWTD
dataset. If the ratio E-PRTR / UWWTD data was < 91 % or > 105 %, the values were considered
inconsistent.
Step 4: Comparison of IDs reported in the UWWTD dataset
In the UWWTD reporting it was made possible for countries to voluntarily report IDs of the E-PRTR
facilities, either in the form of a comment or in the attached file documentation. The approach then was
to go through the comments and file documentation and summarize the information obtained. The
results were then included into the geographical analysis outputs.
50 http://www.urbanaudit.org/ 51 http://www.esri.com/data/data-maps/data-and-maps-dvd.html
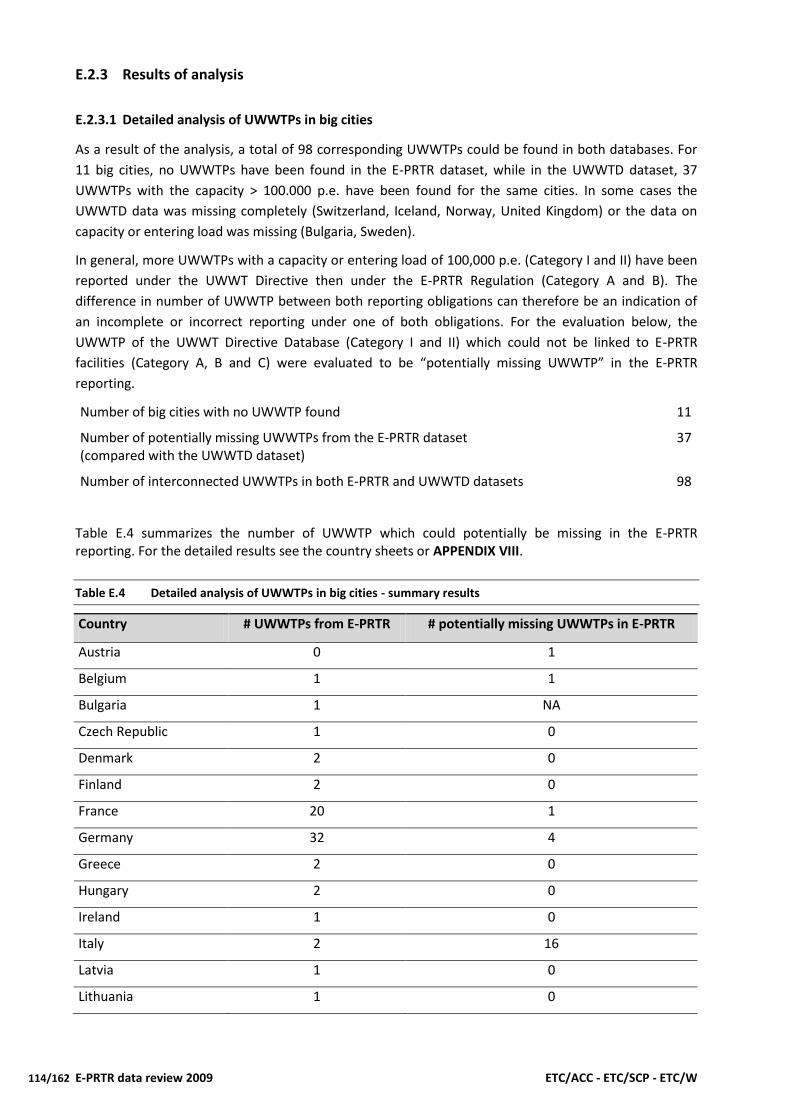
114/162 E-PRTR data review 2009 ETC/ACC - ETC/SCP - ETC/W
E.2.3 Results of analysis
E.2.3.1 Detailed analysis of UWWTPs in big cities
As a result of the analysis, a total of 98 corresponding UWWTPs could be found in both databases. For
11 big cities, no UWWTPs have been found in the E-PRTR dataset, while in the UWWTD dataset, 37
UWWTPs with the capacity > 100.000 p.e. have been found for the same cities. In some cases the
UWWTD data was missing completely (Switzerland, Iceland, Norway, United Kingdom) or the data on
capacity or entering load was missing (Bulgaria, Sweden).
In general, more UWWTPs with a capacity or entering load of 100,000 p.e. (Category I and II) have been
reported under the UWWT Directive then under the E-PRTR Regulation (Category A and B). The
difference in number of UWWTP between both reporting obligations can therefore be an indication of
an incomplete or incorrect reporting under one of both obligations. For the evaluation below, the
UWWTP of the UWWT Directive Database (Category I and II) which could not be linked to E-PRTR
facilities (Category A, B and C) were evaluated to be “potentially missing UWWTP” in the E-PRTR
reporting.
Number of big cities with no UWWTP found 11
Number of potentially missing UWWTPs from the E-PRTR dataset (compared with the UWWTD dataset)
37
Number of interconnected UWWTPs in both E-PRTR and UWWTD datasets 98
Table E.4 summarizes the number of UWWTP which could potentially be missing in the E-PRTR reporting. For the detailed results see the country sheets or APPENDIX VIII.
Table E.4 Detailed analysis of UWWTPs in big cities - summary results
Country # UWWTPs from E-PRTR # potentially missing UWWTPs in E-PRTR
Austria 0 1
Belgium 1 1
Bulgaria 1 NA
Czech Republic 1 0
Denmark 2 0
Finland 2 0
France 20 1
Germany 32 4
Greece 2 0
Hungary 2 0
Ireland 1 0
Italy 2 16
Latvia 1 0
Lithuania 1 0

ETC/ACC - ETC/SCP - ETC/W E-PRTR Review 2009 115/162
Country # UWWTPs from E-PRTR # potentially missing UWWTPs in E-PRTR
Netherland 2 3
Norway 1 NA
Poland 8 0
Portugal 4 1
Romania 0 NA
Spain 19 9
Sweden 0 NA
United Kingdom 16 0
Note: NA: data was not available; Countries not included in the table have no cities> 500.000 inhabitants according to the
Urban Audit in the Large City Audit project52
There is an indication that a number of UWWTPs could be missing from the E-PRTR dataset for 9 out of
the 18 countries covered by the evaluation. Other countries either have no cities > 500.000 inhabitants
according to the Urban Audit in the Large City Audit project (e.g. Cyprus or Slovenia) or did not report
under the UWWTD at all (e.g. Norway) or information about capacity in the UWWTD dataset was
missing (e.g. Romania or Sweden). Each country for which there seem to be missing UWWTPs should
check their reported UWWTPs under E-PRTR.
Detailed information was provided to the countries in the country-specific feedback reports covering the
stage 1 and stage 2 review53 and the accompanying Excel sheets.
E.2.3.2 Geographical analysis
The numbers of categories of E-PRTR facilities and UWWTPs together with analysis results are given in
Table E.5, Figure E.1 and Figure E.2. For detailed results see the country sheets. Table E.5 contains also
the Category C E-PRTR facilities results (facilities without an E-PRTR activity 5.f, but with NACE-codes
(economic activity) 36.00 (Water collection, treatment and supply) or 37.00 (Sewerage)), which are
included in country data sheets (Excel files) but not in the country findings.
Category C E-PRTR facilities as well as UWWTPs from Category III or IV or with no information about
capacity in the UWWTD dataset could not be completely excluded from the analysis. For consistency
reasons, wherever there was a link found for a facility from the above mentioned categories to a
Category I UWWTP or an E-PRTR facility from Category A or B, these facilities entered the analysis as
well.
All UWWTPs from category III or IV from the UWWTD dataset were excluded from the set of potentially
missing E-PRTR facilities. Category C E-PRTR facilities with no interconnection with the UWWTD dataset
are included separately in Table E.5 as they can not be used for indication of potential inconsistencies in
the reporting between UWWTD and E-PRTR.
The numbers and percentage values of potentially missing E-PRTR facilities then indicate potential
inconsistencies between the UWWTD and the E-PRTR datasets. Each country for which there seems to
52 http://www.urbanaudit.org/ 53 Published on 1 September on Eionet CIRCA website at: http://eea.eionet.europa.eu/Members/irc/eionet-circle/e-prtr/library?l=/e-
prtr/country_feedback/2010_2008_dataset/stage_stage_august_2010/country-specific&vm=detailed&sb=Title

116/162 E-PRTR data review 2009 ETC/ACC - ETC/SCP - ETC/W
be an inconsistency should check the UWWTP data reported under both reporting schemes in order to
identify whether the reported data are correct and complete.
The results of the analysis are also presented as maps (Figure E.3, Figure E.4 and Figure E.5).
Table E.5, Figure E.1 and Figure E.2 show UWWTPs that have been reported to E-PRTR by practically all
countries (the exceptions are Cyprus and Malta, where no UWWTPs can reasonably be expected). The
maps in Figure E.3, Figure E.4 and Figure E.5 however show considerable local differences. For example
in Italy: UWWTPs reported under the UWWTD are quite evenly distributed across the country while
there are practically no reported UWWTPs in the south of the country in E-PRTR.
Generally, UWWTPs with the capacity or entering load > 100.000 p.e. are more likely to be reported
under UWWTD then E-PRTR. Only Denmark, Italy, Poland and Spain reported more then 2 (and less than
5) E-PRTR facilities with main or secondary activity 5.f) for which there was no corresponding facility
found in the UWWTD dataset. The data completeness can not be evaluated for Bulgaria and Sweden,
which provided incomplete data to the UWWTD database (information on capacity is missing). The most
UWWTPs with the capacity or entering load > 100.000 p.e. according to UWWTD database for which
there was no corresponding facility found in E-PRTR are located in Austria, Italy and Spain.
The geographical analysis does not include Island, Norway, Switzerland and the United Kingdom which
either do not report under UWWTD or the data was not available at the time of the analysis.

ETC/ACC - ETC/SCP - ETC/W E-PRTR Review 2009 117/162
Table E.5 Summary results of comparative analysis of E-PRTR facilities and UWWTPs from the UWWT Directive dataset
Country
Comparison of UWWTPs
All
po
siti
vely
inte
rse
cted
pla
nts
E
-PR
TR f
acili
tie
s in
cate
gory
A o
r B
wit
ho
ut
link
to
UW
WTD
E-P
RTR
fac
iliti
es
in
cate
gory
C w
ith
ou
t
link
to U
WW
TD
Exp
ecte
d E
-PR
TR
pla
nts
acc
ord
ing
UW
WTD
Eex
isti
ng
faci
litie
s in
E-P
RTR
% o
f ex
isti
ng
faci
litie
s
in E
-PR
TR
Austria 13 0 1 33 13 39%
Belgium 18 1 0 17 14 82%
Bulgaria 12 no data no data no data no data no data
Cyprus 0 0 0 0 0 0%
Czech Republic 18 0 0 26 18 69%
Denmark 32 4 2 30 27 90%
Estonia 4 0 0 7 4 57%
Finland 17 0 1 14 12 86%
France 107 2 6 135 105 78%
Germany 205 0 1 247 202 82%
Greece 8 0 0 12 4 33%
Hungary 21 1 0 22 18 82%
Iceland no data no data no data no data no data no data
Ireland 2 2 0 7 2 29%
Italy 30 5 4 178 29 16%
Latvia 1 0 0 7 1 14%
Lithuania 3 2 0 9 3 33%
Luxembourg 2 0 0 2 0 0%
Malta 0 0 0 1 0 0%
Netherlands 58 2 3 61 50 82%
Norway no data no data no data no data no data no data
Poland 66 5 2 102 62 61%
Portugal 21 0 0 32 21 66%
Romania 18 1 0 31 16 52%
Slovakia 5 0 0 5 5 100%
Slovenia 5 0 0 15 5 33%
Spain 77 3 0 192 76 40%
Sweden 10 no data no data no data no data no data
Switzerland no data no data no data no data no data no data
United Kingdom no data no data no data no data no data no data
All countries 753 28 20 1185 687 58%
Legend
Positively intersected plants E-PRTR facilities (category A, B or C) linked to plants (all size categories) from UWWT Directive dataset.
E-PRTR facilities in category A or B without link to UWWTD
E-PRTR facilities (category A or B) not linked to plants from UWWT Directive dataset. It can indicate an inconsistency in the reporting between UWWTD and E-PRTR.
E-PRTR facilities in category C without link to UWWTD
E-PRTR facilities (category C) not linked to plants from UWWT Directive dataset. It does not indicate an inconsistency in the reporting between UWWTD and E-PRTR.
Expected E-PRTR plants according UWWTD
UWWTPs (all linked + plants category I or II without link ) from UWWT Directive dataset.
Existing facilities in E-PRTR Number of E-PRTR facilities linked to plants (size category I and II) from UWWT Directive dataset.
% of existing facilities in E-PRTR % of E-PRTR facilities linked to plants (size category I and II) from UWWT Directive dataset. Less than 100% can indicate an inconsistency in the reporting between UWWTD and E-PRTR.

118/162 E-PRTR data review 2009 ETC/ACC - ETC/SCP - ETC/W
Figure E.1 Number of corresponding facilities and count of E-PRTR facilities (category A and B or C) without link to UWWT Directive dataset
0
50
100
150
200
250
Au
stri
a
Be
lgiu
m
Bu
lgar
ia
Cyp
rus
Cze
ch R
ep
ub
lic
De
nm
ark
Esto
nia
Fin
lan
d
Fran
ce
Ge
rman
y
Gre
ece
Hu
nga
ry
Ice
lan
d
Ire
lan
d
Ital
y
Latv
ia
Lith
uan
ia
Luxe
mb
ou
rg
Mal
ta
Ne
the
rlan
ds
No
rway
Po
lan
d
Po
rtu
gal
Ro
man
ia
Slo
vaki
a
Slo
ven
ia
Spai
n
Swe
de
n
Swit
zerl
and
Un
ite
d K
ingd
om
Count of all positively intersected plants
Count of E-PRTR facilities in category A or B without link to UWWTD
Count of E-PRTR facilities in category C without link to UWWTD
Figure E.2 Number of linked E-PRTR facilities according to the UWWTD dataset
0%
10%
20%
30%
40%
50%
60%
70%
80%
90%
100%
Au
stri
a
Be
lgiu
m
Bu
lgar
ia
Cyp
rus
Cze
ch R
ep
ub
lic
De
nm
ark
Esto
nia
Fin
lan
d
Fran
ce
Ge
rman
y
Gre
ece
Hu
nga
ry
Ice
lan
d
Ire
lan
d
Ital
y
Latv
ia
Lith
uan
ia
Luxe
mb
ou
rg
Mal
ta
Ne
the
rlan
ds
No
rway
Po
lan
d
Po
rtu
gal
Ro
man
ia
Slo
vaki
a
Slo
ven
ia
Spai
n
Swe
de
n
Swit
zerl
and
Un
ite
d K
ingd
om
All
cou
ntr
ies
Note: Bulgaria and Sweden did not report capacity of plants in UWWT Directive dataset; Iceland, Norway, Switzerland and
United Kingdom did not report UWWT Directive

ETC/ACC - ETC/SCP - ETC/W E-PRTR Review 2009 119/162
Figure E.3 E-PRTR reported facilities with main or secondary E-PRTR activity 5.f or with NACE code 36.00 (Water collection, treatment and supply) or 37.00 (Sewerage)
Figure E.4 UWWT Directive reported UWWTPs

120/162 E-PRTR data review 2009 ETC/ACC - ETC/SCP - ETC/W
Figure E.5 Intersection of UWWTPs from E-PRTR and UWWT Directive dataset
E.2.3.3 Comparison on released emission data
Released emission data in the UWWTD dataset was reported by the following countries: Czech Republic,
Belgium, Denmark, Estonia, Germany, Italy, Latvia, Lithuania, Luxembourg, Poland, Romania and Spain
reported data on one UWWTP each.
In some cases, the data was probably reported in other units than required: Romania, it seems, reported
practically for all UWWTPs in kg/year instead of tons/year, so for the comparison the values were
adjusted. The Czech Republic probably also reported in an incorrect order of magnitude - for one
UWWTP (Prague) probably in kg/year (as in the case of Romania). It was, however, not a systematic
error - some values were one or two orders of magnitude (10x or 100x) larger, but often for one
determinant only – so the values were not adjusted in this case.
Generally, it can be said that almost all of the release values show major inconsistencies. The release
values represent emission loads, not monitored concentrations, so the likely reason for these
inconsistencies lies in a different calculation method - the release values were calculated from different
types of raw data or different numbers of values per year.
For the detailed results see the country sheets.
E.2.3.4 ID comparison for UWWTPs
From the comments and the documentation of the UWWTD reporting it became clear that some
countries renumbered the identifiers for UWWTD reporting according to E-PRTR, and some others
included the E-PRTR IDs of individual UWWTPs in the comments/documentation.

ETC/ACC - ETC/SCP - ETC/W E-PRTR Review 2009 121/162
The analysis gave the following results:
Austria renumbered its UWWTPs but not according to E-PRTR. The new code in the UWWTD dataset is
always in the form ATTP_6-M3231731R0 or ATTP_6-362, while the E-PRTR ID is in the form of a 10 digits
code, sometimes divided by a separator. Therefore, ID comparison could not be conducted.
Portugal reported the national identifiers and included the E-PRTR IDs in the comment accompanying
each facility, so that the identifiers could be automatically linked to those in E-PRTR. This enabled the
confirmation of the geographical analysis outputs.
Romania used the E-PRTR identifier as a national identifier for the UWWTD database, so that the
identifiers could be automatically linked. This enabled the confirmation of the geographical analysis
outputs as well as linking one more E-PRTR facility, which was however not of A, B or C category and
therefore could not be included into the set of corresponding facilities.
Slovenia left the facilities their national identifiers and included the E-PRTR IDs in the accompanying
comments, so that the identifiers could be automatically linked. This enabled the confirmation of the
geographical analysis outputs except for one facility.
Detailed results are included in the “Link with UWWT Directive” Table, which can be found in country
Excel sheets.
E.3 SoE emissions and E-PRTR datasets analysis
The purpose of this analysis was to compare the total emissions released in individual RBDs, reported
under the SoE emissions and the E-PRTR reporting exercises. It is important to note that while the
subject of SoE reporting is total emissions to water, E-PRTR reporting is aimed at the biggest pollutant
producers which report emissions at the facility level and only above the thresholds set for the
individual pollutants.
E.3.1 Data selection criteria and process
SoE emissions
There is a wide scale of reported pollutants in both E-PRTR and SoE Emissions. For the purpose of this
analysis, however, only nutrients (N and P) and TOC have been chosen, for there is considerably more
experience with reporting of these two types of pollutants compared to the rest. Also, the emissions are
reported in kg (or tons)/year and therefore emission loads need to be calculated using monitored
concentrations and the amount of wastewater. These two quantities can vary throughout the year. As a
result, the reported values are associated with substantial uncertainty which rises with lower
concentrations and higher amount of released water. It is also not stated how to deal with
quantification limits when calculating emission loads.
The data from SoE emissions entered the analysis only if the value for an RBD was approximately the
same as the sum of the E-PRTR releases within the same RBD.
The following data has been considered as relevant for the comparative analysis (Table E.6):
U24 Urban Waste Water Treated Discharges > 100 000 p.e.
U14 Urban Waste Water Untreated Discharges > 100 000 p.e. (Almost no data was reported except for
by Romania, because of transitional period of UWWT Directive implementation).
For the purpose of this analysis, codes U24 + U14 represent the sum of UWWTP emission loads in the E-
PRTR dataset.

122/162 E-PRTR data review 2009 ETC/ACC - ETC/SCP - ETC/W
I, I3, I4, O, O5, O6 or PT. For the purpose of this analysis, the data should reach at least the same value
as the sum of releases from facilities not included in the 5.f activity.
If there were more values available for industrial or other wastewater in one RBD, their sum was used.
While SoE data was reported in 2009, its time coverage is scattered over the period of 2000 – 2008. In
case of more reported years for one RBD, 2008 data was preferred. If only older data was available, it
was used as well.
E-PRTR
Table E.6 SoE emissions code list for point emissions sources
Code Name Definition
U21 Urban Waste Water Treated Discharges < 2 000 p.e.
U22 Urban Waste Water Treated Discharges 2 000 ≥ p.e. ≤ 10 000
U23 Urban Waste Water Treated Discharges 10 000 > p.e.≤ 100 000
U24 Urban Waste Water Treated Discharges > 100 000 p.e.
U2 Urban Waste Water Treated Discharges total
Refers to the discharge of municipal waste water following treatment in an UWWTP. Such wastewater may have come originally from domestic and industrial sources. In addition, it includes any urban runoff, generated during rainfall, which is collected and directed to a treatment plant. Ideally, such treated discharges should not include stormflows that exceed the storage capacity of the system. However, if only combined data is available then please flag.
U11 Urban Waste Water Untreated Discharges < 2 000 p.e.
U12 Urban Waste Water Untreated Discharges 2 000 ≥ p.e. ≤ 10 000
U13 Urban Waste Water Untreated Discharges 10 000 > p.e.≤ 100 000
U14 Urban Waste Water Untreated Discharges > 100 000 p.e.
U1 Urban Waste Water Untreated Discharges total Refers to municipal wastewater that is collected but discharged without treatment.
U Urban Waste Water Discharges total
I3 Industrial Waste Water Treated Discharges Refers only to the discharge of treated industrial waste water from independently operated industrial WWTPs and not that discharged from municipal treatment plants.
I4 Industrial Waste Water Untreated Discharges Refers to discharges of industrial wastewater that remain untreated.
I Industrial Waste Water Discharges total
O5 Other Waste Water Treated Discharges
O6 Other Waste Water Untreated Discharges
O Other Waste Water Discharges total
PT Point Sources to Inland Surface Water total
G7 Point Sources to Groundwater total
D0 Direct Discharges to Coastal and Transitional Water total
R Riverine Input to Coastal Water
All E-PRTR data on releases to water was used. For the purpose of the comparison the data was
aggregated on the individual RBDs level (based on attributes), and also divided into UWWTP and other
facilities datasets. Three figures were attributed to each RBD:
Sum of releases from all facilities
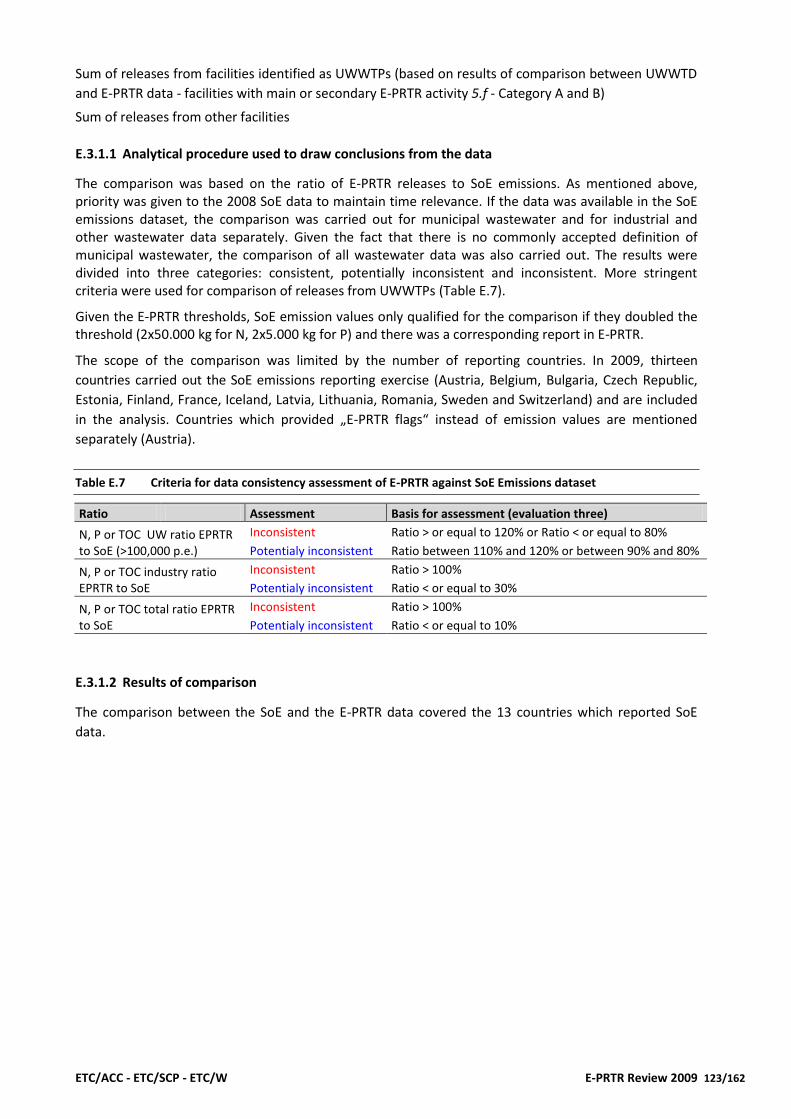
ETC/ACC - ETC/SCP - ETC/W E-PRTR Review 2009 123/162
Sum of releases from facilities identified as UWWTPs (based on results of comparison between UWWTD
and E-PRTR data - facilities with main or secondary E-PRTR activity 5.f - Category A and B)
Sum of releases from other facilities
E.3.1.1 Analytical procedure used to draw conclusions from the data
The comparison was based on the ratio of E-PRTR releases to SoE emissions. As mentioned above, priority was given to the 2008 SoE data to maintain time relevance. If the data was available in the SoE emissions dataset, the comparison was carried out for municipal wastewater and for industrial and other wastewater data separately. Given the fact that there is no commonly accepted definition of municipal wastewater, the comparison of all wastewater data was also carried out. The results were divided into three categories: consistent, potentially inconsistent and inconsistent. More stringent criteria were used for comparison of releases from UWWTPs (Table E.7).
Given the E-PRTR thresholds, SoE emission values only qualified for the comparison if they doubled the threshold (2x50.000 kg for N, 2x5.000 kg for P) and there was a corresponding report in E-PRTR.
The scope of the comparison was limited by the number of reporting countries. In 2009, thirteen
countries carried out the SoE emissions reporting exercise (Austria, Belgium, Bulgaria, Czech Republic,
Estonia, Finland, France, Iceland, Latvia, Lithuania, Romania, Sweden and Switzerland) and are included
in the analysis. Countries which provided „E-PRTR flags“ instead of emission values are mentioned
separately (Austria).
Table E.7 Criteria for data consistency assessment of E-PRTR against SoE Emissions dataset
Ratio Assessment Basis for assessment (evaluation three)
N, P or TOC UW ratio EPRTR to SoE (>100,000 p.e.)
Inconsistent Ratio > or equal to 120% or Ratio < or equal to 80%
Potentialy inconsistent Ratio between 110% and 120% or between 90% and 80%
N, P or TOC industry ratio EPRTR to SoE
Inconsistent Ratio > 100%
Potentialy inconsistent Ratio < or equal to 30%
N, P or TOC total ratio EPRTR to SoE
Inconsistent Ratio > 100%
Potentialy inconsistent Ratio < or equal to 10%
E.3.1.2 Results of comparison
The comparison between the SoE and the E-PRTR data covered the 13 countries which reported SoE
data.

124/162 E-PRTR data review 2009 ETC/ACC - ETC/SCP - ETC/W
Table E.8 Inconsistencies on RBD level for total nitrogen and phosphorus
# of RBD compared # of RBD with inconsistencies
Nitrogen
- UWWTP > 100,000 p.e. 12 5
- Industrial 24 3
- Total 45 8
Phosphorus
- UWWTP > 100,000 p.e. 11 5
- Industrial 26 4
- Total 45 6
Note: number of RBD compared is the number of RBD for which both SoE and E-PRTR data were available across the 13
countries which reported SoE data
The comparison between SoE and E-PRTR data shows a number of inconsistencies for the reporting of
total nitrogen and total phosphorus releases. An overview of the number of the inconsistencies on RBD
level is provided in Table E.8.
For the urban waste water treatment plants the differences in definition of the facility as such and of
which releases are reported (including spill-over, accidental releases, etc.) can be a reason for the
inconsistencies. Regarding the releases from industry, it is expected that the releases reported under E-
PRTR are lower than under the SoE reporting. Reported industrial releases of N and P are however
significantly higher under E-PRTR for a number of RBD in Belgium, France, Switzerland and Lithuania.
When looking at releases from all sources, a number of countries (Belgium, Bulgaria, France, Iceland and
Switzerland) have significantly higher releases under E-PRTR compared to under the SoE reporting.
TOC releases were compared for the four countries which reported TOC under the SoE reporting. The
comparison showed a high inconsistency for nearly all the RBDs in Belgium, France and Switzerland. For
Austria the data reported under E-PRTR and SoE appear to be consistent.
It needs to be noted that for a number of countries, the inconsistency can be due to the fact that
different reporting years were compared, namely 2008 for E-PRTR with 2007, 2006 or 2005 for SoE. This
is the case for Austria, Belgium, Bulgaria, Czech Republic, France, Switzerland and Sweden.
Each country for which there seems to be an inconsistency should evaluate the discharged data
reported under both reporting schemes in order to identify whether the reported data are correct and
complete.
An overview of the comparison results is provided in APPENDIX IX, APPENDIX X and APPENDIX XI for N
P and TOC, respectively. Feedback was also provided to the countries concerned in the country-specific
feedback reports covering the stage 1 and stage 2 review54.
E.4 Identification of pollutants which might be missing for reported E-PRTR facilities
Even if a facility reports to E-PRTR, some pollutants may not be reported, or, if reported, the values may
not reflect the real situation (due to e.g. reporting errors). However, without a detailed knowledge of
54 Published on 1 September on Eionet CIRCA website at: http://eea.eionet.europa.eu/Members/irc/eionet-circle/e-prtr/library?l=/e-
prtr/country_feedback/2010_2008_dataset/stage_stage_august_2010/country-specific&vm=detailed&sb=Title

ETC/ACC - ETC/SCP - ETC/W E-PRTR Review 2009 125/162
the facility, completeness of its pollutants list as well as reported values cannot be evaluated as correct
or incorrect as BAT allows many technologies to be deployed, pollutant combinations and
concentrations differ for each source and there is a major difference between an UWWTP and an
industrial facility in terms of pollutant releases. This methodology is thus limited to an indication of
expected pollutants, or, when the data allows, to a rough indication of expected annual loads.
The analysis was carried out separately for UWWTPs and other industrial facilities due to the different
character of released waste-water.
E.4.1 Expected pollutants in UWWTPs
E.4.1.1 Issues to be considered
1. Non-existence of a common definition of an UWWTP at the European level
This situation can lead to inconsistencies in facility classification for the purposes of the relevant
Directives.
2. Difference between capacity and entering load
According to the E-PRTR Regulation all UWWTPs > 100.000 p.e. and releases above thresholds are
subject to reporting. Where the emission load data is available in the UWWTD dataset it can be
compared to E-PRTR thresholds. For those countries which do not include the release data in their
UWWTD reporting, emission load can be estimated by the facility p.e. number. In many UWWTPs,
however, there can be quite a difference between capacity and actual entering load. In case the
entering load is substantially lower then the capacity, it can be anticipated that the release to water for
nutrients or TOC is below thresholds. The data in the UWWTD dataset shows that 14% of UWWTPs with
capacity > 100.000 p.e. report entering load < 80.000 p.e.
3. Determination of other pollutants in UWWTP effluent
Municipal waste water is characterized by the share of domestic waste water, industrial waste water
and often also by urban run-off generated during rainfall. While nutrients are the main pollutants
generally found in domestic waste water, the composition of connected industrial wastewater differs for
each agglomeration. The third component, urban run-off generated during rainfall, most often contains
substances coming from atmospheric deposition (metals) or chlorides (salt used for the winter road
maintenance). Here, the identification or quantification of expected pollutants would be unfeasible
without a detailed knowledge of the particular UWWTP.
E.4.1.2 Analytical procedure used to draw conclusions from the data
Determination of N and P and its quantification in UWWTP effluent:
On the basis of known concentration in the inflow (or derived from the JQ Eurostat55 defined population
equivalent) the approximate inflow of an UWWTP for 100,000 p.e. (Table E.9) can be calculated.
Expected N and P discharge can then be determined based on known average treatment efficiency
(Table E.10 and Table E.11).
55
http://circa.europa.eu/Public/irc/dsis/envirmeet/library?l=/meetings_2008_archive/statistics_09-
101008/background_documents/jq_iwa_2008_v2pdf/_EN_2.0_&a=d

126/162 E-PRTR data review 2009 ETC/ACC - ETC/SCP - ETC/W
Table E.9 Load entering an UWWTP (capacity 100,000 p.e.)
Pollutant 1 p.e. g/p.e./day UWWTP serving 100,000 p.e. tonnes/year
BOD5 60 2190
N 12 438
P 2.5 91.25
COD 109 3978.5
TOC 40 1460
Note: ratio BOD/COD=0.55, ratio BOD/TOC=1,5
The E-PRTR thresholds for N and P are 50.000 and 5.000 kg/year respectively. If the entering load is at
least 100, 000 p.e. calculated by using the value of 60 g BOD5 , and if the MS do not operate UWWTPs
with significantly higher treatment efficiency, all reported UWWTP releases should exceed the
thresholds.
However, this way, only the expected minimal N and P values for the UWWTP included in the E-PRTR
dataset are determined, not the real ones. The technologies for N and P treatment differ, and even if
the sensitive areas measures are applied, not every country in accordance with the Directive reports
both N and P. This means that if only P values are reported by an UWWTP, N values can not be simply
derived from it.
The non-reporting of certain pollutants provides an indication of a potential under-reporting or error in
the dataset which would need to be verified by the competent authority. Where data are available, the
values could be compared with reporting under UWWTPD.
Table E.10 Treatment efficiency of different types of UWWTPs
treatment efficiencies
BOD COD/TOC N P
Primary treatment > 20 % 10 % 10 %
Secondary treatment > 70 % > 75 % 35 % 35 %
More stringent treatment (tertiary)
- of which for Organic pollution > 95 % > 85 %
- of which for Nitrogen > 70 %
- of which for Phosphorus > 80 %

ETC/ACC - ETC/SCP - ETC/W E-PRTR Review 2009 127/162
Table E.11 Expected discharge for different types of UWWTPs and E-PRTR threshold for reporting
UWWTP 100 000 p.e.
expected discharge (t/year)
BOD COD/TOC N P
Primary treatment 1752 394 82
Secondary treatment 657 995/365 285 59
More stringent treatment (tertiary)
- of which for Organic pollution 110 597/219
- of which for Nitrogen 131
- of which for Phosphorus 18
E-PRTR reporting threshold - -/5056
50 5
Specific situation regarding TOC or COD/TOC ratio:
The E-PRTR threshold for TOC is 50,000 kg/year. In case an UWWTP facility in E-PRTR would operate
with an entering load of at least 100,000 p.e., and if the UWWTP does not operate with significantly
higher treatment efficiency, it would exceed the reporting threshold for COD.
It can be determined on the basis of population equivalents or on the basis of known concentration of a
particular pollutant (e.g. BOD) and known ratios between the pollutant and other relevant pollutants
(e.g. COD/TOC). The ratios however represent a substantial simplification and should be used with care
on a larger scale (or for international comparisons) as they were derived from datasets of specific waste
water treatment plants. While ratio BOD/COD is widely accepted, opinions regarding ‘reasonability’ of
use of ‘constant’ BOD/TOC are rather diverse among waste water professionals.
Approach applied:
The analysis of the potentially missing pollutants was focused on nutrients and TOC. It was based on the
assumption that, given the average EU figures, every UWWTP releases total N, P and TOC in amounts
exceeding the E-PRTR thresholds if operating with an entering load of at least 100.000 p.e. and if the
UWWTP does not have a significantly higher treatment efficiency than average efficiencies across
Europe. UWWTPs which do not report the expected values are then flagged as potentially under-
reporting. The few exceptions from this assumption are mentioned in the results chapter below.
Only facilities which reported the main or secondary activity as 5.f entered the analysis.
For the assessment, the percentage of facilities with potentially missing nutrients or TOC has been used.
Also the results of comparing the reported releases of UWWTPs against the UWWTD dataset (where
available) have been taken into account.
E.4.1.3 Results of analysis
When assessing the results it is important to take into account the fact that some facilities have capacity >100.00 p.e. but a lower entering load (as reported in UWWTD dataset) and therefore do not necessarily fulfill the assumption of nutrients and TOC releases being above the E-PRTR thresholds.
The evaluation shows that 21 %, 30 % and 26 % of the UWWTP have not reported N, P and TOC releases,
respectively. This is an indication of a potential under-reporting of these pollutants.
56 The TOC threshold in E-PRTR as defined as total C or as COD/3
128/162 E-PRTR data review 2009 ETC/ACC - ETC/SCP - ETC/W
A further assessment of on-country level is necessary since no information is available in the E-PRTR
reporting on effective treatment efficiency and entering load (compared to the capacity).
The overview table including UWWTPs with potentially missing N, P and TOC values can be found below
(Table E.12, Figure E.6, Figure E.7, Figure E.8). For the detailed results see the country sheets.
For certain countries the comparison with the UWWTP data showed a higher UWWTP efficiency than
the EU average. This information is included in the comments for the individual country57.
57 Published on 1 September on Eionet CIRCA website at: http://eea.eionet.europa.eu/Members/irc/eionet-circle/e-prtr/library?l=/e-
prtr/country_feedback/2010_2008_dataset/stage_stage_august_2010/country-specific&vm=detailed&sb=Title

ETC/ACC - ETC/SCP - ETC/W E-PRTR Review 2009 129/162
Table E.12 Summary table with potentially missing N, P and TOC values in E-PRTR facilities with main or secondary E-PRTR activity 5.f)
Country Code # UWWTPs # potentially
missing N
% potentially missing N
# potentially missing P
% potentially missing P
# potentially missing TOC
% potentially
missing TOC
Austria 12 2 17% 6 50% 0 0%
Belgium 18 1 6% 3 17% 2 11%
Bulgaria 12 3 25% 0 0% 6 50%
Cyprus 0 0 0 0
Czech Republic 17 7 41% 9 53% 8 47%
Denmark 36 26 72% 27 75% 14 39%
Estonia 4 1 25% 2 50% 0 0%
Finland 17 0 0% 11 65% 3 18%
France 102 31 30% 30 29% 7 7%
Germany 203 45 22% 125 62% 49 24%
Greece 8 1 13% 0 0% 4 50%
Hungary 22 5 23% 2 9% 1 5%
Iceland 2 0 0% 0 0% 2 100%
Ireland 4 2 50% 0 0% 2 50%
Italy 31 3 10% 4 13% 14 45%
Latvia 1 0 0% 0 0% 0 0%
Lithuania 5 0 0% 2 40% 4 80%
Luxembourg 2 0 0% 0 0% 0 0%
Malta 0 0 0 0
Netherlands 45 11 24% 6 13% 3 7%
Norway 7 3 43% 0 0% 7 100%
Poland 67 20 30% 27 40% 38 57%
Portugal 21 1 5% 0 0% 2 10%
Romania 17 5 29% 3 18% 12 71%
Slovakia 5 0 0% 0 0% 2 40%
Slovenia 5 1 20% 0 0% 0 0%
Spain 80 20 25% 1 1% 28 35%
Sweden 10 1 10% 8 80% 4 40%
Switzerland 15 0 0% 4 27% 6 40%
United Kingdom 137 4 3% 5 4% 14 10%
All countries 905 193 21% 275 30% 232 26%

130/162 E-PRTR data review 2009 ETC/ACC - ETC/SCP - ETC/W
Figure E.6 E-PRTR facilities with main or secondary activity 5.f with potentially missing release report for total nitrogen (% compared to total E-PRTR facilities with main or secondary activity 5.f)
0%
10%
20%
30%
40%
50%
60%
70%
80%
90%
100%
Austr
ia
Belg
ium
Bulg
aria
Cypru
s
Czech R
epublic
Denm
ark
Esto
nia
Fin
land
Fra
nce
Germ
any
Gre
ece
Hungary
Icela
nd
Irela
nd
Italy
Latv
ia
Lithuania
Luxem
bourg
Malta
Neth
erlands
Norw
ay
Pola
nd
Port
ugal
Rom
ania
Slo
vakia
Slo
venia
Spain
Sw
eden
Sw
itzerland
United K
ingdom
All
countr
ies
Note: Cyprus and Malta did not report any UWWTPs under E-PRTR.
Figure E.7 E-PRTR facilities with main or secondary activity 5.f with potentially missing release report for total phosphorus (% compared to total E-PRTR facilities with main or secondary activity 5.f)
0%
10%
20%
30%
40%
50%
60%
70%
80%
90%
100%
Austr
ia
Belg
ium
Bulg
aria
Cypru
s
Czech R
epublic
Denm
ark
Esto
nia
Fin
land
Fra
nce
Germ
any
Gre
ece
Hungary
Icela
nd
Irela
nd
Italy
Latv
ia
Lithuania
Luxem
bourg
Malta
Neth
erlands
Norw
ay
Pola
nd
Port
ugal
Rom
ania
Slo
vakia
Slo
venia
Spain
Sw
eden
Sw
itzerland
United K
ingdom
All
countr
ies
Note: Cyprus and Malta did not report any UWWTPs under E-PRTR.

ETC/ACC - ETC/SCP - ETC/W E-PRTR Review 2009 131/162
Figure E.8 E-PRTR facilities with main or secondary activity 5.f with potentially missing release report for total organic carbon (% compared to total E-PRTR facilities with main or secondary activity 5.f)
0%
10%
20%
30%
40%
50%
60%
70%
80%
90%
100%
Austr
ia
Belg
ium
Bulg
aria
Cypru
s
Czech R
epublic
Denm
ark
Esto
nia
Fin
land
Fra
nce
Germ
any
Gre
ece
Hungary
Icela
nd
Irela
nd
Italy
Latv
ia
Lithuania
Luxem
bourg
Malta
Neth
erlands
Norw
ay
Pola
nd
Port
ugal
Rom
ania
Slo
vakia
Slo
venia
Spain
Sw
eden
Sw
itzerland
United K
ingdom
All
countr
ies
Note: Cyprus and Malta did not report any UWWTPs under E-PRTR.
Comments for individual countries that reported releases to the UWWTD dataset (referring only to the
corresponding facilities found both in E-PRTR and UWWTD datasets):
Czech Republic: According to the UWWTD dataset, all releases from E-PRTR facilities are above the
thresholds. However, for some reports errors in the same order of magnitude are suspected.
Germany: According to the UWWTD dataset, the UWWTP efficiency is significantly higher than the EU
average, mainly for P. Almost all facilities with missing values for P in E-PRTR declare releases lower than
5.000 kg/year in the UWWTD dataset.
Denmark: According to the UWWTD dataset, the UWWTP efficiency is significantly higher than the EU
average for both N and P. Almost all facilities with missing values for N and P in E-PRTR declare releases
lower than E-PRTR thresholds in the UWWTD dataset.
Estonia: According to the UWWTD dataset, one UWWTP declares release below E-PRTR thresholds.
Italy: According to the UWWTD dataset, one UWWTP declares release below E-PRTR thresholds.
Lithuania: According to the UWWTD dataset, all releases from E-PRTR facilities are above the
thresholds.
Luxembourg: No potentially missing pollutants found.
Latvia: No potentially missing pollutants found.
Poland: According to the UWWTD dataset, the UWWTP efficiency is somewhat higher than the EU
average for both N and P. 10 facilities with missing values for N and P in E-PRTR declare releases lower
than E-PRTR thresholds in the UWWTD dataset.
Romania: According to the UWWTD dataset, all releases from E-PRTR facilities are above the thresholds
except for one.
For other countries it can be said that somewhat higher numbers of facilities with missing pollutants can
be traced to Austria (P), Bulgaria (TOC), Finland (P), France (N and P), Norway (N and TOC), Spain (N and
TOC), Sweden (P) and Switzerland (P and TOC).

132/162 E-PRTR data review 2009 ETC/ACC - ETC/SCP - ETC/W
F Lessons learned/ Next steps
F.1 Lessons learned
The increase of 3 % in the number of facilities between initial submissions of EPER 2007 and E-PRTR
2008 indicated that reporting of data in 2010 improved in most of the countries. The slight decrease in
number of facilities in E-PRTR 2008 compared to the resubmission of E-PRTR 2007 in 2010 is probably
due to incomplete reporting. We assume that data completeness will improve after the review.
Comparing E-PRTR 2007 and 2008 according to release/transfer reports we observe a similar effect: An
increase if comparing the two initial reports and a decease comparing E-PRTR 2008 with the
resubmission 2007. Besides the reason mentioned above it is also possible that in 2008 more
releases/transfers lie below the E-PRTR threshold than in 2007.
According to the E-PRTR submission 2008 a small number of facilities often make a large overall
contribution to the total release/transfer of a certain pollutant in a specific media. For instance, five
large combustion plants were collectively responsible for more than 20 % of all E-PRTR SO2 emissions to
air, another five facilities were responsible for 33 % of total NH3 emissions to air.
Moreover, almost 30 % of total N2O, respectively 33 % of total CH4 E-PRTR emissions were produced by
five facilities only. Within the group of heavy metals the top five facilities contributed between 16 and
34 % to total E-PRTR emissions.
A number of pollutants was reported by one single facility or by one single country in Europe. For other
pollutants individual facilities seem to produce more than 50 % of total emissions in Europe (e.g., 77 %
of PCDD/PCDF emissions was reported by a facility in Portugal; 64 % of HCB emissions by a facility in
Belgium). Such findings have to be further investigated by Parties since they might indicate that a) the
concerning E-PRTR thresholds are too high, b) reporting in other countries is not complete c) there are
errors in reported data (e.g. wrong units) and/or d) emissions are not reported under the correct activity
and/or media.
The review observes constraints concerning the comparability with emissions reported under CLRTAP
and UNFCCC due to the differing structure of the reported data. The assessment of the comparison of
EU-ETS and E-PRTR is also limited by the different definition of sectors (EU ETS) and activities (E-PRTR).
The 2009 review highlighted a number of anomalies which could be corrected and as follow-up a
number of countries resubmitted more consistent 2007 E-PRTR data. However, the Stage 1 review in
2010 again revealed a number of data anomalies that were communicated to E-PRTR countries giving
them the opportunity to improve their 2008 E-PRTR data until the resubmission deadline in fall 2010.
The stage 2 review highlighted potential inconsistencies in reporting under different obligations, which
also have to be checked by countries.
Some data has not been imported in the E-PRTR register due to technical issues related to the data
format, confidentiality claims or delays in data collection, validation and compilation58. This has an effect
on the completeness of the E-PRTR 2007 and E-PRTR 2008 datasets and thus influences the results of
the review. These technical problems are expected to be mostly solved for the submission of the 2009
dataset during 2011 reporting round.
58 For those data, reporting countries have provided a list of facility names, which can be found at:
http://eea.eionet.europa.eu/Members/irc/eionet-circle/e-prtr/library?l=/e-
prtr/country_feedback/2010_2008_dataset/stage_stage_august_2010/incompleteness_e-
prtr/facilities_germanypdf/_EN_1.0_&a=d”
ETC/ACC - ETC/SCP - ETC/W E-PRTR Review 2009 133/162
With the current structure of reporting the review can easily identify outliers. Gaps in reporting are,
however, difficult to detect. Information on production, fuel consumption and thermal capacity of single
facilities could significantly improve the possibility to assess the quality and completeness of reporting
under E-PRTR.
F.2 Next steps
The stage 1 and 2 review of E-PRTR data is planned also for upcoming years. The way the results will be
presented might however change in the future. For future reports it could be considered to also include
information on emissions per capita or area.
The E-PRTR informal review 2011 will be carried out alongside the formal review in accordance with
Article 17 of the E-PRTR Regulation. The informal review is expected to start in 2011 on 1st of May after
the publication of the E-PRTR data (the latest by 30 April 2011).
134/162 E-PRTR data review 2009 ETC/ACC - ETC/SCP - ETC/W
Units and Abbreviations
kg ............................... 1 kilogram = 103 g (gram)
t .................................. 1 tonne (metric) = 1 megagram (Mg) = 106 g
Mg .............................. 1 megagram = 106 g = 1 tonne (t)
Gg ............................... 1 gigagram = 109 g = 1 kilotonne (kt)
Tg ............................... 1 teragram = 1012 g = 1 megatonne (Mt)
TJ ................................ 1 terajoule
As ............................... arsenic
Cd ............................... cadmium
BOD ............................ Biochemical Oxygen Demand
CDR ............................ central data repository of EEA’s Eionet Reportnet
CEIP ............................ EMEP Centre on Emission Inventories and Projections
CH4 ............................. methane
CLRTAP ....................... LRTAP Convention
CO .............................. carbon monoxide
CO2 ............................ carbon dioxide
COD ............................ Chemical Oxygen Demand
Cr ............................... chromium
CRF ............................. UNFCCC common reporting format for greenhouse gases
Cu ............................... copper
DDT dichlorodiphenyltrichloroethane
EEA ............................. European Environment Agency
EEA ............................. European Economic Area
EFTA ........................... European Fair Trade Association
Eionet European Environment Information and Observation Network
EPER European Pollutant Emission Register
EMEP .......................... Co-operative programme for monitoring and evaluation of the long-range transmissions of air pollutants in Europe
E-PRTR........................ European Pollutant Release and Transfer Register
ETC/ACC ..................... European Topic Centre on Air and Climate Change
EU .............................. European Union
EWL ............................ European Waste List
GHG ........................... greenhouse gas
HCB ............................ hexachloro-benzene
HCFCs ......................... hydrochlorofluorocarbons
HCH ........................... 1,2,3,4,5,6-hexachlorocyclohexane
HFCs .......................... hydrofluorocarbons
HW ............................. hazardous waste
HWIC .......................... hazardous waste (transferred) inside the country
HWOC ........................ hazardous waste (transferred) outside the country (transboundary waste movement)
Hg ............................... mercury
HMs ............................ heavy metals
IOWWTP .................... Independently operated waste water treatment plant
KCA ............................ key category analysis

ETC/ACC - ETC/SCP - ETC/W E-PRTR Review 2009 135/162
LRTAP Convention ..... UNECE Convention on Long-range Transboundary Air Pollution
N2O ............................ nitrous oxide
NACE .......................... Nomenclature statistique des activités économiques dans la Communauté européenne - Nomenclature of economic activities
NECD .......................... National Emission Ceilings Directive (2001/81/EC)
NFR ............................ UNECE nomenclature for reporting of air pollutants
NH3 ............................. ammonia
NHW .......................... non hazardous waste
Ni................................ nickel
NMVOCs .................... non-methane volatile organic compounds
No .............................. number
NO2............................. nitrogen dioxide
NOx ............................. nitrogen oxides
NP .............................. nonylphenol
NPEs ........................... nonylphenol ethoxylates
PAH ............................ polycyclic aromatic hydrocarbons
Pb ............................... lead
PCB ............................. polychlorinated biphenyl
PCDD .......................... polychlorinated dibenzodioxins (PCDDs) - dioxines
PCDF........................... polychlorinated dibenzofurans (PCDF) - furans
PCP ............................. pentachlorophenol
p.e. ............................. population equivalent
PFCs ........................... perfluorocarbons
PM.............................. particulate matter
PM10 ........................... particles measuring 10 µm or less
PM2.5 .......................... particles measuring 2.5 µm or less
POPs ........................... persistent organic pollutants
PRT ............................. pollutant release and transfer (release into air, water, land and transfer in water)
PR ............................... pollutant release
PT ............................... polutant transfer
RBD ............................ river basin district
Se ............................... selenium
SF6 ............................. sulphur hexafluoride
SO2 ............................. sulphur dioxide
SOx ............................. sulphur oxides
SoE ............................. State of the Environment
TOC ........................... total organic carbon
UNECE ........................ United Nations Economic Commission for Europe
UNFCCC ...................... United Nations Framework Convention on Climate Change
UWWTD ..................... Urban Waste Water Treatment Directive
UWWTP ..................... urban waste water treatment plant
VOCs .......................... volatile organic compounds
WFD ........................... Water Framework Directive
WT.............................. waste transfer
w/o............................. without
Zn ............................... zinc
# ................................. number of

136/162 E-PRTR data review 2009 ETC/ACC - ETC/SCP - ETC/W
APPENDIX I– Pollutants* included in E-PRTR
As published 4.2.2006 in Official Journal of the European Union.
No CAS number Pollutant (1)
Threshold for releases (column 1)
to air (column 1a)
kg/year
to water (column 1b)
kg/year
to land (column 1c)
kg/year
1 74-82-8 Methane (CH4) 100 000 — (2) —
2 630-08-0 Carbon monoxide (CO) 500 000 — —
3 124-38-9 Carbon dioxide (CO2) 100 million — —
4 Hydro-fluorocarbons (HFCs) (3) 100 — —
5 10024-97-2 Nitrous oxide (N2O) 10 000 — —
6 7664-41-7 Ammonia (NH3) 10 000 — —
7 Non-methane volatile organic compounds (NMVOC)
100 000 — —
8 Nitrogen oxides (NOx/NO2) 100 000 — —
9 Perfluorocarbons (PFCs) (4) 100 — —
10 2551-62-4 Sulphur hexafluoride (SF6) 50 — —
11 Sulphur oxides (SOx/SO2) 150 000 — —
12 Total nitrogen — 50 000 50 000
13 Total phosphorus — 5 000 5 000
14 Hydrochlorofluorocarbons (HCFCs) (5)
1 — —
15 Chlorofluorocarbons (CFCs) (6) 1 — —
16 Halons (7) 1 — —
17 Arsenic and compounds (as As) (8) 20 5 5
18 Cadmium and compounds (as Cd) (8)
10 5 5
19 Chromium and compounds (as Cr) (8)
100 50 50
20 Copper and compounds (as Cu) (8) 100 50 50
21 Mercury and compounds (as Hg) (8)
10 1 1
22 Nickel and compounds (as Ni) (8) 50 20 20
23 Lead and compounds (as Pb) (8) 200 20 20
24 Zinc and compounds (as Zn) (8) 200 100 100
25 15972-60-8 Alachlor — 1 1
26 309-00-2 Aldrin 1 1 1
27 1912-24-9 Atrazine — 1 1
28 57-74-9 Chlordane 1 1 1
*) Releases of pollutants falling into several categories of pollutants shall be reported for each of these categories.

ETC/ACC - ETC/SCP - ETC/W E-PRTR Review 2009 137/162
No CAS number
Pollutant (1)
Threshold for releases (column 1)
to air (column 1a)
kg/year
to water (column 1b)
kg/year
to land (column 1c)
kg/year
29 143-50-0 Chlordecone 1 1 1
30 470-90-6 Chlorfenvinphos — 1 1
31 85535-84-8 Chloro-alkanes, C10-C13 — 1 1
32 2921-88-2 Chlorpyrifos — 1 1
33 50-29-3 DDT 1 1 1
34 107-06-2 1,2-dichloroethane (EDC) 1 000 10 10
35 75-09-2 Dichloromethane (DCM) 1 000 10 10
36 60-57-1 Dieldrin 1 1 1
37 330-54-1 Diuron — 1 1
38 115-29-7 Endosulphan — 1 1
39 72-20-8 Endrin 1 1 1
40 Halogenated organic compounds (as AOX) (9)
— 1 000 1 000
41 76-44-8 Heptachlor 1 1 1
42 118-74-1 Hexachlorobenzene (HCB) 10 1 1
43 87-68-3 Hexachlorobutadiene (HCBD) — 1 1
44 608-73-1 1,2,3,4,5,6- hexachlorocyclohexane(HCH)
10 1 1
45 58-89-9 Lindane 1 1 1
46 2385-85-5 Mirex 1 1 1
47 PCDD + PCDF (dioxins + furans) (as Teq) (10)
0,0001 0,0001 0,0001
48 608-93-5 Pentachlorobenzene 1 1 1
49 87-86-5 Pentachlorophenol (PCP) 10 1 1
50 1336-36-3 Polychlorinated biphenyls (PCBs) 0,1 0,1 0,1
51 122-34-9 Simazine — 1 1
52 127-18-4 Tetrachloroethylene (PER) 2 000 10 —
53 56-23-5 Tetrachloromethane (TCM) 100 1 —
54 12002-48-1 Trichlorobenzenes (TCBs) (all isomers)
10 1 —
55 71-55-6 1,1,1-trichloroethane 100 — —
56 79-34-5 1,1,2,2-tetrachloroethane 50 — —
57 79-01-6 Trichloroethylene 2 000 10 —
58 67-66-3 Trichloromethane 500 10 —
59 8001-35-2 Toxaphene 1 1 1
60 75-01-4 Vinyl chloride 1 000 10 10
61 120-12-7 Anthracene 50 1 1
62 71-43-2 Benzene 1 000 200 (as BTEX) (11)
200 (as BTEX) (11)
63 Brominated diphenylethers (PBDE) (12)
— 1 1

138/162 E-PRTR data review 2009 ETC/ACC - ETC/SCP - ETC/W
No CAS number
Pollutant (1)
Threshold for releases (column 1)
to air (column 1a)
kg/year
to water (column 1b)
kg/year
to land (column 1c)
kg/year
64 Nonylphenol and Nonylphenol ethoxylates (NP/NPEs)
— 1 1
65 100-41-4 Ethyl benzene — 200 (as BTEX) (11)
200 (as BTEX) (11)
66 75-21-8 Ethylene oxide 1 000 10 10
67 34123-59-6 Isoproturon — 1 1
68 91-20-3 Naphthalene 100 10 10
69 Organotin compounds(as total Sn)
— 50 50
70 117-81-7 Di-(2-ethyl hexyl) phthalate (DEHP)
10 1 1
71 108-95-2 Phenols (as total C) (13) — 20 20
72 Polycyclic aromatic hydrocarbons (PAHs) (14)
50 5 5
73 108-88-3 Toluene — 200 (as BTEX) (11)
200 (as BTEX) (11)
74 Tributyltin and compounds (15) — 1 1
75 Triphenyltin and compounds (16)
— 1 1
76 Total organic carbon (TOC) (as total C or COD/3)
— 50 000 —
77 1582-09-8 Trifluralin — 1 1
78 1330-20-7 Xylenes (17) — 200 (as BTEX) (11)
200 (as BTEX) (11)
79 Chlorides (as total Cl) — 2 million 2 million
80 Chlorine and inorganic com- pounds (as HCl)
10 000 — —
81 1332-21-4 Asbestos 1 1 1
82 Cyanides (as total CN) — 50 50
83 Fluorides (as total F) — 2 000 2 000
84 Fluorine and inorganic compounds (as HF)
5 000 — —
85 74-90-8 Hydrogen cyanide (HCN) 200 — —
86 Particulate matter (PM10) 50 000 — —
87 1806-26-4 Octylphenols and Octylphenol ethoxylates
— 1 —
88 206-44-0 Fluoranthene — 1 —
89 465-73-6 Isodrin — 1 —
90 36355-1-8 Hexabromobiphenyl 0.1 0.1 0.1
91 191-24-2 Benzo(g,h,i)perylene 1
(1) Unless otherwise specified any pollutant specified in Annex II shall be reported as the total mass of that pollutant or,
where the pollutant is a group of substances, as the total mass of the group. (2)
A hyphen (—) indicates that the parameter and medium in question do not trigger a reporting requirement. (3)
Total mass of hydrogen fluorocarbons: sum of HFC23, HFC32, HFC41, HFC4310mee, HFC125, HFC134, HFC134a,
HFC152a, HFC143, HFC143a, HFC227ea, HFC236fa, HFC245ca, HFC365mfc. (4)
Total mass of perfluorocarbons: sum of CF4, C2F6, C3F8, C4F10, c-C4F8, C5F12, C6F14.

ETC/ACC - ETC/SCP - ETC/W E-PRTR Review 2009 139/162
(5) Total mass of substances including their isomers listed in Group VIII of Annex I to Regulation (EC) No 2037/2000 of the
European Par- liament and of the Council of 29 June 2000 on substances that deplete the ozone layer (OJ L 244,
29.9.2000, p. 1). Regulation as amended by Regulation (EC) No 1804/2003 (OJ L 265, 16.10.2003, p. 1). (6)
Total mass of substances including their isomers listed in Group I and II of Annex I to Regulation (EC) No 2037/2000. (7)
Total mass of substances including their isomers listed in Group III and VI of Annex I to Regulation (EC) No 2037/2000. (8)
All metals shall be reported as the total mass of the element in all chemical forms present in the release. (9)
Halogenated organic compounds which can be adsorbed to activated carbon expressed as chloride. (10)
Expressed as I-TEQ. (11)
Single pollutants are to be reported if the threshold for BTEX (the sum parameter of benzene, toluene, ethyl benzene,
xylenes) is exceeded. (12)
Total mass of the following brominated diphenylethers: penta-BDE, octa-BDE and deca-BDE. (13)
Total mass of phenol and simple substituted phenols expressed as total carbon. (14)
Polycyclic aromatic hydrocarbons (PAHs) are to be measured for reporting of releases to air as benzo(a)pyrene (50-32-8),
benzo(b)fluo- ranthene (205-99-2), benzo(k)fluoranthene (207-08-9), indeno(1,2,3-cd)pyrene (193-39-5) (derived from
Regulation (EC) No 850/2004 of the European Parliament and of the Council of 29 April 2004 on persistent organic
pollutants (OJ L 229, 29.6.2004, p. 5)). (15)
Total mass of tributyltin compounds, expressed as mass of tributyltin. (16)
Total mass of triphenyltin compounds, expressed as mass of triphenyltin. (17)
Total mass of xylene (ortho-xylene, meta-xylene, para-xylene).

140/162 E-PRTR data review 2009 ETC/ACC - ETC/SCP - ETC/W
APPENDIX II- List of E-PRTR ANNEX I Activities
Code Description
1 Energy sector
1.(a) Mineral oil and gas refineries
1.(b) Installations for gasification and liquefaction
1.(c) Thermal power stations and other combustion installations
1.(d) Coke ovens
1.(e) Coal rolling mills
1.(f) Installations for the manufacture of coal products and solid smokeless fuel
2 Production and processing of metals
2.(a) Metal ore (including sulphide ore) roasting or sintering installations
2.(b) Installations for the production of pig iron or steel (primary or secondary melting) including continuous casting
2.(c) Installations for the processing of ferrous metals
2.(c).(i) - Hot-rolling mills
2.(c).(ii) - Smitheries with hammers
2.(c).(iii) - Application of protective fused metal coats
2.(d) Ferrous metal foundries
2.(e) Installations:
2.(e).(i) - For the production of non-ferrous crude metals from ore, concentrates or secondary raw materials by metallurgical, chemical or electrolytic processes
2.(e).(ii) - For the smelting, including the alloying, of non-ferrous metals, including recovered products (refining, foundry casting, etc.)
2.(f) Installations for surface treatment of metals and plastic materials using an electrolytic or chemical process
3 Mineral industry
3.(a) Underground mining and related operations
3.(b) Opencast mining and quarrying
3.(c) Installations for the production of:
3.(c).(i) - Cement clinker in rotary kilns
3.(c).(ii) - Lime in rotary kilns
3.(c).(iii) - Cement clinker or lime in other furnaces
3.(d) Installations for the production of asbestos and the manufacture of asbestos-based products
3.(e) Installations for the manufacture of glass, including glass fibre
3.(f) Installations for melting mineral substances, including the production of mineral fibres
3.(g) Installations for the manufacture of ceramic products by firing, in particular roofing tiles, bricks, refractory bricks, tiles, stoneware or porcelain
4 Chemical industry
4.(a) Chemical installations for the production on an industrial scale of basic organic chemicals, such as:
4.(a).(i) - Simple hydrocarbons (linear or cyclic, saturated or unsaturated, aliphatic or aromatic)
4.(a).(ii) - Oxygen-containing hydrocarbons
4.(a).(iii) - Sulphurous hydrocarbons
4.(a).(iv) - Nitrogenous hydrocarbons
4.(a).(ix) - Phosphorus-containing hydrocarbons
4.(a).(v) - Halogenic hydrocarbons
4.(a).(vi) - Organometallic compounds
4.(a).(vii) - Basic plastic materials (polymers, synthetic fibres and cellulose-based fibres)
4.(a).(viii) - Synthetic rubbers

ETC/ACC - ETC/SCP - ETC/W E-PRTR Review 2009 141/162
Code Description
4.(a).(x) - Dyes and pigments
4.(a).(xi) - Surface-active agents and surfactants
4.(b) Chemical installations for the production on an industrial scale of basic inorganic chemicals, such as:
4.(b).(i) - Gases
4.(b).(ii) - Acids
4.(b).(iii) - Bases
4.(b).(iv) - Salts
4.(b).(v) - Non-metals, metal oxides or other inorganic compounds
4.(c) Chemical installations for the production on an industrial scale of phosphorous-, nitrogen- or potassium-based fertilisers (simple or compound fertilisers)
4.(d) Chemical installations for the production on an industrial scale of basic plant health products and of biocides
4.(e) Installations using a chemical or biological process for the production on an industrial scale of basic pharmaceutical products
4.(f) Installations for the production on an industrial scale of explosives and pyrotechnic products
5 Waste and wastewater management
5.(a) Installations for the recovery or disposal of hazardous waste
5.(b) Installations for the incineration of non-hazardous waste in the scope of Directive 2000/76/EC of the European Parliament and of the Council of 4 December 2000 on the incineration of waste
5.(c) Installations for the disposal of non-hazardous waste
5.(d) Landfills (see note in Guidance Document)
5.(e) Installations for the disposal or recycling of animal carcasses and animal waste
5.(f) Urban waste-water treatment plants
5.(g) Independently operated industrial waste-water treatment plants which serve one or more activities of this annex
6 Paper and wood production and processing
6.(a) Industrial plants for the production of pulp from timber or similar fibrous materials
6.(b) Industrial plants for the production of paper and board and other primary wood products
6.(c) Industrial plants for the preservation of wood and wood products with chemicals
7 Intensive livestock production and aquaculture
7.(a) Installations for the intensive rearing of poultry or pigs
7.(a).(i) - With 40 000 places for poultry
7.(a).(ii) - With 2 000 places for production pigs (over 30kg)
7.(a).(iii) - With 750 places for sows
7.(b) Intensive aquaculture
8 Animal and vegetable products from the food and beverage sector
8.(a) Slaughterhouses
8.(b) Treatment and processing intended for the production of food and beverage products from:
8.(b).(i) - Animal raw materials (other than milk)
8.(b).(ii) - Vegetable raw materials
8.(c) Treatme
nt and processing of milk
9 Other activities
9.(a) Plants for the pre-treatment (operations such as washing, bleaching, mercerisation) or dyeing of fibres or textiles
9.(b) Plants for the tanning of hides and skins
9.(c) Installations for the surface treatment of substances, objects or products using organic solvents, in particular for dressing, printing, coating, degreasing, waterproofing, sizing, painting, cleaning or impregnating
9.(d) Installations for the production of carbon (hard-burnt coal) or electro-graphite by means of incineration or graphitisation
142/162 E-PRTR data review 2009 ETC/ACC - ETC/SCP - ETC/W
Code Description
9.(e) Installations for the building of, and painting or removal of paint from ships

143
ETC/ACC - ETC/SCP E-PRTR Review 2009 143/162
APPENDIX III - Number of facilities per activity and country E-PRTR 2008 A
ust
ria
Be
lgiu
m
Bu
lgar
ia
Cyp
rus
Cze
ch R
ep
ub
lic
De
nm
ark
Esto
nia
Fin
lan
d
Fran
ce
Ge
rman
y
Gre
ece
Hu
nga
ry
Ice
lan
d
Ire
lan
d
Ital
y
Latv
ia
Lie
chte
nst
ein
Lith
uan
ia
Luxe
mb
ou
rg
Mal
ta
Ne
the
rlan
ds
No
rway
Po
lan
d
Po
rtu
gal
Ro
man
ia
Slo
vaki
a
Slo
ven
ia
Spai
n
Swe
de
n
Swit
zerl
and
Un
ite
d K
ingd
om
All
cou
ntr
ies
1 1.(a) 1 5 1 4 7 2 2 14 22 4 3 1 4 1 5 7 10 2 9 3 10 3 1 32 153
1.(b) 3 2 1 30 36
1.(c) 20 37 26 3 64 27 10 64 128 243 27 37 22 105 9 11 1 2 53 3 211 16 37 26 7 133 57 5 227 1611
1.(d) 2 2 4 1 1 2 7 2 21
1.(e) 14 1 1 16
1.(f) 1 1 3 5
2 2.(a) 5 1 3 2 2 2 1 1 2 1 20
2.(b) 3 12 4 8 2 5 31 32 5 3 14 1 4 2 1 10 2 9 2 3 27 8 1 27 216
2.(c) 1 8 2 14 5 1 5 33 148 3 5 51 1 5 7 1 35 9 9 3 1 42 11 4 17 421
2.(d) 3 6 1 31 4 9 50 151 2 36 10 8 41 8 7 6 13 28 8 2 1 425
2.(e) 5 8 8 1 23 8 2 8 79 214 14 10 5 3 72 1 3 20 28 45 11 13 5 11 53 15 10 72 747
2.(f) 12 28 3 1 58 29 3 43 460 441 3 38 12 196 1 1 56 12 108 50 12 20 22 209 61 17 199 2095
3 3.(a) 2 4 14 2 7 3 36 3 15 4 38 3 83 3 9 1 25 5 2 14 273
3.(b) 1 15 4 5 8 1 6 56 14 7 3 20 2 1 38 4 3 2 45 2 1 101 339
3.(c) 5 20 8 2 9 5 2 6 45 54 8 7 1 5 31 1 1 1 2 6 16 11 10 12 5 57 8 7 29 374
3.(e) 5 12 4 20 5 1 4 43 71 1 10 2 20 1 2 2 8 3 30 8 4 4 4 43 2 1 28 335
3.(f) 2 6 8 5 2 1 4 1 1 2 3 3 1 2 1 3 1 2 48
3.(g) 3 11 4 12 14 2 3 28 39 5 17 1 105 1 2 29 2 41 23 5 8 5 242 3 3 46 654
4 4.(a) 12 84 2 40 32 2 33 244 349 7 22 1 6 78 1 3 1 78 16 71 18 11 13 10 132 37 23 217 1543
4.(b) 5 18 1 7 2 12 51 85 2 6 1 17 19 8 13 9 8 2 4 46 11 2 93 422
4.(c) 2 2 1 1 2 4 4 1 3 1 2 4 2 7 2 6 20 1 2 67
4.(d) 1 3 1 2 1 13 6 2 2 3 4 13 4 10 65
4.(e) 2 15 2 10 13 5 35 34 11 29 47 2 3 5 3 14 2 3 2 3 54 11 32 37 374
4.(f) 2 6 1 2 14 10 1 1 3 1 3 1 5 4 1 3 58
5 5.(a) 13 234 1 42 12 22 17 155 680 5 20 14 112 9 1 1 49 29 36 21 3 9 3 84 19 11 227 1829
5.(b) 6 10 3 22 2 127 76 1 20 1 10 13 1 1 1 9 16 27 18 364
5.(c) 11 3 1 5 9 23 151 1 2 38 66 1 2 37 2 9 2 1 1 10 8 2 196 581
5.(d) 12 20 17 1 2 40 8 50 149 226 7 16 2 38 67 8 2 26 45 103 43 47 13 35 117 52 2 251 1399
5.(e) 1 3 1 1 4 7 1 1 7 20 10 3 7 2 4 13 6 6 1 3 21 10 132
5.(f) 12 18 15 1 23 36 5 17 110 212 8 24 2 4 33 1 5 2 46 7 70 21 17 5 5 88 10 15 142 954
5.(g) 3 2 3 30 4 3 10 3 1 4 63
6 6.(a) 1 5 1 1 3 2 16 31 3 1 3 1 11 3 5 1 1 10 39 1 44 183
6.(b) 10 9 3 18 4 34 56 149 8 9 4 62 3 1 20 7 32 19 11 5 9 70 14 9 18 584
6.(c) 3 1 5 1 3 20 11 1 3 1 2 51
7 7.(a) 94 41 48 224 50 16 83 755 460 5 376 9 57 338 13 55 83 1 175 170 216 66 21 1410 48 547 5361
7.(b) 2 1 5 4 223 4 94 333
Annex I
Activity

144/162 E-PRTR data review 2009 ETC/ACC - ETC/SCP
Au
stri
a
Be
lgiu
m
Bu
lgar
ia
Cyp
rus
Cze
ch R
ep
ub
lic
De
nm
ark
Esto
nia
Fin
lan
d
Fran
ce
Ge
rman
y
Gre
ece
Hu
nga
ry
Ice
lan
d
Ire
lan
d
Ital
y
Latv
ia
Lie
chte
nst
ein
Lith
uan
ia
Luxe
mb
ou
rg
Mal
ta
Ne
the
rlan
ds
No
rway
Po
lan
d
Po
rtu
gal
Ro
man
ia
Slo
vaki
a
Slo
ven
ia
Spai
n
Swe
de
n
Swit
zerl
and
Un
ite
d K
ingd
om
All
cou
ntr
ies
8 8.(a) 4 11 1 7 17 2 8 88 68 10 22 6 15 12 55 13 5 5 8 52 5 71 485
8.(b) 6 35 25 18 7 157 102 10 17 6 40 1 4 48 29 61 27 7 7 4 118 11 5 203 948
8.(c) 3 9 3 16 2 9 121 70 3 3 14 9 1 5 1 17 8 26 9 1 1 2 27 13 5 53 431
9 9.(a) 1 14 1 8 1 1 29 31 2 1 22 3 23 4 1 1 10 3 60 216
9.(b) 1 1 1 1 1 1 1 2 9
9.(c) 11 23 16 9 6 18 148 226 6 4 6 70 4 2 24 41 24 9 10 5 71 19 14 16 782
9.(d) 8 11 1 1 1 2 3 1 4 32
9.(e) 1 4 6 3 11 24 5 1 26 4 6 2 3 10 1 107
Grand Total 172 782 165 66 716 404 105 494 3388 4493 150 692 26 313 1685 36 1 118 28 13 715 513 1433 568 485 239 188 3305 510 211 3148 25162
Annex I
Activity
Legend
Highest amount of facilities per country
2rd
highest amount of facilities per country
3nd
highest amount of facilities per country

145
ETC/ACC - ETC/SCP E-PRTR Review 2009 145/162
APPENDIX IV – E-PRTR 2008 Number of releases to air per pollutant and country
Pollutant group / Pollutant Au
stri
a
Be
lgiu
m
Bu
lgar
ia
Cyp
rus
Cze
ch R
ep
ub
lic
De
nm
ark
Esto
nia
Fin
lan
d
Fran
ce
Ge
rman
y
Gre
ece
Hu
nga
ry
Ice
lan
d
Ire
lan
d
Ital
y
Latv
ia
Lith
uan
ia
Luxe
mb
ou
rg
Mal
ta
Ne
the
rlan
ds
No
rway
Po
lan
d
Po
rtu
gal
Ro
man
ia
Slo
vaki
a
Slo
ven
ia
Spai
n
Swe
de
n
Swit
zerl
and
Un
ite
d K
ingd
om
All
cou
ntr
ies
Chlorinated organic substances
1,1,1-trichloroethane 1 1 1 20 23
1,1,2,2-tetrachloroethane 2 5 7
1,2-dichloroethane (DCE) 1 3 8 5 2 1 2 1 1 1 1 4 30
Hexabromobiphenyl 1 1
Hexachlorobenzene (HCB) 2 1 1 1 5
PCDD + PCDF (dioxins + furans)
(as Teq)13 16 4 6 22 31 2 4 1 2 3 1 5 29 10 4 2 25 12 1 19 212
Pentachlorobenzene 3 1 1 3 8
Pentachlorophenol (PCP) 3 2 5
Polychlorinated biphenyls
(PCBs)11 2 1 1 2 1 1 15 3 1 5 2 14 59
Tetrachloroethylene (PER) 3 2 11 3 1 2 3 2 2 6 35
Tetrachloromethane (TCM) 3 1 3 3 1 3 1 1 2 18
Trichlorobenzenes (TCBs) (all
isomers)1 1 1 1 8 12
Trichloroethylene 2 1 7 1 1 1 1 3 2 1 8 28
Trichloromethane 3 10 1 2 1 1 1 6 2 9 36
Vinyl chloride 2 1 8 10 1 3 2 1 1 1 3 1 5 39
Greenhouse gases
Carbon dioxide (CO2) 32 66 28 5 73 24 9 81 224 387 36 37 4 20 109 2 5 7 2 82 29 136 28 57 29 7 202 90 28 250 2089
Carbon dioxide (CO2) excluding
biomass1 9 2 52 29 9 5 88 5 200
Greenhouse gases
(confidential)2 1 3

146/162 E-PRTR data review 2009 ETC/ACC - ETC/SCP
Pollutant group / Pollutant Au
stri
a
Be
lgiu
m
Bu
lgar
ia
Cyp
rus
Cze
ch R
ep
ub
lic
De
nm
ark
Esto
nia
Fin
lan
d
Fran
ce
Ge
rman
y
Gre
ece
Hu
nga
ry
Ice
lan
d
Ire
lan
d
Ital
y
Latv
ia
Lith
uan
ia
Luxe
mb
ou
rg
Mal
ta
Ne
the
rlan
ds
No
rway
Po
lan
d
Po
rtu
gal
Ro
man
ia
Slo
vaki
a
Slo
ven
ia
Spai
n
Swe
de
n
Swit
zerl
and
Un
ite
d K
ingd
om
All
cou
ntr
ies
Hydrochlorofluorocarbons(HCF
Cs)1 30 3 10 74 31 4 14 7 1 106 2 53 8 2 12 3 7 346 714
Methane (CH4) 15 21 20 7 4 18 7 39 171 199 9 1 8 62 89 1 14 2 2 42 5 90 44 81 8 32 178 19 1 374 1563
Nitrous oxide (N2O) 3 19 1 2 3 10 2 20 85 141 8 1 1 6 12 3 1 22 4 27 15 16 2 69 39 3 116 631
Perfluorocarbons (PFCs) 2 6 5 1 3 1 1 7 1 1 1 4 1 9 43
Sulphur hexafluoride (SF6) 1 3 5 1 5 1 2 8 26
Heavy metals
Arsenic and compounds (as As) 11 2 4 22 3 4 6 42 36 8 1 1 2 3 2 2 3 3 24 18 1 9 1 40 6 1 25 280
Cadmium and compounds (as
Cd)16 8 2 25 3 4 59 24 6 1 3 1 2 4 4 17 29 7 3 58 2 1 14 293
Chromium and compounds (as
Cr)2 17 3 4 4 3 36 21 9 1 1 3 1 4 2 18 11 4 2 1 25 4 1 23 200
Copper and compounds (as Cu) 9 4 1 6 2 5 31 25 7 2 4 1 3 3 28 11 4 1 30 1 22 200
Lead and compounds (as Pb) 3 11 8 17 4 3 41 22 4 1 1 11 1 8 2 20 11 4 2 3 36 2 5 24 244
Mercury and compounds (as
Hg)3 24 3 2 45 15 3 7 68 98 15 7 1 8 3 11 3 30 23 7 11 1 62 5 16 35 506
Nickel and compounds (as Ni) 1 26 5 4 17 1 3 16 72 55 11 2 3 14 1 1 2 7 3 24 47 7 4 1 89 26 2 51 495
Zinc and compounds (as Zn) 2 21 5 4 10 2 3 15 92 28 9 2 2 15 3 2 11 8 48 25 8 3 2 65 20 11 39 455
Inorganic substances
Asbestos 1 1
Chlorides (as total Cl) 4 4
Fluorides (as total F) 14 14
Particulate matter (PM10) 3 13 11 5 29 9 5 18 23 57 33 2 4 5 4 6 2 3 12 22 141 39 31 4 119 19 67 686
Total nitrogen 1 1
Other gases
Ammonia (NH3) 4 116 50 48 232 53 16 91 793 518 10 375 10 59 357 7 56 98 7 107 189 216 38 22 1444 73 9 422 5420
Carbon monoxide (CO) 8 25 9 2 15 3 2 12 45 93 20 10 1 4 17 6 3 25 1 53 16 13 18 7 84 16 7 72 587
Chlorine and inorganic
compounds (as HCl)2 23 35 8 2 33 39 84 4 4 1 8 2 2 86 15 3 6 5 97 9 46 514
Chlorofluorocarbons (CFCs) 3 1 1 4 15 1 7 33 1 2 2 4 234 308
Fluorine and inorganic
compounds (as HF)11 20 16 14 24 32 11 1 3 2 1 18 1 16 4 2 3 3 165 6 26 379

147
ETC/ACC - ETC/SCP E-PRTR Review 2009 147/162
Pollutant group / Pollutant Au
stri
a
Be
lgiu
m
Bu
lgar
ia
Cyp
rus
Cze
ch R
ep
ub
lic
De
nm
ark
Esto
nia
Fin
lan
d
Fran
ce
Ge
rman
y
Gre
ece
Hu
nga
ry
Ice
lan
d
Ire
lan
d
Ital
y
Latv
ia
Lith
uan
ia
Luxe
mb
ou
rg
Mal
ta
Ne
the
rlan
ds
No
rway
Po
lan
d
Po
rtu
gal
Ro
man
ia
Slo
vaki
a
Slo
ven
ia
Spai
n
Swe
de
n
Swit
zerl
and
Un
ite
d K
ingd
om
All
cou
ntr
ies
Halons 1 1 1 1 4 8
Hydro-fluorocarbons (HFCs) 15 1 42 17 1 3 5 11 1 10 1 2 12 19 1 50 191
Hydrogen cyanide (HCN) 2 10 3 2 7 10 1 1 10 1 21 6 74
Nitrogen oxides (NOx/NO2) 29 97 33 6 91 49 10 93 275 437 46 43 26 140 6 8 7 2 78 26 179 56 58 38 12 343 71 11 314 2584
Non-methane volatile organic
compounds (NMVOC)8 78 3 1 14 5 3 16 194 116 8 3 2 37 1 2 2 29 13 30 28 14 5 8 99 34 7 152 912
Other gases (confidential) 4 3 7
Sulphur oxides (SOx/SO2) 8 54 22 4 78 23 8 61 169 201 32 13 4 11 39 2 5 2 2 29 24 216 34 33 19 6 135 29 7 93 1363
Other organic substances
Anthracene 2 1 2 1 2 8
Benzene 2 15 2 2 1 4 41 59 5 4 20 1 1 16 18 9 1 4 4 33 7 6 39 294
Benzo(g,h,i)perylene 1 1
Di-(2-ethyl hexyl) phthalate
(DEHP)5 1 1 1 4 14 1 3 30
Dichloromethane (DCM) 18 2 1 2 47 3 3 6 4 3 2 7 6 2 5 1 6 18 136
Ethylene oxide 1 2 1 1 2 1 1 1 10
Naphthalene 6 2 3 10 9 1 2 3 3 2 1 2 10 2 1 25 82
Phenols (as total C) 6 2 8
Polycyclic aromatic
hydrocarbons (PAHs)10 6 2 16 8 1 3 1 2 1 1 16 31 6 1 36 3 1 4 149
Toluene 5 5
Total organic carbon (TOC) (as
total C or COD/3)19 19
Xylenes 1 1
Pesticides
1,2,3,4,5,6-
hexachlorocyclohexane (HCH)1 1
Grand Total 129 829 224 98 781 260 99 558 2808 2801 304 529 43 240 937 31 103 45 22 734 266 1464 696 579 212 137 3534 617 147 3030 22257
Legend
< 6
Note: Liechtenstein did not report any release reports to air and is thus not included in the table.
*…no threshold for air included in Annex II of the E-PRTR Regulation for these pollutants

148/162 E-PRTR data review 2009 ETC/ACC - ETC/SCP
APPENDIX V – E-PRTR 2008 Number of releases to water per pollutant and per country
Pollutant group / Pollutant Au
stri
a
Be
lgiu
m
Bu
lgar
ia
Cyp
rus
Cze
ch R
ep
ub
lic
De
nm
ark
Esto
nia
Fin
lan
d
Fran
ce
Ge
rman
y
Gre
ece
Hu
nga
ry
Ice
lan
d
Ire
lan
d
Ital
y
Latv
ia
Lith
uan
ia
Luxe
mb
ou
rg
Mal
ta
Ne
the
rlan
ds
No
rway
Po
lan
d
Po
rtu
gal
Ro
man
ia
Slo
vaki
a
Slo
ven
ia
Spai
n
Swe
de
n
Swit
zerl
and
Un
ite
d K
ingd
om
All
cou
ntr
ies
Chlorinated organic substances
1,2-dichloroethane (DCE) 1 2 7 6 1 2 1 3 2 1 5 1 24 56
Brominated diphenylethers
(PBDE)2 2 3 1 8
Chloro-alkanes, C10-C13 1 2 1 1 1 1 1 2 10
Dichloromethane (DCM) 6 2 1 15 11 2 1 2 2 1 45 88
Halogenated organic
compounds (as AOX)3 11 8 1 17 38 45 1 3 13 6 10 6 2 42 23 2 114 345
Hexabromobiphenyl 1 1 1 3
Hexachlorobenzene (HCB) 1 3 2 6
Hexachlorobutadiene (HCBD) 1 3 3 3 1 11
PCDD + PCDF (dioxins + furans)
(as Teq)2 1 2 4 8 2 1 1 21
Pentachlorobenzene 3 2 5
Pentachlorophenol (PCP) 2 2 3 4 3 1 3 10 28
Polychlorinated biphenyls
(PCBs)1 1 6 2 2 4 1 1 5 1 1 1 2 28
Tetrachloroethylene (PER) 3 11 2 1 2 4 1 2 2 12 40
Tetrachloromethane (TCM) 2 5 4 5 1 5 1 1 1 1 2 22 50
Trichlorobenzenes (TCBs) (all
isomers)2 2 2 3 5 1 5 20
Trichloroethylene 1 6 1 1 1 3 1 2 2 2 6 26
Trichloromethane 5 1 1 11 6 2 7 12 3 4 1 15 1 55 124
Vinyl chloride 1 1 5 1 1 2 4 15
Heavy metals
Arsenic and compounds (as As) 2 30 6 14 30 2 23 38 49 3 2 3 6 33 1 1 2 54 17 41 17 1 2 2 32 35 2 181 629
Cadmium and compounds (as
Cd)2 11 8 13 2 16 21 35 1 1 4 19 1 1 9 8 50 15 11 4 18 21 3 59 333

149
ETC/ACC - ETC/SCP E-PRTR Review 2009 149/162
Pollutant group / Pollutant Au
stri
a
Be
lgiu
m
Bu
lgar
ia
Cyp
rus
Cze
ch R
ep
ub
lic
De
nm
ark
Esto
nia
Fin
lan
d
Fran
ce
Ge
rman
y
Gre
ece
Hu
nga
ry
Ice
lan
d
Ire
lan
d
Ital
y
Latv
ia
Lith
uan
ia
Luxe
mb
ou
rg
Mal
ta
Ne
the
rlan
ds
No
rway
Po
lan
d
Po
rtu
gal
Ro
man
ia
Slo
vaki
a
Slo
ven
ia
Spai
n
Swe
de
n
Swit
zerl
and
Un
ite
d K
ingd
om
All
cou
ntr
ies
Chromium and compounds (as
Cr)4 16 9 8 9 2 12 33 43 4 3 2 2 25 1 3 12 8 34 14 11 2 3 25 18 2 75 380
Copper and compounds (as Cu) 8 19 10 1 17 29 5 23 99 157 3 2 3 3 34 1 3 2 45 21 48 43 11 2 1 37 36 6 213 882
Lead and compounds (as Pb) 2 18 8 9 6 2 14 62 83 1 2 2 5 32 1 2 1 2 30 11 60 16 17 1 3 14 27 4 132 567
Mercury and compounds (as
Hg)1 7 1 24 35 10 38 67 3 2 2 3 28 1 1 13 5 49 11 7 7 2 34 16 5 48 420
Nickel and compounds (as Ni) 9 53 5 20 36 2 35 121 198 5 2 3 5 46 1 5 1 59 15 71 23 16 3 5 38 53 6 193 1029
Zinc and compounds (as Zn) 9 59 11 17 37 5 45 149 235 5 2 3 6 48 1 6 2 4 73 166 95 42 22 4 10 78 54 7 278 1473
Inorganic substances
Asbestos 98 98
Chlorides (as total Cl) 31 8 13 26 117 1 2 13 3 44 1 59 15 8 4 1 56 8 10 97 517
Cyanides (as total CN) 2 7 5 8 2 10 19 1 1 2 8 30 3 6 1 4 1 1 5 4 48 168
Fluorides (as total F) 3 25 1 7 10 35 53 2 3 2 3 3 1 1 1 38 9 20 4 1 3 1 47 12 3 131 419
Total nitrogen 11 26 12 1 21 13 3 39 112 190 9 19 7 3 40 1 6 3 3 61 107 67 27 20 11 5 84 40 19 215 1175
Total phosphorus 7 31 16 2 13 10 2 19 112 93 12 21 7 5 43 1 4 3 4 69 176 47 33 18 10 5 101 22 13 223 1122
Other gases
Ammonia (NH3) 2 2
Chlorine and inorganic
compounds (as HCl)2 2
Sulphur oxides (SOx/SO2) 6 6
Other organic substances
Anthracene 1 1 1 1 1 1 18 24
Benzene 2 4 1 3 77 87
Benzo(g,h,i)perylene 1 2 3 1 9 16
Di-(2-ethyl hexyl) phthalate
(DEHP)3 1 3 38 6 18 14 2 3 39 3 2 7 3 2 13 5 18 180
Ethyl benzene 2 2 44 48
Fluoranthene 3 3 4 1 2 1 1 7 2 24 48
Naphthalene 1 1 1 1 1 4 1 64 74
Nonylphenol and Nonylphenol
ethoxylates (NP/NPEs)2 2 28 4 8 12 2 7 3 4 6 1 4 14 6 134 237

150/162 E-PRTR data review 2009 ETC/ACC - ETC/SCP
Pollutant group / Pollutant Au
stri
a
Be
lgiu
m
Bu
lgar
ia
Cyp
rus
Cze
ch R
ep
ub
lic
De
nm
ark
Esto
nia
Fin
lan
d
Fran
ce
Ge
rman
y
Gre
ece
Hu
nga
ry
Ice
lan
d
Ire
lan
d
Ital
y
Latv
ia
Lith
uan
ia
Luxe
mb
ou
rg
Mal
ta
Ne
the
rlan
ds
No
rway
Po
lan
d
Po
rtu
gal
Ro
man
ia
Slo
vaki
a
Slo
ven
ia
Spai
n
Swe
de
n
Swit
zerl
and
Un
ite
d K
ingd
om
All
cou
ntr
ies
Octylphenols and Octylphenol
ethoxylates1 1 3 2 7 3 3 6 1 13 122 162
Organotin compounds (as total
Sn)3 2 1 1 5 12
Phenols (as total C) 5 16 7 11 23 8 47 10 3 4 3 20 1 5 5 50 7 20 6 22 10 1 106 390
Polycyclic aromatic
hydrocarbons (PAHs)2 5 1 1 3 2 4 12 4 4 1 5 11 2 24 81
Toluene 4 1 4 1 2 74 86
Total organic carbon (TOC) (as
total C or COD/3)18 44 12 17 27 6 52 212 227 12 28 1 2 42 1 1 3 4 73 187 45 34 17 12 9 88 48 15 269 1506
Xylenes 3 2 1 70 76
Pesticides
1,2,3,4,5,6-
hexachlorocyclohexane (HCH)2 2 2 1 1 2 10
Alachlor 1 1 1 2 5
Aldrin 6 6
Atrazine 1 2 2 1 12 18
Chlordane 1 1 2
Chlordecone 1 1
Chlorfenvinphos 1 8 9
Chlorpyrifos 1 1 1 3
DDT 1 1 1 3
Dieldrin 2 6 8
Diuron 1 1 6 5 2 2 1 1 4 14 49 86
Endosulphan 1 1 1 1 1 5
Endrin 6 1 1 8
Heptachlor 1 1
Isodrin 2 5 7
Isoproturon 1 3 2 2 2 1 11
Lindane 1 1 2 1 6 11
Mirex 1 1
Simazine 1 2 1 7 1 12
Tributyltin and compounds 1 2 1 1 1 2 8

151
ETC/ACC - ETC/SCP E-PRTR Review 2009 151/162
Pollutant group / Pollutant Au
stri
a
Be
lgiu
m
Bu
lgar
ia
Cyp
rus
Cze
ch R
ep
ub
lic
De
nm
ark
Esto
nia
Fin
lan
d
Fran
ce
Ge
rman
y
Gre
ece
Hu
nga
ry
Ice
lan
d
Ire
lan
d
Ital
y
Latv
ia
Lith
uan
ia
Luxe
mb
ou
rg
Mal
ta
Ne
the
rlan
ds
No
rway
Po
lan
d
Po
rtu
gal
Ro
man
ia
Slo
vaki
a
Slo
ven
ia
Spai
n
Swe
de
n
Swit
zerl
and
Un
ite
d K
ingd
om
All
cou
ntr
ies
Trifluralin 1 2 3
Triphenyltin and compounds 1 1 1 2 5
Grand Total 95 443 112 4 232 327 31 355 1291 1719 64 97 36 80 543 12 35 14 24 703 768 819 356 196 98 59 862 448 100 3433 13356
Legend
< 6
Note: Liechtenstein and Estonia did not report any release reports to water and is thus not included in the table.
*…no threshold for water included in Annex II of the E-PRTR Regulation for these pollutants

152/162 E-PRTR data review 2009 ETC/ACC - ETC/SCP
APPENDIX VI – E-PRTR 2008 Number of transfers in water per pollutant and per country
Pollutant goup / Pollutant Au
stri
a
Be
lgiu
m
Bu
lgar
ia
Cyp
rus
Cze
ch R
ep
ub
lic
De
nm
ark
Esto
nia
Fin
lan
d
Fran
ce
Ge
rman
y
Gre
ece
Hu
nga
ry
Ire
lan
d
Ital
y
Lith
uan
ia
Ne
the
rlan
ds
Po
lan
d
Po
rtu
gal
Ro
man
ia
Slo
vaki
a
Slo
ven
ia
Spai
n
Swe
de
n
Swit
zerl
and
Un
ite
d K
ingd
om
All
cou
ntr
ies
Chlorinated organic substances
1,2-dichloroethane (DCE) 1 2 2 2 1 1 1 1 3 14
Brominated diphenylethers
(PBDE)1 1 1 1 4
Dichloromethane (DCM) 1 1 2 8 3 3 2 2 1 1 2 4 4 34
Halogenated organic
compounds (as AOX)4 1 2 8 27 1 3 4 5 1 56
Hexabromobiphenyl 1 1
Hexachlorobenzene (HCB) 1 1
Hexachlorobutadiene (HCBD) 1 1
PCDD + PCDF (dioxins + furans)
(as Teq)1 5 4 1 11
Pentachlorobenzene 1 1
Pentachlorophenol (PCP) 2 1 3
Polychlorinated biphenyls
(PCBs)3 1 3 7
Tetrachloroethylene (PER) 1 3 1 1 6
Tetrachloromethane (TCM) 1 2 1 2 2 8
Trichlorobenzenes (TCBs) (all
isomers)1 1 1 3
Trichloroethylene 1 2 1 4
Trichloromethane 1 2 3 1 1 3 3 5 19
Vinyl chloride 7 1 1 1 1 1 2 14

153
ETC/ACC - ETC/SCP E-PRTR Review 2009 153/162
Pollutant goup / Pollutant Au
stri
a
Be
lgiu
m
Bu
lgar
ia
Cyp
rus
Cze
ch R
ep
ub
lic
De
nm
ark
Esto
nia
Fin
lan
d
Fran
ce
Ge
rman
y
Gre
ece
Hu
nga
ry
Ire
lan
d
Ital
y
Lith
uan
ia
Ne
the
rlan
ds
Po
lan
d
Po
rtu
gal
Ro
man
ia
Slo
vaki
a
Slo
ven
ia
Spai
n
Swe
de
n
Swit
zerl
and
Un
ite
d K
ingd
om
All
cou
ntr
ies
Heavy metals
Arsenic and compounds (as As) 5 1 2 6 19 1 4 8 7 9 21 12 95
Cadmium and compounds (as
Cd)1 3 5 7 1 8 8 1 14 6 54
Chromium and compounds (as
Cr)3 2 3 1 1 6 12 1 7 3 8 12 2 1 21 1 2 14 100
Copper and compounds (as Cu) 1 2 2 2 2 11 51 2 3 1 9 14 10 1 2 21 3 30 167
Lead and compounds (as Pb) 1 1 3 11 18 1 1 3 5 19 7 1 13 2 18 104
Mercury and compounds (as
Hg)1 1 4 9 13 2 2 3 9 5 2 15 1 1 9 77
Nickel and compounds (as Ni) 3 6 3 6 1 2 23 63 1 2 12 10 29 16 2 54 2 7 46 288
Zinc and compounds (as Zn) 2 9 5 7 4 22 47 1 2 7 13 29 9 4 1 5 36 6 7 41 257
Inorganic substances
Asbestos 1 1
Chlorides (as total Cl) 2 2 4 6 27 1 8 12 2 6 2 5 3 80
Cyanides (as total CN) 1 1 4 1 2 15 1 3 3 2 1 1 9 44
Fluorides (as total F) 3 3 2 1 7 17 1 2 1 2 3 1 1 6 4 8 62
Inorganic substances
(confidential)1 1
Total nitrogen 3 3 1 11 12 2 8 22 71 1 2 2 6 20 15 9 1 3 5 19 6 9 21 252
Total phosphorus 2 4 7 15 15 61 86 5 2 4 2 22 28 4 2 1 5 28 11 11 22 337
Other organic substances
Anthracene 1 1 1 1 1 5
Benzene 1 2 1 5 3 1 8 21
Benzo(g,h,i)perylene 1 1
Di-(2-ethyl hexyl) phthalate
(DEHP)1 1 1 1 2 6
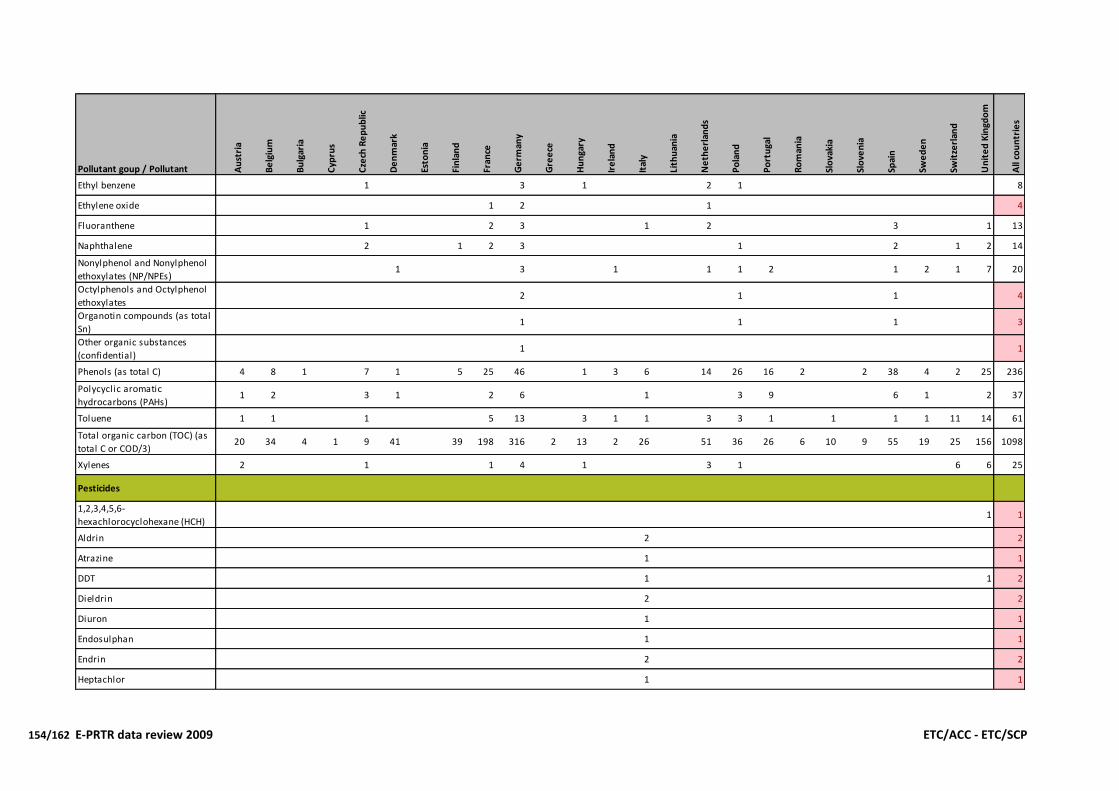
154/162 E-PRTR data review 2009 ETC/ACC - ETC/SCP
Pollutant goup / Pollutant Au
stri
a
Be
lgiu
m
Bu
lgar
ia
Cyp
rus
Cze
ch R
ep
ub
lic
De
nm
ark
Esto
nia
Fin
lan
d
Fran
ce
Ge
rman
y
Gre
ece
Hu
nga
ry
Ire
lan
d
Ital
y
Lith
uan
ia
Ne
the
rlan
ds
Po
lan
d
Po
rtu
gal
Ro
man
ia
Slo
vaki
a
Slo
ven
ia
Spai
n
Swe
de
n
Swit
zerl
and
Un
ite
d K
ingd
om
All
cou
ntr
ies
Ethyl benzene 1 3 1 2 1 8
Ethylene oxide 1 2 1 4
Fluoranthene 1 2 3 1 2 3 1 13
Naphthalene 2 1 2 3 1 2 1 2 14
Nonylphenol and Nonylphenol
ethoxylates (NP/NPEs)1 3 1 1 1 2 1 2 1 7 20
Octylphenols and Octylphenol
ethoxylates2 1 1 4
Organotin compounds (as total
Sn)1 1 1 3
Other organic substances
(confidential)1 1
Phenols (as total C) 4 8 1 7 1 5 25 46 1 3 6 14 26 16 2 2 38 4 2 25 236
Polycyclic aromatic
hydrocarbons (PAHs)1 2 3 1 2 6 1 3 9 6 1 2 37
Toluene 1 1 1 5 13 3 1 1 3 3 1 1 1 1 11 14 61
Total organic carbon (TOC) (as
total C or COD/3)20 34 4 1 9 41 39 198 316 2 13 2 26 51 36 26 6 10 9 55 19 25 156 1098
Xylenes 2 1 1 4 1 3 1 6 6 25
Pesticides
1,2,3,4,5,6-
hexachlorocyclohexane (HCH)1 1
Aldrin 2 2
Atrazine 1 1
DDT 1 1 2
Dieldrin 2 2
Diuron 1 1
Endosulphan 1 1
Endrin 2 2
Heptachlor 1 1

155
ETC/ACC - ETC/SCP E-PRTR Review 2009 155/162
Pollutant goup / Pollutant Au
stri
a
Be
lgiu
m
Bu
lgar
ia
Cyp
rus
Cze
ch R
ep
ub
lic
De
nm
ark
Esto
nia
Fin
lan
d
Fran
ce
Ge
rman
y
Gre
ece
Hu
nga
ry
Ire
lan
d
Ital
y
Lith
uan
ia
Ne
the
rlan
ds
Po
lan
d
Po
rtu
gal
Ro
man
ia
Slo
vaki
a
Slo
ven
ia
Spai
n
Swe
de
n
Swit
zerl
and
Un
ite
d K
ingd
om
All
cou
ntr
ies
Isodrin 1 1
Simazine 1 1
Tributyltin and compounds 1 1
Grand Total 53 89 16 5 91 80 2 83 462 903 4 33 27 111 2 194 271 152 21 20 30 377 58 107 488 3679
Legend
< 6
Note: Liechtenstein did not report any transfer reports in water and is thus not included in the table.
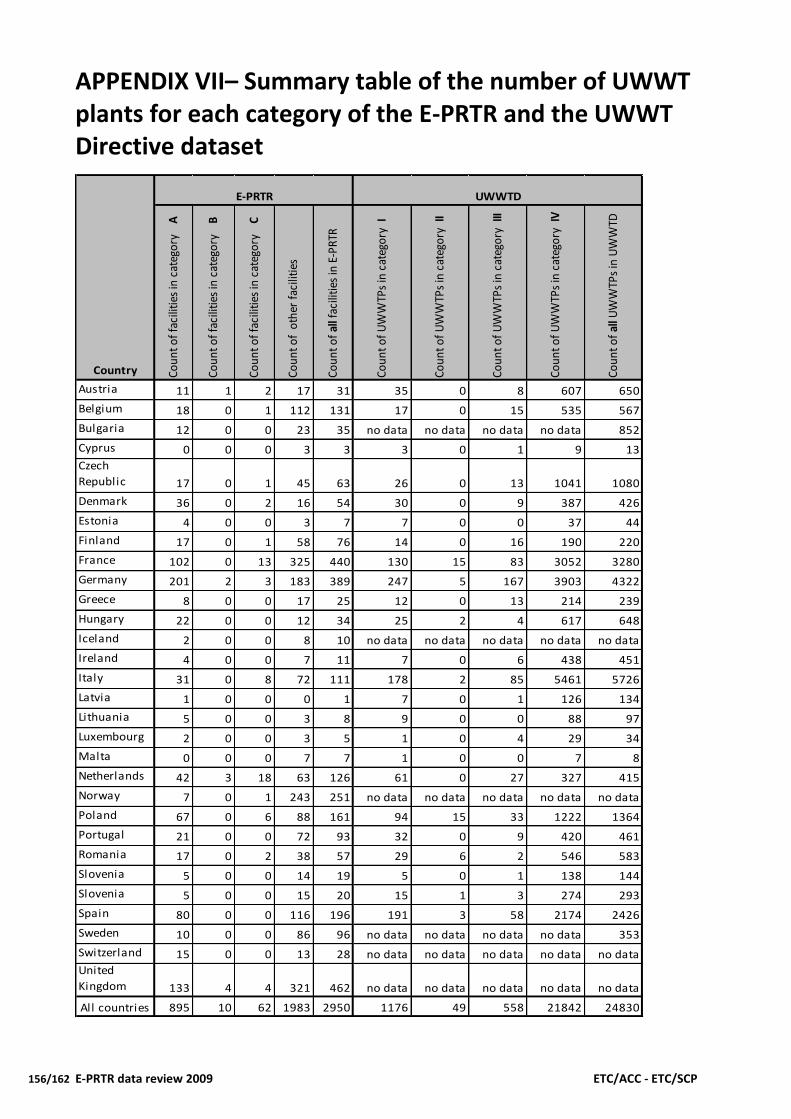
156/162 E-PRTR data review 2009 ETC/ACC - ETC/SCP
APPENDIX VII– Summary table of the number of UWWT plants for each category of the E-PRTR and the UWWT Directive dataset
Co
un
t o
f fa
cilit
ies
in c
ateg
ory
A
Co
un
t o
f fa
cilit
ies
in c
ateg
ory
B
Co
un
t o
f fa
cilit
ies
in c
ateg
ory
C
Co
un
t o
f o
ther
fac
iliti
es
Co
un
t o
f al
l fac
iliti
es in
E-P
RTR
Co
un
t o
f U
WW
TPs
in c
ateg
ory
I
Co
un
t o
f U
WW
TPs
in c
ateg
ory
II
Co
un
t o
f U
WW
TPs
in c
ateg
ory
III
Co
un
t o
f U
WW
TPs
in c
ateg
ory
IV
Co
un
t o
f al
l UW
WTP
s in
UW
WTD
Austria 11 1 2 17 31 35 0 8 607 650
Belgium 18 0 1 112 131 17 0 15 535 567
Bulgaria 12 0 0 23 35 no data no data no data no data 852
Cyprus 0 0 0 3 3 3 0 1 9 13
Czech
Republic 17 0 1 45 63 26 0 13 1041 1080
Denmark 36 0 2 16 54 30 0 9 387 426
Estonia 4 0 0 3 7 7 0 0 37 44
Finland 17 0 1 58 76 14 0 16 190 220
France 102 0 13 325 440 130 15 83 3052 3280
Germany 201 2 3 183 389 247 5 167 3903 4322
Greece 8 0 0 17 25 12 0 13 214 239
Hungary 22 0 0 12 34 25 2 4 617 648
Iceland 2 0 0 8 10 no data no data no data no data no data
Ireland 4 0 0 7 11 7 0 6 438 451
Italy 31 0 8 72 111 178 2 85 5461 5726
Latvia 1 0 0 0 1 7 0 1 126 134
Lithuania 5 0 0 3 8 9 0 0 88 97
Luxembourg 2 0 0 3 5 1 0 4 29 34
Malta 0 0 0 7 7 1 0 0 7 8
Netherlands 42 3 18 63 126 61 0 27 327 415
Norway 7 0 1 243 251 no data no data no data no data no data
Poland 67 0 6 88 161 94 15 33 1222 1364
Portugal 21 0 0 72 93 32 0 9 420 461
Romania 17 0 2 38 57 29 6 2 546 583
Slovenia 5 0 0 14 19 5 0 1 138 144
Slovenia 5 0 0 15 20 15 1 3 274 293
Spain 80 0 0 116 196 191 3 58 2174 2426
Sweden 10 0 0 86 96 no data no data no data no data 353
Switzerland 15 0 0 13 28 no data no data no data no data no data
United
Kingdom 133 4 4 321 462 no data no data no data no data no data
All countries 895 10 62 1983 2950 1176 49 558 21842 24830
Country
E-PRTR UWWTD

157
ETC/ACC - ETC/SCP E-PRTR Review 2009 157/162
APPENDIX VIII– Analysis of UWWTPs in big cities - summary results
City UWWTPs
from E-PRTR
potentially missing
UWWTPs in E-PRTR
City UWWTPs
from E-PRTR
potentially missing
UWWTPs in E-PRTR
Wien 0 1 Nantes 1 0
Bruxelles / Brussel 1 1 Paris 10 0
Sofia 1 NA Toulouse 1 0
Praha 1 0 Athina 2 0
Berlin 4 2 Budapest 2 0
Bremen 2 0 Dublin 1 0
Dortmund 2 0 Genova 0 4
Dresden 1 0 Milano 2 0
Duisburg 4 0 Napoli 0 3
Düsseldorf 2 0 Palermo 0 3
Essen 1 1 Roma 0 4
Frankfurt am Main 2 0 Torino 0 2
Hamburg 1 0 Vilnius 1 0
Hannover 2 0 Riga 1 0
Köln 2 1 Amsterdam 1 3
Leipzig 1 0 Rotterdam 1 0
München 2 0 Oslo 1 NA
Nuremberg 2 0 Krakow 2 0
Stuttgart 4 0 Lodz 1 0
København 2 0 Poznan 1 0
Barcelona 2 0 Warszawa 2 0
Madrid 10 1 Wroclaw 2 0
Málaga 2 1 Lisboa 4 1
Sevilla 5 0 Bucuresti 0 NA
Valencia 0 5 Stockholm 0 NA
Zaragoza 0 2 Birmingham 4 NA
Helsinki 2 0 Glasgow 2 NA
Bordeaux 3 0 Leeds 0 NA
Lille 3 0 London 8 NA
Lyon 1 1 Sheffield 2 NA
Marseille 1 0
Note: NA: data was not available

158/162 E-PRTR data review 2009 ETC/ACC - ETC/SCP
APPENDIX IX– Results of total nitrogen emissions comparison SoE and E-PRTR
RBD period
SoE data (1)
N UW ratio EPRTR to SoE
(>100,000 p.e.)
N industry ratio EPRTR to SoE
N total ratio EPRTR to SoE
AT1000 2007 30% 100%* 18%
AT2000 2007 104% NA 54%
AT5000 2007 NA NA NA
BE_Escaut_RW 2005 NA 44% 127%
BE_Meuse_RW 2005 NA 58% 16%
BE_Rhin_RW 2005 NA NA NA
BE_Seine_RW 2005 NA NA NA
BEMaas_VL 2008 NA NA 0%
BESchelde_VL 2008 118% NA 38%
BG1000 2007 NA NA 4126%
BG2000 2008 NA NA 5317%
BG3000 2007 NA NA 251%
BG4000 2007 NA NA NA
CZ_RB_1000 2006 NA NA 13%
CZ_RB_5000 2006 NA NA 32%
CZ_RB_6000 2006 NA NA 30%
EE1 2008 90% NA 71%
EE2 2008 86% NA 34%
EE3 2008 NA NA NA
FIVHA1 2008 NA 90% 50%
FIVHA2 2008 NA 55% 59%
FIVHA3 2008 NA 66% 40%
FIVHA4 2008 NA 44% 33%
FIVHA5 2008 NA 92% 52%
FIVHA6 2008 NA 100% 61%
FIVHA7 2008 NA NA NA
FIWDA 2008 NA NA NA
FRA 2007 110% 40% 58%
FRB1 2007 NA NA 22%
FRB2 2007 NA NA NA
FRC 2007 96% 60% 46%
FRD 2007 77% 30% 41%
FRE 2007 NA NA 0%
FRF 2007 153% 48% 60%
FRG 2007 103% 41% 40%
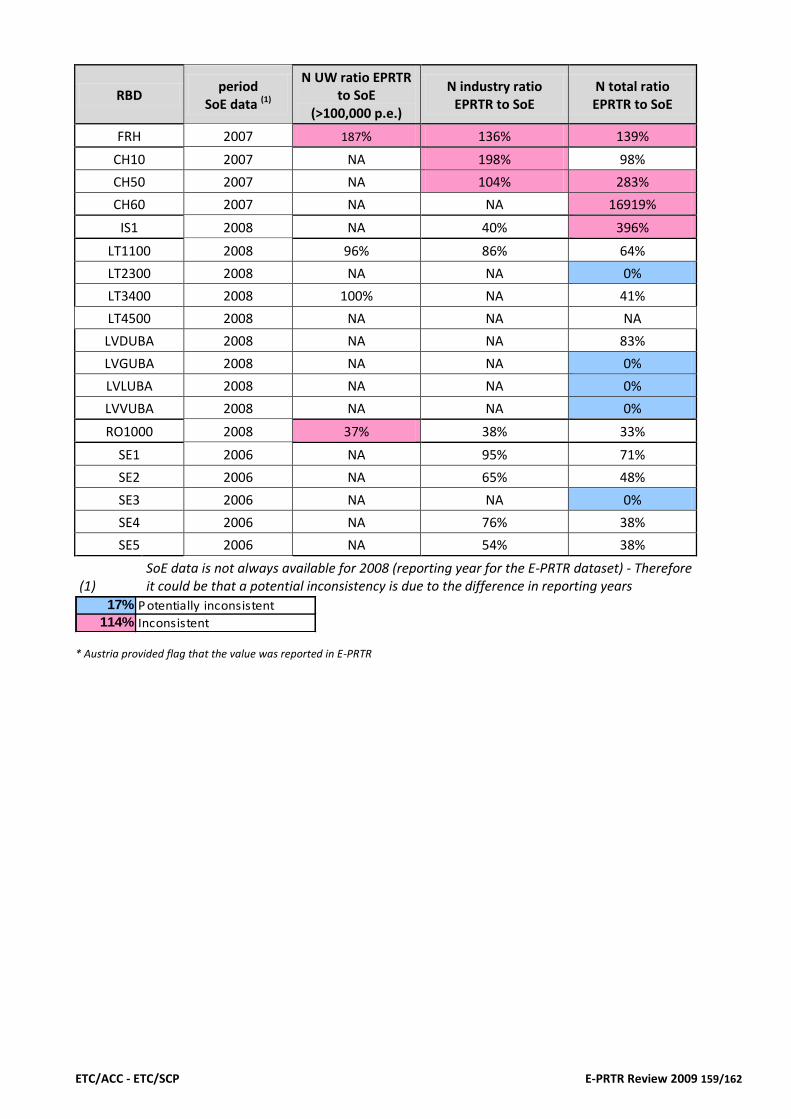
159
ETC/ACC - ETC/SCP E-PRTR Review 2009 159/162
RBD period
SoE data (1)
N UW ratio EPRTR to SoE
(>100,000 p.e.)
N industry ratio EPRTR to SoE
N total ratio EPRTR to SoE
FRH 2007 187% 136% 139%
CH10 2007 NA 198% 98%
CH50 2007 NA 104% 283%
CH60 2007 NA NA 16919%
IS1 2008 NA 40% 396%
LT1100 2008 96% 86% 64%
LT2300 2008 NA NA 0%
LT3400 2008 100% NA 41%
LT4500 2008 NA NA NA
LVDUBA 2008 NA NA 83%
LVGUBA 2008 NA NA 0%
LVLUBA 2008 NA NA 0%
LVVUBA 2008 NA NA 0%
RO1000 2008 37% 38% 33%
SE1 2006 NA 95% 71%
SE2 2006 NA 65% 48%
SE3 2006 NA NA 0%
SE4 2006 NA 76% 38%
SE5 2006 NA 54% 38%
(1) SoE data is not always available for 2008 (reporting year for the E-PRTR dataset) - Therefore it could be that a potential inconsistency is due to the difference in reporting years
17%
114%
P otentially inconsistent
Inconsistent
* Austria provided flag that the value was reported in E-PRTR

160/162 E-PRTR data review 2009 ETC/ACC - ETC/SCP
APPENDIX X– Results of total phosphorus emissions comparison SoE and E-PRTR
RBD period SoE data
(1)
P UW ratio EPRTR to SoE
(>100,000 p.e.)
P industry ratio EPRTR to SoE
P total ratio EPRTR to SoE
AT1000 2007 21% 100%* 11%
AT2000 2007 0% NA 0%
AT5000 2007 NA NA NA
BE_Escaut_RW 2005 NA 35% 125%
BE_Meuse_RW 2005 NA 133% 61%
BE_Rhin_RW 2005 NA NA NA
BE_Seine_RW 2005 NA NA NA
BEMaas_VL 2008 NA NA 0%
BESchelde_VL 2008 106% NA 52%
BG1000 2007 NA NA 6628%
BG2000 2008 NA NA 3666%
BG3000 2007 NA NA 5259%
BG4000 2007 NA NA NA
CZ_RB_1000 2006 NA NA 6%
CZ_RB_5000 2006 NA NA 11%
CZ_RB_6000 2006 NA NA 8%
EE1 2008 88% NA 57%
EE2 2008 66% NA 20%
EE3 2008 NA NA NA
FIVHA1 2008 NA 55% 31%
FIVHA2 2008 NA 45% 47%
FIVHA3 2008 NA 67% 36%
FIVHA4 2008 NA 68% 24%
FIVHA5 2008 NA 90% 54%
FIVHA6 2008 NA NA NA
FIVHA7 2008 NA NA NA
FIWDA 2008 NA NA NA
FRA 2007 87% 61% 44%
FRB1 2007 NA 0% 0%
FRB2 2007 NA NA 0%
FRC 2007 85% 35% 21%
FRD 2007 84% 18% 33%
FRE 2007 NA NA 0%
FRF 2007 92% 41% 30%
FRG 2007 78% 17% 23%

161
ETC/ACC - ETC/SCP E-PRTR Review 2009 161/162
RBD period SoE data
(1)
P UW ratio EPRTR to SoE
(>100,000 p.e.)
P industry ratio EPRTR to SoE
P total ratio EPRTR to SoE
FRH 2007 58% 102% 40%
CH10 2007 NA 5067% 120%
CH50 2007 NA 85% 344%
CH60 2007 NA NA NA
IS1 2008 NA 26% 345%
LT1100 2008 89% 0% 37%
LT2300 2008 NA 182% 21%
LT3400 2008 0% NA 0%
LT4500 2008 NA NA 0%
LVDUBA 2008 NA NA 65%
LVGUBA 2008 NA NA 0%
LVLUBA 2008 NA NA 0%
LVVUBA 2008 NA NA 0%
RO1000 2008 26% 7% 19%
SE1 2006 NA 90% 31%
SE2 2006 NA 67% 28%
SE3 2006 NA 65% 19%
SE4 2006 NA 47% 18%
SE5 2006 NA 58% 34%
(1) SoE data is not always available for 2008 (reporting year for the E-PRTR dataset) - Therefore it could be that a potential inconsistency is due to the difference in reporting years
17%
114%
P otentially inconsistent
Inconsistent
* Austria provided flag that the value was reported in E-PRTR
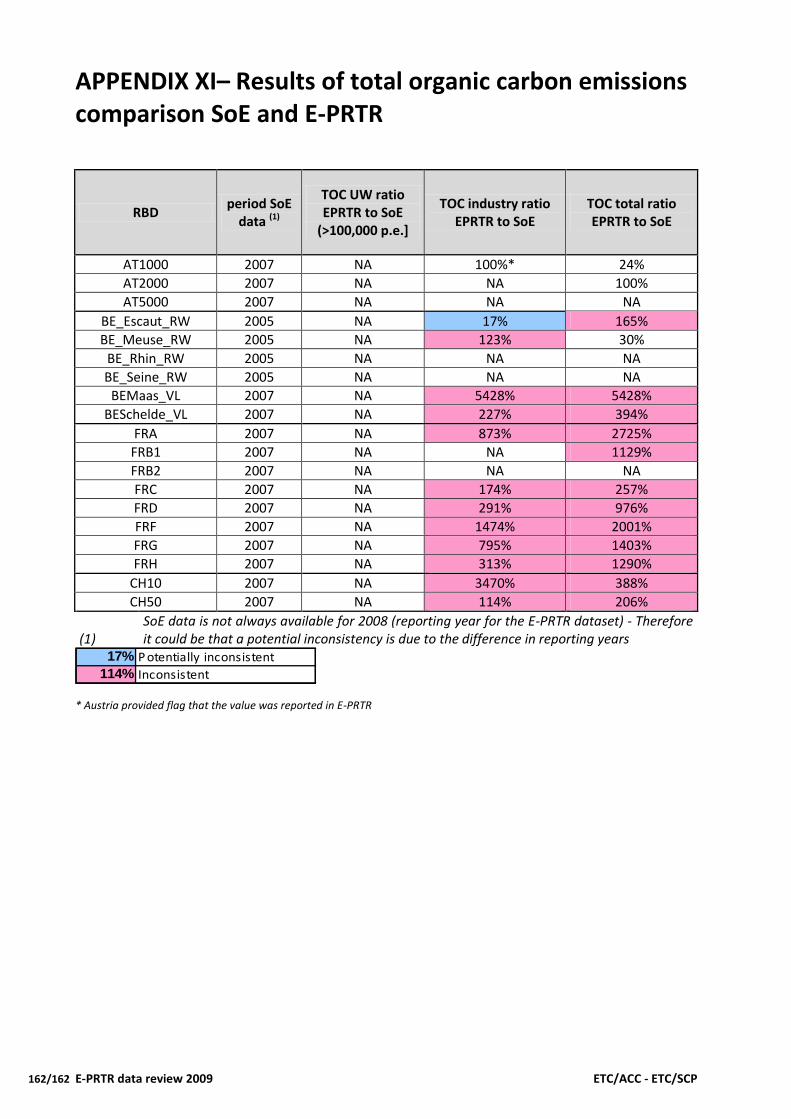
162/162 E-PRTR data review 2009 ETC/ACC - ETC/SCP
APPENDIX XI– Results of total organic carbon emissions comparison SoE and E-PRTR
RBD period SoE
data (1)
TOC UW ratio EPRTR to SoE
(>100,000 p.e.]
TOC industry ratio EPRTR to SoE
TOC total ratio EPRTR to SoE
AT1000 2007 NA 100%* 24%
AT2000 2007 NA NA 100%
AT5000 2007 NA NA NA
BE_Escaut_RW 2005 NA 17% 165%
BE_Meuse_RW 2005 NA 123% 30%
BE_Rhin_RW 2005 NA NA NA
BE_Seine_RW 2005 NA NA NA
BEMaas_VL 2007 NA 5428% 5428%
BESchelde_VL 2007 NA 227% 394%
FRA 2007 NA 873% 2725%
FRB1 2007 NA NA 1129%
FRB2 2007 NA NA NA
FRC 2007 NA 174% 257%
FRD 2007 NA 291% 976%
FRF 2007 NA 1474% 2001%
FRG 2007 NA 795% 1403%
FRH 2007 NA 313% 1290%
CH10 2007 NA 3470% 388%
CH50 2007 NA 114% 206%
(1) SoE data is not always available for 2008 (reporting year for the E-PRTR dataset) - Therefore it could be that a potential inconsistency is due to the difference in reporting years
17%
114%
P otentially inconsistent
Inconsistent
* Austria provided flag that the value was reported in E-PRTR