e-reader and tablet measurement solutions - … as 3g cards/dongles. can also have ebook...
TRANSCRIPT

Copyright © 2010 The Nielsen Company. Confidential and proprietary.
e-Reader and Tablet Measurement Solutions
e-Reader and Tablet Measurement Solutions
Shiven Ramji – VP, Product Leadership
December 1, 2010

2
Copyright © 2010 The Nielsen Company. Confidential and proprietary.
• Connected devices – any device that
can access the internet (IP enabled).
• Mobile – any feature or smart phone.
Also includes data enabled devices
such as 3G cards/dongles. Can also
have eBook capabilities. Examples –
iPhone, Windows7 Phone etc
• e-Readers – device built specifically for
reading like Kindle, Nook
• Tablets – device with similar computing
powers like a PC in the palm of your
hands. This is a device capable of e-
Reading, like the iPad, Galaxy Tab
What are weMeasuring?
e-Reader and Tablet Measurement Solutions
As of now, we are aiming to address e-
Reader & Tablet measurement as part
of our mobile measurement strategy.

3
Copyright © 2010 The Nielsen Company. Confidential and proprietary.
• Cover all connected devices
• Metrics for audience and ad
exposure measurement
• Cross-media measurement
• User privacy
• Measures people and their
behavior, not just devices
Client & Industry Needs
e-Reader and Tablet Measurement Solutions
How will magazine measurement
change with e-Readers & Tablets?

4
Copyright © 2010 The Nielsen Company. Confidential and proprietary.
Audience Measurement

5
Copyright © 2010 The Nielsen Company. Confidential and proprietary.
• Multiple devices & platforms
to measure
• Multiple data sources and
variance in data capture
• No “one global solution”
• Participation and cooperation
from operators, publishers and
ad networks etc.
• Evolving category & market
dynamics
• Do the same metrics apply?
MeasurementChallenges
e-Reader and Tablet Measurement Solutions

6
Copyright © 2010 The Nielsen Company. Confidential and proprietary.
With proliferationof devices, we need to prioritize measurement
e-Reader and Tablet Measurement Solutions
Our focus is on iOS and Android with large growth in share of Android expected based
on recent acquirers; WinMo becoming less relevant
Source: Mobile Insights, Q3 2010

7
Copyright © 2010 The Nielsen Company. Confidential and proprietary.
With proliferationof devices, we need to prioritize measurement
e-Reader and Tablet Measurement Solutions
Our focus is on iOS and Android with large growth in share of Android expected based
on recent acquirers; WinMo becoming less relevant
Source: Mobile Insights, Q3 2010
8
Copyright © 2010 The Nielsen Company. Confidential and proprietary.
e-Reader and Tablet Measurement Solutions
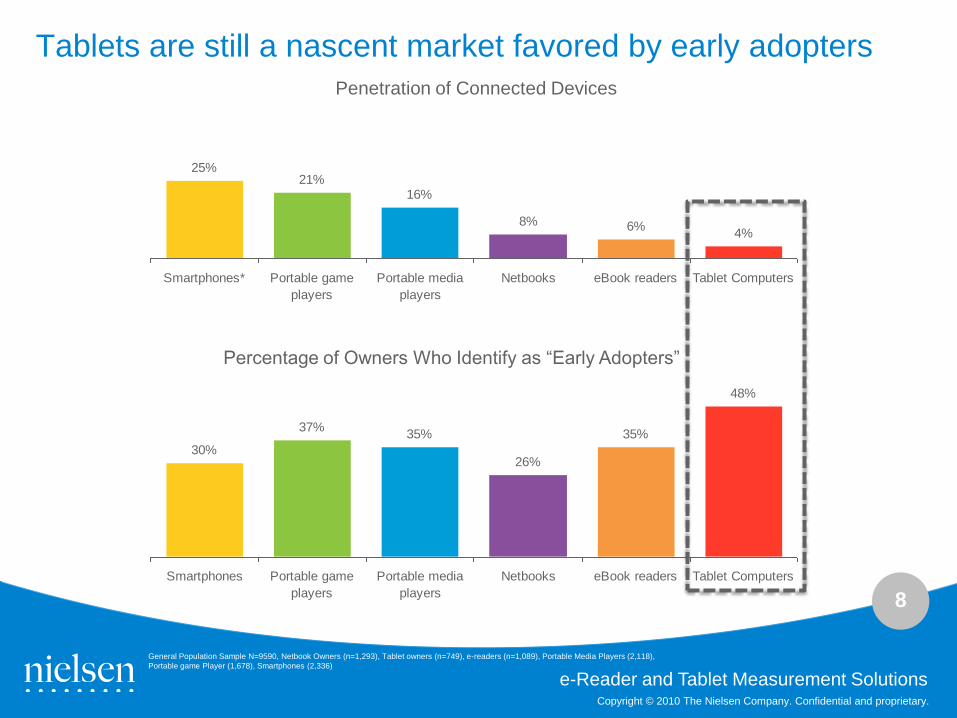
4%6%8%
16%21%
25%
Tablet ComputerseBook readersNetbooksPortable media
players
Portable game
players
Smartphones*
Tablets are still a nascent market favored by early adopters
48%
35%
26%
35%37%
30%
Tablet ComputerseBook readersNetbooksPortable media
players
Portable game
players
Smartphones
Percentage of Owners Who Identify as “Early Adopters”
General Population Sample N=9590, Netbook Owners (n=1,293), Tablet owners (n=749), e-readers (n=1,089), Portable Media Players (2,118),
Portable game Player (1,678), Smartphones (2,336)
Penetration of Connected Devices
9
Copyright © 2010 The Nielsen Company. Confidential and proprietary.
e-Reader and Tablet Measurement Solutions
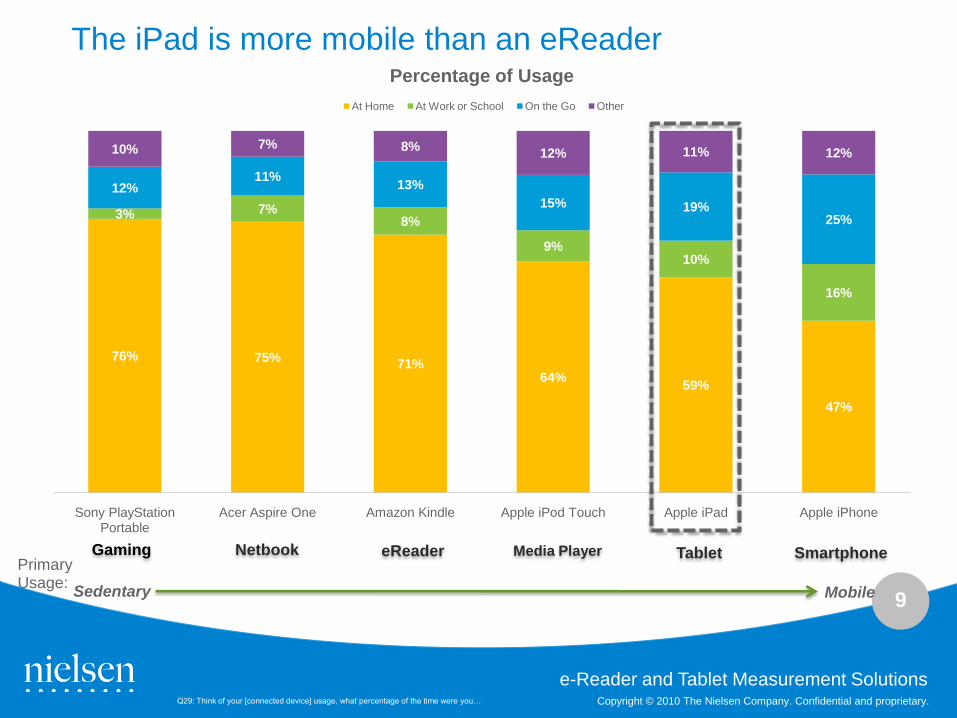
76% 75%71%
64%59%
47%
3% 7%8%
9%10%
16%
12%11%
13%
15% 19%25%
10% 7% 8%12% 11% 12%
Sony PlayStation Portable
Acer Aspire One Amazon Kindle Apple iPod Touch Apple iPad Apple iPhone
Percentage of Usage
At Home At Work or School On the Go Other
The iPad is more mobile than an eReader
Sedentary Mobile
Primary Usage:
Q29: Think of your [connected device] usage, what percentage of the time were you…
Gaming Netbook eReader Media Player Tablet Smartphone

10
Copyright © 2010 The Nielsen Company. Confidential and proprietary.
e-Reader and Tablet Measurement Solutions
33%
34%
44%
46%
55%
62%
67%
66%
56%
54%
45%
38%
eReaders
Smartphones
Netbooks
Tablets
Media Players
Gaming
Sharing of Connected Device
I share my device I am the only user
And less personal than a smartphone
Q9: Who in your household uses each of these device categories that you own?0

11
Copyright © 2010 The Nielsen Company. Confidential and proprietary.
e-Reader and Tablet Measurement Solutions
Print and video benefit from the iPad’s larger screen size
39%
33% 32%
25%
21%
44%
41%
13%11% 12%
8%
22%
53%51%
Book TV Show Movie Magazines Radio News Music
Content Regularly Accessed
iPad iPhone
N= 452, 864
Q38: Which of the following media content do you regularly access through your connected device?
12
Copyright © 2010 The Nielsen Company. Confidential and proprietary.
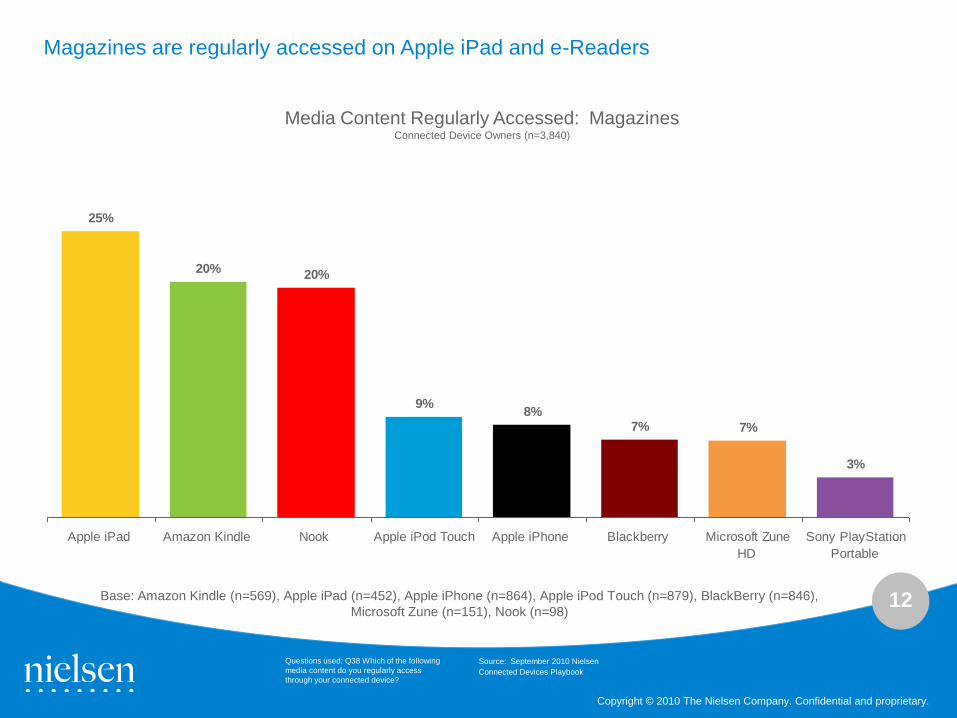
25%
20% 20%
9%8%
7% 7%
3%
Apple iPad Amazon Kindle Nook Apple iPod Touch Apple iPhone Blackberry Microsoft Zune
HD
Sony PlayStation
Portable
Media Content Regularly Accessed: MagazinesConnected Device Owners (n=3,840)
Magazines are regularly accessed on Apple iPad and e-Readers
Base: Amazon Kindle (n=569), Apple iPad (n=452), Apple iPhone (n=864), Apple iPod Touch (n=879), BlackBerry (n=846),
Microsoft Zune (n=151), Nook (n=98)
Source: September 2010 Nielsen
Connected Devices Playbook
Questions used: Q38 Which of the following
media content do you regularly access
through your connected device?

13
Copyright © 2010 The Nielsen Company. Confidential and proprietary.
Base: Apple iPad (n=111), Amazon Kindle (n=117), Apple iPod Touch (n=79), Apple
iPhone (n=118), Blackberry (n=86)
18%
6%
18% 18%9%
20%
7%
22% 21%
21%
30%
24%
27%
36%
15%
26%
26%
21%
36%
35%14%
27%
17%
15%
33%
18%
31%17%
12%
16%33% 26%
18%
27%17%
25%23%
18%
14%
7%
5% 9% 9% 12%
7%
9%12% 9%
0%
6%2% 0% 2% 2%
6%
1% 3% 3%2% 6% 3% 4% 1% 1% 5% 0% 2% 2%
12%
19%
Amazon
Kindle
Apple iPhone Apple iPad Apple iPod
Touch
Blackberry Amazon
Kindle
Apple iPhone Apple iPad Apple iPod
Touch
Blackberry
Less than 5 minutes 5 to 15 minutes 16 to 30 minutes 31 to 60 minutes 1-2 hrs More than 2-4 hrs More than 4 hrs
Length of Time per Session when Magazines are Consumed on DeviceRegularly Access Magazines on the Connected Device
Weekday Time Weekend Time
Apple iPad owners spend more time reading magazines over weekdays while Kindle owners spend more time reading magazines on their device over the weekend
Source: September 2010 Nielsen
Connected Devices Playbook
Questions used: Q46 On a weekday for each session, how long do
you typically access [MEDIA CONTENT TYPE] on each of your
connected devices?
Q47 On a weekend for each session, how long do you typically
access [MEDIA CONTENT TYPE] on each of your connected
devices?
14
Copyright © 2010 The Nielsen Company. Confidential and proprietary.
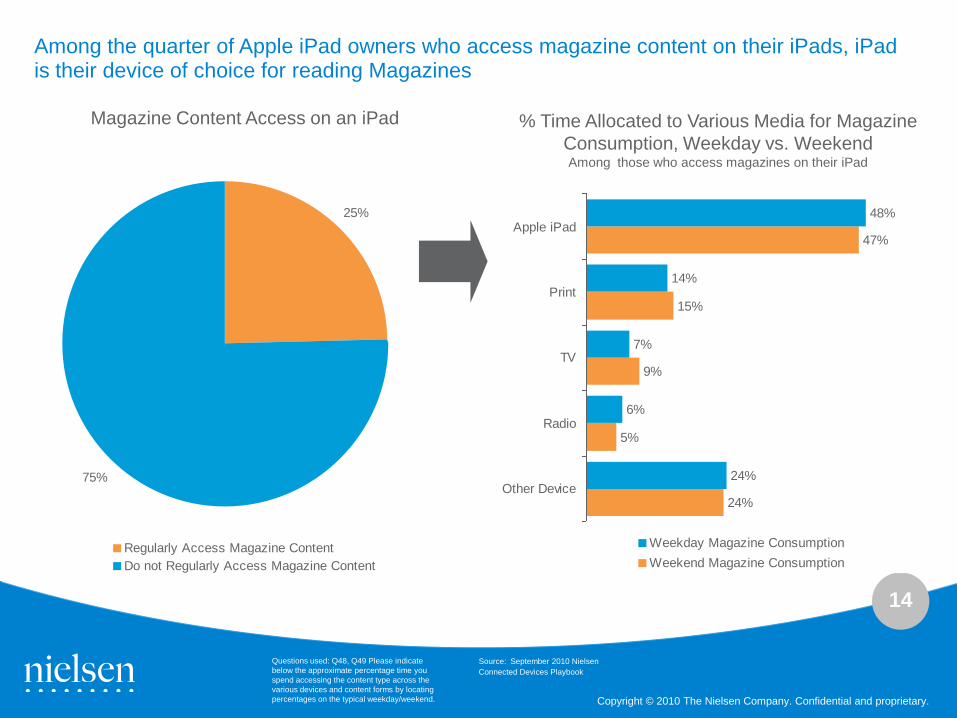
25%
75%
Regularly Access Magazine Content
Do not Regularly Access Magazine Content
Magazine Content Access on an iPad
24%
5%
9%
15%
47%
24%
6%
7%
14%
48%
Other Device
Radio
TV
Apple iPad
Weekday Magazine Consumption
Weekend Magazine Consumption
Among the quarter of Apple iPad owners who access magazine content on their iPads, iPad is their device of choice for reading Magazines
% Time Allocated to Various Media for Magazine
Consumption, Weekday vs. WeekendAmong those who access magazines on their iPad
Source: September 2010 Nielsen
Connected Devices Playbook
Questions used: Q48, Q49 Please indicate
below the approximate percentage time you
spend accessing the content type across the
various devices and content forms by locating
percentages on the typical weekday/weekend.

15
Copyright © 2010 The Nielsen Company. Confidential and proprietary.
20%
80%
Regularly Access Magazine Content
Do not Regularly Access Magazine Content
Magazine Content Access on a Kindle
25%
3%
5%
21%
45%
25%
4%
5%
20%
46%
Other Device
Radio
TV
Amazon Kindle
Weekday Magazine Consumption
Weekend Magazine Consumption
Among the fifth of Kindle owners who access magazines regularly on their device, Kindle is primarily used for reading Magazines, followed by other devices and traditional Print
% Time Allocated to Various Media for Magazine
Consumption, Weekday vs. WeekendAmong those who access magazines on their Kindle
Source: September 2010 Nielsen
Connected Devices Playbook
Questions used: Q48, Q49 Please indicate
below the approximate percentage time you
spend accessing the content type across the
various devices and content forms by locating
percentages on the typical weekday/weekend.

16
Copyright © 2010 The Nielsen Company. Confidential and proprietary.
Connected device owners are comfortable with mobile advertising
N=3,894; 379
Q58: Please think about mobile ads on your connected devices. How much do you agree or disagree with the following statements about advertising on your mobile device
48%
57%
44%
59%
I do not particularly enjoy viewing ads on my connected devices but I do not mind seeing them either
I am ok with advertising if it means that I can access content for free
Receptivity to Advertising
All Connected Device Owners iPad Owners
e-Reader and Tablet Measurement Solutions
17
Copyright © 2010 The Nielsen Company. Confidential and proprietary.
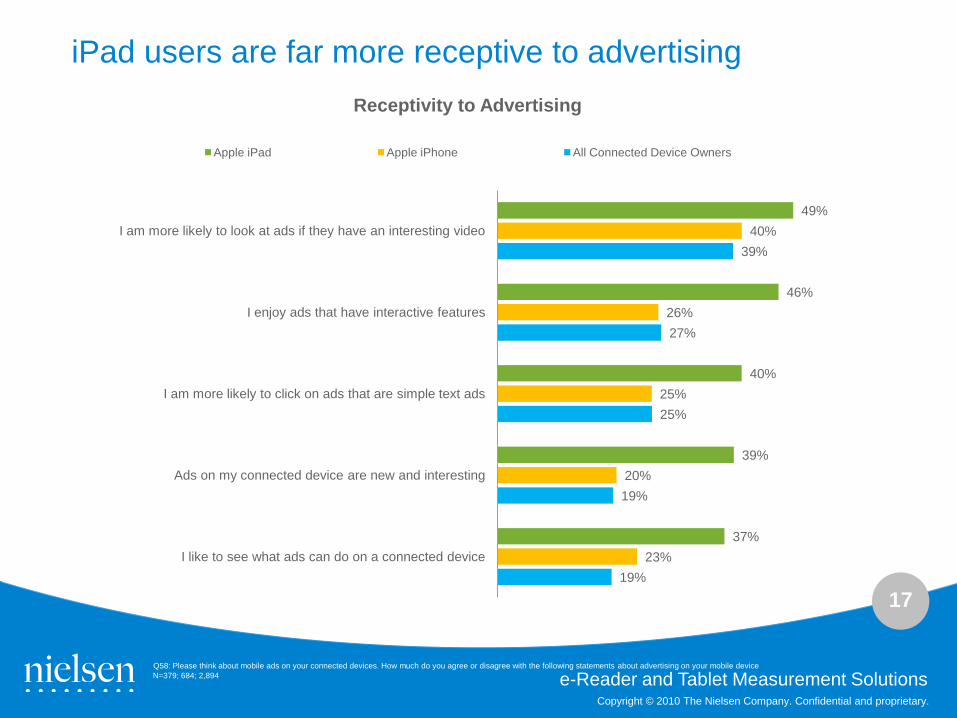
iPad users are far more receptive to advertising
N=379; 684; 2,894
Q58: Please think about mobile ads on your connected devices. How much do you agree or disagree with the following statements about advertising on your mobile device
19%
19%
25%
27%
39%
23%
20%
25%
26%
40%
37%
39%
40%
46%
49%
I like to see what ads can do on a connected device
Ads on my connected device are new and interesting
I am more likely to click on ads that are simple text ads
I enjoy ads that have interactive features
I am more likely to look at ads if they have an interesting video
Receptivity to Advertising
Apple iPad Apple iPhone All Connected Device Owners
e-Reader and Tablet Measurement Solutions

18
Copyright © 2010 The Nielsen Company. Confidential and proprietary.
9%
13%
20%
18%
5%
7%
10%
27%
7%
10%
22%
18%
8%
12%
24%
36%
Discussed a product or service that I saw advertised with a friend, family
Used or requested a coupon thorough an ad
I clicked on an ad to view the full advertisement or product offering
I searched for more information
I made a purchase directly through my connected device
I made a purchase over the telephone
I made a purchase at a store
I made a purchase on the internet via PC
Response to Advertising
iPad All Devices
iPad owners more likely to make a purchase after viewing an ad
N=379; 2,894
Q60: Which of the following do you recall happening in the past 3 months when viewing ads on your connected devices?
e-Reader and Tablet Measurement Solutions

19
Copyright © 2010 The Nielsen Company. Confidential and proprietary.
Measurement Today Going Forward
So how are we going to measure this?
e-Reader and Tablet Measurement Solutions
• As magazine readers move to e-Readers and Tablets for magazine
consumption, the measurement will also move to more behavorial
electronic measurement
• The challenges then are similar (not always the same) to what we
are seeing in mobile measurement.
Recall
methodology
(self-reported)
Behavioral-
based
methodology
(passive
electronic)
20
Copyright © 2010 The Nielsen Company. Confidential and proprietary.
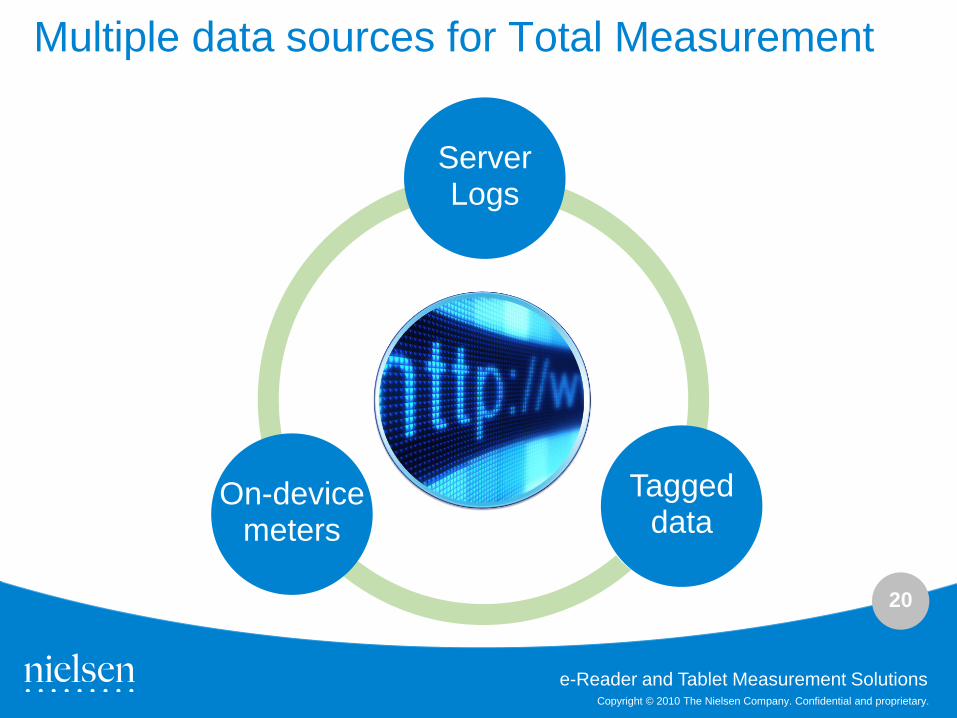
Multiple data sources for Total Measurement
On-devicemeters
Taggeddata
ServerLogs
e-Reader and Tablet Measurement Solutions

21
Copyright © 2010 The Nielsen Company. Confidential and proprietary.
Strengths•Captures entire devices usage
(internet/apps/Voice/Text/PIM)
•Internet and application usage
•Panel-based = demographics
Weaknesses•No “One Fits All” meter solution – need
meter for each platform
•Each meter captures data slightly
differently
•URL data only captured in browser, not in
Apps in many cases
•Video stream data in apps isn’t captured
•Recruitment challenges (difficult and
expensive)
Strengths• Census measurement – captures data
from all sources (PC, Mobile, Connected
Devices, Gaming devices)
• Will be essential link for 2 screen
measurement
• Solution can be implemented globally
Weaknesses•Cookie issues on certain smartphones
(iPhone) only capturing 10% of uniques
•Requires additional processing of header
information for accurate browser
projections by OS
•Requires publishers participation to
implement tags
Strengths• Census measurement of all internet
traffic
Weaknesses•Gaps in measurement e.g. wifi, certain
smartphones not captured
•Many sources required for currency
measurement
•Differences in coverage by data source
(Operator A vs. Operator B vs. Aggregator
C)
•Requires panel match for demographics
•Not a global solution
•Requires large IT infrastructure
User Centric Tagging Server Logs
e-Reader and Tablet Measurement Solutions

22
Copyright © 2010 The Nielsen Company. Confidential and proprietary.
Progress so far with Mobile OS measurement
In progress In Field Definition Definition
ODM + Tagging +
Server Logs
ODM + Online +
TVandPC PanelsEnumeration,
Weighting, QA
Web Reporting
Tools
ReportingWeighting &
Projection
Sample
Buildout
Data
Collection
e-Reader and Tablet Measurement Solutions
23
Copyright © 2010 The Nielsen Company. Confidential and proprietary.
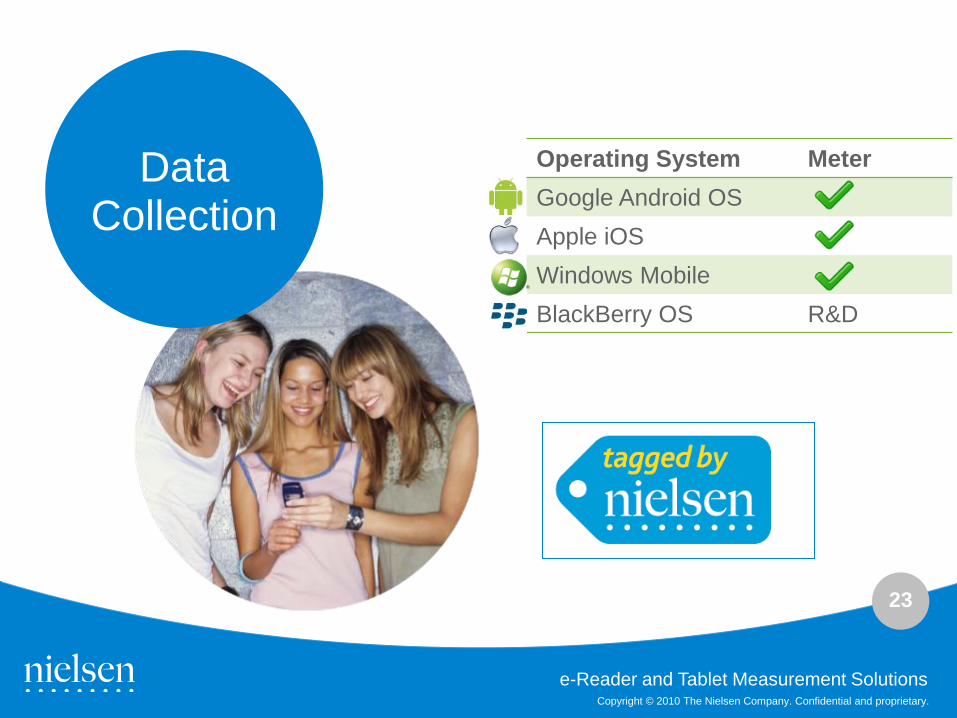
DataCollection
Operating System Meter
Google Android OS
Apple iOS
Windows Mobile
BlackBerry OS R&D
e-Reader and Tablet Measurement Solutions
24
Copyright © 2010 The Nielsen Company. Confidential and proprietary.
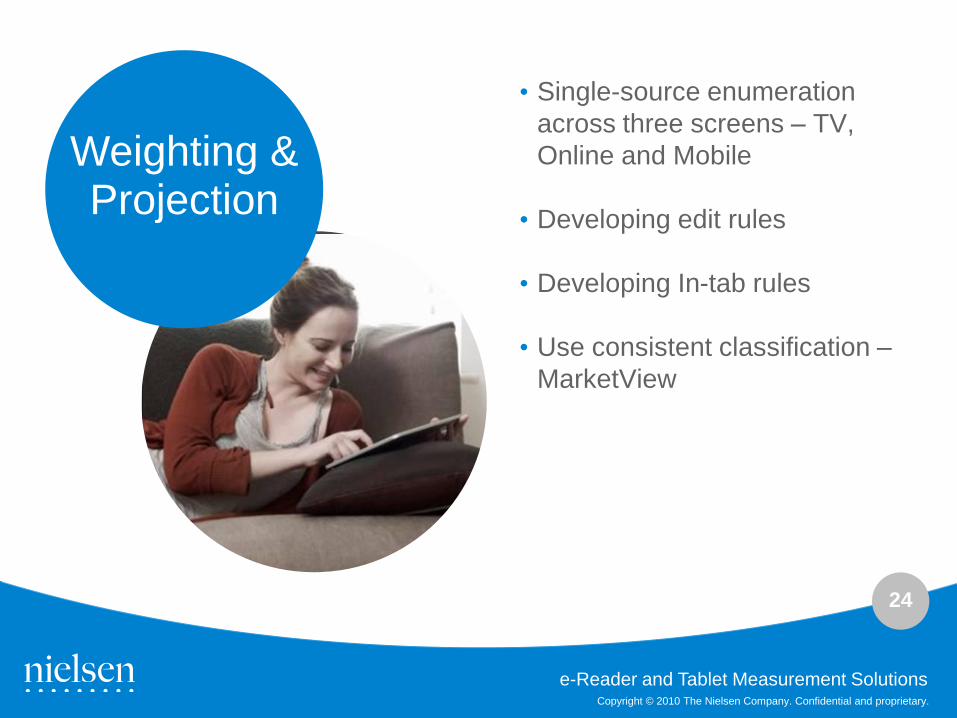
• Single-source enumeration
across three screens – TV,
Online and Mobile
• Developing edit rules
• Developing In-tab rules
• Use consistent classification –
MarketView
Weighting & Projection
e-Reader and Tablet Measurement Solutions

25
Copyright © 2010 The Nielsen Company. Confidential and proprietary.
• Using the same metrics as
NetView where applicable for
mobile web.
• Integrated reporting of internet
and apps in one report
• Unduplicated audience /
overlap
Client Reporting
e-Reader and Tablet Measurement Solutions
Are there any new metrics? Are
the same metrics as the
desktop web and/or mobile web
applicable?
26
Copyright © 2010 The Nielsen Company. Confidential and proprietary.
Campaign Measurement
e-Reader and Tablet Measurement Solutions

27
Copyright © 2010 The Nielsen Company. Confidential and proprietary.
e-Reader and Tablet Measurement Solutions
Advertising Effectiveness Measurement
REACH RECEPTIVITY RESONANCE REACTION
Did the campaign reach the brand’s target?
• Reach /
Frequency
• Demographics
and Segment
composition
• Program
engagement
• Dwell time
• Interaction
Did the media placement deliver engaged viewers?
•Ad recall
•Brand recall
•Message recall
•Custom studies
Did the campaign generate the desired results?
Response• Search, View-Thru,
Purchase Intent
Conversion• CPG Offline Sales,
TV Tune-in

28
Copyright © 2010 The Nielsen Company. Confidential and proprietary.
e-Reader and Tablet Measurement Solutions
Acme Hybrid Sedan Q2Y10 Online Run of NetworkStrategic Brand Target: Female 25-40 Hybrid Researchers
TOTAL ROI Summary
Campaign Audience Ratings (Reach)
Page Views:
Unique Audience:
65,000,000 (Impressions)
12,000,000 (Consumers)
Brand Effect (Receptivity & Resonance)
Ad Recall:
Product Awareness:
+1,500,000 (Consumers)
+295,000 (Consumers)
Response Effect (Reaction)
Researchers:
Domain Based:
Search Based:
+45,000 (Researchers)
+30,000 (Researchers)
+16,000 (Researchers)
Sales Effect (Reaction)
Short Term Dollar Impact:
Estimated Long Term Impact:
Total Incremental:
+$1,532,000
+$532,000
+$2,064,000
Marketing
Strategy
Trial
Repeat
Upper to Lower FunnelMeasuring the 4 R’s of Advertising
Provide the same capabilities across connected devices
29
Copyright © 2010 The Nielsen Company. Confidential and proprietary.
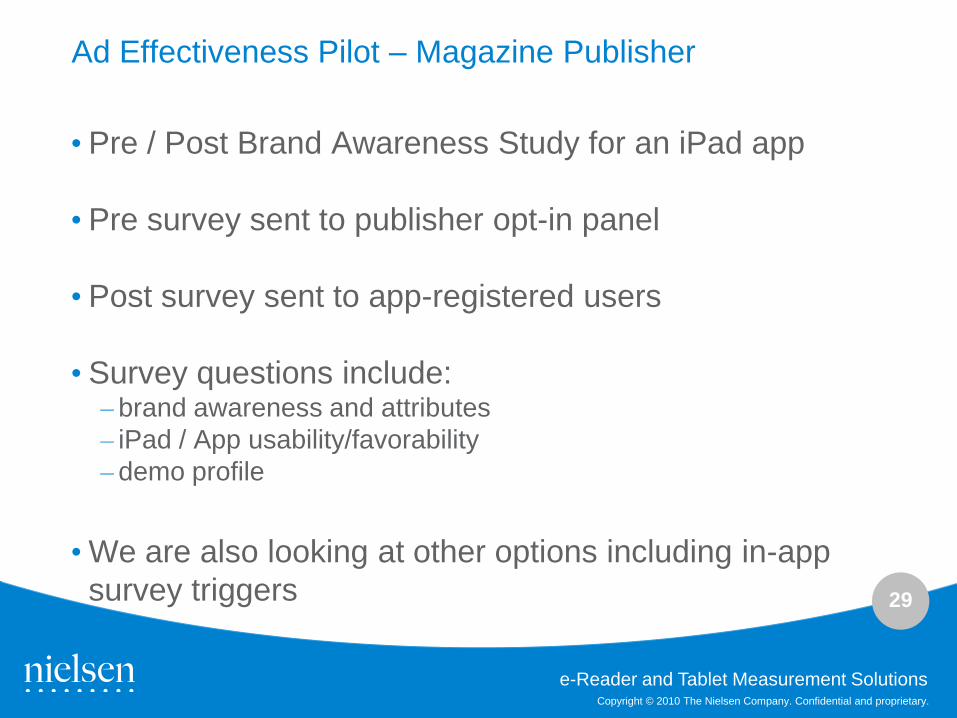
Ad Effectiveness Pilot – Magazine Publisher
• Pre / Post Brand Awareness Study for an iPad app
• Pre survey sent to publisher opt-in panel
• Post survey sent to app-registered users
• Survey questions include:– brand awareness and attributes
– iPad / App usability/favorability
– demo profile
• We are also looking at other options including in-app
survey triggers
e-Reader and Tablet Measurement Solutions
30
Copyright © 2010 The Nielsen Company. Confidential and proprietary.
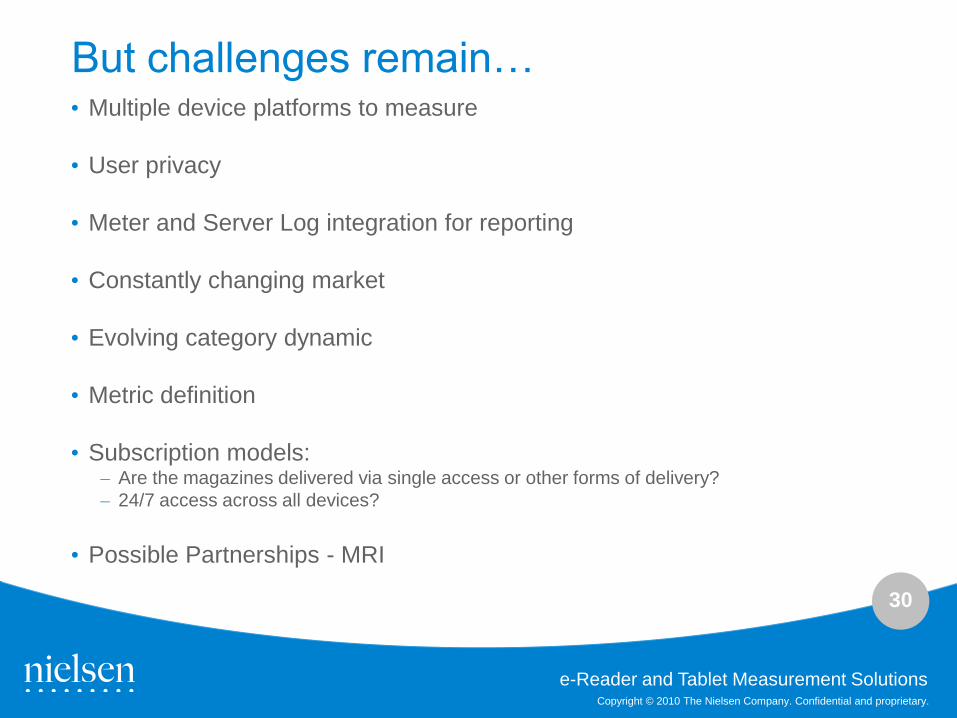
But challenges remain…• Multiple device platforms to measure
• User privacy
• Meter and Server Log integration for reporting
• Constantly changing market
• Evolving category dynamic
• Metric definition
• Subscription models:– Are the magazines delivered via single access or other forms of delivery?
– 24/7 access across all devices?
• Possible Partnerships - MRI
e-Reader and Tablet Measurement Solutions
31
Copyright © 2010 The Nielsen Company. Confidential and proprietary.
&
e-Reader Measurement Solutions
Shiven [email protected]
http://www.twitter.com/thinkshiv
http://www.linkedin.com/in/shivenramji
http://www.facebook.com/shiven.ramji