e-skills gap, national policies and initiatives in the...
TRANSCRIPT

e-Skills gap, national policies and
initiatives in the European Union
Werner B. Korte, Director
empirica GmbH
eSkills for Jobs 2014 - ICT employment needs for 2014
Zagreb, 9th May 2014

e-Skills Gap: Supply and demand: current
situation, trends and forecasts

ICT Workforce Europe 2000-2012
4.5 million
7.4 million
2
3
4
5
6
7
8
2000 2002 2004 2006 2008 2010 2012
Mill
ion
Narrow definition
Broad definition (data only 2011-2012)
Broad definition (until 2010: "backcasting" based on narrow definition growth rates)
2008-2010: 2.65% p.a.
2004-2008: 4.77% p.a.
2001-2004: 0.89% p.a.
2011-2012: 3.94%
2011-2012: 1.82%
2010-2011: 4.11%*
* 2010-2011 break in series
Source: Calculations based on Eurostat LFS data. Some imputations and assumptions apply

Enrolment in and graduates from
Computer Science studies in Europe
(EU27) 1998 - 2012
Computer Science graduates (first degrees/ qualifications in ISCED 5A and 5B)
Enrolment in Computer Science (in ISCED 5A and 5B)
59 6271
83
96106
118126 129
124 121114 115 113 115
0
20
40
60
80
100
120
140
1998 2000 2002 2004 2006 2008 2010 2012
Tho
usa
nd
s
436 449
530
645
727752
794 794 777 761730 722 724 727
0
100
200
300
400
500
600
700
800
900
1998 2000 2002 2004 2006 2008 2010
Tho
usa
nd
s
Source: empirica calculations based on Eurostat data. Some imputations and assumptions apply

Tertiary level computer science graduates in
European countries 2000 – 2011
Source: empirica calculations based on Eurostat data. Some estimates
0
5,000
10,000
15,000
20,000
25,000
30,000
35,000
2000 2001 2002 2003 2004 2005 2006 2007 2008 2009 2010 2011
France
United Kingdom
Germany
Spain
Poland
Netherlands
Czech Republic
Italy
19 other Member States

The Three Scenarios:
Structural Shortages (2012-2020)
509,000
Main Forecast Scenario
913,000
449,000
Stagnation
730,000
274,000
558,000
Disruptive Boost
1,346,000
0
200
400
600
800
1000
1200
1400
1600
2012 2013 2014 2015 2016 2017 2018 2019 2020
Tho
usa
nd
s
Source: Empirica

ICT Workforce Expected Growth
(2011/2020)
44,2%
15,9%
-16,8%
9,3%
15,5%
10,1%
-11,8%
3,2%
8,5%
3,7%
-3,9%
1,8%
Management, businessarchitecture and analysis
ICT practioners -professional level
ICT practitioners -associate/
technician level
Totalcompared to 2011
2020
2015
2012
Source: for 2012 see previous slide. Forecast empirica

Conclusions
• Demand keeps growing despite crisis. Forecasts: even the worst scenario sees increasing excess demand. – Trend in core jobs up to 4% growth p.a.
– Management jobs up to 8% growth p.a.
– Technician/associate level jobs declining
– Need to continuously increase the quality and the relevance of e-skills
• Job growth largest in highly skilled jobs – Management, Architecture and Analytics positions, where also
e-Leadership skills are required. Usually recruited from seasoned practitioner pool and other (non-ICT) managers.
– New job profiles not yet fully covered in classification, such as Big Data and Cloud computing specialists

Conclusions
• Huge opportunity of new jobs creation generated by new mobile technologies, cloud computing, big data, social business etc. in all industry sectors
• Formal education and VET gaps, remaining importance of non-ICT graduate and career changer side entries – Increased importance of continuous professional education,
lifelong learning and executive education
– Importance of new education approaches, new modes of delivery, better curricula and learning outcomes

THANK YOU
Forecasting e-skills demand and supply in Europe

e-Skills Policies and
Strategies in
EU Member States
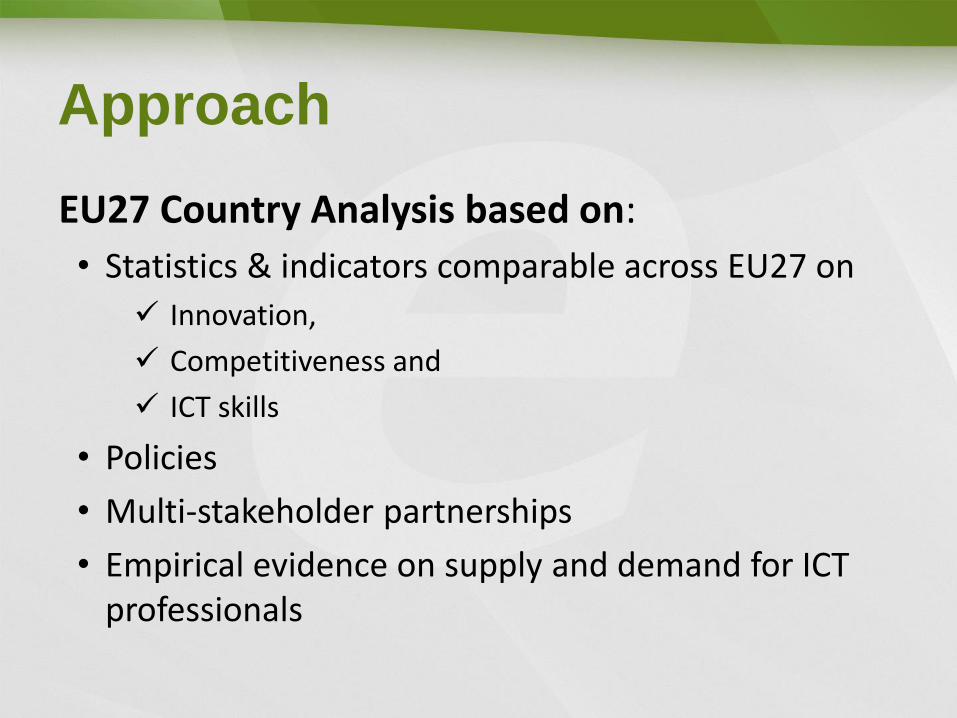
Approach
EU27 Country Analysis based on:
• Statistics & indicators comparable across EU27 on
Innovation,
Competitiveness and
ICT skills
• Policies
• Multi-stakeholder partnerships
• Empirical evidence on supply and demand for ICT professionals

1. Overview
2. Indicators on innovation, competitiveness and ICT skills
3. E-skills demand and supply forecasts 2012 – 2015 – 2020
4. Policy and major stakeholders initiatives
5. Selected multi-stakeholder partnerships
6. Success of e-skills policies and activities in meeting the objectives of the EU e-skills agenda etc.
EU Country e-Skills Monitor
eSk21 Digital Literacy Policy Index
eSk21 eSkills Policy Index
EURA ICT policy index
NRI
NRI Individual readiness
NRI Business readiness
NRI Government readiness
NRI Individual usage
NRI Business usage
NRI Government usage
GCI
ICT professionals
Computer skills
Internet skills
Internet use
Pisa Reading
Pisa Maths
Pisa Science
EU
DE

E-Skills Demand and Supply
Forecasts 2012 – 2015 - 2020 ICT workforce: Demand and Jobs in Germany
2012-2020 (Main Forecast Scenario)
e-Skills shortage: Potential vacancies in Germany
2012-2020 (Main Forecast Scenario)
Source: empirica 2013
Source: empirica 2013
Potential vacancies as percent of ICT workforce
Germany 2012-2020
(Main Forecast Scenario)
Potential vacancies in Europe (EU27) by scenario
2012-2020
Source: empirica 2013
Source: empirica 2013
1,342,0001,420,000
1,582,000
1,261,0001,299,000
1,425,000
0
200,000
400,000
600,000
800,000
1,000,000
1,200,000
1,400,000
1,600,000
1,800,000
2012 2013 2014 2015 2016 2017 2018 2019 2020
Demand potential DE Jobs DE
82,000
94,000
109,000
121,000
132,000
145,000152,000 154,000 156,000
0
20,000
40,000
60,000
80,000
100,000
120,000
140,000
160,000
180,000
2012 2013 2014 2015 2016 2017 2018 2019 2020
Expected vacancies - DE
3.7%
6.8%
11.5%
6.5%
9.3%
11.0%
0.0%
2.0%
4.0%
6.0%
8.0%
10.0%
12.0%
14.0%
2012 2013 2014 2015 2016 2017 2018 2019 2020
EU27 - expected vacancies as % of ICT workforce
DE - expected vacancies as % of ICT workforce
509000
Main ForecastScenario
913000
449000
Stagnation
730000
274000
558000
DisruptiveBoost
1346000
0
200000
400000
600000
800000
1000000
1200000
1400000
1600000
2012 2013 2014 2015 2016 2017 2018 2019 2020

e-Skills Policy Activity Index
No relevant policy or stakeholder activities of significant scope Policy debate is non-existent or sketchy
Some relevant policy or stakeholder activities ... but limited in size and scope and poorly integrated Weak links with mainstream policy-making, no proper evaluation
A larger variety of policy and stakeholder activities ... but limited coordination/integration and sustainability Policy debate well developed but not yet involving all target groups
Has master strategy on e-skills/ ICT practitioners ... ... or no master strategy but policies and stakeholder activities are
comprehensive and well embedded in the national e-skills landscape Policy debate well developed and involving all key target groups Some shortcomings remain (e.g. sustainability, evaluation, coverage)
Has master strategy on e-skills/ ICT practitioners , strong policy leadership
Many relevant policies and initiatives involving all main stakeholders Policy action also strong at sectoral and regional level Policies take a medium to long-term view perspective, proper evaluation

Progress 2009 - 2013
Country 2013 2009 Evolution AT Austria 3.5 2.0 +1.5 BE Belgium 4.0 4.5 -0.5 BG Bulgaria 2.5 1.5 +1.0
CY Cyprus 2.0 1.5 +0.5
CZ Czech Republic 1.5 1.5 0.0 DE Germany 4.0 3.5 +0.5 DK Denmark 4.0 2.5 +1.5
EE Estonia 3.5 1.0 +2.5 EL Greece 1.5 1.5 0.0 ES Spain 2.0 1.0 +1.0 FI Finland 2.5 1.5 +1.0 FR France 4.0 3.0 +1.0 HU Hungary 2.5 3.5 -1.0
IE Ireland 4.5 4.0 +0.5 IT Italy 2.5 1.5 +1.0
LT Lithuania 2.0 1.0 +1.0 LU Luxembourg 2.5 1.5 1.0 LV Latvia 2.5 3.0 -0.5 MT Malta 4.0 4.0 0.0
NL Netherlands 4.0 3.0 +1.0 PL Poland 3.0 2.5 +0.5 PT Portugal 1.5 1.5 0.0
RO Romania 1.5 2.5 -1.0 SE Sweden 4.0 2.5 +1.5 SI Slovenia 1.5 1.5 0.0 SK Slovak Republic 1.5 2.0 -0.5 UK United Kingdom 5.0 5.0 0.0
e-Skills Activity Index EU27 Average:
2009: 2.4 / 5 2013: 2.9 / 5 (+ 0,5) Investigation Period: April – November 2013
© empirica 2013

SE
FI
DK NL
DE
LU
UK
FR
AT
BE
EE
MT IE
CY PT SI
ES
CZ
LT
HU
IT
LV
PL
GR
RO
BG
SK
0
1
2
3
4
5
6
3,5 4 4,5 5 5,5 6
e-S
kills
act
ivit
y In
dex
20
09
Networked Readiness Index 2009
I II
III IV
© empirica 2013

SE
FI
DK NL DE
LU
UK
FR
AT
BE
EE
MT
IE
CY
PT SI
ES
CZ
LT
HU IT LV
PL
SK RO
BG
GR
0
1
2
3
4
5
6
3,5 4 4,5 5 5,5 6
e-S
kills
act
ivit
y In
dex
20
13
Networked Readiness Index 2013
2009 2013
I II
III IV
© empirica 2013
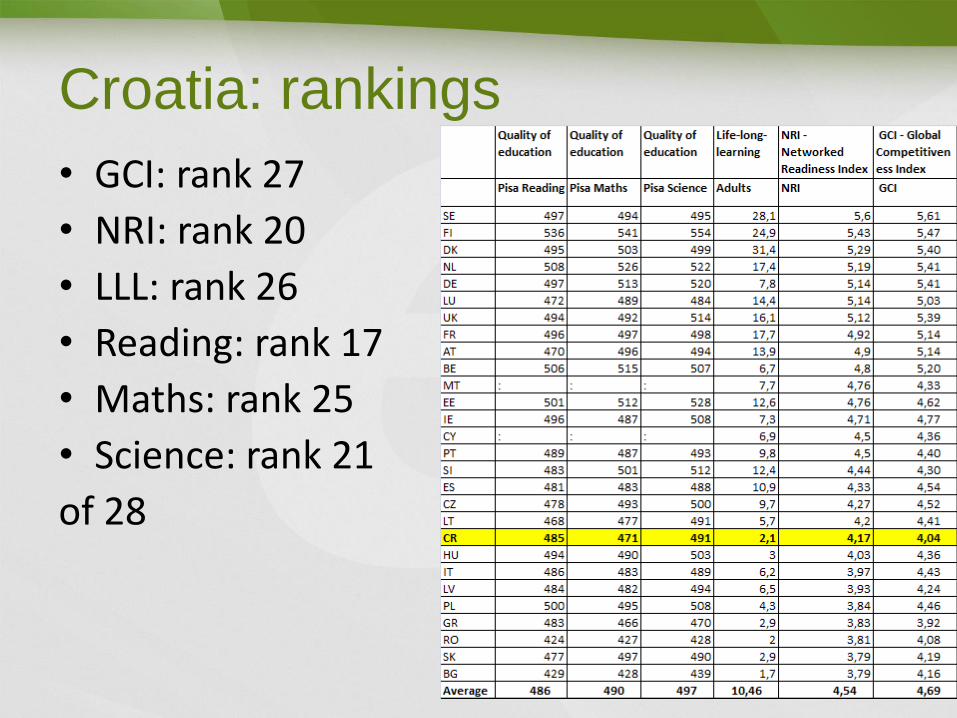
Croatia: rankings
• GCI: rank 27
• NRI: rank 20
• LLL: rank 26
• Reading: rank 17
• Maths: rank 25
• Science: rank 21
of 28
THANK YOU
e-skills policies in the EU27 Member States

Best practice Multi-
Stakeholder Partnerships
on e-Skills in EU Member
States

The Multi-Stakeholder Approach
to e-Skills Development
• Multi-stakeholder partnerships (MSPs) are: – initiatives jointly operated by organisations from the education and
training sector and private-sector partners; – Emphasis on involving key stakeholders which are of relevance for
the e-skills related issue in question.
• Role of private-sector partners (employers, industry associations, NGOs etc.): – Complement and extend services provided by the public sector
enhance resources, achieve faster and stronger impact; – Take over responsibilities which traditionally have been held by
public/civic sector institutions; – Help overcoming polarisation between education provision (public
education system) and skills demand (employers).
24
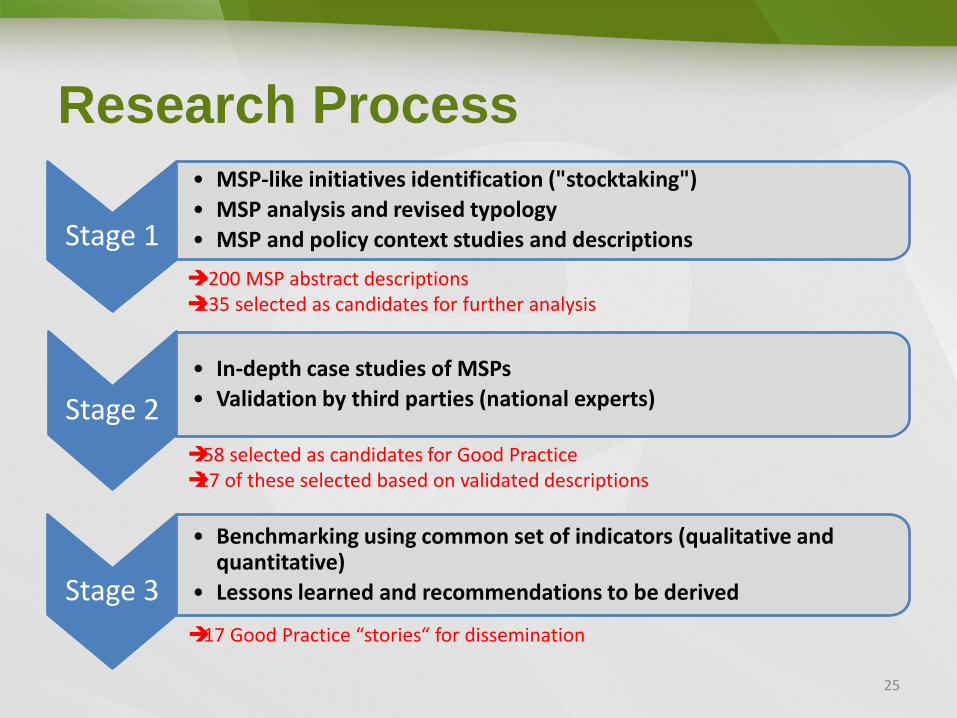
Research Process
25
Stage 1
• MSP-like initiatives identification ("stocktaking")
• MSP analysis and revised typology
• MSP and policy context studies and descriptions
>200 MSP abstract descriptions 135 selected as candidates for further analysis
Stage 2
• In-depth case studies of MSPs
• Validation by third parties (national experts)
58 selected as candidates for Good Practice 17 of these selected based on validated descriptions
Stage 3
• Benchmarking using common set of indicators (qualitative and quantitative)
• Lessons learned and recommendations to be derived
17 Good Practice “stories“ for dissemination

Bo
ost
ing
acq
uis
itio
n a
nd
su
pp
ly o
f e
-ski
lls
Types of MSPs according to focus
Primary & secondary education
Vocational education &
training (VET)
Higher education
Labour market
Sup
po
rt
stru
ctu
res
at
Ind
ivid
ual
leve
l Awareness raising & motivation
Career support & job matching
Financial and fiscal incentives
Further education / LLL
Sup
po
rt
stru
ctu
res
at
syst
em le
vel
e-Skills frameworks
Market information
ICT professionalism & institution building

Selected Good Practices
from the EU

1. Comprehensive
National e-Skills MSP

e-skills UK, United Kingdom
1. Comprehensive
National e-Skills MSP
1. Comprehensive
National e-Skills MSP
Pasc@line Association, France

2. e-Skills Competence
Frameworks, Certification
+ Job Matching
2. e-Skills Competence
Frameworks, Certification
+ Job Matching
EVOLIRIS ICT Reference Centre for Brussels region

RETE Competence Network for the Digital Economy, Italy
2. e-Skills Competence
Frameworks, Certification
+ Job Matching

ECF-NL Working Group Netherlands
2. e-Skills Competence
Frameworks, Certification
+ Job Matching

3. Development and
Provision of Tailored
Education & Training

3. Development and
Provision of Tailored
Education & Training IT Academy Program, Estonia

3. Development and
Provision of Tailored
Education & Training
ITMB Degree, United Kingdom

3. Development and
Provision of Tailored
Education & Training
Get Qualified Scheme, Malta

Level 8 Conversion Programme,
3. Development and
Provision of Tailored
Education & Training
Ireland

4. Career Support,
Lifelong Learning and
e-Leadership Training

4. Career Support,
Lifelong Learning and
e-Leadership Training
Finish IT, Germany

Nokia Bridge,
Finland & global
4. Career Support,
Lifelong Learning and
e-Leadership Training

Software Campus, Germany
4. Career Support,
Lifelong Learning and
e-Leadership Training

5. Awareness Raising and
Providing the Basis at
Early Age

5. Awareness Raising and
Providing the Basis at
Early Age
Sparkling Science, Austria

Coder Dojo, Ireland and worldwide
5. Awareness Raising and
Providing the Basis at
Early Age

New course “Computational Thinking and Practice“, Denmark
5. Awareness Raising and
Providing the Basis at
Early Age

6. Initiatives Focusing on
Girls and Women
6. Initiatives Focusing on
Girls and Women
Frauen in die Technik, Austria

Womentor, Sweden
6. Initiatives Focusing on
Girls and Women
Some findings
• Huge variety of multi-stakeholder initiatives across Europe
• Significant development in sustainability, scope and maturity since 2007
• Key lessons:
– By applying a multi-stakeholder approach to e-skills development, you can make a real difference!
– Policy leadership is helpful, but where it is absent stakeholder initiatives are all the more essential.
– Long breath required (although short-term gains are achievable).
– Make best use of good practices from other countries – there is a wealth of experience to learn from!
51

Best practices as learning cases

Recommendations Croatia
• Primary schools:
– Sparkling science (AT)
• Secondary schools:
– New subject "Computational Thinking and Practice" (DK) (similar development in the UK, currently under development)
– Many initiatives promoting a career in ICT among students in secondary education
• Vocational schools (VET):
– Initiatives by the UK's National Apprenticeship Service (NAS): "IT Professional Apprenticeships" and "Pathways to Apprenticeships" (UK)
– FinishIT (DE)
– SAP's "Bildungspartner" (Training partner) programmes in Germany
53

Recommendations Croatia
• University:
– Comprehensive approach: IT Academy programme (EE)
• Training for those in non-IT areas:
– Level 8 conversion programme (IE)
– Fast Track to IT / FIT (IE)
– Springboard (IE)
• Women:
– Women in technology (AT)
– Womentor (SE)
– Girls Day (DE)
– Rails Girls campaign which originated in Finland (FI)
– France's Women of the Digital Sector Commission
54

Recommendations Croatia
• Women (cont’d):
– UK's "Join the Girls in IT" campaign (UK)
– Swedish Government's 2011 Digital Agenda for Sweden with is clear focus on "increasing the proportion of young people, especially girls and young women, who apply to study ICT-related subjects and programmes in higher education (SE)
• Highly educated unemployed ICT people with skills which are out of scope and demand
– IT 50plus (DE)
– Level 8 Conversion Programme + Springboard (IE)
– ICT Reference Centre Evoliris (BE))
– Literacy Plan and digital training for Barcelona 2010-2015 (ES)
– First Step and Second Step ICT Training Programmes (MT)
55

THANK YOU
Multi-stakeholder partnerships on e-skills

Survey likelihood of offshoring Skills Demand Offshoring chance
Data Visualisation (82%) (62%)
User Experience Design (74%) (54%)
Coding (46%) (54%)
Software testing (54%) (44%)
ICT support (59%) (39%) (37%)
Infrastructure ops (58%) (35%) (41%)
BPM (63%) (73%)
ICT supplier management (53%) (76%)
Digital marketing (58%) (63%)
Information security (79%) (81%)
Enterprise Architecture (57%) (76%)
High performance computing (49%) (57%)
Embedded systems (64%) (50%)
eLeadership skills (54%) (67%)
Legacy maintenance (46%) (32%) (48%)

Skillset Decline in
dem
and
Grow
th in
dem
and
Unliketo
offs
hore
Likel
y to o
ffshore
Data Visualisation 1.6 82.3 62.7 16.9
UXD 0 74.1 54.4 21.1
Coding 7.9 46 28.1 54.4
Software testing 1.6 54.7 39.7 44.8
ICTsupport 4.7 35.9 37.9 39.7
Infrastructure ops 6.2 35.4 41.1 35.7
BPM 4.8 62.9 73.2 7.1
ICT Supplier management 1.6 45.2 75.9 5.6
Digital Marketing 1.7 58.6 63.3 8.2
Information security 4.7 79.7 81.5 0
Enterprise Architecture 1.6 57.8 76.4 1.8
High performance computing 5.5 45.4 57.1 12.2
Embedded systems 3.9 31.4 50 9.1
eLeadership skills 2 54 67.4 2.2
Legacy maintenance 21.1 33.3 48 32