e.2 noise analysis methodology
TRANSCRIPT

Ronald Reagan Washington National Airport
Final Environmental Assessment E-1 March 2012 Runway 4-22 and Runway 15-33 RSA Enhancements Appendix E. Aircraft Noise Analysis
Appendix E. Aircraft Noise Analysis
This appendix contains a discussion of the general characteristics of aircraft noise and describes the methodologies used for the aircraft noise analysis for the Runway 4-22 and Runway 15-33 Runway Safety Area (RSA) Enhancements Environmental Assessment (EA) at Ronald Reagan Washington National Airport (DCA).
E.1 General Characteristics of Aircraft Noise
Sound, when transmitted through the air and upon reaching our ears, may be perceived as desirable or unwanted.1 People normally refer to noise as unwanted sound. Because sound can be subjective, individuals have different perceptions, sensitivities, and reactions to noise. Loud sounds may bother some people, while others may be bothered by certain rhythms or frequencies of sound. Sounds that occur during sleeping hours are usually considered to be more objectionable than those that occur during daytime hours.
Aircraft noise originates from both the engines and the airframe of an aircraft, but the engines are by far the more significant source of noise.
Meteorological conditions affect the propagation (or transmission) of sound through the air. Wind speed and direction, and the temperature immediately above ground level cause diffraction and displacement of sound waves. Humidity and temperature materially effect propagation of air-to-ground sound through absorption associated with the instability and viscosity of the air.
E.2 Noise Analysis Methodology
The methodology used for this aircraft noise analysis involved (1) the use of noise descriptors developed for airport noise analyses, (2) development of basic data and assumptions as input to the computer model, and (3) the application of a computer model that provides estimates of aircraft noise levels.
E.2.1 Noise Descriptors
Noise levels are measured using a variety of scientific metrics. As a result of extensive research into the characteristics of aircraft noise and human response to that noise, standard noise descriptors have been developed for aircraft noise exposure analyses. The descriptors used in this noise analysis, are described below.
A-Weighted Sound Pressure Level, dBA: The decibel (dB) is a unit for describing sound pressure level. When expressed in dBA, the sound has been filtered to reduce the effect of very low and very high frequency sounds, much as the human ear does. Without this filtering, calculated and measured sound levels would include events that the human ear cannot hear (e.g., dog whistles and low frequency sounds such as the groaning sounds made from large buildings with changes in temperature and wind). With the A-weighting, calculations and sound monitoring equipment approximates the sensitivity of the human ear to sounds of different frequencies.
1 Federal Aviation Administration, Aviation Noise Effects, March 1985.
Ronald Reagan Washington National Airport
Final Environmental Assessment E-2 March 2012 Runway 4-22 and Runway 15-33 RSA Enhancements Appendix E. Aircraft Noise Analysis
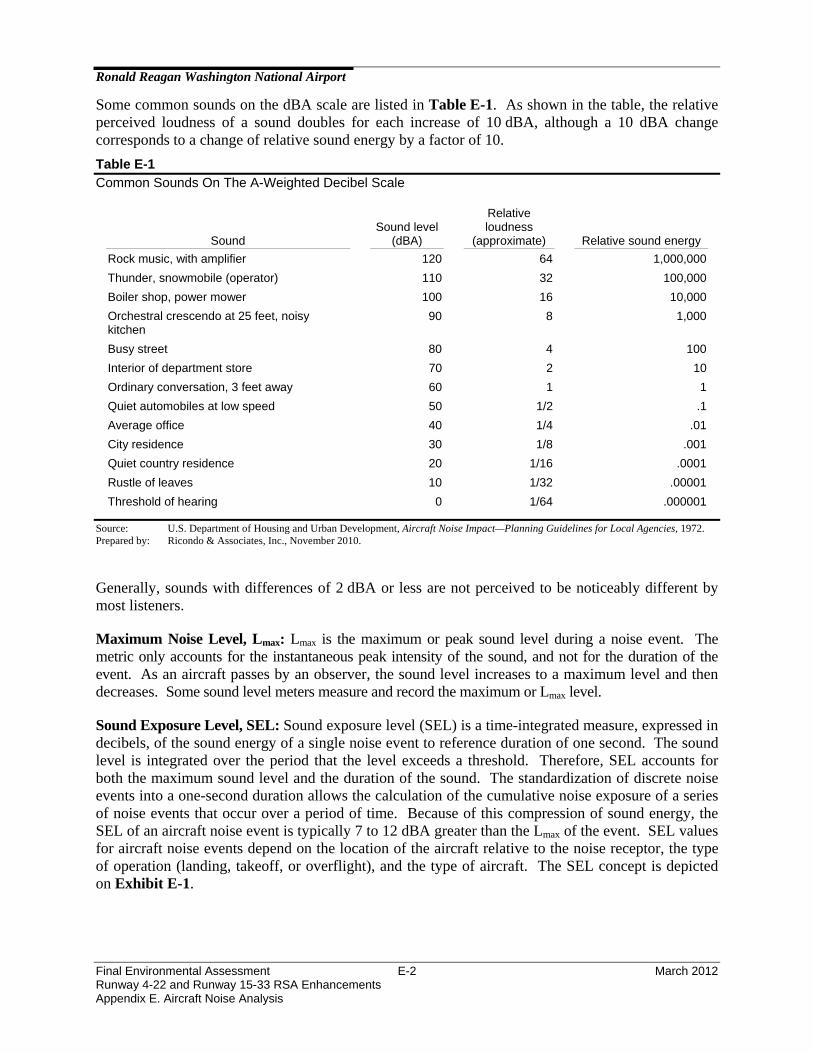
Some common sounds on the dBA scale are listed in Table E-1. As shown in the table, the relative perceived loudness of a sound doubles for each increase of 10 dBA, although a 10 dBA change corresponds to a change of relative sound energy by a factor of 10.
Table E-1 Common Sounds On The A-Weighted Decibel Scale
Sound
Sound level
(dBA)
Relative loudness
(approximate)
Relative sound energy
Rock music, with amplifier 120 64 1,000,000
Thunder, snowmobile (operator) 110 32 100,000
Boiler shop, power mower 100 16 10,000
Orchestral crescendo at 25 feet, noisy kitchen
90 8 1,000
Busy street 80 4 100
Interior of department store 70 2 10
Ordinary conversation, 3 feet away 60 1 1
Quiet automobiles at low speed 50 1/2 .1
Average office 40 1/4 .01
City residence 30 1/8 .001
Quiet country residence 20 1/16 .0001
Rustle of leaves 10 1/32 .00001
Threshold of hearing 0 1/64 .000001
Source: U.S. Department of Housing and Urban Development, Aircraft Noise Impact—Planning Guidelines for Local Agencies, 1972. Prepared by: Ricondo & Associates, Inc., November 2010.
Generally, sounds with differences of 2 dBA or less are not perceived to be noticeably different by most listeners.
Maximum Noise Level, Lmax: Lmax is the maximum or peak sound level during a noise event. The metric only accounts for the instantaneous peak intensity of the sound, and not for the duration of the event. As an aircraft passes by an observer, the sound level increases to a maximum level and then decreases. Some sound level meters measure and record the maximum or Lmax level.
Sound Exposure Level, SEL: Sound exposure level (SEL) is a time-integrated measure, expressed in decibels, of the sound energy of a single noise event to reference duration of one second. The sound level is integrated over the period that the level exceeds a threshold. Therefore, SEL accounts for both the maximum sound level and the duration of the sound. The standardization of discrete noise events into a one-second duration allows the calculation of the cumulative noise exposure of a series of noise events that occur over a period of time. Because of this compression of sound energy, the SEL of an aircraft noise event is typically 7 to 12 dBA greater than the Lmax of the event. SEL values for aircraft noise events depend on the location of the aircraft relative to the noise receptor, the type of operation (landing, takeoff, or overflight), and the type of aircraft. The SEL concept is depicted on Exhibit E-1.

Ronald Reagan Washington National Airport
Final Environmental Assessment E-3 March 2012 Runway 4-22 and Runway 15-33 RSA Enhancements Appendix E. Aircraft Noise Analysis
Exhibit E-1 Sound Exposure Level Concept
Source: Brown-Buntin Associates, Inc., November 2004. Prepared by: Ricondo & Associates, Inc., November 2010.
A-weighted Day-Night Average Sound Level, DNL: DNL, also denoted as Ldn is expressed in dBA and represents the noise level over a 24-hour period. DNL includes the cumulative effects of a number of sound events rather than a single event. It also accounts for increased sensitivity to noise during relaxation and sleeping hours. The DNL values are used to estimate the effects of specific noise levels on land uses. The Environmental Protection Agency (EPA) introduced the metric in 1976 as a single number measurement of community noise exposure. The FAA adopted DNL as the noise metric for measuring cumulative aircraft noise under FAR Part 150, Airport Noise Compatibility Planning. The Department of Housing and Urban Development, the Veterans Administration, the Department of Defense, the United States Coast Guard, and the Federal Transit Administration have also adopted DNL for measuring cumulative noise exposure.
In the calculation of DNL, for each hour during the nighttime period (10:00 p.m. to 7:00 a.m.), the sound levels are increased by a 10-decibel-weighting penalty (equivalent to a ten-fold increase in aircraft operations) before the 24-hour value is computed. The weighting penalty accounts for the more intrusive nature of noise during the nighttime hours.
DNL is expressed as an average noise level on the basis of annual aircraft operations for a calendar year, not on the average noise levels associated with different aircraft operations. To calculate the DNL at a specific location, the SEL values at that location associated with each individual aircraft operation (landing or takeoff) are determined. Using the SEL for each noise event and applying the 10-decibel penalty for nighttime operations as appropriate, a partial DNL value is then calculated for
Ronald Reagan Washington National Airport
Final Environmental Assessment E-4 March 2012 Runway 4-22 and Runway 15-33 RSA Enhancements Appendix E. Aircraft Noise Analysis
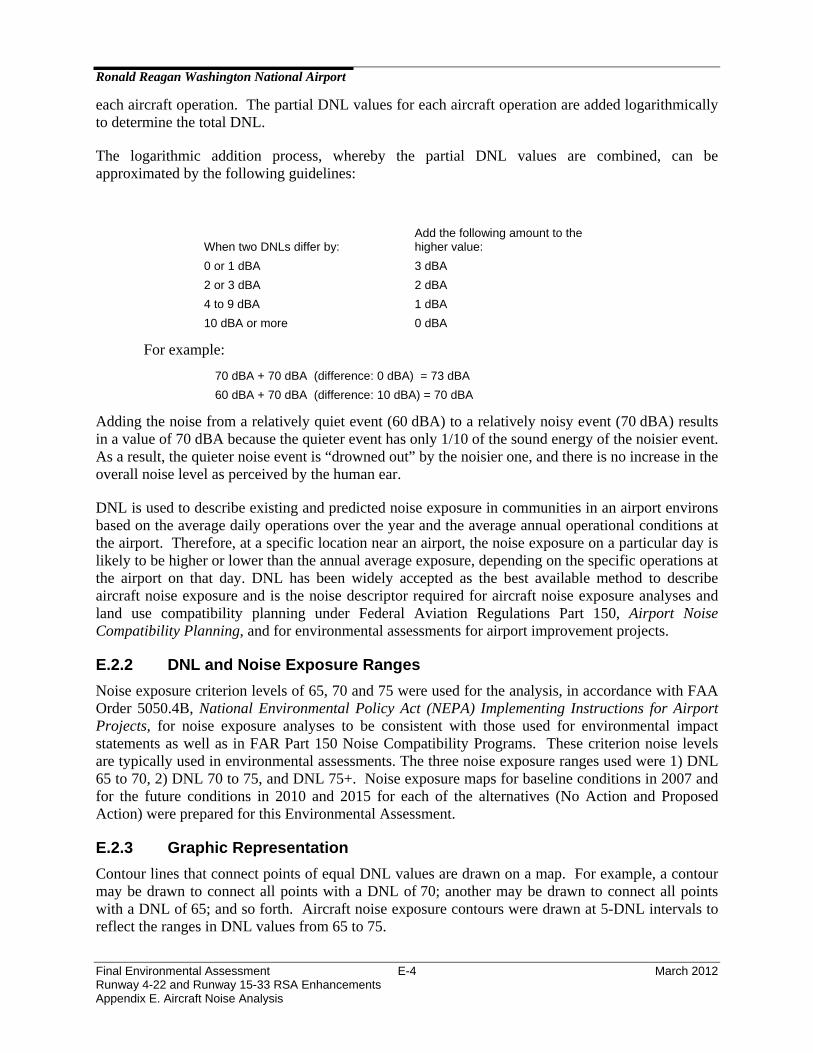
each aircraft operation. The partial DNL values for each aircraft operation are added logarithmically to determine the total DNL.
The logarithmic addition process, whereby the partial DNL values are combined, can be approximated by the following guidelines:
When two DNLs differ by: Add the following amount to the higher value:
0 or 1 dBA 3 dBA
2 or 3 dBA 2 dBA
4 to 9 dBA 1 dBA
10 dBA or more 0 dBA
For example:
70 dBA + 70 dBA (difference: 0 dBA) = 73 dBA
60 dBA + 70 dBA (difference: 10 dBA) = 70 dBA
Adding the noise from a relatively quiet event (60 dBA) to a relatively noisy event (70 dBA) results in a value of 70 dBA because the quieter event has only 1/10 of the sound energy of the noisier event. As a result, the quieter noise event is “drowned out” by the noisier one, and there is no increase in the overall noise level as perceived by the human ear.
DNL is used to describe existing and predicted noise exposure in communities in an airport environs based on the average daily operations over the year and the average annual operational conditions at the airport. Therefore, at a specific location near an airport, the noise exposure on a particular day is likely to be higher or lower than the annual average exposure, depending on the specific operations at the airport on that day. DNL has been widely accepted as the best available method to describe aircraft noise exposure and is the noise descriptor required for aircraft noise exposure analyses and land use compatibility planning under Federal Aviation Regulations Part 150, Airport Noise Compatibility Planning, and for environmental assessments for airport improvement projects.
E.2.2 DNL and Noise Exposure Ranges
Noise exposure criterion levels of 65, 70 and 75 were used for the analysis, in accordance with FAA Order 5050.4B, National Environmental Policy Act (NEPA) Implementing Instructions for Airport Projects, for noise exposure analyses to be consistent with those used for environmental impact statements as well as in FAR Part 150 Noise Compatibility Programs. These criterion noise levels are typically used in environmental assessments. The three noise exposure ranges used were 1) DNL 65 to 70, 2) DNL 70 to 75, and DNL 75+. Noise exposure maps for baseline conditions in 2007 and for the future conditions in 2010 and 2015 for each of the alternatives (No Action and Proposed Action) were prepared for this Environmental Assessment.
E.2.3 Graphic Representation
Contour lines that connect points of equal DNL values are drawn on a map. For example, a contour may be drawn to connect all points with a DNL of 70; another may be drawn to connect all points with a DNL of 65; and so forth. Aircraft noise exposure contours were drawn at 5-DNL intervals to reflect the ranges in DNL values from 65 to 75.
Ronald Reagan Washington National Airport
Final Environmental Assessment E-5 March 2012 Runway 4-22 and Runway 15-33 RSA Enhancements Appendix E. Aircraft Noise Analysis
E.2.4 The DNL Descriptor
The validity and accuracy of DNL calculations depend on the basic information used in the calculations. For future airport activities, the reliability of DNL calculations is affected by a number of uncertainties:
Future aviation activity levels—the forecast number of aircraft operations, the types of aircraft serving the airport, the times of operation (daytime, evening, and nighttime), and aircraft flight tracks—are estimates. Achievement of the estimated levels of activity cannot be assured.
Acoustical and performance characteristics of future aircraft are also estimates. When new aircraft designs are involved, aircraft noise data and flight characteristics must be estimated.
The noise descriptors used as the basis for calculating DNL represent typical human response (and reaction) to aircraft noise. Because people vary in their responses to noise and because the physical measure of noise accounts for only a portion of an individual’s reaction to that noise, DNL can be used only to obtain an average response to aircraft noise that might be expected from a community.
Single flight tracks used in computer modeling represent a wider band of actual flight tracks.
These uncertainties aside, DNL mapping was developed as a tool to assist in land use planning around airports. The mapping is best used for comparative purposes rather than for providing absolute values. That is, DNL calculations provide valid comparisons between different projected conditions, as long as consistent assumptions and basic data are used for all calculations.
Thus, sets of DNL calculations can show anticipated changes in aircraft noise exposure over time, or differences in noise exposure associated with different airport development alternatives or operational procedures. However, a line drawn on a map does not imply that a particular noise condition exists on one side of that line and not on the other. DNL calculations provide a means for comparing noise exposure under different scenarios.
Nevertheless, DNL contours can be used to (1) highlight an existing or potential aircraft noise problem that requires attention, (2) assist in the preparation of noise compatibility programs, and (3) provide guidance in the development of land use controls, such as zoning ordinances, subdivision regulations, and building codes. DNL is considered to be the best noise metric available for expressing aircraft noise exposure.
E.2.5 Evaluation of the Adequacy of the DNL Descriptor
In order to address concerns related to methods of aircraft noise measurement, and to reach a national consensus, the Federal Interagency Committee on Noise (FICON) was created to assess the manner in which noise exposure and its effects are evaluated and the usefulness of DNL to describe the effects of aircraft noise on people. The committee included representatives of all of the federal agencies involved in environmental noise studies, including staff from the Environmental Protection Agency (EPA), the Council on Environmental Quality (CEQ), the Departments of Treasury, Defense (DOD), Housing and Urban Development (HUD), Veterans Affairs, and Transportation, as well as technical advisors from the Committee on Hearing and Biomechanics.

Ronald Reagan Washington National Airport
Final Environmental Assessment E-6 March 2012 Runway 4-22 and Runway 15-33 RSA Enhancements Appendix E. Aircraft Noise Analysis
The FICON evaluated the threshold for acceptable noise levels (threshold of significance) and whether the DNL 65 was the proper threshold. The committee's findings were released in the Federal Register (FR 44223, September 24, 1992). Some of the committee's conclusions were:
Continue using the DNL to measure airport noise;
Complaints are an inadequate indicator of the full extent of noise effects on a population;
Noise predictions and interpretations are frequently less reliable below DNL 65— predictions below this level should take into account the inaccuracy of prediction models at large distances from the airport;
No definitive evidence of non-auditory health effects from aircraft noise exist, particularly below DNL 70;
Every change in the noise environment does not necessarily affect public health and welfare.
FICON also recommended that a new federal interagency committee be formed with a mandate to provide a forum for debate of future aviation noise research needs.
In March 1993, the FAA requested public comments concerning the FICON report released in 1992.2 The request for comment coincided with a study that was prepared by the FAA in accordance with the Safety, Capacity, Noise Improvement, and Intermodal Transportation Act of 1992.3 Later in 1993 the Federal Interagency Committee on Aviation Noise (FICAN) was formed. FICAN has provided a forum for soliciting input from interested members of the aviation profession and communities. FICAN members have worked with researchers to develop individual agency priorities for research to address noise issues, and have published technical papers on aviation noise topics, including a 1997 study of the effects of aviation noise on sleep.4 The work of FICON and FICAN has validated the use of the DNL metric as an adequate descriptor of aircraft noise.
E.3 Integrated Noise Model In 1978, the FAA released the first version of a computer simulation model designed to assess aircraft noise exposure. Known as the Integrated Noise Model or INM, it has become the standard tool used for modeling airport noise. The INM generates noise exposure contours and noise levels at individual locations and provides a graphical image of aircraft noise levels for a selected geographic area.
The INM computes DNL using an internal database that includes performance characteristics and noise data for a wide variety of civilian and military aircraft. Noise exposure levels are calculated from airport-specific data that are input into the model. The input includes runway coordinates, flight tracks, fleet mix, activity levels, runway and flight track utilization, average local temperatures, time of day, and departure trip length data. The INM correlates these data with the internal aircraft database using a series of algorithms that calculate noise exposure. The INM database incorporates
2 Federal Register, FR16569, March 29, 1993 3 Section 123 of the Airport and Airway Safety, Capacity, Noise Improvement, and Intermodal Transportation Act
of 1992 (49 U.S.C. app 2102, PL 102-581) required the FAA to conduct a noise study and report the results to Congress not later than October 31, 1993). The study analyzed the social, economic, and health effects of airport noise within the DNL 55, 60, and 65 dBA contours to determine the actual level at which noise adversely impacts populations. It also included an evaluation of single event analysis on populations.
4 Effects of Aviation Noise on Awakenings from Sleep, Federal Interagency Committee on Aviation Noise, June 1997.
Ronald Reagan Washington National Airport
Final Environmental Assessment E-7 March 2012 Runway 4-22 and Runway 15-33 RSA Enhancements Appendix E. Aircraft Noise Analysis
detailed information about each aircraft type, including departure profiles for different trip lengths, approach profiles, and SEL noise curves based on distances and various thrust settings. The outputs of these calculations include plots of points that connect to form noise contours. The INM is typically used to model average annual aircraft noise exposure, that is, the average sound level over an average 24-hour period of both busy and quiet times for the airport.
Other output from the INM include the area within each contour, noise measurements at locations (referred to as grid points), and SEL curves or values for specific aircraft types. The SEL curves can be used to estimate SEL for a specific aircraft type depending on how far the aircraft is from a listening point or observer and the estimated thrust setting. Since the introduction of the INM, newer versions have been released by the FAA with an updated aircraft database to reflect changes in the existing and projected aircraft fleet mixes of airports throughout the National Airspace System and to incorporate enhanced algorithms for calculating aircraft noise at specific locations and propagation of noise.
Version 7.0b of INM was used for the noise analysis, which was the latest approved version of the model at the time the analysis was done. Version 7.0b is an accepted, state-of-the-art tool for determining the total effect of aircraft noise at and around airports. The aircraft database contains a representation of commercial, general aviation, and military aircraft powered by turbojet, turbofan, turboprop, or piston-driven engines.
Noise exposure maps were generated using INM for 2009 existing conditions as well as 2016 and 2021 No Action and Proposed Action conditions. The only factor that changed under future year Proposed Action conditions compared to No Action conditions was the shift of the Runway 4 end 420 feet to the southwest, displacement of the Runway 4 landing threshold by 240 feet to the south, relocation of the Runway 22 end 331 feet to the southeast, and the shift of Runway 15-33 193 feet to the southeast. The Proposed Action will not: a) increase the number of existing and forecast operations by time of day, aircraft type or stage length; b) runway utilization (the ratio of flights arriving on or departing from each runway compared to the total number of arrivals and departures); c) location and use of flight tracks (the paths that pilots fly to arrive at and depart from the Airport), d) departure profiles; or, e) existing noise abatement procedures. Under the No Action alternative, no changes were made to any of the runway end points or the displaced thresholds for the runways. The noise exposure maps derived from the INM for the alternatives in this study are based on the DNL noise metric.
E.4 Basic Data and Assumptions
The primary data required to develop noise exposure maps using the INM Version 7.0b are:
The existing and forecast number of aircraft operations by time of day, aircraft type, and stage length (nonstop departure trip length from the Airport).
Operational information including use of the runways, location and use of flight tracks (the paths that pilots fly to arrive at and depart from the airport), departure profiles, existing noise abatement procedures, etc.
E.4.1 Aircraft Operations
Existing conditions at the Airport are represented by 2007 aircraft operations data and fleet mix information from the FAA’s Enhanced Traffic Management System (ETMS) data augmented with data on scheduled aircraft operations from the Official Airline Guide (OAG) for 2009. Both data sets provide aircraft type, time of day, operation mode and origin/destination. This data was further
Ronald Reagan Washington National Airport
Final Environmental Assessment E-8 March 2012 Runway 4-22 and Runway 15-33 RSA Enhancements Appendix E. Aircraft Noise Analysis
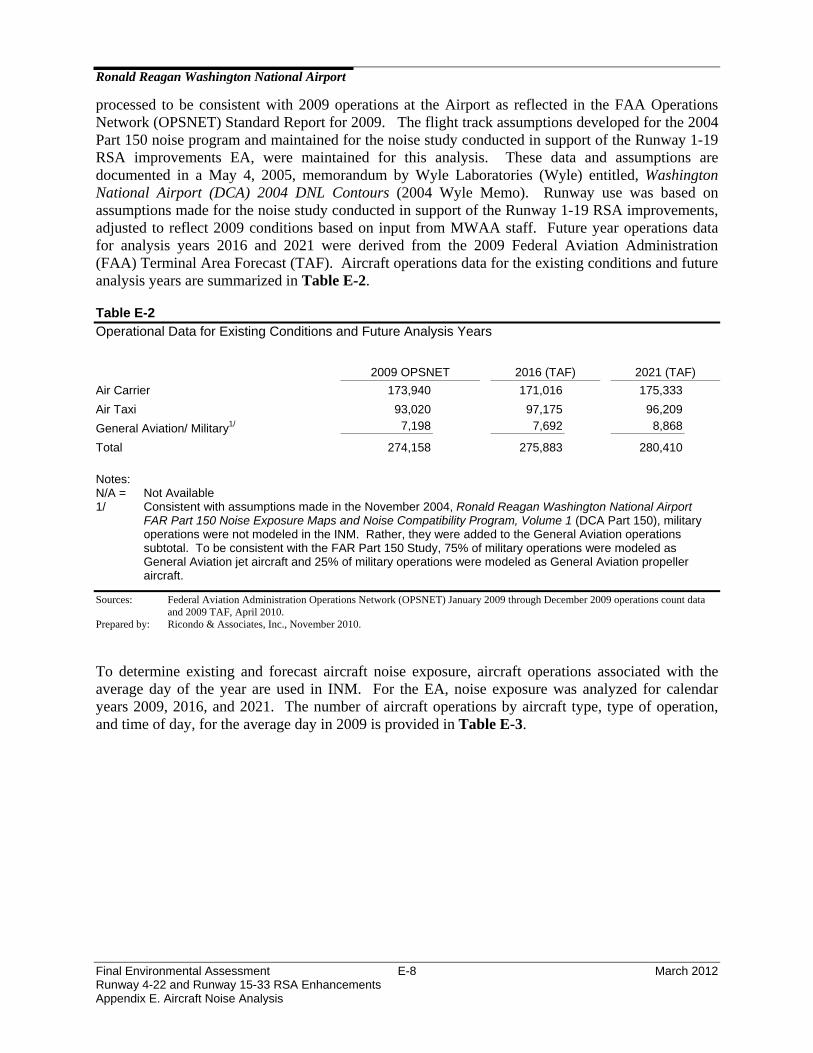
processed to be consistent with 2009 operations at the Airport as reflected in the FAA Operations Network (OPSNET) Standard Report for 2009. The flight track assumptions developed for the 2004 Part 150 noise program and maintained for the noise study conducted in support of the Runway 1-19 RSA improvements EA, were maintained for this analysis. These data and assumptions are documented in a May 4, 2005, memorandum by Wyle Laboratories (Wyle) entitled, Washington National Airport (DCA) 2004 DNL Contours (2004 Wyle Memo). Runway use was based on assumptions made for the noise study conducted in support of the Runway 1-19 RSA improvements, adjusted to reflect 2009 conditions based on input from MWAA staff. Future year operations data for analysis years 2016 and 2021 were derived from the 2009 Federal Aviation Administration (FAA) Terminal Area Forecast (TAF). Aircraft operations data for the existing conditions and future analysis years are summarized in Table E-2.
Table E-2 Operational Data for Existing Conditions and Future Analysis Years
2009 OPSNET 2016 (TAF) 2021 (TAF)
Air Carrier 173,940 171,016 175,333
Air Taxi 93,020 97,175 96,209
General Aviation/ Military1/ 7,198 7,692 8,868
Total 274,158 275,883 280,410
Notes: N/A = Not Available 1/ Consistent with assumptions made in the November 2004, Ronald Reagan Washington National Airport
FAR Part 150 Noise Exposure Maps and Noise Compatibility Program, Volume 1 (DCA Part 150), military operations were not modeled in the INM. Rather, they were added to the General Aviation operations subtotal. To be consistent with the FAR Part 150 Study, 75% of military operations were modeled as General Aviation jet aircraft and 25% of military operations were modeled as General Aviation propeller aircraft.
Sources: Federal Aviation Administration Operations Network (OPSNET) January 2009 through December 2009 operations count data and 2009 TAF, April 2010.
Prepared by: Ricondo & Associates, Inc., November 2010.
To determine existing and forecast aircraft noise exposure, aircraft operations associated with the average day of the year are used in INM. For the EA, noise exposure was analyzed for calendar years 2009, 2016, and 2021. The number of aircraft operations by aircraft type, type of operation, and time of day, for the average day in 2009 is provided in Table E-3.

Ronald Reagan Washington National Airport
Final Environmental Assessment E-9 March 2012 Runway 4-22 and Runway 15-33 RSA Enhancements Appendix E. Aircraft Noise Analysis
Table E-3 Average Daily Operations in 2009
INM Aircraft Type1/
Arrivals Departures
Day
Night
Total
Day
Night
Total
Total
Commercial Air Carrier Jet Aircraft
216.84 21.42 238.27 219.45 18.83 238.28 476.55
Regional Air Carrier Propeller Aircraft
33.80 0.06 35.86 35.77 0.09 35.86 71.72
Regional Air Carrier Jet Aircraft 87.14 4.42 91.57 86.13 5.43 91.56 183.13
General Aviation Jet Aircraft 6.82 0.86 7.68 6.72 0.40 7.12 14.80
General Aviation Propeller Aircraft
2.55 0.03 2.58 2.33 0.02 234 4.92
Total 349.16 26.80 375.96 350.39 24.77 375.16 751.12
Note: 1/ Refer to Section E.5 for an explanation of INM Aircraft Type
Sources: Ricondo & Associates, Inc.; estimated using information from Federal Aviation Administration Operations Network (OPSNET) January 2009 through December 2009 operations count data, April 2010.
Prepared by: Ricondo & Associates, Inc., November 2010.
The forecasts of operations for the average day in 2016 and 2021, shown in Table E-4 and Table E-5, were derived from the fleet mix data collected for 2009 and applied to the FAA TAF (December, 2009) forecasted operations by carrier grouping for 2016 and 2021.
Table E-4 Average Daily Operations in 2016 (No Action and Proposed Action)
INM Aircraft Type1/
Arrivals Departures
Day
Night
Total
Day
Night
Total
Total
Commercial Air Carrier Jet Aircraft
213.20 21.06 234.26 215.76 18.51 234.28 468.54
Regional Air Carrier Propeller Aircraft
37.40 0.07 37.46 37.36 0.10 37.46 74.93
Regional Air Carrier Jet Aircraft
91.04 4.62 95.66 89.88 5.67 95.65 191.31
General Aviation Jet Aircraft 7.29 0.92 8.21 7.18 0.42 7.61 15.81
General Aviation Propeller Aircraft
2.72 0.03 2.76 2.49 0.02 2.50 5.26
Total 351.65 26.70 378.35 352.77 24.73 377.50 755.84
Note: 1/ Refer to Section E.5 for an explanation of INM Aircraft Type
Sources: Ricondo & Associates, Inc.; estimated using information based on Federal Aviation Administration ETMS flight header data for 12-months in 2007, OAG flight schedule for 2009, and Federal Aviation Administration 2009 TAF annual total operations, April 2010.
Prepared by: Ricondo & Associates, Inc. November 2010.
Ronald Reagan Washington National Airport
Final Environmental Assessment E-10 March 2012 Runway 4-22 and Runway 15-33 RSA Enhancements Appendix E. Aircraft Noise Analysis
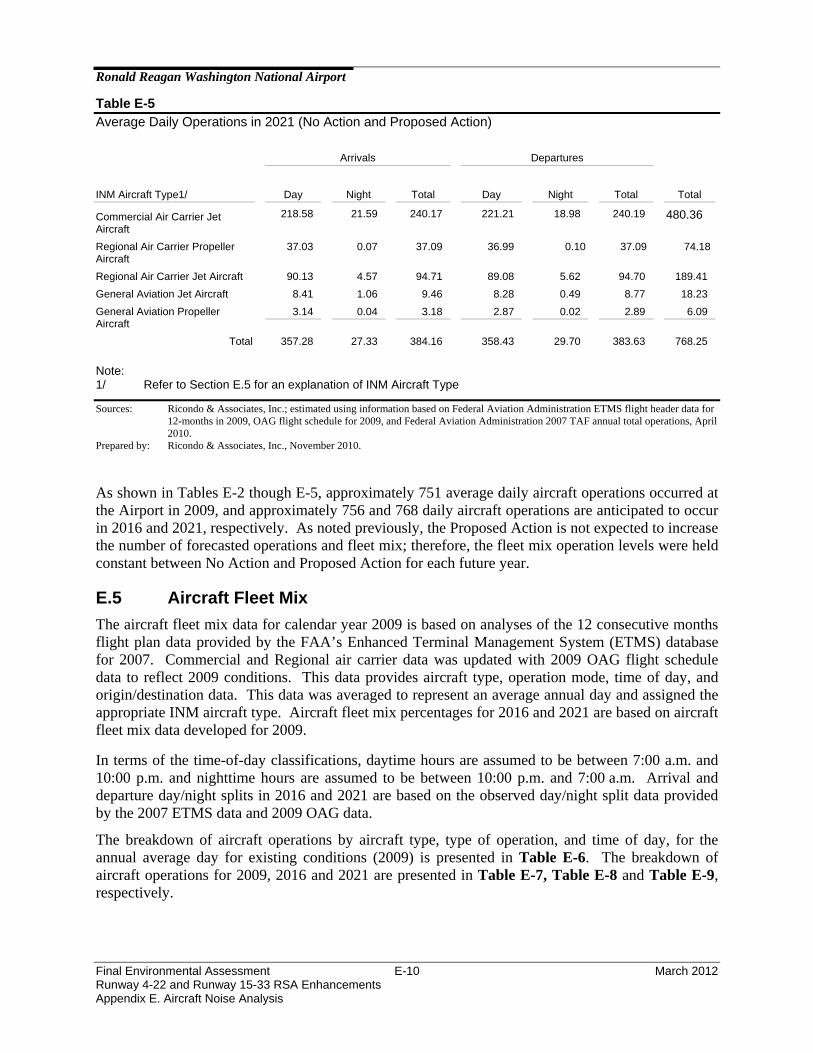
Table E-5 Average Daily Operations in 2021 (No Action and Proposed Action)
INM Aircraft Type1/
Arrivals Departures
Day
Night
Total
Day
Night
Total
Total
Commercial Air Carrier Jet Aircraft
218.58 21.59 240.17 221.21 18.98 240.19 480.36
Regional Air Carrier Propeller Aircraft
37.03 0.07 37.09 36.99 0.10 37.09 74.18
Regional Air Carrier Jet Aircraft 90.13 4.57 94.71 89.08 5.62 94.70 189.41
General Aviation Jet Aircraft 8.41 1.06 9.46 8.28 0.49 8.77 18.23
General Aviation Propeller Aircraft
3.14 0.04 3.18 2.87 0.02 2.89 6.09
Total 357.28 27.33 384.16 358.43 29.70 383.63 768.25
Note: 1/ Refer to Section E.5 for an explanation of INM Aircraft Type
Sources: Ricondo & Associates, Inc.; estimated using information based on Federal Aviation Administration ETMS flight header data for 12-months in 2009, OAG flight schedule for 2009, and Federal Aviation Administration 2007 TAF annual total operations, April 2010.
Prepared by: Ricondo & Associates, Inc., November 2010.
As shown in Tables E-2 though E-5, approximately 751 average daily aircraft operations occurred at the Airport in 2009, and approximately 756 and 768 daily aircraft operations are anticipated to occur in 2016 and 2021, respectively. As noted previously, the Proposed Action is not expected to increase the number of forecasted operations and fleet mix; therefore, the fleet mix operation levels were held constant between No Action and Proposed Action for each future year.
E.5 Aircraft Fleet Mix
The aircraft fleet mix data for calendar year 2009 is based on analyses of the 12 consecutive months flight plan data provided by the FAA’s Enhanced Terminal Management System (ETMS) database for 2007. Commercial and Regional air carrier data was updated with 2009 OAG flight schedule data to reflect 2009 conditions. This data provides aircraft type, operation mode, time of day, and origin/destination data. This data was averaged to represent an average annual day and assigned the appropriate INM aircraft type. Aircraft fleet mix percentages for 2016 and 2021 are based on aircraft fleet mix data developed for 2009.
In terms of the time-of-day classifications, daytime hours are assumed to be between 7:00 a.m. and 10:00 p.m. and nighttime hours are assumed to be between 10:00 p.m. and 7:00 a.m. Arrival and departure day/night splits in 2016 and 2021 are based on the observed day/night split data provided by the 2007 ETMS data and 2009 OAG data.
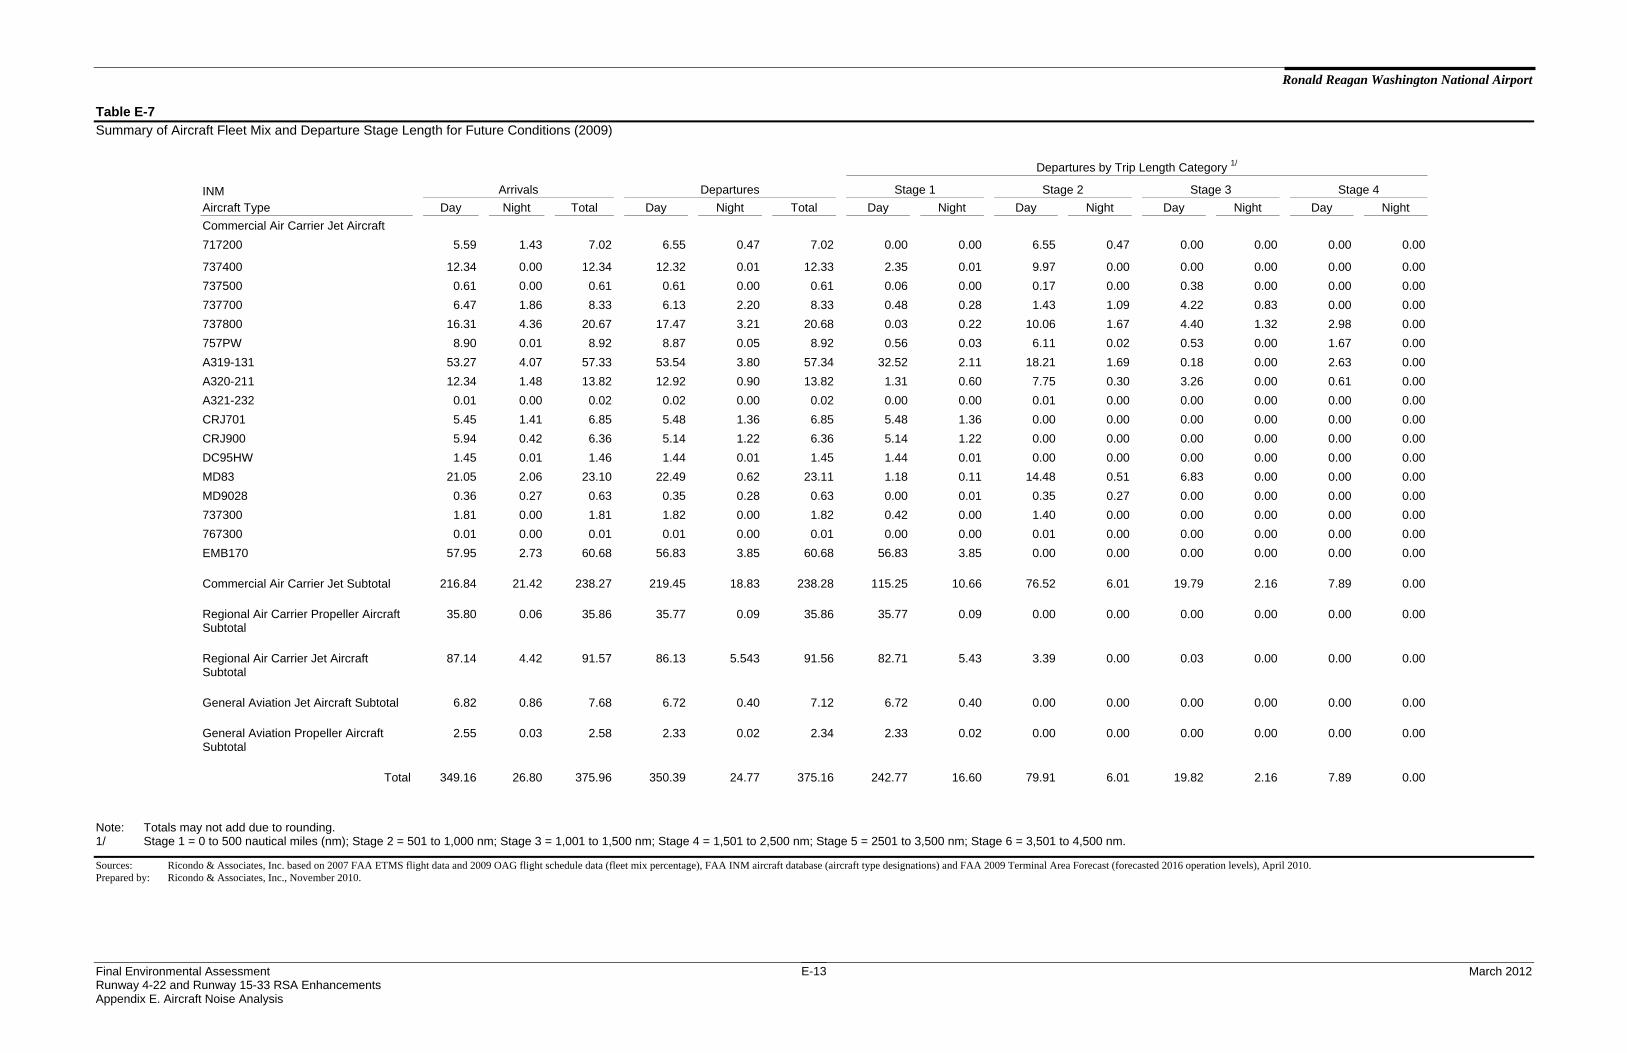
The breakdown of aircraft operations by aircraft type, type of operation, and time of day, for the annual average day for existing conditions (2009) is presented in Table E-6. The breakdown of aircraft operations for 2009, 2016 and 2021 are presented in Table E-7, Table E-8 and Table E-9, respectively.

Ronald Reagan Washington National Airport
Final Environmental Assessment E-11 March 2012 Runway 4-22 and Runway 15-33 RSA Enhancements Appendix E. Aircraft Noise Analysis
Table E-6 Summary of Aircraft Fleet Mix for Existing Conditions (2009)
INM Aircraft Type1/
Arrivals Departures
Day Night Total Day Night Total Total
Commercial Air Carrier Jet Aircraft
717200 5.59 1.43 7.02 6.55 0.47 7.02 14.04
737400 12.34 0.00 12.34 12.32 0.01 12.33 24.68
737500 0.61 0.00 0.61 0.61 0.00 0.61 1.22
737700 6.47 1.86 8.33 6.13 2.20 8.33 16.66
737800 16.31 4.36 20.67 17.47 3.21 20.68 41.35
757PW 8.90 0.01 8.92 8.87 0.05 8.92 17.84
A319-131 53.27 4.07 57.33 53.54 3.80 57.34 114.67
A320-211 12.34 1.48 13.82 12.92 0.90 13.82 27.64
A321-232 0.01 0.00 0.02 0.02 0.00 0.02 0.03
CRJ701 5.45 1.41 6.85 5.48 1.36 6.85 13.70
CRJ900 5.94 0.42 6.36 5.14 1.22 6.36 12.72
DC95HW 1.45 0.01 1.46 1.44 0.01 1.45 2.91
MD83 21.05 2.06 23.10 22.49 0.62 23.11 46.21
MD9028 0.36 0.27 0.63 0.35 0.28 0.63 1.26
737300 1.81 0.00 1.81 1.82 0.00 1.82 3.63
767300 0.01 0.00 0.01 0.01 0.00 0.01 0.03
EMB170 57.95 2.73 60.68 56.83 3.85 60.68 121.36
Commercial Air Carrier Jet Subtotal
216.84 21.42 238.27 219.45 18.83 238.28 476.55
Regional Air Carrier Propeller Aircraft Subtotal
35.80 0.06 35.86 35.77 0.09 35.86 71.72
Regional Air Carrier Jet Aircraft Subtotal
87.14 4.42 91.57 86.13 5.43 91.56 183.13
General Aviation Jet Aircraft Subtotal
6.82 0.86 7.68 6.72 0.40 7.12 14.80
General Aviation Propeller Aircraft Subtotal
2.55 0.03 2.58 2.33 0.02 2.34 4.92
Total 349.16 26.80 375.96 350.39 24.77 375.16 751.12
Sources: Ricondo & Associates, Inc. based on 2007 FAA ETMS flight data, 2009 OAG flight schedule, and FAA INM aircraft database, April 2010.
Prepared by: Ricondo & Associates, Inc., November 2010.

Ronald Reagan Washington National Airport
Final Environmental Assessment E-12 March 2012 Runway 4-22 and Runway 15-33 RSA Enhancements Appendix E. Aircraft Noise Analysis
THIS PAGE LEFT INTENTIONALLY BLANK
Ronald Reagan Washington National Airport
Final Environmental Assessment March 2012 Runway 4-22 and Runway 15-33 RSA Enhancements Appendix E. Aircraft Noise Analysis
E-13
Table E-7 Summary of Aircraft Fleet Mix and Departure Stage Length for Future Conditions (2009)
Departures by Trip Length Category 1/
INM Arrivals Departures Stage 1 Stage 2 Stage 3 Stage 4
Aircraft Type Day Night Total Day Night Total Day Night Day Night Day Night Day Night
Commercial Air Carrier Jet Aircraft
717200 5.59 1.43 7.02 6.55 0.47 7.02 0.00 0.00 6.55 0.47 0.00 0.00 0.00 0.00
737400 12.34 0.00 12.34 12.32 0.01 12.33 2.35 0.01 9.97 0.00 0.00 0.00 0.00 0.00
737500 0.61 0.00 0.61 0.61 0.00 0.61 0.06 0.00 0.17 0.00 0.38 0.00 0.00 0.00
737700 6.47 1.86 8.33 6.13 2.20 8.33 0.48 0.28 1.43 1.09 4.22 0.83 0.00 0.00
737800 16.31 4.36 20.67 17.47 3.21 20.68 0.03 0.22 10.06 1.67 4.40 1.32 2.98 0.00
757PW 8.90 0.01 8.92 8.87 0.05 8.92 0.56 0.03 6.11 0.02 0.53 0.00 1.67 0.00
A319-131 53.27 4.07 57.33 53.54 3.80 57.34 32.52 2.11 18.21 1.69 0.18 0.00 2.63 0.00
A320-211 12.34 1.48 13.82 12.92 0.90 13.82 1.31 0.60 7.75 0.30 3.26 0.00 0.61 0.00
A321-232 0.01 0.00 0.02 0.02 0.00 0.02 0.00 0.00 0.01 0.00 0.00 0.00 0.00 0.00
CRJ701 5.45 1.41 6.85 5.48 1.36 6.85 5.48 1.36 0.00 0.00 0.00 0.00 0.00 0.00
CRJ900 5.94 0.42 6.36 5.14 1.22 6.36 5.14 1.22 0.00 0.00 0.00 0.00 0.00 0.00
DC95HW 1.45 0.01 1.46 1.44 0.01 1.45 1.44 0.01 0.00 0.00 0.00 0.00 0.00 0.00
MD83 21.05 2.06 23.10 22.49 0.62 23.11 1.18 0.11 14.48 0.51 6.83 0.00 0.00 0.00
MD9028 0.36 0.27 0.63 0.35 0.28 0.63 0.00 0.01 0.35 0.27 0.00 0.00 0.00 0.00
737300 1.81 0.00 1.81 1.82 0.00 1.82 0.42 0.00 1.40 0.00 0.00 0.00 0.00 0.00
767300 0.01 0.00 0.01 0.01 0.00 0.01 0.00 0.00 0.01 0.00 0.00 0.00 0.00 0.00
EMB170 57.95 2.73 60.68 56.83 3.85 60.68 56.83 3.85 0.00 0.00 0.00 0.00 0.00 0.00
Commercial Air Carrier Jet Subtotal 216.84 21.42 238.27 219.45 18.83 238.28 115.25 10.66 76.52 6.01 19.79 2.16 7.89 0.00
Regional Air Carrier Propeller Aircraft Subtotal
35.80 0.06 35.86 35.77 0.09 35.86 35.77 0.09 0.00 0.00 0.00 0.00 0.00 0.00
Regional Air Carrier Jet Aircraft Subtotal
87.14 4.42 91.57 86.13 5.543 91.56 82.71 5.43 3.39 0.00 0.03 0.00 0.00 0.00
General Aviation Jet Aircraft Subtotal 6.82 0.86 7.68 6.72 0.40 7.12 6.72 0.40 0.00 0.00 0.00 0.00 0.00 0.00
General Aviation Propeller Aircraft Subtotal
2.55 0.03 2.58 2.33 0.02 2.34 2.33 0.02 0.00 0.00 0.00 0.00 0.00 0.00
Total 349.16 26.80 375.96 350.39 24.77 375.16 242.77 16.60 79.91 6.01 19.82 2.16 7.89 0.00
Note: Totals may not add due to rounding. 1/ Stage 1 = 0 to 500 nautical miles (nm); Stage 2 = 501 to 1,000 nm; Stage 3 = 1,001 to 1,500 nm; Stage 4 = 1,501 to 2,500 nm; Stage 5 = 2501 to 3,500 nm; Stage 6 = 3,501 to 4,500 nm.
Sources: Ricondo & Associates, Inc. based on 2007 FAA ETMS flight data and 2009 OAG flight schedule data (fleet mix percentage), FAA INM aircraft database (aircraft type designations) and FAA 2009 Terminal Area Forecast (forecasted 2016 operation levels), April 2010. Prepared by: Ricondo & Associates, Inc., November 2010.
Ronald Reagan Washington National Airport
Final Environmental Assessment E-14 March 2012 Runway 4-22 and Runway 15-33 RSA Enhancements Appendix E. Aircraft Noise Analysis
THIS PAGE LEFT INTENTIONALLY BLANK

Ronald Reagan Washington National Airport
Final Environmental Assessment March 2012 Runway 4-22 and Runway 15-33 RSA Enhancements Appendix E. Aircraft Noise Analysis
E-15
Table E-8 Summary of Aircraft Fleet Mix and Departure Stage Length for Future Conditions (2016)
Departures by Trip Length Category 1/
INM Arrivals Departures Stage 1 Stage 2 Stage 3 Stage 4
Aircraft Type Day Night Total Day Night Total Day Night Day Night Day Night Day Night
Commercial Air Carrier Jet Aircraft
717200 5.49 1.41 6.90 6.44 0.47 6.90 0.00 0.00 6.44 0.47 0.00 0.00 0.00 0.00
737400 12.13 0.00 12.13 12.12 0.01 12.13 2.31 0.01 9.80 0.00 0.00 0.00 0.00 0.00
737500 0.60 0.00 0.60 0.60 0.00 0.60 0.06 0.00 0.17 0.00 0.37 0.00 0.00 0.00
737700 6.36 1.83 8.19 6.03 2.16 8.19 0.47 0.27 1.41 1.07 4.14 0.82 0.00 0.00
737800 16.04 4.29 20.33 17.17 3.16 20.33 0.03 0.21 9.89 1.64 4.32 1.30 2.93 0.00
757PW 8.75 0.01 8.77 8.72 0.05 8.77 0.55 0.03 6.01 0.02 0.52 0.00 1.64 0.00
A319-131 52.37 4.00 56.37 52.64 3.73 56.37 31.97 2.07 17.90 1.66 0.18 0.00 2.59 0.00
A320-211 12.13 1.46 13.59 12.70 0.89 13.59 1.29 0.59 7.62 0.29 3.20 0.00 0.60 0.00
A321-232 0.01 0.00 0.02 0.02 0.00 0.02 0.00 0.00 0.01 0.00 0.00 0.00 0.00 0.00
CRJ701 5.35 1.38 6.74 5.39 1.34 6.73 5.39 1.34 0.00 0.00 0.00 0.00 0.00 0.00
CRJ900 5.84 0.41 6.25 5.05 1.20 6.25 5.05 1.20 0.00 0.00 0.00 0.00 0.00 0.00
DC95HW 1.43 0.01 1.43 1.42 0.01 1.43 1.41 0.01 0.00 0.00 0.00 0.00 0.00 0.00
MD83 20.69 2.02 22.72 22.11 0.61 22.72 1.16 0.10 14.23 0.50 6.72 0.00 0.00 0.00
MD9028 0.35 0.27 0.62 0.35 0.27 0.62 0.00 0.01 0.35 0.27 0.00 0.00 0.00 0.00
737300 1.78 0.00 1.78 1.79 0.00 1.79 0.41 0.00 1.38 0.00 0.00 0.00 0.00 0.00
767300 0.01 0.00 0.01 0.01 0.00 0.01 0.00 0.00 0.01 0.00 0.00 0.00 0.00 0.00
EMB170 56.98 2.68 59.66 55.88 3.79 59.66 55.88 3.79 0.00 0.00 0.00 0.00 0.00 0.00
Commercial Air Carrier Jet Subtotal 213.20 21.06 234.26 215.76 18.51 234.28 113.31 10.48 75.23 5.91 19.46 2.12 7.76 0.00
Regional Air Carrier Propeller Aircraft Subtotal
37.40 0.07 37.46 37.36 0.10 37.46 37.36 0.10 0.00 0.00 0.00 0.00 0.00 0.00
Regional Air Carrier Jet Aircraft Subtotal
91.04 4.62 95.66 89.98 5.67 95.65 86.40 5.67 3.55 0.00 0.03 0.00 0.00 0.00
General Aviation Jet Aircraft Subtotal 7.29 0.92 8.21 7.18 0.42 7.61 0.00 0.00 0.00 0.00 0.00 0.00 0.00 0.00
General Aviation Propeller Aircraft Subtotal
2.72 0.03 2.76 2.49 0.02 2.50 0.00 0.00 0.00 0.00 0.00 0.00 0.00 0.00
Total 351.65 26.70 378.35 352.77 24.73 377.50 242.77 16.60 78.78 5.91 19.49 2.12 7.76 0.00 Note: Totals may not add due to rounding. 1/ Stage 1 = 0 to 500 nautical miles (nm); Stage 2 = 501 to 1,000 nm; Stage 3 = 1,001 to 1,500 nm; Stage 4 = 1,501 to 2,500 nm; Stage 5 = 2501 to 3,500 nm; Stage 6 = 3,501 to 4,500 nm.
Sources: Ricondo & Associates, Inc. based on 2007 FAA ETMS flight data and 2009 OAG flight schedule data (fleet mix percentage), FAA INM aircraft database (aircraft type designations) and FAA 2009 Terminal Area Forecast (forecasted 2016 operation levels), April 2010. Prepared by: Ricondo & Associates, Inc., November 2010.

Ronald Reagan Washington National Airport
Final Environmental Assessment E-16 March 2012 Runway 4-22 and Runway 15-33 RSA Enhancements Appendix E. Aircraft Noise Analysis
THIS PAGE LEFT INTENTIONALLY BLANK

Ronald Reagan Washington National Airport
Final Environmental Assessment March 2012 Runway 4-22 and Runway 15-33 RSA Enhancements Appendix E. Aircraft Noise Analysis
E-17
Table E-9 Summary of Aircraft Fleet Mix for Future Conditions (2021)
Departures by Trip Length Category 1/
INM Arrivals Departures Stage 1 Stage 2 Stage 3 Stage 4
Aircraft Type Day Night Total Day Night Total Day Night Day Night Day Night Day Night
Commercial Air Carrier Jet Aircraft
717200 5.63 1.44 7.08 6.60 0.48 7.08 0.00 0.00 6.60 0.48 0.00 0.00 0.00 0.00
737400 12.44 0.00 12.44 12.42 0.01 12.43 2.37 0.01 10.05 0.00 0.00 0.00 0.00 0.00
737500 0.61 0.00 0.61 0.61 0.00 0.61 0.06 0.00 0.18 0.00 0.38 0.00 0.00 0.00
737700 6.52 1.87 8.40 6.18 2.22 8.39 0.48 0.28 1.45 1.10 4.25 0.84 0.00 0.00
737800 16.44 4.39 20.84 17.61 3.24 20.84 0.03 0.22 10.14 1.69 4.43 1.33 3.00 0.00
757PW 8.98 0.01 8.99 8.95 0.05 8.99 0.56 0.03 6.16 0.02 0.54 0.00 1.69 0.00
A319-131 53.70 4.10 57.79 53.97 3.83 57.80 32.78 2.13 18.35 1.70 0.18 0.00 2.65 0.00
A320-211 12.44 1.49 13.93 13.02 0.91 13.93 1.32 0.61 7.81 0.30 3.28 0.00 0.61 0.00
A321-232 0.01 0.00 0.02 0.02 0.00 0.02 0.00 0.00 0.01 0.00 0.00 0.00 0.00 0.00
CRJ701 5.49 1.42 6.91 5.53 1.38 6.90 5.53 1.38 0.00 0.00 0.00 0.00 0.00 0.00
CRJ900 5.99 0.42 6.41 5.18 1.23 6.41 5.18 1.23 0.00 0.00 0.00 0.00 0.00 0.00
DC95HW 1.46 0.01 1.47 1.45 0.01 1.47 1.45 0.01 0.00 0.00 0.00 0.00 0.00 0.00
MD83 21.22 2.07 23.29 22.67 0.62 23.29 1.19 0.11 14.59 0.51 6.89 0.00 0.00 0.00
MD9028 0.36 0.27 0.63 0.36 0.28 0.64 0.00 0.01 0.36 0.27 0.00 0.00 0.00 0.00
737300 1.83 0.00 1.83 1.83 0.00 1.83 0.42 0.00 1.41 0.00 0.00 0.00 0.00 0.00
767300 0.01 0.00 0.01 0.01 0.00 0.01 0.00 0.00 0.01 0.00 0.00 0.00 0.00 0.00
EMB170 58.41 2.75 61.16 57.29 3.88 61.17 57.29 3.88 0.00 0.00 0.00 0.00 0.00 0.00
Commercial Air Carrier Jet Subtotal 218.58 21.59 240.17 221.21 18.98 240.19 116.17 10.75 77.13 6.06 19.95 2.17 7.95 0.00
Regional Air Carrier Propeller Aircraft Subtotal
37.03 0.07 37.09 36.99 0.10 37.09 36.99 0.10 0.00 0.00 0.00 0.00 0.00 0.00
Regional Air Carrier Jet Aircraft Subtotal
90.13 4.57 94.71 89.08 5.62 94.70 85.54 5.62 3.51 0.00 0.03 0.00 0.00 0.00
General Aviation Jet Aircraft Subtotal 8.41 1.06 9.46 8.28 0.49 8.77 8.28 0.49 0.00 0.00 0.00 0.00 0.00 0.00
General Aviation Propeller Aircraft Subtotal
3.14 0.04 3.18 2.87 0.02 2.89 2.87 0.02 0.00 0.00 0.00 0.00 0.00 0.00
Total 357.28 27.33 384.61 358.43 25.20 383.63 249.85 16.97 80.64 6.06 19.98 2.17 7.95 0.00
Note: Totals may not add due to rounding. 1/ Stage 1 = 0 to 500 nautical miles (nm); Stage 2 = 501 to 1,000 nm; Stage 3 = 1,001 to 1,500 nm; Stage 4 = 1,501 to 2,500 nm; Stage 5 = 2501 to 3,500 nm; Stage 6 = 3,501 to 4,500 nm.
Sources: Ricondo & Associates, Inc. based on 2007 FAA ETMS flight data and 2009 OAG flight schedule data (fleet mix percentage), FAA INM aircraft database (aircraft type designations) and FAA 2009 Terminal Area Forecast (forecasted 2016 operation levels), April 2010. Prepared by: Ricondo & Associates, Inc., November 2010.
Ronald Reagan Washington National Airport
Final Environmental Assessment E-18 March 2012 Runway 4-22 and Runway 15-33 RSA Enhancements Appendix E. Aircraft Noise Analysis
THIS PAGE LEFT INTENTIONALLY BLANK

Ronald Reagan Washington National Airport
Final Environmental Assessment March 2012 Runway 4-22 and Runway 15-33 RSA Enhancements Appendix E. Aircraft Noise Analysis
E-19
Aircraft noise characteristics can be classified according to federal noise level standards specified in FAR Part 36, “Noise Standards, Aircraft Type and Airworthiness Certification”, as meeting Stage 1 (noisiest), Stage 2 (quieter), or Stage 3 (quietest) standards. As of January 1, 1985, Stage 1 aircraft could no longer be operated in the United States. In accordance with the Airport Noise and Capacity Act of 1990, the FAA established a schedule for phasing out the use of FAR Part 36 Stage 2 aircraft weighing more than 75,000 pounds in favor of FAR Part 36 Stage 3 aircraft within the 48 contiguous states. FAR Part 91, “General Operating and Flight Rules,” specifies that after December 31, 1999 no person may operate an FAR Part 36 Stage 2 aircraft over 75,000 pounds in the contiguous United States. It should be noted that no schedule has been established for phasing out Stage 2 jet aircraft weighing less than 75,000 pounds. Practically every corporate or general aviation jet aircraft that operates in the U.S. weighs less than 75,000 pounds. According to a report by the General Accounting Office, as of October 1, 1999, about 69 percent of the 9,000 civil jet aircraft weighing less than 75,000 pounds were Stage 3 compliant.
E.5.1 Time of Day The calculation of DNL includes a 10-decibel weighting penalty for those operations occurring during the nighttime hours (10:00 p.m. to 6:59 a.m.).
E.5.2 Departure Trip length (Stage Length) Departure trip length, commonly referred to as stage length (unrelated to “Stage” classifications of aircraft for FAR Part 36 noise certification), refers to the non-stop distance an aircraft travels after departure. This information is needed to determine average gross takeoff weights for the different aircraft types. The noise generated by departures of a specific aircraft type will vary depending on the takeoff weights of the particular operations. For example, a fully loaded aircraft departing on a long flight will weigh more on departure than the same fully loaded aircraft departing on a shorter flight because the longer flight requires more fuel on board. It usually takes the heavier aircraft longer to reach its takeoff velocity, thereby using more runway length and climbing at a slower rate than a lighter aircraft, particularly on hot days. Therefore, more land area will be exposed to higher levels of aircraft noise by departures of heavier aircraft than departures of the same aircraft with lighter loads.
In the INM, up to seven different state length categories have been established representing different departure trip length distances, as presented in Table E-10.
Table E-10 INM Departure Stage Length Categories
Stage Length Category Range of Departure Trip Length (nautical miles)
1 0 – 500
2 500 – 1,000
3 1,000 – 1,500
4 1,500 – 2,500
5 2,500 – 3,500
6 3,500 – 4,500
7 4,500 +
Source: Federal Aviation Administration, INM User’s Guide, Version 7.0, April 2007. Prepared by: Ricondo & Associates, Inc., November 2010.
The INM uses the stage length category for each operation to determine which profile to use for a

Ronald Reagan Washington National Airport
Final Environmental Assessment E-20 March 2012 Runway 4-22 and Runway 15-33 RSA Enhancements Appendix E. Aircraft Noise Analysis
specific aircraft departure. In most cases, using the great circle distances from DCA to a destination to determine the stage length and therefore the departure profile to be used provides good correlation between noise levels estimated by the INM and measured noise levels. Destination data information provided by the 2007 ETMS database and the OAG flight schedule was used to derive stage length departure profiles. These assignments were held constant for 2016 and 2021.
E.5.3 Airport Operational Information
The existing and assumed future uses of the runways and flight tracks to and from the Airport are important in determining where aircraft are flying and, consequently, the noise levels generated in the Airport environs.
E.5.3.1 Runway Use
The runways available for departure and arrival at any given time are a function of the designated flow configuration at the Airport, which is typically determined by wind and weather conditions. Runway use data was not readily available for 2009. Therefore, runway use data developed for 2007 conditions for use in the noise study conducted in support of the Runway 1-19 RSA improvements EA was used. This data was then updated to represent 2009 conditions based on input from MWAA staff.
The runway use data developed was based on each unique aircraft type and remained the same for 2009, 2016, and 2021. Table E-11 shows the runway use by aircraft category for each analysis year.
E.5.3.2 Aircraft Flight Tracks
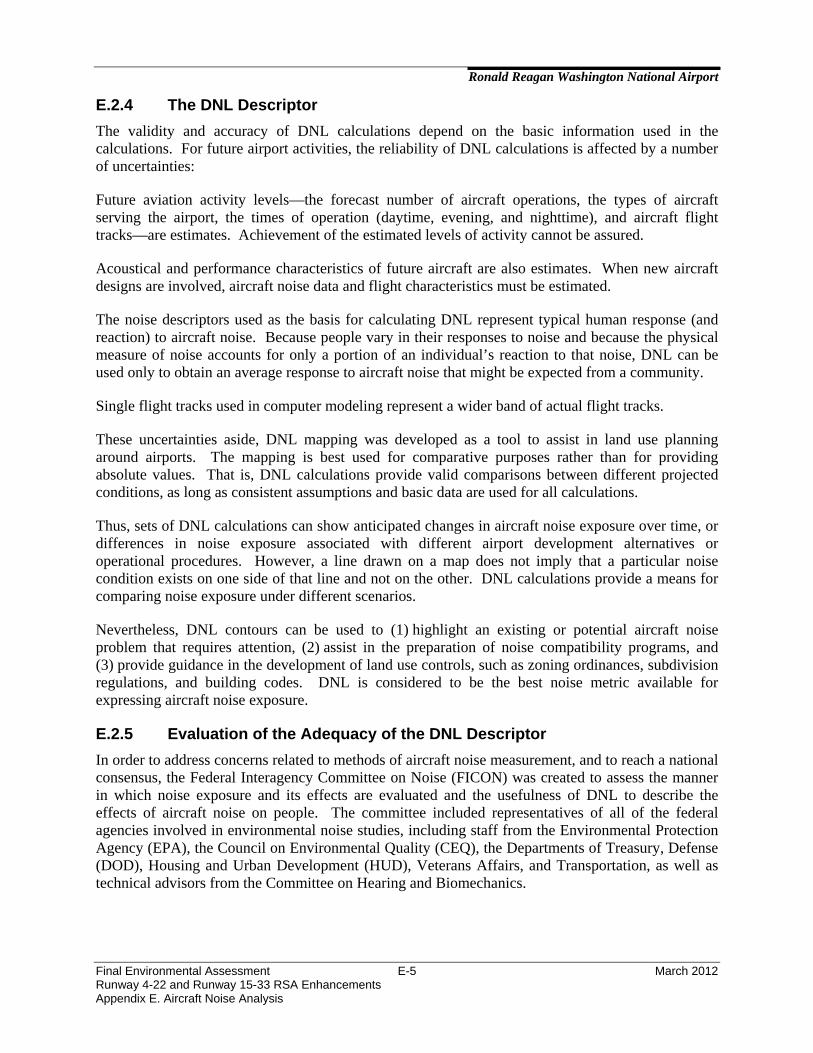
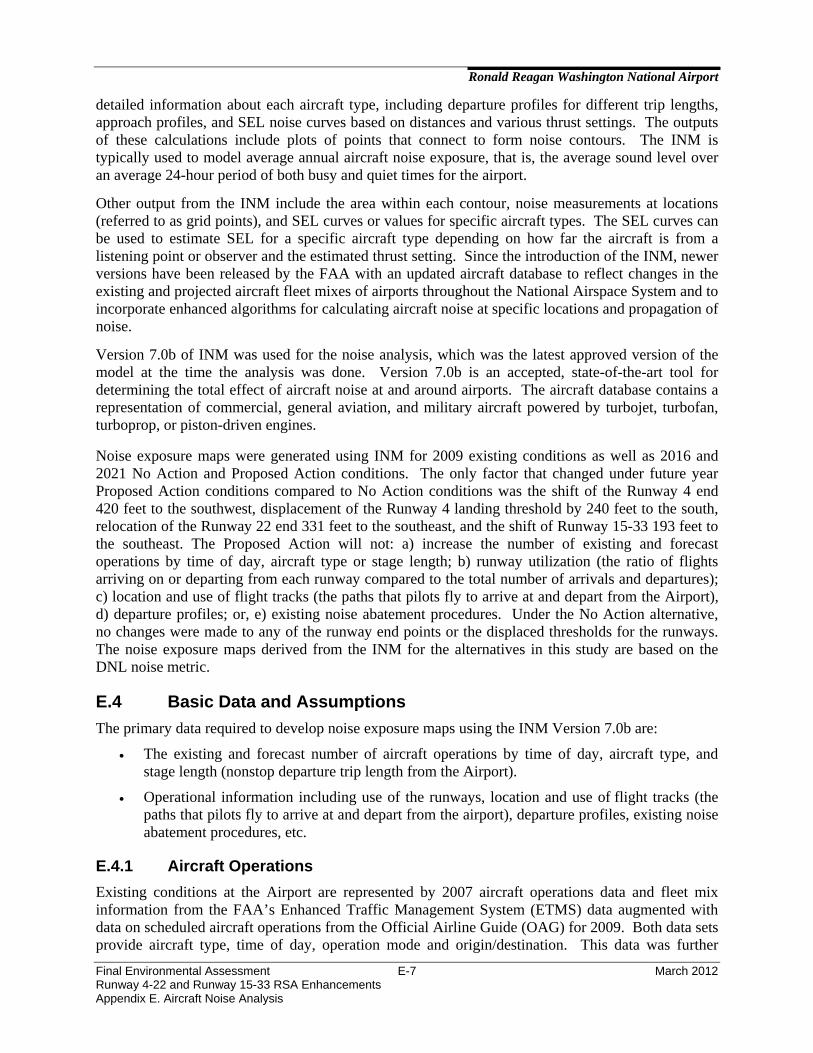
Flight tracks utilized for the noise analysis conducted in support of the Runway 1-19 RSA improvements EA were utilized for this analysis and updated based on input from MWAA staff. In general, MWAA staff confirmed that routing has not changed since 2007. Use of these generalized tracks depicts existing conditions and can be assumed for future year conditions as well. For 2016 and 2021 Proposed Action conditions, the location of departure and arrival tracks to/from Runway 4-22 and Runway 15-33 were adjusted at the runway ends to account for project conditions. The generalized arrival and departure flight tracks are depicted on Exhibit E-2 and Exhibit E-3, respectively.
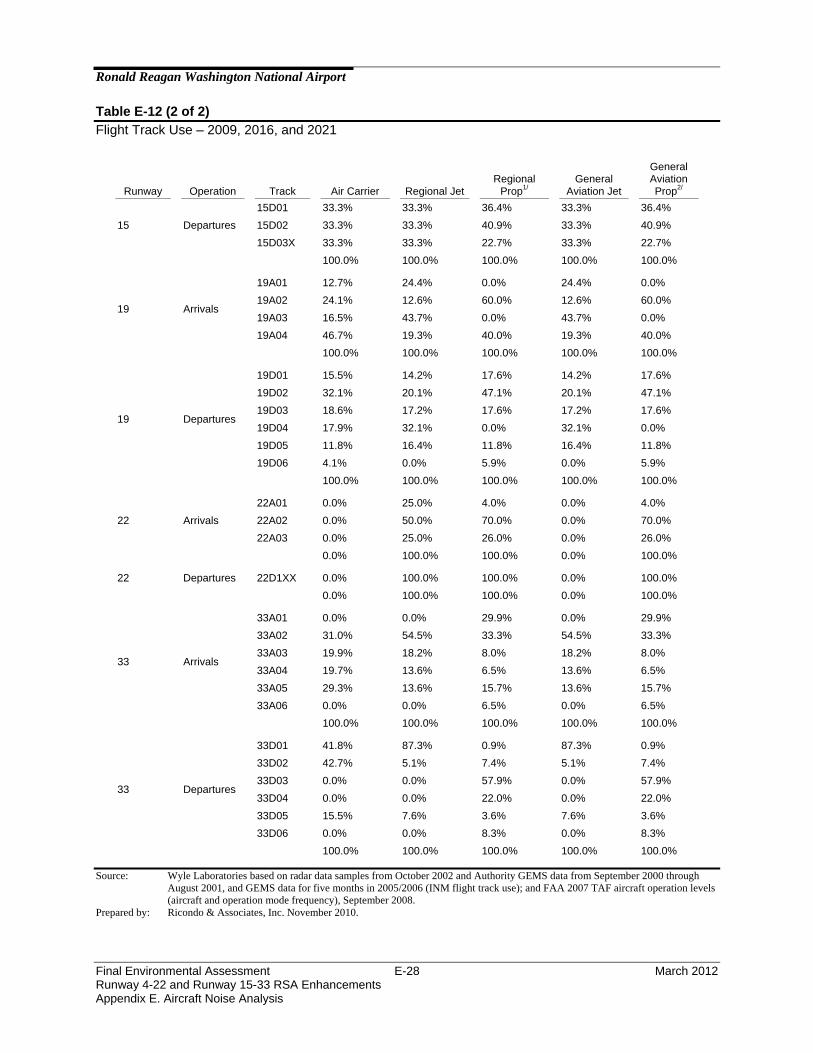
Flight track use is constant across individual aircraft categories. These track uses were held constant for all noise analysis scenarios. The Proposed Action is not expected to change the direction flights go or come from and the frequency of such occurrences. Flight track use assumptions for all years (2009, 2016, and 2021) are presented in Table E-12.
E.5.3.3 Other Assumptions
In addition to the runway use and flight track information, the following conditions were assumed in developing noise exposure maps for the Airport:
Departure and approach profiles are those typical of each aircraft given the indicated stage length.
Noise, thrust, and altitude information for each specific aircraft is as specified in the INM Version 7.0b aircraft database.
In addition, United States Geological Survey (USGS) National Elevation Dataset (NED) 1/3-arc-second resolution terrain elevation data was incorporated in the INM model. The terrain data were obtained from USGS NED website.

Ronald Reagan Washington National Airport
Final Environmental Assessment March 2012 Runway 4-22 and Runway 15-33 RSA Enhancements Appendix E. Aircraft Noise Analysis
E-21
Table E-11 Runway Use by Time of Day – 2009, 2016, and 2021
Aircraft Category
Time and Operation Type
Runway
Total 01 04 15 19 22 33
Commercial Jet Day, Arrival 55.3% 0.0% 0.5% 38.3% 0.0% 6.0% 100.0%
General Aviation Jet
Day, Arrival 51.3% 0.2% 3.2% 25.0% 6.7% 13.5% 100.0%
General Aviation Prop
Day, Arrival 22.2% 1.0% 18.5% 44.2% 5.0% 9.2% 100.0%
Regional Jet Day, Arrival 55.2% 0.0% 3.5% 35.0% 0.0% 6.2% 100.0%
Regional Prop Day, Arrival 25.5% 1.4% 9.8% 12.0% 18.5% 32.8% 100.0%
Commercial Jet Day, Departure 58.1% 1.5% 1.1% 37.7% 0.0% 1.7% 100.0%
General Aviation Jet
Day, Departure 41.5% 2.6% 14.3% 18.2% 0.1% 23.3% 100.0%
General Aviation Prop
Day, Departure 30.7% 25.8% 14.8% 23.4% 0.4% 5.0% 100.0%
Regional Jet Day, Departure 53.3% 0.0% 3.7% 35.4% 0.0% 7.6% 100.0%
Regional Prop Day, Departure 14.0% 41.0% 22.4% 11.2% 0.8% 10.6% 100.0%
Commercial Jet Night, Arrival 55.5% 0.0% 0.3% 43.6% 0.0% 0.5% 100.0%
General Aviation Jet
Night, Arrival 70.1% 0.6% 1.5% 25.0% 2.3% 0.6% 100.0%
General Aviation Prop
Night, Arrival 23.9% 0.4% 9.1% 16.5% 18.3% 31.7% 100.0%
Regional Jet Night, Arrival 60.7% 0.0% 0.0% 37.1% 0.0% 2.2% 100.0%
Regional Prop Night, Arrival 28.8% 0.3% 13.8% 12.9% 13.9% 30.3% 100.0%
Commercial Jet Night, Departure 61.9% 0.0% 0.6% 36.1% 0.0% 1.4% 100.0%
General Aviation Jet
Night, Departure 38.3% 10.0% 6.3% 33.8% 0.0% 11.6% 100.0%
General Aviation Prop
Night, Departure 25.2% 62.2% 0.0% 12.6% 0.0% 0.0% 100.0%
Regional Jet Night, Departure 52.1% 0.0% 4.2% 37.1% 0.0% 6.5% 100.0%
Regional Prop Night, Departure 9.6% 21.6% 27.0% 19.1% 0.0% 22.7% 100.0%
Sources: Ricondo & Associates, Inc., based on Wyle Laboratories, Washington National Airport (DCA) 2004 DNL Contours, May 4, 2005 (individual aircraft type runway use), 2005/2006 GEMS data (adjustments to reflect Runway 4 and 22 use by jet carriers) and FAA 2007 ETMS flight data (2007 aircraft type operations).
Prepared by: Ricondo & Associates, Inc. November 2010.
Ronald Reagan Washington National Airport
Final Environmental Assessment E-22 March 2012 Runway 4-22 and Runway 15-33 RSA Enhancements Appendix E. Aircraft Noise Analysis
THIS PAGE LEFT INTENTIONALLY BLANK

Lady Bird Johnson
Park
Naval ResearchLaboratory
Crys
tal C
ity
West Potomac
Park
AnacostiaNaval Station
BollingAir Force
Base
Roaches R unWaterfowlSanctuary
GravellyPoint
Long BridgePark (future)
George WashingtonMemorial Parkw ay
and M t. Vernon Trail
Daingerf ieldIsland
Arlington NationalCemetary
Pentagon
Potomac River
WashingtonChannel
Anaco
stia
RiverEast
PotomacParkand Golf
Course
01A2
01A3
01A5
01A4
01A1
19A2
33A2
22A3
22A1
04A1
33A419A4
01A6
19A1
19A3
33A1
01A11
22A2
01A9
15A1
01A1501A13
33A3
33A5
33A6
15A2
01A801
A7
01A12
01A1
0 01A1401A18
04A2
XX
Ronald Reagan Washington National Airport
Generalized Arrival Flight TracksExhibit E-2
0 12,500 ft
City of Alexandria
Prince George's County
Arlington County
Sources: Arlington County Department of Environmental Services land use; City of Alexandria Department of Planning & Zoning 2008 land use; Maryland Department of Planning land use; District of Columbia Office of Planning land use 2002 & point data (libraries, hospitals, churches, day care, schools); Virginia Economic Developement Partnership GIS point data (schools). note: Day care & library data for Prince George's County unavailable. Prepared by: Ricondo & Associates, Inc., 2008.
Fairfax County
City ofFalls Church
District of Columbia
HospitalSchool
LibraryReligious Facility
Day Care
G
")
")
#*
a
Major RoadJurisdictional BoundaryInterstate Highway§¦
Landmark_
Railroad
Residential
Commercial
Mixed UseIndustrial
Institutional / GovernmentParks/RecreationOpen Space
Other Roads/Unknown
Water
Ronald Reagan Washington NationalAirportVacant Space
Nominal ArrivalFlight TrackDispersed ArrivalFlight Track
19A2
Runways300 ft. RunwayExtension
LEGEND Note: Land use depicted on this exhibit reflects existing land use.
Final Environmental Assessment Runway 4-22 and Runway 15-33 RSA Enhancements Appendix E. Aircraft Noise Analysis
March 2012E-23

Ronald Reagan Washington National Airport
Final Environmental Assessment E-24 March 2012 Runway 4-22 and Runway 15-33 RSA Enhancements Appendix E. Aircraft Noise Analysis
THIS PAGE LEFT INTENTIONALLY BLANK

Lady Bird Johnson
Park
Naval ResearchLaboratory
Crys
tal C
ity
West Potomac
Park
AnacostiaNaval Station
BollingAir Force
Base
Roaches R unWaterfowlSanctuary
GravellyPoint
Long BridgePark (future)
George WashingtonMemorial Parkw ay
and M t. Vernon Trail
Daingerf ieldIsland
Arlington NationalCemetary
Pentagon
Potomac River
WashingtonChannel
Anaco
stia
RiverEast
PotomacParkand Golf
Course
01D933D5
33D2
01D8
01D5
01D7
01D6
01D1
01D4
01D3
33D1
19D2
04D1
04D3
04D2
19D5
19D3
15D1
19D6
19D4
15D2
19D1
33D6
33D4 04D433D3
22D1XX
Ronald Reagan Washington National Airport
Generalized Departure Flight TracksExhibit E-3
0 12,500 ft
City of Alexandria
Prince George's County
Arlington County
Nominal Departure Flight TrackDispersed DepartureFlight Track
Sources: Arlington County Department of Environmental Services land use; City of Alexandria Department of Planning & Zoning 2008 land use; Maryland Department of Planning land use; District of Columbia Office of Planning land use 2002 & point data (libraries, hospitals, churches, day care, schools); Virginia Economic Developement Partnership GIS point data (schools). note: Day care & library data for Prince George's County unavailable. Prepared by: Ricondo & Associates, Inc., 2008.
19D2
Fairfax County
City ofFalls Church
District of Columbia
Residential
Commercial
Mixed Use
Industrial
Institutional / GovernmentParks/RecreationOpen Space
Other Roads/Unknown
Water
Ronald Reagan Washington NationalAirportVacant Space
HospitalSchool
LibraryReligious Facility
Day Care
G
")
")
#*
a
Major RoadJurisdictional BoundaryInterstate Highway§¦
Landmark_
Railroad
Runways300 ft. RunwayExtension
LEGEND Note: Land use depicted on this exhibit reflects existing land use.
Final Environmental Assessment Runway 4-22 and Runway 15-33 RSA Enhancements Appendix E. Aircraft Noise Analysis
March 2012E-25
Ronald Reagan Washington National Airport
Final Environmental Assessment E-26 March 2012 Runway 4-22 and Runway 15-33 RSA Enhancements Appendix E. Aircraft Noise Analysis
THIS PAGE LEFT INTENTIONALLY BLANK

Ronald Reagan Washington National Airport
Final Environmental Assessment March 2012 Runway 4-22 and Runway 15-33 RSA Enhancements Appendix E. Aircraft Noise Analysis
E-27
Table E-12 (1 of 2) Flight Track Use – 2009, 2016, and 2021
Runway Operation Track Air Carrier Regional Jet Regional Prop1/ General
Aviation Jet General Aviation
Prop2/
01 Arrivals
01A1 9.5% 15.9% 3.2% 15.9% 3.2%
01A2 8.7% 19.9% 9.3% 19.9% 9.3%
01A3 1.5% 2.2% 2.0% 2.2% 2.0%
01A4 0.0% 0.0% 6.9% 0.0% 6.9%
01A5 0.0% 0.0% 4.4% 0.0% 4.4%
01A6 3.8% 5.1% 0.0% 5.1% 0.0%
01A7 3.5% 5.5% 0.5% 5.5% 0.5%
01A8 0.8% 0.8% 0.5% 0.8% 0.5%
01A9 1.2% 2.1% 0.0% 2.1% 0.0%
01A10 1.4% 3.3% 0.0% 3.3% 0.0%
01A11 13.7% 10.2% 5.9% 10.2% 5.9%
01A12 4.7% 2.1% 2.5% 2.1% 2.5%
01A13 23.1% 13.2% 10.5% 13.2% 10.5%
01A14 2.5% 1.0% 1.5% 1.0% 1.5%
01A15 3.7% 2.4% 2.5% 2.4% 2.5%
01A17 5.5% 3.6% 13.7% 3.6% 13.7%
01A18 16.3% 12.6% 36.8% 12.6% 36.8%
100.0% 100.0% 100.0% 100.0% 100.0%
01 Departures
01D1 6.2% 0.2% 2.6% 0.2% 2.6%
01D2 2.6% 3.9% 0.0% 3.9% 0.0%
01D3 11.0% 14.9% 2.6% 14.9% 2.6%
01D4 6.7% 12.2% 0.0% 12.2% 0.0%
01D5 4.7% 8.6% 0.0% 8.6% 0.0%
01D6 5.5% 5.4% 0.0% 5.4% 0.0%
01D7 2.0% 2.7% 0.0% 2.7% 0.0%
01D8 13.5% 17.9% 33.3% 17.9% 33.3%
01D9 18.7% 14.3% 17.9% 14.3% 17.9%
01D10 20.6% 13.9% 35.9% 13.9% 35.9%
01D11 8.3% 5.9% 7.7% 5.9% 7.7%
100.0% 100.0% 100.0% 100.0% 100.0%
4 Arrivals 4A01 0.0% 100.0% 90.0% 0.0% 90.0%
4A02XX 0.0% 0.0% 10.0% 0.0% 10.0%
0.0% 100.0% 100.0% 0.0% 100.0%
4 Departures
4D01 25.0% 25.0% 46.7% 0.0% 46.7%
4D02 25.0% 25.0% 32.2% 0.0% 32.2%
4D03 25.0% 25.0% 8.0% 0.0% 8.0%
4D04 25.0% 25.0% 13.1% 0.0% 13.1%
100.0% 100.0% 100.0% 100.0% 100.0%
15 Arrivals 15A01 50.0% 50.0% 84.6% 50.0% 84.6%
15A02 50.0% 50.0% 15.4% 50.0% 15.4%
100.0% 100.0% 100.0% 100.0% 100.0%
Ronald Reagan Washington National Airport
Final Environmental Assessment E-28 March 2012 Runway 4-22 and Runway 15-33 RSA Enhancements Appendix E. Aircraft Noise Analysis
Table E-12 (2 of 2) Flight Track Use – 2009, 2016, and 2021
Runway Operation Track Air Carrier Regional Jet Regional
Prop1/ General
Aviation Jet
General Aviation Prop2/
15 Departures
15D01 33.3% 33.3% 36.4% 33.3% 36.4%
15D02 33.3% 33.3% 40.9% 33.3% 40.9%
15D03X 33.3% 33.3% 22.7% 33.3% 22.7%
100.0% 100.0% 100.0% 100.0% 100.0%
19 Arrivals
19A01 12.7% 24.4% 0.0% 24.4% 0.0%
19A02 24.1% 12.6% 60.0% 12.6% 60.0%
19A03 16.5% 43.7% 0.0% 43.7% 0.0%
19A04 46.7% 19.3% 40.0% 19.3% 40.0%
100.0% 100.0% 100.0% 100.0% 100.0%
19 Departures
19D01 15.5% 14.2% 17.6% 14.2% 17.6%
19D02 32.1% 20.1% 47.1% 20.1% 47.1%
19D03 18.6% 17.2% 17.6% 17.2% 17.6%
19D04 17.9% 32.1% 0.0% 32.1% 0.0%
19D05 11.8% 16.4% 11.8% 16.4% 11.8%
19D06 4.1% 0.0% 5.9% 0.0% 5.9%
100.0% 100.0% 100.0% 100.0% 100.0%
22 Arrivals
22A01 0.0% 25.0% 4.0% 0.0% 4.0%
22A02 0.0% 50.0% 70.0% 0.0% 70.0%
22A03 0.0% 25.0% 26.0% 0.0% 26.0%
0.0% 100.0% 100.0% 0.0% 100.0%
22 Departures 22D1XX 0.0% 100.0% 100.0% 0.0% 100.0%
0.0% 100.0% 100.0% 0.0% 100.0%
33 Arrivals
33A01 0.0% 0.0% 29.9% 0.0% 29.9%
33A02 31.0% 54.5% 33.3% 54.5% 33.3%
33A03 19.9% 18.2% 8.0% 18.2% 8.0%
33A04 19.7% 13.6% 6.5% 13.6% 6.5%
33A05 29.3% 13.6% 15.7% 13.6% 15.7%
33A06 0.0% 0.0% 6.5% 0.0% 6.5%
100.0% 100.0% 100.0% 100.0% 100.0%
33 Departures
33D01 41.8% 87.3% 0.9% 87.3% 0.9%
33D02 42.7% 5.1% 7.4% 5.1% 7.4%
33D03 0.0% 0.0% 57.9% 0.0% 57.9%
33D04 0.0% 0.0% 22.0% 0.0% 22.0%
33D05 15.5% 7.6% 3.6% 7.6% 3.6%
33D06 0.0% 0.0% 8.3% 0.0% 8.3%
100.0% 100.0% 100.0% 100.0% 100.0%
Source: Wyle Laboratories based on radar data samples from October 2002 and Authority GEMS data from September 2000 through August 2001, and GEMS data for five months in 2005/2006 (INM flight track use); and FAA 2007 TAF aircraft operation levels (aircraft and operation mode frequency), September 2008.
Prepared by: Ricondo & Associates, Inc. November 2010.