ea - core beliefs presentation_ea core factor factor plus
TRANSCRIPT

© Copyright 2016. Efficient Advisors, LLC | www.EfficientAdvisors.com | Core Beliefs & Philosophy
Efficient Advisors Core Beliefs & Philosophy
Smart Investing Simplified™

© Copyright 2016. Efficient Advisors, LLC | www.EfficientAdvisors.com | Core Beliefs & Philosophy |
Efficient Advisors was founded in 2009 to support advisors seeking to offer their clients the prudence of passive, structured investing based on academic discipline. Rather than claiming to possess market-beating expertise, we focus on deploying cost-efficient, globally-diversified asset allocation which we believe forms the basis for long-term investment success. We aim to offer advisors a collaborative culture based on a core philosophy of integrity, honesty and open communication.
We now deliver our prudent investment solutions by partnering with over 100 financial advisors nationwide. Our advisors share our investment philosophy and commitment to high-touch client service allowing us to support investors across the country and to manage over $1 billion in assets.
Our mission is straightforward: utilize the power of academic research as our guiding principle in engineering low-cost, globally diversified portfolios that are designed to capture market rates of return. Then, work closely with our advisors by providing ongoing education and support as they implement these strategies with their clients.
About Efficient Advisors
Page 2 of 15

© Copyright 2016. Efficient Advisors, LLC | www.EfficientAdvisors.com | Core Beliefs & Philosophy |
About Efficient Advisors
dis·ci·plineControl that is gained by requiring that rules or orders be obeyed and punishing bad behavior
Page 3 of 15

© Copyright 2016. Efficient Advisors, LLC | www.EfficientAdvisors.com | Core Beliefs & Philosophy |
Philosophy & Core Beliefs Overview
Efficient Advisors Core Beliefs:
Our approach to investing is grounded in decades of Nobel Prize-winning, academic research. We are passionate about sharing this research and helping clients to avoid the hype, high fees and hidden agendas that can undermine investors’ results over time.
Capitalism builds wealth. Markets reward discipline.
Traditional investment management approaches based on forecasts and predictions often fail to meet expectations.
Academic research suggests a premium offered by certain risk factors – size, value, quality, momentum.
Fees matter.
1.
2.
3.
4.
Page 4 of 15
© Copyright 2016. Efficient Advisors, LLC | www.EfficientAdvisors.com | Core Beliefs & Philosophy |
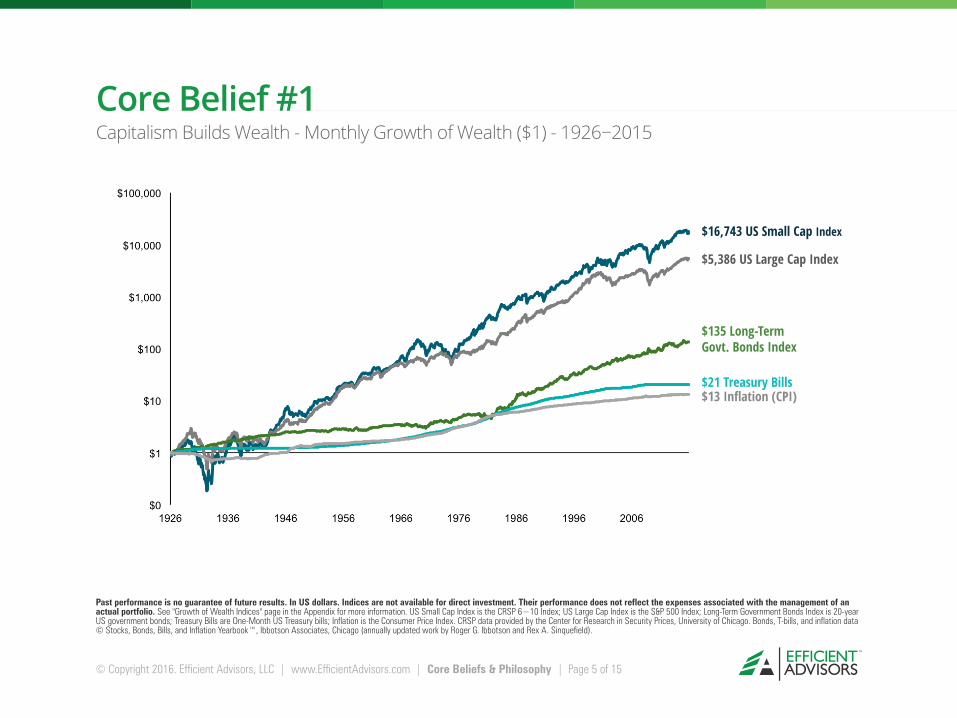
Core Belief #1Capitalism Builds Wealth - Monthly Growth of Wealth ($1) - 1926−2015
$16,743 US Small Cap Index
$5,386 US Large Cap Index
$135 Long-Term Govt. Bonds Index
$21 Treasury Bills$13 Inflation (CPI)
Past performance is no guarantee of future results. In US dollars. Indices are not available for direct investment. Their performance does not reflect the expenses associated with the management of an actual portfolio. See "Growth of Wealth Indices" page in the Appendix for more information. US Small Cap Index is the CRSP 6−10 Index; US Large Cap Index is the S&P 500 Index; Long-Term Government Bonds Index is 20-year US government bonds; Treasury Bills are One-Month US Treasury bills; Inflation is the Consumer Price Index. CRSP data provided by the Center for Research in Security Prices, University of Chicago. Bonds, T-bills, and inflation data © Stocks, Bonds, Bills, and Inflation Yearbook™, Ibbotson Associates, Chicago (annually updated work by Roger G. Ibbotson and Rex A. Sinquefield).
Page 5 of 15
© Copyright 2016. Efficient Advisors, LLC | www.EfficientAdvisors.com | Core Beliefs & Philosophy |
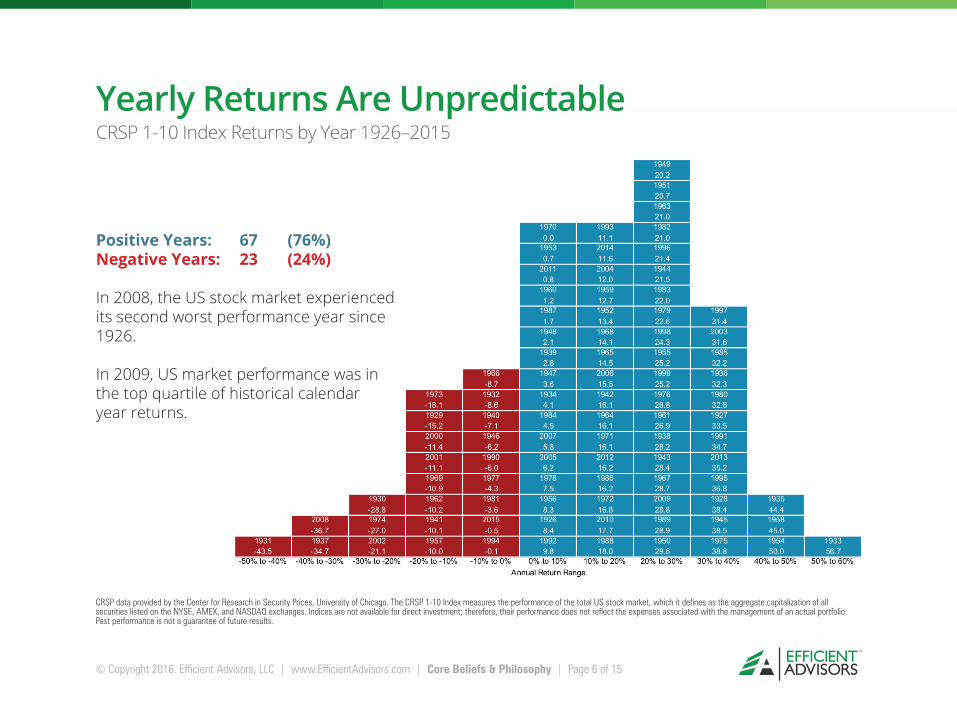
CRSP data provided by the Center for Research in Security Prices, University of Chicago. The CRSP 1-10 Index measures the performance of the total US stock market, which it defines as the aggregate capitalization of all securities listed on the NYSE, AMEX, and NASDAQ exchanges. Indices are not available for direct investment; therefore, their performance does not reflect the expenses associated with the management of an actual portfolio. Past performance is not a guarantee of future results.
Yearly Returns Are UnpredictableCRSP 1-10 Index Returns by Year 1926–2015
Page 6 of 15
Positive Years: 67 (76%)Negative Years: 23 (24%)
In 2008, the US stock market experienced its second worst performance year since 1926.
In 2009, US market performance was in the top quartile of historical calendar year returns.

© Copyright 2016. Efficient Advisors, LLC | www.EfficientAdvisors.com | Core Beliefs & Philosophy |
Balanced Strategy: 7.5% each S&P 500 Index, CRSP 6-10 Index, US Small Value Index, US Large Value Index; 15% each International Value Index, International Small Index; 40% BofA Merrill Lynch One-Year US Treasury Note Index.
The S&P data are provided by Standard & Poor’s Index Services Group. The Merrill Lynch Indices are used with permission; copyright 2012 Merrill Lynch, Pierce, Fenner & Smith Incorporated; all rights reserved. CRSP data provided by the Center for Research in Security Prices, University of Chicago. US Small Value Index and US Large Value Index provided by Fama/French. International Value Index provided by Fama/French. International Small Cap Index compiled by Dimensional from StyleResearch securities data; includes securities of MSCI EAFE countries in the bottom 10% of market capitalization, excluding the bottom 1%; market-cap weighted; each country capped at 50%; rebalanced semiannually. Indexes are not available for direct investment. Their performance does not reflect the expenses associated with the management of an actual portfolio. Past performance is not a guarantee of future results. Not to be construed as investment advice. Returns of model portfolios are based on back-tested model allocation mixes designed with the benefit of hindsight and do not represent actual investment performance.
Reacting to Extreme, Short-Term Events is DetrimentalPerformance of a Normal Balanced Strategy: 60% Stocks, 40% Bonds
Cumulative Total Return
October 1987:Stock Market Crash
August 1989:US Savings and
Loan Crisis
September 1988:Asian Contagion
Russian CrisisLong-Term Capital
Management Collapse
March 2000:Dot-Com Crash
September 2001:Terrorist Attack
September 2008: Bankruptcy of
Lehman Brothers
Page 7 of 15
© Copyright 2016. Efficient Advisors, LLC | www.EfficientAdvisors.com | Core Beliefs & Philosophy |
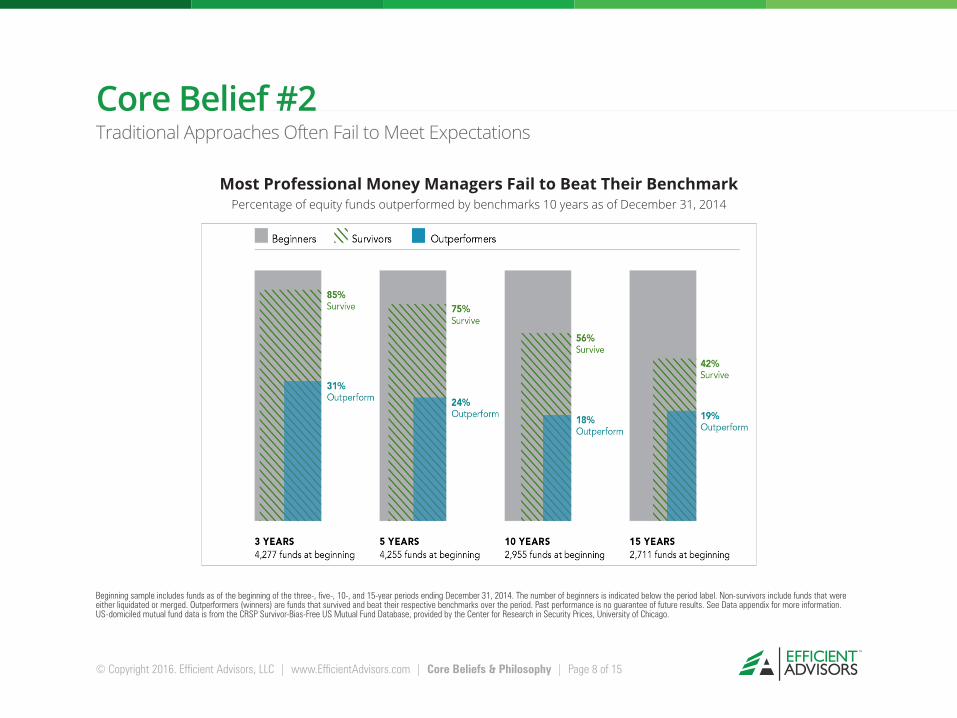
Core Belief #2Traditional Approaches Often Fail to Meet Expectations
Beginning sample includes funds as of the beginning of the three-, five-, 10-, and 15-year periods ending December 31, 2014. The number of beginners is indicated below the period label. Non-survivors include funds that were either liquidated or merged. Outperformers (winners) are funds that survived and beat their respective benchmarks over the period. Past performance is no guarantee of future results. See Data appendix for more information. US-domiciled mutual fund data is from the CRSP Survivor-Bias-Free US Mutual Fund Database, provided by the Center for Research in Security Prices, University of Chicago.
Most Professional Money Managers Fail to Beat Their BenchmarkPercentage of equity funds outperformed by benchmarks 10 years as of December 31, 2014
Page 8 of 15
© Copyright 2016. Efficient Advisors, LLC | www.EfficientAdvisors.com | Core Beliefs & Philosophy |
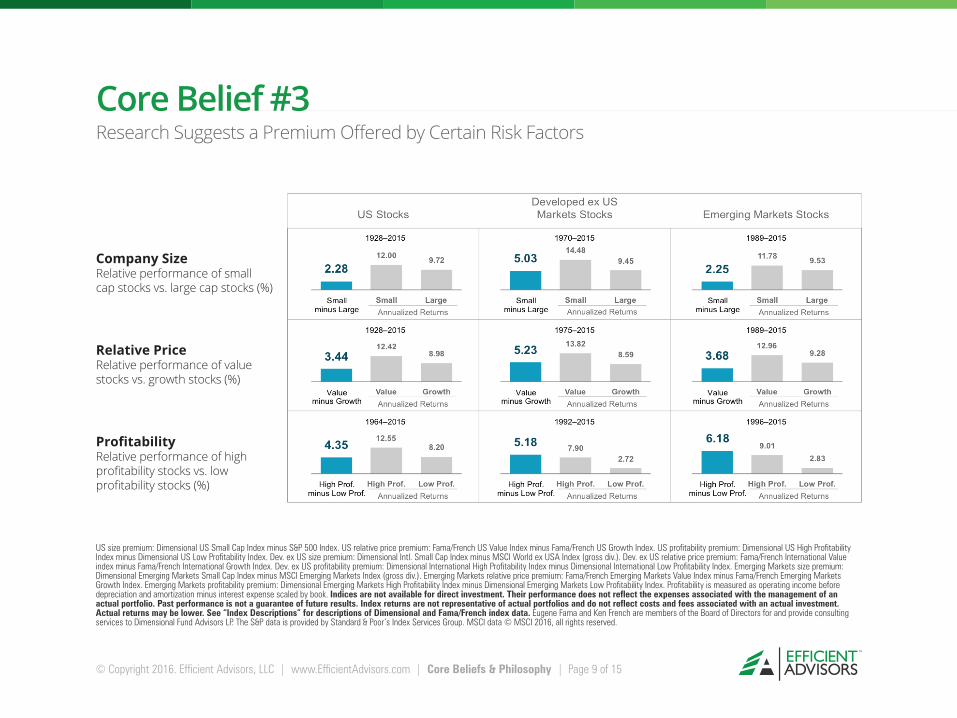
Core Belief #3Research Suggests a Premium Offered by Certain Risk Factors
US size premium: Dimensional US Small Cap Index minus S&P 500 Index. US relative price premium: Fama/French US Value Index minus Fama/French US Growth Index. US profitability premium: Dimensional US High Profitability Index minus Dimensional US Low Profitability Index. Dev. ex US size premium: Dimensional Intl. Small Cap Index minus MSCI World ex USA Index (gross div.). Dev. ex US relative price premium: Fama/French International Value index minus Fama/French International Growth Index. Dev. ex US profitability premium: Dimensional International High Profitability Index minus Dimensional International Low Profitability Index. Emerging Markets size premium: Dimensional Emerging Markets Small Cap Index minus MSCI Emerging Markets Index (gross div.). Emerging Markets relative price premium: Fama/French Emerging Markets Value Index minus Fama/French Emerging Markets Growth Index. Emerging Markets profitability premium: Dimensional Emerging Markets High Profitability Index minus Dimensional Emerging Markets Low Profitability Index. Profitability is measured as operating income before depreciation and amortization minus interest expense scaled by book. Indices are not available for direct investment. Their performance does not reflect the expenses associated with the management of an actual portfolio. Past performance is not a guarantee of future results. Index returns are not representative of actual portfolios and do not reflect costs and fees associated with an actual investment. Actual returns may be lower. See “Index Descriptions” for descriptions of Dimensional and Fama/French index data. Eugene Fama and Ken French are members of the Board of Directors for and provide consulting services to Dimensional Fund Advisors LP. The S&P data is provided by Standard & Poor’s Index Services Group. MSCI data © MSCI 2016, all rights reserved.
Page 9 of 15
Company SizeRelative performance of small cap stocks vs. large cap stocks (%)
Relative PriceRelative performance of value stocks vs. growth stocks (%)
ProfitabilityRelative performance of high profitability stocks vs. low profitability stocks (%)

© Copyright 2016. Efficient Advisors, LLC | www.EfficientAdvisors.com | Core Beliefs & Philosophy |
Small Cap and Value Can UnderperformAnnual: 1928–2015
Equity premium: Fama/French Total US Market Index minus one-month US Treasury Bills. Size premium: Dimensional US Small Cap Index minus the S&P 500 Index. Relative price premium: Fama/French US Value Index minus the Fama/French US Growth Index. Profitability premium: Dimensional US High Profitability Index minus the Dimensional US Low Profitability Index. Profitability is measured as operating income before depreciation and amortization minus interest expense, scaled by book. Dimensional indices use CRSP and Compustat data. Fama/French indices provided by Ken French. The S&P data is provided by Standard & Poor's Index Services Group. Index descriptions available upon request. Eugene Fama and Ken French are members of the Board of Directors for and provide consulting services to Dimensional Fund Advisors LP. Indices are not available for direct investment. Their performance does not reflect the expenses associated with the management of an actual portfolio. Past performance is no guarantee of future results.
US Size Premium
US Value Premium
On an annualized basis, small cap and value stocks have had more positive than negative five-year periods relative to large cap and growth stocks.
These periods typically offer stronger performance relative to large cap and growth.
Small cap and value stocks are still subject to extended periods of underperformance.
•
•
•
Page 10 of 15
© Copyright 2016. Efficient Advisors, LLC | www.EfficientAdvisors.com | Core Beliefs & Philosophy |
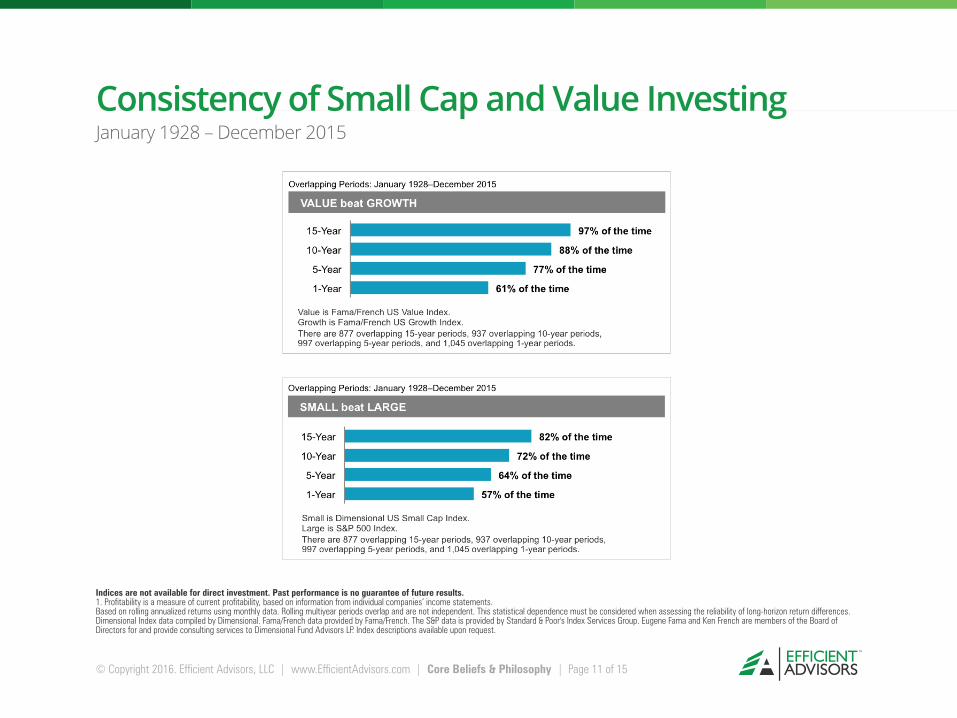
Consistency of Small Cap and Value InvestingJanuary 1928 – December 2015
Indices are not available for direct investment. Past performance is no guarantee of future results.1. Profitability is a measure of current profitability, based on information from individual companies’ income statements. Based on rolling annualized returns using monthly data. Rolling multiyear periods overlap and are not independent. This statistical dependence must be considered when assessing the reliability of long-horizon return differences. Dimensional Index data compiled by Dimensional. Fama/French data provided by Fama/French. The S&P data is provided by Standard & Poor's Index Services Group. Eugene Fama and Ken French are members of the Board of Directors for and provide consulting services to Dimensional Fund Advisors LP. Index descriptions available upon request.
Page 11 of 15
© Copyright 2016. Efficient Advisors, LLC | www.EfficientAdvisors.com | Core Beliefs & Philosophy |
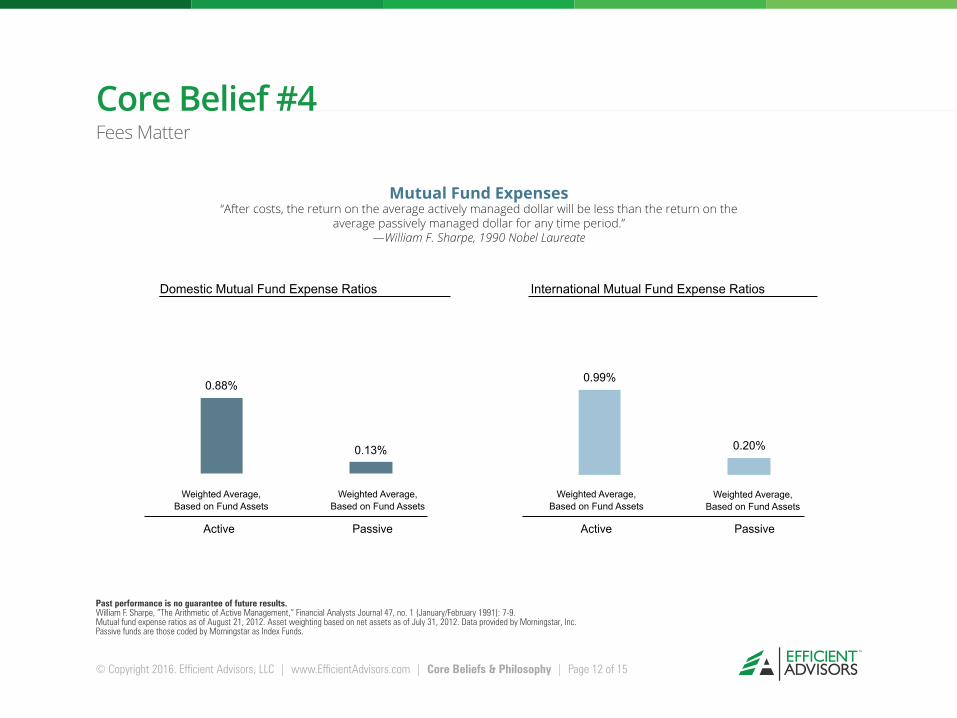
Core Belief #4Fees Matter
0.99%
0.20%
0.88%
0.13%
Weighted Average, Based on Fund Assets
Active Passive
Domestic Mutual Fund Expense Ratios
Weighted Average, Based on Fund Assets
Weighted Average, Based on Fund Assets
Active Passive
Weighted Average, Based on Fund Assets
International Mutual Fund Expense Ratios
Past performance is no guarantee of future results.William F. Sharpe, “The Arithmetic of Active Management,” Financial Analysts Journal 47, no. 1 (January/February 1991): 7-9.Mutual fund expense ratios as of August 21, 2012. Asset weighting based on net assets as of July 31, 2012. Data provided by Morningstar, Inc. Passive funds are those coded by Morningstar as Index Funds.
Mutual Fund Expenses“After costs, the return on the average actively managed dollar will be less than the return on the
average passively managed dollar for any time period.”—William F. Sharpe, 1990 Nobel Laureate
Page 12 of 15

© Copyright 2016. Efficient Advisors, LLC | www.EfficientAdvisors.com | Core Beliefs & Philosophy |
Efficient Advisors Core Beliefs:
Capitalism builds wealth. Markets reward discipline.
Traditional investment approaches often fail to meet expectations
Academic research suggests a premium offered by certain risk factors
Fees matter
1.
2.
3.
4.
Page 13 of 15
© Copyright 2016. Efficient Advisors, LLC | www.EfficientAdvisors.com | Core Beliefs & Philosophy |
Warren E. Buffett
“Most investors, both institutional and individual, will find that the best way to own common stocks is through an index fund that charges minimal fees.”
Chairman and CEO, Berkshire Hathaway, Inc.
Berkshire Hathaway Inc., 1996 Annual Report, chairman’s letter, in www.berkshirehathaway.com.
Page 14 of 15

EA Disciplined Core PortfoliosAsset Allocation Mix - as of March 31, 2016
CONSERVATIVE
US Stock 13.25%US Large Core 7.00%US Large Value 3.85%US SMID Core 1.35%US SMID Value 1.05%
Int’l Stock 4.75%Int’l Core 2.65%Int’l Value 2.10%
Emerging Stock 1.00%Emerging Markets 1.00%
Real Estate 1.00%Global Real Estate 1.00%
Bonds 78.00%Short Term 34.30%Intermediate Term 28.85%Long Term 14.85%
Cash 2.00%
US Stock 26.50%US Large Core 14.05%US Large Value 7.70%US SMID Core 2.65%US SMID Value 2.10%
Int’l Stock 9.50%Int’l Core 2.65%Int’l Value 2.10%
Emerging Stock 2.00%Emerging Markets 2.00%
Real Estate 2.00%Global Real Estate 2.00%
Bonds 58.00%Short Term 25.50%Intermediate Term 21.50%Long Term 11.00%
Cash 2.00%
US Stock 39.75%US Large Core 21.05%US Large Value 11.55%US SMID Core 4.00%US SMID Value 3.15%
Int’l Stock 14.25%Int’l Core 8.00%Int’l Value 6.25%
Emerging Stock 3.00%Emerging Markets 3.00%
Real Estate 3.00%Global Real Estate 3.00%
Bonds 38.00%Short Term 16.70%Intermediate Term 14.05%Long Term 7.25%
Cash 2.00%
US Stock 53.00%US Large Core 28.10%US Large Value 15.35%US SMID Core 5.30%US SMID Value 4.25%
Int’l Stock 19.00%Int’l Core 10.65%Int’l Value 8.35%
Emerging Stock 4.00%Emerging Markets 4.00%
Real Estate 4.00%Global Real Estate 4.00%
Bonds 18.00%Short Term 7.95%Intermediate Term 6.65%Long Term 3.40%
Cash 2.00%
US Stock 65.00%US Large Core 34.45%US Large Value 18.85%US SMID Core 6.50%US SMID Value 5.20%
Int’l Stock 23.00%Int’l Core 12.90%Int’l Value 10.10%
Emerging Stock 5.00%Emerging Markets 5.00%
Real Estate 5.00%Global Real Estate 5.00%
Cash 2.00%
MODERATE BALANCED GROWTH AGGRESSIVE
US Large Core = CRSP US Large CapUS Large Core = Russell Top 200US Large Value = Morningstar US Market Factor Tilt US Large Value = CRSP US Large Cap Value
Efficient Advisors maintains the discretion to change the allocations of the portfolios at any time and without prior notice to clients.
US SMID Core = Morningstar US Small CapUS SMID Value = CRSP US Small Cap ValueInt’l Core = MSCI EAFE IMI Int’l SMID Core = S&P Developed Ex US Under $2 Billion
Emerging Markets = MSCI EM IMIGlobal Real Estate = DJ Global Select RESIShort Term Bond = Barclays US Government/Credit 1-5 Year Intermediate Term Bond = Barclays US Aggregate BondLong Term Bond = Barclays US Government/Credit 5-10 Year
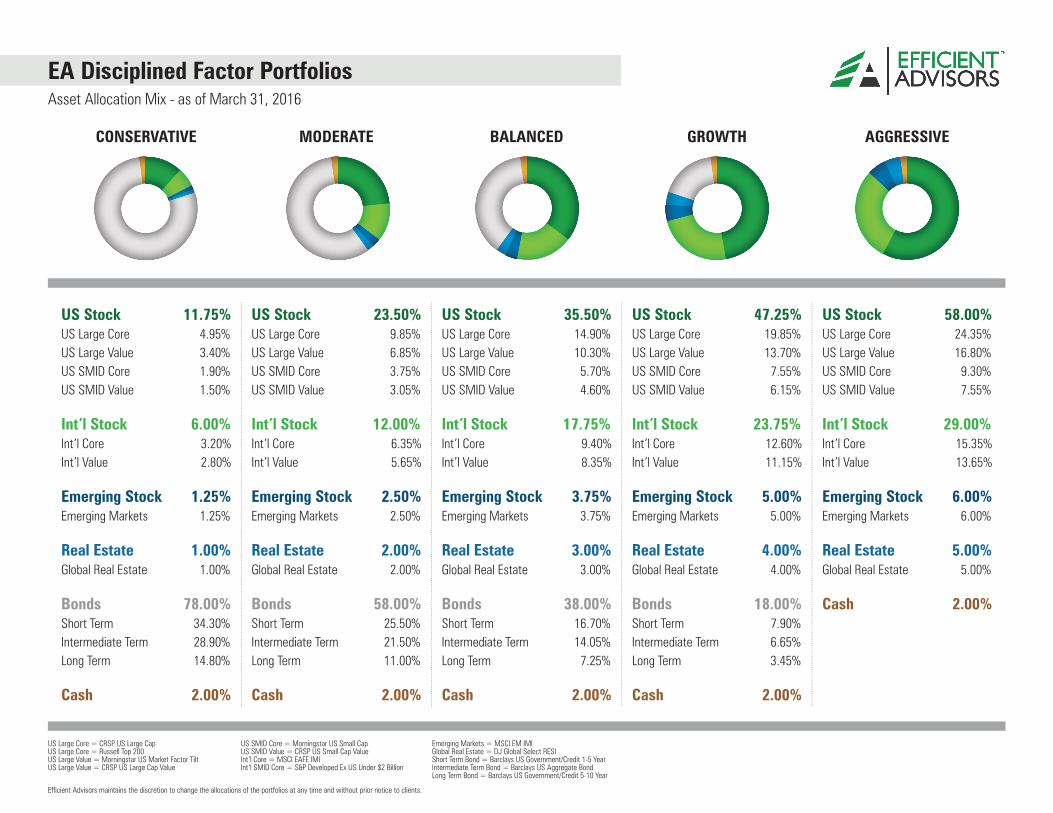
EA Disciplined Factor PortfoliosAsset Allocation Mix - as of March 31, 2016
CONSERVATIVE
US Stock 11.75%US Large Core 4.95%US Large Value 3.40%US SMID Core 1.90%US SMID Value 1.50%
Int’l Stock 6.00%Int’l Core 3.20%Int’l Value 2.80%
Emerging Stock 1.25%Emerging Markets 1.25%
Real Estate 1.00%Global Real Estate 1.00%
Bonds 78.00%Short Term 34.30%Intermediate Term 28.90%Long Term 14.80%
Cash 2.00%
US Stock 23.50%US Large Core 9.85%US Large Value 6.85%US SMID Core 3.75%US SMID Value 3.05%
Int’l Stock 12.00%Int’l Core 6.35%Int’l Value 5.65%
Emerging Stock 2.50%Emerging Markets 2.50%
Real Estate 2.00%Global Real Estate 2.00%
Bonds 58.00%Short Term 25.50%Intermediate Term 21.50%Long Term 11.00%
Cash 2.00%
US Stock 35.50%US Large Core 14.90%US Large Value 10.30%US SMID Core 5.70%US SMID Value 4.60%
Int’l Stock 17.75%Int’l Core 9.40%Int’l Value 8.35%
Emerging Stock 3.75%Emerging Markets 3.75%
Real Estate 3.00%Global Real Estate 3.00%
Bonds 38.00%Short Term 16.70%Intermediate Term 14.05%Long Term 7.25%
Cash 2.00%
US Stock 47.25%US Large Core 19.85%US Large Value 13.70%US SMID Core 7.55%US SMID Value 6.15%
Int’l Stock 23.75%Int’l Core 12.60%Int’l Value 11.15%
Emerging Stock 5.00%Emerging Markets 5.00%
Real Estate 4.00%Global Real Estate 4.00%
Bonds 18.00%Short Term 7.90%Intermediate Term 6.65%Long Term 3.45%
Cash 2.00%
US Stock 58.00%US Large Core 24.35%US Large Value 16.80%US SMID Core 9.30%US SMID Value 7.55%
Int’l Stock 29.00%Int’l Core 15.35%Int’l Value 13.65%
Emerging Stock 6.00%Emerging Markets 6.00%
Real Estate 5.00%Global Real Estate 5.00%
Cash 2.00%
MODERATE BALANCED GROWTH AGGRESSIVE
US Large Core = CRSP US Large CapUS Large Core = Russell Top 200US Large Value = Morningstar US Market Factor Tilt US Large Value = CRSP US Large Cap Value
Efficient Advisors maintains the discretion to change the allocations of the portfolios at any time and without prior notice to clients.
US SMID Core = Morningstar US Small CapUS SMID Value = CRSP US Small Cap ValueInt’l Core = MSCI EAFE IMI Int’l SMID Core = S&P Developed Ex US Under $2 Billion
Emerging Markets = MSCI EM IMIGlobal Real Estate = DJ Global Select RESIShort Term Bond = Barclays US Government/Credit 1-5 Year Intermediate Term Bond = Barclays US Aggregate BondLong Term Bond = Barclays US Government/Credit 5-10 Year

EA Disciplined Factor Plus PortfoliosAsset Allocation Mix - as of March 31, 2016
CONSERVATIVE
US Stock 9.50%US Large Core 3.50%US Large Value 2.20%US SMID Core 1.90%US SMID Value 1.90%
Int’l Stock 7.75%Int’l Core 4.25%Int’l Value 3.50%
Emerging Stock 1.75%Emerging Markets 1.75%
Real Estate 1.00%Global Real Estate 1.00%
Bonds 78.00%Short Term 34.30%Intermediate Term 28.85%Long Term 14.85%
Cash 2.00%
US Stock 19.00%US Large Core 7.05%US Large Value 4.35%US SMID Core 3.80%US SMID Value 3.80%
Int’l Stock 15.75%Int’l Core 8.65%Int’l Value 7.10%
Emerging Stock 3.25%Emerging Markets 3.25%
Real Estate 2.00%Global Real Estate 2.00%
Bonds 58.00%Short Term 25.50%Intermediate Term 21.50%Long Term 11.00%
Cash 2.00%
US Stock 29.00%US Large Core 10.75%US Large Value 6.65%US SMID Core 5.80%US SMID Value 5.80%
Int’l Stock 23.00%Int’l Core 12.65%Int’l Value 10.35%
Emerging Stock 5.00%Emerging Markets 5.00%
Real Estate 3.00%Global Real Estate 3.00%
Bonds 38.00%Short Term 16.70%Intermediate Term 14.05%Long Term 7.25%
Cash 2.00%
US Stock 38.00%US Large Core 14.05%US Large Value 8.75%US SMID Core 7.60%US SMID Value 7.60%
Int’l Stock 31.50%Int’l Core 17.35%Int’l Value 14.15%
Emerging Stock 6.50%Emerging Markets 6.50%
Real Estate 4.00%Global Real Estate 4.00%
Bonds 18.00%Short Term 7.90%Intermediate Term 6.65%Long Term 3.45%
Cash 2.00%
US Stock 47.00%US Large Core 17.40%US Large Value 10.80%US SMID Core 9.40%US SMID Value 9.40%
Int’l Stock 38.00%Int’l Core 20.90%Int’l Value 17.10%
Emerging Stock 8.00%Emerging Markets 8.00%
Real Estate 5.00%Global Real Estate 5.00%
Cash 2.00%
MODERATE BALANCED GROWTH AGGRESSIVE
US Large Core = CRSP US Large CapUS Large Core = Russell Top 200US Large Value = Morningstar US Market Factor Tilt US Large Value = CRSP US Large Cap Value
Efficient Advisors maintains the discretion to change the allocations of the portfolios at any time and without prior notice to clients.
US SMID Core = Morningstar US Small CapUS SMID Value = CRSP US Small Cap ValueInt’l Core = MSCI EAFE IMI Int’l SMID Core = S&P Developed Ex US Under $2 Billion
Emerging Markets = MSCI EM IMIGlobal Real Estate = DJ Global Select RESIShort Term Bond = Barclays US Government/Credit 1-5 Year Intermediate Term Bond = Barclays US Aggregate BondLong Term Bond = Barclays US Government/Credit 5-10 Year