eagle high plantations - credit suisse
TRANSCRIPT

DISCLOSURE APPENDIX AT THE BACK OF THIS REPORT CONTAINS IMPORTANT DISCLOSURES, ANALYST CERTIFICATIONS, AND THE STATUS OF NON-US ANALYSTS. US Disclosure: Credit Suisse does and seeks to do business with companies covered in its research reports. As a result, investors should be aware that the Firm may have a conflict of interest that could affect the objectivity of this report. Investors should consider this report as only a single factor in making their investment decision.
CREDIT SUISSE SECURITIES RESEARCH & ANALYTICS BEYOND INFORMATION®
Client-Driven Solutions, Insights, and Access
02 February 2015
Asia Pacific/Indonesia
Equity Research
Agricultural Products & Agribusiness
Eagle High Plantations
(BWPT.JK / BWPT IJ) REINSTATEMENT
A new chapter begins
■ Following the reverse takeover… After its rights issue in Dec-14, Eagle
High Plantations (previously known as BW Plantations) has acquired Green
Eagle Holdings' (Green) plantation assets at Rp10.8 tn. PT Rajawali Capital
International (Rajawali) is now the major shareholder with a 70% stake.
■ …the transformation. Post acquisition, Eagle High has doubled its planted
area size (from 70,355 ha to 147,289 ha, as of Dec-14). Total land rights will
be 4x larger (from 94,513 ha to 419,006 ha), implying a significant headroom
for future expansion. In the meantime, the plantation profile should remain
young at about eight years of nucleus mature area.
■ What's next? We expect Eagle High to see more than twice YoY FFB and
palm oil production output. It has the bulk of its young plantation
transforming into prime age in the coming years which should increase
yields. We forecast a 19% palm oil production CAGR over 2015-17. We
expect its net gearing to come down to less than 0.5x (from BWPT 1.5x).
The more flexible balance sheet does imply potential faster new planting.
■ Maintain NEUTRAL. Following the rights issue, the company's share capital
has ballooned seven-fold from 4.5 mn to 31.5 mn shares. We revise our
EPS down by 28-77%. Based on our earnings revisions and 14.0x FY15E
P/E, we have arrived at a target price of Rp350. At the current valuation, we
reinstate and maintain our NEUTRAL rating. Our TP multiple is in line with
the Indonesian plantation sector historical P/E average. (Note: we are
assuming a CPO price assumption of RM2,600/t for 2015 and a
Rp12,000/US$ exchange rate, or a CPO price of around Rp8,400/kg). We
reinstate coverage on Eagle High as it recently came off restriction.
Share price performance
20
70
120
200
700
1200
Feb-13 Jun-13 Oct-13 Feb-14 Jun-14 Oct-14
Price (LHS) Rebased Rel (RHS)
The price relative chart measures performance against the JSX
COMPOSITE INDEX which closed at 5276.24 on 02/02/15
On 02/02/15 the spot exchange rate was Rp12690./US$1
Performance over 1M 3M 12M Absolute (%) -10.6 -20.2 -66.1 — Relative (%) -11.2 -24.2 -85.5 —
Financial and valuation metrics
Year 12/13A 12/14E 12/15E 12/16E Revenue (Rp bn) 1,144.2 1,399.3 3,878.8 4,731.4 EBITDA (Rp bn) 483.0 555.2 1,614.2 1,975.4 EBIT (Rp bn) 325.6 368.4 1,249.4 1,529.2 Net profit (Rp bn) 181.8 209.8 791.8 985.3 EPS (CS adj.) (Rp) 43.51 46.93 25.12 31.25 Change from previous EPS (%) n.a. -28.2 -73.1 -76.8 Consensus EPS (Rp) n.a. 17.1 25.3 32.5 EPS growth (%) -31.1 7.9 -46.5 24.4 P/E (x) 8.2 7.6 14.1 11.4 Dividend yield (%) 2.9 1.7 0.3 1.1 EV/EBITDA (x) 30.5 26.6 10.7 8.7 P/B (x) 0.74 0.68 0.90 0.84 ROE (%) 9.6 9.4 10.8 7.7 Net debt/equity (%) 162.0 150.5 50.0 45.4
Source: Company data, Thomson Reuters, Credit Suisse estimates.
Rating NEUTRAL* [V] Price (02 Feb 15, Rp) 355.00 Target price (Rp) 350.00¹ Upside/downside -1.4% Mkt cap (Rp bn) 11,191.48 (US$0.88 bn) Enterprise value (Rp bn) 14,753 Number of shares (mn) 31,525.29 Free float (%) 22.6 52-week price range 1,168.0 - 337.0 ADTO - 6M (US$ mn) 2.3
*Stock ratings are relative to the coverage universe in each
analyst's or each team's respective sector.
¹Target price is for 12 months.
[V] = Stock considered volatile (see Disclosure Appendix).
Research Analysts
Priscilla Tjitra
62 21 2553 7906

02 February 2015
Eagle High Plantations
(BWPT.JK / BWPT IJ) 2
Focus charts Figure 1: Rajawali now owns 70% of Eagle High
PT BW Investindo (4.98%)
PT Rajawali Capital International (70.97%)
Eagle High Plantations
Others
(24.05%)
Source: Company data
Figure 2: Eagle high continues to have a young plantation
profile, but a bigger scale versus peers'…
Figure 3: …and the largest unplanted reserve land bank
(4x larger than before)
-
100,000
200,000
300,000
400,000
500,000
600,000
Sim
e D
arby
Feld
a
Wilm
ar
Salim
Ivom
as
Astra
Agr
o
KL K
epon
g
IOI
Firs
t Res
ourc
es
The
com
bine
d gr
oup
Bum
itam
a
Gen
ting
Plan
tatio
ns
Lond
on S
umat
ra
Sam
poer
na A
gro
BWPT
DSN
IJM
Pla
ntat
ions
Uni
ted
Plan
tatio
ns
2013
nuc
lues
pla
nted
are
a (H
a)
Mature Immature
-
50,000
100,000
150,000
200,000
250,000
300,000
The
com
bine
d gr
oup
DSN
Sam
poer
na A
gro
Gol
den
Agri
Gen
ting
Plan
tatio
ns
Salim
Ivom
as
Bum
itam
a
Wilm
ar IOI
Sim
e Da
rby
BWPT
KL K
epon
g
Lond
on S
umat
ra
Unite
d Pl
anta
tions
2013
Est
imat
ed u
npla
nted
rese
rves
(ha)
Source: Company data Source: Company data
Figure 4: FFB production should be more than twice the
current size
Figure 5: Yield should improve along with maturity
-
500,000
1,000,000
1,500,000
2,000,000
2,500,000
3,000,000
2010 2011 2012 2013 2014E 2015E 2016E 2017E
Tot
al F
FB
(ton
s)
nucleus plasma
more than double
+17%
+21%
CAGR 15-17E19%
7.0
7.5
8.0
8.5
9.0
9.5
10.0
10.5
-
5.0
10.0
15.0
20.0
25.0
30.0
2010 2011 2012 2013 2014E 2015E 2016E 2017E
year
s
tons
/ha
FFB Yield Age Profile - Mature
Source: Company data, Credit Suisse estimates Source: Company data, Credit Suisse estimates

02 February 2015
Eagle High Plantations
(BWPT.JK / BWPT IJ) 3
A new chapter begins Eagle High Plantations (previously known as BW Plantations) recently offered a 6-to-1
rights issue to its shareholders with Rajawali as the standby buyer. Post the rights issue
completed in December, the majority stockholding of the company has changed hands
from PT BW Investindo (BWI) to PT Rajawali Capital International (Rajawali), which now
owns a 70.97% stake. BWI's ownership has fallen from 34.86% to 4.98%.
What's next?
Post acquisition, we expect Eagle High to see more than twice YoY FFB and palm oil
production output. It has the bulk of its young plantation transforming into prime age in the
coming years which should increase yields. We forecast a 19% palm oil production CAGR
over 2015-17. We also expect its net gearing to come down to less than 0.5x (from BWPT
1.5x). The interest coverage ratio should also improve, meaning the company now has
better capacity to pay off interest charges. In all, the more flexible balance sheet does
imply potential faster new planting. We are assuming up to 10,000 ha of new planting p.a.
Maintain NEUTRAL
Following the rights issue, the company's share capital has ballooned seven-fold from 4.5
mn to 31.5 mn shares. We have revised our earnings estimates to incorporate the rights
issue and Green's acquisition to the company's financials. Based on the earnings revisions
and 14.0x FY15E P/E, we arrive at our target price of Rp350. Our target price multiple in
line with the Indonesian plantation sector historical P/E average, and a discount to Astra
Agro (AALI) or London Sumatra (LSIP). (Note: we are assuming a CPO price assumption
of RM2,600/t for 2015 and a Rp12,000/US$ exchange rate, or a CPO price of around
Rp8,400/kg).
At the current valuation, we maintain our NEUTRAL rating on the stock. We believe that
the positive synergies from Green's acquisition will not accrue immediately but be realised
over time. We would like to watch closely new management's track record.

02 February 2015
Eagle High Plantations
(BWPT.JK / BWPT IJ) 4
Eagle High Plantations BWPT.JK / BWPT IJ Price (02 Feb 15): Rp355.00, Rating: NEUTRAL [V], Target Price: Rp350.00, Analyst: Priscilla Tjitra
Target price scenario
Scenario TP %Up/Dwn Assumptions
Upside 380.00 7.04 FY15E P/E of 16x Central Case 350.00 (1.41) FY15E P/E of 14x Downside 290.00 (18.31) FY15E P/E of 12x
Key earnings drivers 12/13A 12/14E 12/15E 12/16E
Matured Acreage (Ha) 41,448 52,060 112,980 129,852 Matured Acreage Growth 50.0 25.6 117.0 14.9 FFB Yield (tonnes/ha) 15.8 13.9 16.3 16.5 CPO Price Assumption 2,370 2,400 2,600 2,700 CPO Production Growth 12.8 9.6 170.1 18.5
Income statement (Rp bn) 12/13A 12/14E 12/15E 12/16E
Sales revenue 1,144 1,399 3,879 4,731 Cost of goods sold 603 784 2,013 2,447 SG&A 215.6 246.9 616.2 755.5 Other operating exp./(inc.) (157.4) (186.8) (364.7) (446.3) EBITDA 483 555 1,614 1,975 Depreciation & amortisation 157.4 186.8 364.7 446.3 EBIT 326 368 1,249 1,529 Net interest expense/(inc.) 82.6 87.3 193.7 215.5 Non-operating inc./(exp.) 11.9 (1.4) — — Associates/JV — — — — Recurring PBT 255 280 1,056 1,314 Exceptionals/extraordinaries — — — — Taxes 73.1 69.9 263.9 328.4 Profit after tax 181.8 209.8 791.8 985.3 Other after tax income — — — — Minority interests — — — — Preferred dividends — — — — Reported net profit 181.8 209.8 791.8 985.3 Analyst adjustments — — — — Net profit (Credit Suisse) 181.8 209.8 791.8 985.3
Cash flow (Rp bn) 12/13A 12/14E 12/15E 12/16E
EBIT 326 368 1,249 1,529 Net interest — — — — Tax paid — — — — Working capital 49.8 166.0 (587.5) (72.4) Other cash & non-cash items (280.6) 28.2 (92.9) (97.6) Operating cash flow 95 563 569 1,359 Capex (1,406) (630) (7,689) (1,335) Free cash flow to the firm (1,311) (67) (7,120) 24 Disposals of fixed assets — — — — Acquisitions — — — — Divestments — — — — Associate investments — — — — Other investment/(outflows) 302 55 (5,357) 16 Investing cash flow (1,104) (575) (13,046) (1,320) Equity raised — — — — Dividends paid (46.6) (27.3) (31.5) (118.8) Net borrowings 746 86 3,107 100 Other financing cash flow 327 17 9,948 181 Financing cash flow 1,026 75 13,024 162 Total cash flow 16.8 62.7 546.7 201.6 Adjustments 0.91 — — — Net change in cash 17.7 62.7 546.7 201.6
Balance sheet (Rp bn) 12/13A 12/14E 12/15E 12/16E
Cash & cash equivalents 68.2 130.9 677.6 879.1 Current receivables 28.3 34.6 531.3 648.1 Inventories 159.5 107.4 330.9 402.2 Other current assets 63.0 77.1 310.3 378.5 Current assets 319 350 1,850 2,308 Property, plant & equip. 5,127 5,570 12,178 13,067 Investments — — — — Intangibles 69 73 4,621 4,621 Other non-current assets 685 627 1,435 1,419 Total assets 6,200 6,620 20,084 21,415 Accounts payable 176.4 257.7 551.6 670.4 Short-term debt 362 739 800 1,380 Current provisions — — — — Other current liabilities 176.8 229.8 302.0 367.0 Current liabilities 715 1,226 1,654 2,417 Long-term debt 3,245 2,954 6,000 5,520 Non-current provisions — — — — Other non-current liab. 55.6 72.3 181.2 220.2 Total liabilities 4,016 4,252 7,835 8,158 Shareholders' equity 2,143 2,326 12,391 13,258 Minority interests — — — — Total liabilities & equity 6,200 6,620 20,084 21,415
Per share data 12/13A 12/14E 12/15E 12/16E
Shares (wtd avg.) (mn) 4,178 4,471 31,525 31,525 EPS (Credit Suisse) (Rp) 43.5 46.9 25.1 31.3 DPS (Rp) 10.4 6.1 1.0 3.8 BVPS (Rp) 479 520 393 421 Operating CFPS (Rp) 23 126 18 43
Key ratios and valuation
12/13A 12/14E 12/15E 12/16E
Growth(%) Sales revenue 21 22 177 22 EBIT (22) 13 239 22 Net profit (31) 15 277 24 EPS (31.1) 7.9 (46.5) 24.4 Margins (%) EBITDA 42.2 39.7 41.6 41.8 EBIT 28.5 26.3 32.2 32.3 Pre-tax profit 22.3 20.0 27.2 27.8 Net profit 15.9 15.0 20.4 20.8 Valuation metrics (x) P/E 8.2 7.6 14.1 11.4 P/B 0.74 0.68 0.90 0.84 Dividend yield (%) 2.94 1.72 0.28 1.06 P/CF 15.6 2.8 19.7 8.2 EV/sales 12.9 10.5 4.5 3.6 EV/EBITDA 30.5 26.6 10.7 8.7 EV/EBIT 45.2 40.0 13.9 11.3 ROE analysis (%) ROE 9.6 9.4 10.8 7.7 ROIC 4.55 4.74 7.71 6.09 Asset turnover (x) 0.18 0.21 0.19 0.22 Interest burden (x) 0.78 0.76 0.84 0.86 Tax burden (x) 0.71 0.75 0.75 0.75 Financial leverage (x) 2.84 2.80 1.64 1.62 Credit ratios Net debt/equity (%) 162 150 50 45 Net debt/EBITDA (x) 7.33 6.42 3.79 3.05 Interest cover (x) 3.94 4.22 6.45 7.10
Source: Company data, Thomson Reuters, Credit Suisse estimates.
0
5
10
15
20
25
2010 2011 2012 2013 2014
12MF P/E multiple
0.0
0.5
1.0
1.5
2.0
2.5
3.0
3.5
4.0
4.5
2010 2011 2012 2013 2014
12MF P/B multiple
Source: IBES

02 February 2015
Eagle High Plantations
(BWPT.JK / BWPT IJ) 5
A new chapter begins Eagle High Plantations (previously known as BW Plantations) recently offered a 6-to-1
rights issue to its shareholders with Rajawali as the standby buyer. Post the rights issue
completed in December, the majority stockholding of the company has changed hands
from PT BW Investindo (BWI) to PT Rajawali Capital International (Rajawali), which now
owns a 70.97% stake. BWI's ownership has fallen from 34.86% to 4.98%.
Figure 6: Shareholding structure pre and post rights issue
Before rights issue After rights issue
Name of investor Shares Nominal value % Shares Nominal value %
Rajawali capital - - 0.00% 20,660,451,346 2,066,045,134,600 65.54%
Credit Suisse 491,382,640 49,138,264,000 10.91% 1,090,075,000 109,007,500,000 3.46%
Cayman - Fund - - 0.00% 622,900,000 62,290,000,000 1.98%
Matacuna 67,000,000 6,700,000,000 1.49% 67,000,000 6,700,000,000 0.21%
Pegasus 405,100,000 40,510,000,000 9.00% 405,100,000 40,510,000,000 1.29%
PT BW Investindo 1,570,040,800 157,004,080,000 34.86% 1,570,040,800 157,004,080,000 4.98%
Public 1,970,089,560 197,008,956,000 43.74% 7,109,723,394 710,972,339,400 22.55%
Total 4,503,613,000 450,361,300,000 100.0% 31,525,290,540 3,152,529,054,000 100.0%
Source: Company information
The proceeds of the rights issue were primarily used to acquire Green Eagle Holdings Pte.
Ltd. and its subsidiaries (together, "Green"), which acquired additional nine oil palm
plantation companies (the 'Additional Rajawali land bank') from Rajawali at Rp10.8 tn. The
remainder of the funds of Rp253 bn will be used for working capital purposes.
Transforming itself into a bigger-sized entity…
Eagle High was one of the smallest upstream palm oil producers among Indonesia-listed
plantation companies. Its palm oil output was around 9% of Astra Agro's (AALI), and
planted area was around 25% of AALI's total planted area. Post Green's acquisition, Eagle
High doubled its planted area size (from 70,355 ha to 147,289 ha, as of Dec-14).
Moreover, given Green's vast unplanted land bank reserves, Eagle High's land rights will
be 4x higher. The land bank will be located in Kalimantan, Sulawesi, Papua and
Sumatera. In addition, the combined group will have six CPO mills with a capacity of
2,040,000 tonnes FFB per year.
Figure 7: Planted nucleus area will be twice the current
size…
Figure 8: …as well as plasma
48,197 53,521 59,677 61,948 62,791
144,543
154,043 162,543
-
20,000
40,000
60,000
80,000
100,000
120,000
140,000
160,000
180,000
2010 2011 2012 2013 2014E 2015E 2016E 2017E
Pla
nted
nuc
leus
(ha)
Mature Immature Series3
3,863
6,543 6,726 7,382 7,564
13,646 14,846
16,046
-
2,000
4,000
6,000
8,000
10,000
12,000
14,000
16,000
18,000
2010 2011 2012 2013 2014E 2015E 2016E 2017E
Pla
nted
pla
sma
(ha)
Mature Immature Series3
Source: Company data, Credit Suisse estimates Source: Company data, Credit Suisse estimates
Eagle High Plantations is
now majority owned by
Rajawali Group.
Post-Green's acquisition,
Eagle High doubled its
planted area and
quadrupled its land rights
02 February 2015
Eagle High Plantations
(BWPT.JK / BWPT IJ) 6
Figure 9: Total land rights increased from 94,513 ha to 419,006 ha as of 30 June 2014
Nucleus
(ha)
Plasma
(ha)
Mature
(ha)
Immature
(ha)
Planted
(ha)
Unplanted
(ha)
Land rights (ha) FFB processing
(tons/yr)
BWPT 62,496 7,633 46,495 23,634 70,129 24,384 94,513 1,260,000
Green 66,748 4,882 43,198 28,432 71,630 123,910 195,540 780,000
Additional Rajawali 5,504 - 1,664 3,840 5,504 123,449 128,953 -
The combined group 134,748 12,515 91,357 55,906 147,263 271,743 419,006 2,040,000
Source: Company data, Jun-14
Figure 10: Land rights to large unplanted land bank support new planting and future expansion plans
Land Rights (in ha) HGU HGB Kadastral Ijin Lokasi Total Area
BWPT 47,437 80 40,997 6,000 94,513
Green 45,173 18 44,934 105,415 195,540
Additional Rajawali Land bank 6,527 0 0 122,426 128,953
The combined group 99,137 98 85,931 233,841 419,006
Source: Company data, Jun-14
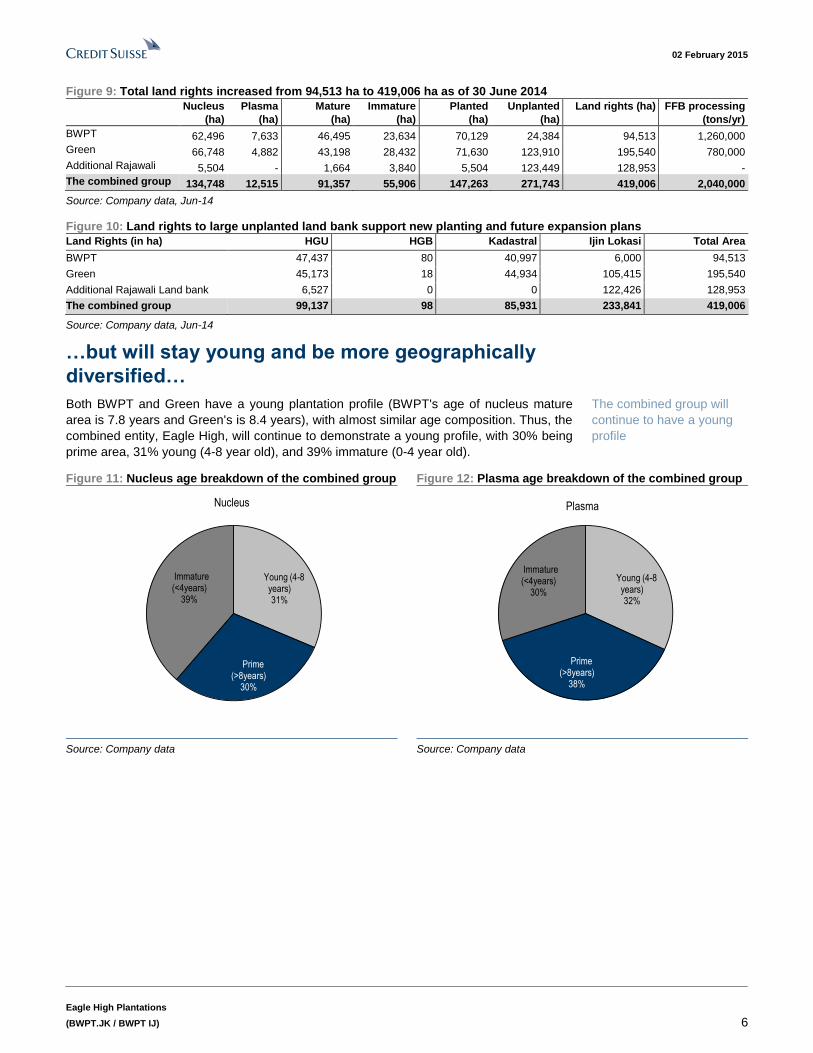
…but will stay young and be more geographically
diversified…
Both BWPT and Green have a young plantation profile (BWPT's age of nucleus mature
area is 7.8 years and Green's is 8.4 years), with almost similar age composition. Thus, the
combined entity, Eagle High, will continue to demonstrate a young profile, with 30% being
prime area, 31% young (4-8 year old), and 39% immature (0-4 year old).
Figure 11: Nucleus age breakdown of the combined group Figure 12: Plasma age breakdown of the combined group
Young (4-8 years)31%
Prime (>8years)
30%
Immature (<4years)
39%
Nucleus
Young (4-8 years)32%
Prime (>8years)
38%
Immature (<4years)
30%
Plasma
Source: Company data Source: Company data
The combined group will
continue to have a young
profile

02 February 2015
Eagle High Plantations
(BWPT.JK / BWPT IJ) 7
Figure 13: Moving away from BWPT's land rights
concentration in Kalimantan…
Figure 14: …to geographically diversified with land banks
situated across Indonesia
Central Kalimantan
53%
East Kalimantan
31%
West Kalimantan
16%
South Kalimantan
17%
East Kalimantan
18%
West Kalimantan
20%
Central Kalimantan
12%West Sumatra
2%
Jambi3%
Central Sulawesi
14%
South Sulawesi5% Papua
9%
Note: Based on 94,513 ha total land rights
Source: Company data
Note: Based on 419,006 ha total land rights
Source: Company data
Figure 15: Comparison before and after the transformation (pro forma at 30 June 2014)
Green BWPT Additional Rajawali land bank Eagle High
Nucleus area 66,748 62,496 5,504 134,748
Plasma area 4,882 7,633 - 12,515
Mature area 43,198 46,495 1,664 91,357
Immature area 28,432 23,634 3,840 55,906
Planted area 71,630 70,129 5,504 147,263
Unplanted area 123,910 24,384 123,449 271,743
Average age of nucleus mature area 8.4 7.8 6.2 7.6
Nucleus composition:
Immature <4 43% 32% 0% 39%
Young (4-8) 19% 45% 30% 31%
Prime >8 39% 23% 70% 30%
Planted area location: Kalimantan Kalimantan Kalimantan Kalimantan
Sumatera Sumatera Sumatera
Papua Papua
Unplanted area location: Kalimantan Kalimantan Kalimantan Kalimantan
Sumatera Sumatera Sumatera
Papua Sulawesi Papua
Sulawesi Jambi Sulawesi
Jambi
FFB nucleus production 318,955 375,316 694,271
FFB nucleus yield 8.3 8.8 8.4
CPO production 85,676 71,757 157,433
CPO extraction rate 23.9% 23.0% 23.5%
PK extraction rate 3.7% 3.7% 3.7%
Source: Company data

02 February 2015
Eagle High Plantations
(BWPT.JK / BWPT IJ) 8
…and be financially healthier for expansion
We analyse that post acquisition, Eagle High will have a more manageable balance sheet
with net gearing coming down to around 0.5x compared with the previous 1.5x level as of
Sep-14. The interest coverage ratio, EBIT coverage over interest expenses, should also
improve. This means the company now has better capacity to pay off interest charges.
Figure 16: Net gearing to improve on a higher asset base
Pre and post-acquisition leverage position (pro forma at 30 June 2014)
BWPT Green Eagle High
Total debt (Rp bn) 3,593 2,719 6,861
Net debt (Rp bn) 3,541 2,247 6,208
Net debt/equity (x) 1.51 0.92 0.45
Source: Company data
Figure 17: Better interest coverage ratio... Figure 18: …as well as debt-to-EBITDA ratio
3.9 4.0
6.0 6.2
7.3
-
1.0
2.0
3.0
4.0
5.0
6.0
7.0
8.0
2013 2014 2015 2016 2017
EB
IT/In
tere
st c
osts
7.5
6.7
4.2
3.5
2.5
-
1.0
2.0
3.0
4.0
5.0
6.0
7.0
8.0
2013 2014 2015 2016 2017
Deb
t/EB
ITD
A
Source: Company data, Credit Suisse estimates Source: Company data, Credit Suisse estimates
On dividend, the company policy is to pay between 10% and 30% payout. BWPT has
been paying about 15% dividend payout historically.
Overall, post Green's acquisition, Eagle High will have a twice the current planted area
size, with twice as much FFB and CPO production, and potential for more geographically
diversified locations, but maintaining a similar age, growth profile and productivity level.
Given the more flexible balance sheet, the combined group will have a faster new planting,
in our view. We are assuming up to 10,000 ha of new planting p.a.
Post acquisition, planted
area and CPO output will
double while age, growth
profile and productivity will
be similar. Net gearing
should come down to 0.5x
(from 1.5x)

02 February 2015
Eagle High Plantations
(BWPT.JK / BWPT IJ) 9
What's next? Post acquisition, we expect Eagle High to see more than twice FFB and palm oil
production output in 2015. We assume FFB yield improvement along with the maturing
plantation profile, as well as higher OER potential from Green's estates. We forecast a
19% palm oil production CAGR over 2015-17.
Figure 19: FFB production will be more than twice this
year after the acquisition…
Figure 20: …same is the case with the palm oil production
-
500,000
1,000,000
1,500,000
2,000,000
2,500,000
3,000,000
2010 2011 2012 2013 2014E 2015E 2016E 2017E
Tot
al F
FB
(ton
s)
nucleus plasma
more than double
+17%
+21%
CAGR 15-17E19%
-
100,000
200,000
300,000
400,000
500,000
600,000
700,000
2010 2011 2012 2013 2014E 2015E 2016E 2017E
CP
O p
rodu
ctio
n (t
ons)
more than double
+18%
+22%CAGR 15-17E20%
Source: Company data, Credit Suisse estimates Source: Company data, Credit Suisse estimates
Figure 21: FFB yield production should improve along
with maturing plantation
Figure 22: Green's estate has a higher OER, thus lifted the
combined group's overall OER
7.0
7.5
8.0
8.5
9.0
9.5
10.0
10.5
-
5.0
10.0
15.0
20.0
25.0
30.0
2010 2011 2012 2013 2014E 2015E 2016E 2017E
year
s
tons
/ha
FFB Yield Age Profile - Mature
23.0 22.9 23.0
23.1
22.7
23.4 23.4 23.4
22.2
22.4
22.6
22.8
23.0
23.2
23.4
23.6
2010 2011 2012 2013 2014E 2015E 2016E 2017E
OE
R (
%)
Source: Company data, Credit Suisse estimates Source: Company data, Credit Suisse estimates
How is it positioned relative to peers?
Given the relatively young maturity area of BWPT and Green, post acquisition, Eagle
High's total palm oil output will remain small compared to peers. Moreover, considering the
similar age profile of the two, post-acquisition yield (productivity) of the combined group
yield will also remain similar, although it will have a higher proportion of plantation
transforming from young to prime age in the coming years which is expected to improve
yields significantly.
Post acquisition, CPO
output will remain smaller
compared to peers;
however, the planted area
will be twice its size with up
to 10x larger unplanted
reserves than before

02 February 2015
Eagle High Plantations
(BWPT.JK / BWPT IJ) 10
Figure 23: BWPT is one of the smallest CPO output
producers
Figure 24: Post acquisition, output should be more than
double (based on 2013 statistics)
0
500
1,000
1,500
2,000
2,500
3,000
3,500Fe
lda
Sim
e D
arby
Gol
den
Agr
i
Ast
ra A
gro
Wilm
ar
Sal
im Iv
omas
KL
Kep
ong
Firs
t Res
ourc
es
Bum
itam
a
Lond
on S
umat
ra
DS
N
Gen
ting
Pla
ntat
ions
Sam
poer
na A
gro
IJM
Pla
ntat
ions
BW
PT
2013
CP
O p
rodu
ctio
n ('0
00 to
nnes
)
0
500
1,000
1,500
2,000
2,500
3,000
3,500
Feld
a
Sim
e D
arby
Gol
den
Agri
Astra
Agr
o
Wilm
ar
Salim
Ivom
as
KL K
epon
g
Firs
t Res
ourc
es
Bum
itam
a
Lond
on S
umat
ra
DSN
The
com
bine
d gr
oup
Gen
ting
Plan
tatio
ns
Sam
poer
na A
gro
IJM
Pla
ntat
ions
2013
CPO
pro
duct
ion
('000
tonn
es)
Source: Company data Source: Company data
Figure 25: BWPT is one of the youngest against peers… Figure 26: …and remains young post-acquisition
17
1413 13 13
12 12 1211
10 109
8 87
6
-
2.0
4.0
6.0
8.0
10.0
12.0
14.0
16.0
18.0
Fe
lda
Ast
ra A
gro
Sim
e D
arb
y
Gold
en A
gri
IOI
Wilm
ar
Lo
nd
on
Su
ma
tra
Sa
lim Ivo
ma
s
Sa
mp
oe
rna
Ag
ro
KL
Kepo
ng
Gentin
g P
lanta
tions
IJM
Pla
nta
tion
s
FR
BW
PT
DS
N
Bu
mita
ma
17
1413 13 13
12 12 1211
10 109
8 87
6
-
2.0
4.0
6.0
8.0
10.0
12.0
14.0
16.0
18.0
Fel
da
Ast
ra A
gro
Sim
e D
arby
Gol
den
Agr
i
IOI
Wilm
ar
Lond
on S
umat
ra
Sal
im Iv
omas
Sam
poer
na A
gro
KL
Kep
ong
Gen
ting
Pla
ntat
ions
IJM
Pla
ntat
ions FR
The
com
bine
d gr
oup
DS
N
Bum
itam
a
Source: Company data Source: Company data
Figure 27: The combined group, Eagle High, will have more young plantation going into
prime age in the coming years which should increase yields
0%
10%
20%
30%
40%
50%
60%
70%
80%
90%
100%
BWPT
Bum
itam
a
Gen
ting
Plan
tatio
ns
IJM
Pla
ntat
ions FR
Salim
Ivom
as
DSN
Sam
poer
na A
gro
The
com
bine
d gr
oup
Feld
a
KL K
epon
g
Lond
on S
umat
ra
Astra
Agr
o
IOI
Sim
e Da
rby
Gol
den
Agri
Wilm
ar
Unite
d Pl
anta
tions
Immature Young Prime Old Source: Company data

02 February 2015
Eagle High Plantations
(BWPT.JK / BWPT IJ) 11
Figure 28: BWPT's nucleus FFB yield vs peers' Figure 29: Post acquisition, yields will remain similar
-
5.0
10.0
15.0
20.0
25.0
30.0IJ
M P
lant
atio
ns IOI
DS
N
KL K
epon
g
Uni
ted
Pla
ntat
ions
Sim
e D
arby
Gen
ting
Plan
tatio
ns
Astra
Agr
o
Firs
t Res
ourc
es
Feld
a
Wilm
ar
Bum
itam
a
Lond
on S
umat
ra
Salim
Ivom
as
BWP
T
Sam
poer
na A
gro
-
5.0
10.0
15.0
20.0
25.0
30.0
IJM
Pla
ntat
ions IO
I
DS
N
KL K
epon
g
Uni
ted
Pla
ntat
ions
Sim
e D
arby
Gen
ting
Plan
tatio
ns
Astra
Agr
o
Firs
t Res
ourc
es
Feld
a
Wilm
ar
Bum
itam
a
Lond
on S
umat
ra
Salim
Ivom
as
The
com
bine
d gr
oup
Sam
poer
na A
gro
Source: Company data Source: Company data
In terms of the planted area, post acquisition, the combined group will have a double
planted area comparable to those of First Resources and Bumitama. More importantly, it
will have a significant headroom for expansion, with up to 10x larger unplanted reserves
than before. The total land rights of the combined group will also be the largest among
peers.
Figure 30: BWPT has one of the smallest planted areas
compared to other CPO producers
Figure 31: Post acquisition, Eagle has a bigger scale
compared to peers
-
100,000
200,000
300,000
400,000
500,000
600,000
Sim
e D
arby
Feld
a
Wilm
ar
Salim
Ivom
as
Astra
Agr
o
KL K
epon
g
IOI
Firs
t Res
ourc
es
Bum
itam
a
Gen
ting
Plan
tatio
ns
Lond
on S
umat
ra
Sam
poer
na A
gro
BWP
T
DS
N
IJM
Pla
ntat
ions
Uni
ted
Pla
ntat
ions
2013
nuc
lues
pla
nted
are
a (H
a)
Mature Immature
-
100,000
200,000
300,000
400,000
500,000
600,000Si
me
Dar
by
Feld
a
Wilm
ar
Salim
Ivom
as
Astra
Agr
o
KL K
epon
g
IOI
Firs
t Res
ourc
es
The
com
bine
d gr
oup
Bum
itam
a
Gen
ting
Plan
tatio
ns
Lond
on S
umat
ra
Sam
poer
na A
gro
DS
N
IJM
Pla
ntat
ions
Uni
ted
Pla
ntat
ions
2013
nuc
lues
pla
nted
are
a (H
a)
Mature Immature
Source: Company data Source: Company data

02 February 2015
Eagle High Plantations
(BWPT.JK / BWPT IJ) 12
Figure 32: Eagle High has the highest unplanted land bank reserves compared to other
planters'
-
50,000
100,000
150,000
200,000
250,000
300,000
The
com
bine
d gr
oup
DSN
Sam
poer
na A
gro
Gol
den
Agri
Gen
ting
Plan
tatio
ns
Salim
Ivom
as
Bum
itam
a
Wilm
ar IOI
Sim
e Da
rby
BWPT
KL K
epon
g
Lond
on S
umat
ra
Unite
d Pl
anta
tions
2013
Est
imat
ed u
npla
nted
rese
rves
(ha)
Source: Company data, 2013
Figure 33: Plantation companies' operational productivity comparison
Description Year FFB
(mt/Ha)
CPO
(mt/Ha)
OER
nucleus
KER
nucleus
Nucleus
area
produce
('000 ha)
Nucleus
area–non
produce
('000 ha)
Nucleus
area–non
produce to
area (%)
Total
nucleus
area ('000
ha)
Golden Agri Resources Ltd 2012 22.5 5.1 22.6% 5.3% 328.4 38.5 10.5% 366.9
2013 20.7 4.7 22.8% 5.4% 338.5 32.6 8.8% 371.1
Sime Darby Bhd (Indonesia) 2012 17.9 4.1 22.8% 4.7% 195.1 9.8 4.8% 204.8
2013 19.9 4.5 22.5% 4.7% 192.0 12.6 6.1% 204.5
PT Astra Agro Lestari Tbk 2012 23.6 5.3 22.3% 4.9% 174.8 37.8 17.8% 212.6
2013 20.0 4.5 22.3% 4.8% 186.9 33.1 15.1% 220.0
PT Salim Ivomas Pratama Tbk 2012 16.9 3.6 21.4% 5.0% 176.1 54.8 23.7% 230.9
2013 16.3 0.0 23.0% 4.7% 177.1 62.8 26.2% 239.9
First Resources Ltd 2012 22.4 5.2 23.4% 5.5% 85.9 39.9 31.7% 125.8
2013 19.6 4.5 23.2% 5.3% 104.5 44.2 29.7% 148.7
PT Dharma Satya Nusantara 2012 25.5 5.8 22.6% 3.4% 38.4 9.4 19.7% 47.8
2013 26.0 6.3 24.3% 3.1% 44.4 10.9 19.8% 55.3
Bumitama Agri 2012 18.4 4.4 23.9% 4.5% 51.5 42.9 45.4% 94.4
2013 17.5 4.1 23.3% 4.4% 63.1 47.2 42.8% 110.3
PT BW Plantation Tbk 2012 19.9 4.6 23.0% 4.0% 26.6 33.1 55.5% 59.7
2013 15.9 3.6 22.7% 3.8% 39.3 22.6 36.6% 61.9
Green Eagle Group 2012 17.1 4.2 24.5% 3.9% 32.3 25.1 43.7% 57.5
2013 16.6 4.0 23.9% 3.4% 34.6 29.4 45.9% 64.1
Cons. BWPT and Green Eagle 2012 18.4 4.4 23.8% 3.9% 58.9 58.3 49.7% 117.2
2013 16.2 3.8 23.3% 3.6% 73.9 52.1 41.3% 126.0
Overall average 2012 20.6 4.7 22.6% 4.9% 123.2 32.4 18.4% 155.6
2013 19.5 3.9 22.8% 4.8% 131.2 32.8 18.1% 164.0
Note: OER and KER calculation is based on weighted average, with each nucleus area as the denominator
Source: Company data, LMC analysis

02 February 2015
Eagle High Plantations
(BWPT.JK / BWPT IJ) 13
Maintain NEUTRAL Following the rights issue, the company's share capital has ballooned seven-fold from 4.5
mn to 31.5 mn shares. We have revised our earnings estimates to incorporate the rights
issue and Green's acquisition to the company's financials. Based on the earnings revisions
and 14.0x FY15E P/E, we arrive at our target price of Rp350. We use a 14.0x target price
multiple in line with the Indonesian plantation sector historical P/E average, and a discount
to Astra Agro (AALI) or London Sumatra (LSIP). (Note: we are assuming a CPO price
assumption of RM2,600/t for 2015 and Rp12,000/US$ exchange rate, or a CPO price of
around Rp8,400/kg).
We maintain our NEUTRAL rating on the stock. We believe that the positive synergies
from Green's acquisition will not accrue immediately and be realised over time. We would
like to watch closely new management's performance Rajawali group is one of the largest
conglomerates in Indonesia. Its previous successful investments include Excelcomindo
Pratama (XL), the first privately owned Indonesia telecom company to use GSM
technology, Rajawali Citra Televisi (RCTI), the first privately owned TV station which now
belongs to MNC group, a collaboration with government on Semen Indonesia and a
turnaround of PT Bentoel, a leading cigarette manufacturer in Indonesia. The group also
owns Express Taxi, the second largest taxi operator in Indonesia. More details on Rajawali
group are outlined in Appendix 2.
Figure 34: EV/planted ha (nucleus) comparison Figure 35: FY15E P/E comparison to peers
-
2,000
4,000
6,000
8,000
10,000
12,000
14,000
BAL FR AALI DSNG BWPT LSIP SIMP SGRO IFAR
EV
Pla
nted
/ha
(US
$)
24.8 23.9
21.0
14.3 14.1 13.1 12.7
11.8 11.7 11.4 11.0 10.6 10.4 8.4
-
5.0
10.0
15.0
20.0
25.0
30.0
IOIB
KLK
K
SIM
E
GE
NP
BW
PT
AA
LI
WLIL
SIM
P
LSIP
DS
NG
BU
MI
GA
GR
FR
LD
SG
RO
FY
15 P
/E
Source: Credit Suisse estimates Source: Credit Suisse estimates
Figure 36: Indonesian plantation sector P/E average
2.0
7.0
12.0
17.0
22.0
27.0
16-Jan-07 16-Jan-08 16-Jan-09 16-Jan-10 16-Jan-11 16-Jan-12 16-Jan-13 16-Jan-14 16-Jan-15
Indon PE Average +1 Std dev -1 Std dev
+1sd = 17.5x
-1sd = 10.8x
Avg= 14.2x
Source: Bloomberg, Credit Suise

02 February 2015
Eagle High Plantations
(BWPT.JK / BWPT IJ) 14
Figure 37: Eagle High's profit sensitivity to palm oil price changes
Year-end 31 Dec CPO at RM1,500 CPO at RM2,000 CPO at RM2,500 CPO at RM3,000 CPO at RM3,500
FY15E FY16E FY15E FY16E FY15E FY16E FY15E FY16E FY15E FY16E
Net profit (Rp bn) -112 -195 415 427 737 808 1,076 1,208 1,365 1,550
EPS (Rp) -4 -6 13 14 23 26 34 38 43 49.2
P/E (x) -101.5 -58.1 27.3 26.6 15.4 14.0 10.6 9.4 8.3 7.3
Source: Credit Suisse estimates
Figure 38: FY15E EPS enhancement should CPO price
increase by RM100/t
CPO price range of RM2,000-2,500
Figure 39: FY15E EPS enhancement should CPO price
increase by RM100/t
CPO price range of RM2,500-3,000
1%4% 5% 4%
7%9% 10% 9%
11%9%
16%14% 13%
16%
34%
62%
0%
10%
20%
30%
40%
50%
60%
70%
WIL
SIM
E
BA
L
IOI
LSIP
GG
R
GE
NP
AA
LI
KLK FR
BW
PT
DS
NG
SG
RO
IFA
R
SIM
P
FG
V
1%
3%
5%6%
6% 7% 7% 7%7% 7% 7%
9%9% 9%
12%
13%
0%
2%
4%
6%
8%
10%
12%
14%
WIL
SIM
E
BA
L
LSIP IO
I
GE
NP
AA
LI FR
KLK
GG
R
SG
RO
DS
NG
BW
PT
IFA
R
SIM
P
FG
V
Source: Credit Suisse estimates Source: Credit Suisse estimates
Figure 40: Regional plantation companies' comparative valuations Target Upside Mkt Cap ADV
Ticker Calenderised Ccy Price Rating price (%) (US$ bn) (US$ mn) 2013 2014E 2015E 2016E 2013 2014E 2015E 2016E
SIME MK Sime Darby RM 9.40 N 9.00 -4% 16.1 10.9 16.1 18.8 19.2 17.2 12.1 12.6 11.7 10.5
IOI MK IOI Corp RM 4.71 U 4.09 -13% 8.4 6.4 25.0 24.1 23.0 20.8 17.2 17.2 16.6 15.2
KLK MK KLK RM 22.66 U 20.00 -12% 6.7 2.3 25.8 24.2 22.9 19.8 17.9 16.0 15.1 13.3
FGV MK Felda RM 2.44 U 2.90 19% 2.5 2.5 9.1 22.4 14.3 17.4 14.1 7.5 7.1 7.0
GENP MK Genting Plant RM 10.16 O 12.05 19% 2.2 0.6 35.8 21.6 17.5 14.8 19.2 16.2 12.7 10.2
BPLANT MK Boustead Plant RM 1.43 N 1.46 2% 0.6 33.3 35.5 24.9 23.8 23.4 14.8 12.3 11.7
Malaysia 24.2 24.4 20.3 19.0 17.3 14.1 12.6 11.3
WIL SP Wilmar SGD 3.22 NR NA NA 15.2 12.4 11.8 14.2 12.7 10.2 13.0 14.7 14.2 12.1
GGR SP Golden Agri SGD 0.42 N 0.49 17% 4.0 12.7 12.5 16.7 10.6 9.4 10.0 10.5 8.1 7.4
FR SP First Resources SGD 1.87 O 2.40 29% 2.2 2.8 10.1 14.3 10.4 8.6 7.1 9.6 7.8 6.6
BAL SP Bumitama SGD 1.01 O 1.38 37% 1.3 0.4 19.3 13.6 11.0 7.9 14.1 9.6 7.6 5.5
IFAR SP Indofood Agri SGD 0.71 U 0.74 5% 0.8 0.6 17.5 12.2 11.0 9.7 5.7 4.7 4.5 4.2
Singapore 14.3 14.2 11.1 9.2 10.0 9.8 8.4 7.2
AALI IJ Astra Agro IDR 23,250 O 28,000 20% 2.9 3.0 20.3 14.2 13.1 11.6 10.9 10.3 9.5 8.5
LSIP IJ London Sumatra IDR 1,840 O 2,300 25% 1.0 3.3 16.3 13.6 11.8 10.8 10.0 7.3 6.4 5.9
SIMP IJ Salim Ivomas IDR 690 N 800 16% 0.9 0.5 20.8 13.7 11.7 9.9 6.1 5.1 4.7 4.3
DSNG IJ Dharma Satya Nusantara IDR 4,235 O 4,600 9% 0.7 0.3 44.2 13.6 11.4 9.7 12.6 8.4 7.4 6.5
BWPT IJ BW Plantations IDR 355 N 350 -1% 0.9 2.4 8.2 7.6 14.1 11.4 30.5 26.6 10.7 8.7
SGRO IJ Sampoerna Agro IDR 1,885 O 2,700 43% 0.3 0.1 29.9 9.4 8.4 6.7 12.1 6.4 5.6 4.6
Indonesia 23.3 12.0 11.7 10.0 13.7 10.7 7.4 6.4
Region 20.9 17.0 14.6 12.9 13.9 11.6 9.5 8.4
P/E (x) EV/EBITDA (x)
*Pricing as of 2 Feb 2015
Source: Bloomberg, Credit Suisse estimates

02 February 2015
Eagle High Plantations
(BWPT.JK / BWPT IJ) 15
Appendix 1: More about Green The acquisition of Green Plantations increased BWPT's total land rights from 94,513 ha to
419,006 ha as of 30 June 2014. Total planted area also increased from 70,129 ha to 147,263
ha, including 12,515 ha of plasma area as of June 2014. Green has oil palm plantations in
South Kalimantan, East Kalimantan, West Kalimantan and Papua with total land
concession rights of 195,540 ha.
Figure 41: 43% of Green's nucleus plantations are
immature
Figure 42: Green's plasma plantations are 82% prime,
with no immature acreage
Immature (<4years)
43%
Young (4-8years)
19%
Prime (>8years)38%
Nucleus
Young (4-8years)
18%
Prime (>8years)82%
Plasma
Source: Company data, Jun-14 Source: Company data, Jun-14
Figure 43: Nucleus planted area breakdown Figure 44: Plasma planted area breakdown
21,290 25,143 29,424
24,805 28,432
27,762
32,345
34,641 34,641
38,316
6.5
7.1
7.8 7.8
8.4
0
1
2
3
4
5
6
7
8
9
0
10,000
20,000
30,000
40,000
50,000
60,000
70,000
80,000
2011 2012 2013 1H13 1H14
Immature Area (ha) Mature Area (ha) Avg. age of mature area (year)
48 5 59 59 0
1,902
2,862
4,823 4,823 4,882
6.1
6.9
7.5 7.5
8.5
0
1
2
3
4
5
6
7
8
9
0
1,000
2,000
3,000
4,000
5,000
6,000
2011 2012 2013 1H13 1H14
Immature Area (ha) Mature Area (ha) Avg. age of mature area (year)
Source: Company data, Jun-14 Source: Company data, Jun-14
As of 30 June 2014, Green has 66,748 ha of planted nucleus area, out of which 38,316 ha
is mature. The average age of its nucleus planted area is 8.4 years, with a composition of:
38.7% prime, 18.7% young and 42.6% immature. It also has 4,882 ha of planted plasma
area, which is all mature. Included in Green's land concession rights is an unplanted land
bank area of 123,910 ha, a plentiful expandable reserve. New planting activity has been at
a rate of over 8,000 ha each year.
Green has 66,748 ha of
planted nucleus area, about
the same size with BWPT

02 February 2015
Eagle High Plantations
(BWPT.JK / BWPT IJ) 16
Green also recently acquired Additional Rajawali land bank consisting of nine oil palm
plantation companies in Sumatra, West Kalimantan and Sulawesi. This includes a total
land rights of approx.128,953 ha as of Jun-14. Total planted area amounted to 5,504 ha.
Figure 45: Location of Green's plantation assets (planted and unplanted)
Source: Company data
Figure 46: 83% of Green's planted area is in Kalimantan Figure 47: Plantation land rights status breakdown
South Kalimantan
29%
East Kalimantan
26%
West Kalimantan
28%
Sumatera2%
Papua15%
HGU16%
HGB0%
Kadastral14%
Ijin Lokasi70%
*including Additional Rajawali planted area of 5,504 ha
Source: Company data, Jun-14
*including Additional Rajawali land bank totalling to 324,493 ha
Source: Company data, Jun-14
Figure 48: Unplanted land bank of Green Figure 49: Unplanted Additional Rajawali's land bank
South Kalimantan
39%
East Kalimantan20%
West Kalimantan
19%
Papua22%
West Sumatra4%
Jambi11%
West Kalimantan18%
Central Sulawesi49%
South Sulawesi18%
Source: Company data, Jun-14 Source: Company data, Jun-14
Green recently acquired an
Additional Rajawali land
bank with planted 5,504 ha

02 February 2015
Eagle High Plantations
(BWPT.JK / BWPT IJ) 17
Green has two CPO mills, one each in South Kalimantan and East Kalimantan, with a
capacity of 130 t FFB/hour (around 780,000 t FFB/year). Compared to BWPT, which
already has four mills and has been heavily investing in infrastructure from the start,
Green's infrastructure development lags. Nonetheless, Green's third, fourth and fifth mills
(in South Kalimantan, West Kalimantan and Papua) are under construction, and are
expected to double production capacity to 1,590,000 FFB t per year by 2016. We note that
potentially higher capex is needed for Green's plantations as it needs to ramp up the
infrastructure.
Figure 50: Green has a current mill capacity of 780,000 t FFB/year
Description Start 2011 2012 2013 1H13 1H14
Capacity Utilisation Capacity Utilisation Capacity Utilisation Capacity Utilisation Capacity Utilisation
CPO mills:
South Kalimantan Apr-08 360,000 63% 420,000 94% 420,000 90% 210,000 95% 210,000 89%
East Kalimantan Feb-12 - 165,000 70% 360,000 87% 180,000 68% 180,000 95%
Total 360,000 585,000 780,000 390,000 390,000
Source: Company data
Yield and productivity is comparable to BWPT
As a result of more planted area coming into maturity and more mature area going into
prime age, Green produced 662,033 t of FFB (including 574,065 t of nucleus FFB) in
2013, or 10% higher YoY. If we calculate the productivity, Green's nucleus FFB yield
continued to increase from 9.4 t/ha in 2011 to 16.6 t/ha in 2013. This was slightly higher
than BWPT's 15.9 t/ha within the same year. We expect Green's yield to increase due to
more planted area maturing.
Green's CPO production in 2013 reached 165,826 t, higher than BWPT's 141,194 t,
explained by its slightly bigger and older planted area as well as its better oil extraction
rate. Green's CPO extraction rate in 2013 reached 23.9% compared with BWPT's 23.1%.
In terms of quality, Green produced CPO in 2013 at a 3.8% free fatty acid ("FFA") rate,
compared with BWPT's 2.9%, below the industry standard of 5.0%.
Figure 51: Nucleus FFB yield comparison with peers Figure 52: Palm oil extraction rate comparison with peers
-
5.0
10.0
15.0
20.0
25.0
30.0
IJM
Pla
ntat
ions IO
I
DS
N
KL
Kep
ong
Uni
ted
Pla
ntat
ions
Sim
e D
arby
Gen
ting
Pla
ntat
ions
Ast
ra A
gro
Firs
t Res
ourc
es
Fel
da
Wilm
ar
Bum
itam
a
Gre
en
Lond
on S
umat
ra
Sal
im Iv
omas
BW
PT
Sam
poer
na A
gro
FF
B n
ucle
us (
tonn
es/m
atur
e ha
)
-
5.0
10.0
15.0
20.0
25.0
DS
N
Gre
en
Bum
itam
a
BW
PT
Firs
t Res
ourc
es
Lond
on S
umat
ra
Gol
den
Agr
i
Uni
ted
Pla
ntat
ions
AA
LI
Sal
im Iv
omas
Sim
e D
arby
KL
Kep
ong
IJM
Pla
ntat
ions IO
I
Gen
ting
Pla
ntat
ions
Fel
da
Wilm
ar
Sam
poer
na A
gro
Source: Company data, Dec-13 Source: Company data, Dec-13
Acquisition price at a premium
Based on our calculation, the acquisition value of Green of Rp10.5 tn (US$872 mn)
translates into an EV/planted ha of US$14,147 (nucleus area only), which was a premium
to its Indonesian peers.
Green has two CPO mills
compared to BWPT's four
mills now
Green's yield is similar to
BWPT's, but its extraction
rate is slightly higher

02 February 2015
Eagle High Plantations
(BWPT.JK / BWPT IJ) 18
Figure 53: EV/ha calculation of Green acquisition
Green
Acquisition value Rp10.8 tn
Add: Net debt Rp 2.2 tn
EV (assuming Rp12,500/USD) US$1.04 bn
Planted ha (nucleus) 72,252 ha
EV/planted ha (nucleus) US$14,446/ha
Source: Company data
Figure 54: EV/planted ha comparison to peers
-
2,000
4,000
6,000
8,000
10,000
12,000
14,000
16,000
Green Bumitama Astra Agro FirstResources
DharmaSatya
LondonSumatra
SalimIvomas
SampoernaAgro
IndofoodAgri
EV
Pla
nted
/ha
(US
$)
*Prices as of the effective acquisition date 26 December 2014
Source: Credit Suisse

02 February 2015
Eagle High Plantations
(BWPT.JK / BWPT IJ) 19
Appendix 2: Rajawali Group PT Rajawali Corporation is an industrial conglomerate that operates in the
telecommunications, hotel, cement, consumer goods, retail, department store and
transportation businesses in Indonesia. The company has strategic partnerships with
Sheraton and Novotel to operate hotel chains in Indonesia; Metro (Private) Limited to
operate Metro retail stores in Jakarta and Bandung; and Verizon, AIF, and Mitsui to
engage in cellular operations in Indonesia. PT Rajawali Corporation was founded in 1984
and is based in Jakarta, Indonesia.
Some of its transactions include:
■ Its collaboration with the Government of Indonesia should significantly increase the
shareholder value of PT Semen Indonesia Tbk, Indonesia's largest cement producer.
o Value achieved by streamlining its operations after acquiring an equity interest in
July 2006.
o Over the period of acquisition of equity interest by Rajawali Group and its first
divestment in April 2010, the share price of PT Semen Indonesia Tbk increased
by more than three times.
■ Development of PT Express Transindo Utama Tbk into one of the largest taxi
operators in Indonesia by the number of taxis.
■ Business and financial turnaround of PT Bentoel International Investama Tbk into one
of the leading cigarette manufacturers in Indonesia.
■ Establishment of PT Excelmindo Pratama Tbk, the first privately owned cellular
network provider.
■ Establishment of Rajawali Citra Televisi Indonesia, the first privately owned free-to-air
television broadcaster.
■ Navigation of PT Excelmindo Pratama Tbk through the Asian financial crisis and
positioning it to become one of the top three telecom providers in Indonesia.
Figure 55: Key investment sectors of Rajawali Corp
Source: Company data

02 February 2015
Eagle High Plantations
(BWPT.JK / BWPT IJ) 20
Companies Mentioned (Price as of 02-Feb-2015)
Bentoel Internas (RMBA.JK, Rp500) Boustead Plantation (BOPL.KL, RM1.43) Bumitama Agri Limited (BUMI.SI, S$1.01) Dharma Satya Nusantara (DSNG.JK, Rp4,195) Eagle High Plantations (BWPT.JK, Rp355, NEUTRAL[V], TP Rp350) Express Trans (TAXI.JK, Rp1,005) Felda Global Ventures (FGVH.KL, RM2.44) First Resources Ltd (FRLD.SI, S$1.85) Genting Plantations Bhd (GENP.KL, RM10.16) Golden Agri-Resources (GAGR.SI, S$0.42) IOI Corporation (IOIB.KL, RM4.71) Indofood Agri Resources Ltd (IFAR.SI, S$0.72) Kuala Lumpur Kepong (KLKK.KL, RM22.66) Media Nusantara Citra (MNCN.JK, Rp2,845) PT Astra Agro Lestari Tbk (AALI.JK, Rp23,450) PT London Sumatra Indonesia (LSIP.JK, Rp1,815) Salim Ivomas Pratama (SIMP.JK, Rp685) Sampoerna Agro Tbk (SGRO.JK, Rp1,875) Semen Indonesia (SMGR.JK, Rp14,500) Sime Darby (SIME.KL, RM9.4) Wilmar International Ltd (WLIL.SI, S$3.25) XL Axiata Tbk (EXCL.JK, Rp4,620)
Disclosure Appendix
Important Global Disclosures
I, Priscilla Tjitra, certify that (1) the views expressed in this report accurately reflect my personal views about all of the subject companies and securities and (2) no part of my compensation was, is or will be directly or indirectly related to the specific recommendations or views expressed in this report.
3-Year Price and Rating History for Eagle High Plantations (BWPT.JK)
BWPT.JK Closing Price Target Price
Date (Rp) (Rp) Rating
09-Apr-12 1,438 1,538 N
10-Apr-12 1,438 *
23-Apr-12 1,372 1,538 N
30-Jul-12 1,222 1,447
02-Aug-12 1,222 1,480 O
01-Nov-12 1,197 1,405
02-Nov-12 1,205 1,405 N
22-Apr-13 840 1,189
07-May-13 773 923
12-Jul-13 615 881 O *
25-Oct-13 715 640 U
19-Dec-13 1,089 723
01-Apr-14 1,097 998
28-Apr-14 1,147 1,180 N
03-Oct-14 495 R
* Asterisk signifies initiation or assumption of coverage.
N EU T RA L
O U T PERFO RM
U N D ERPERFO RM
REST RICT ED
The analyst(s) responsible for preparing this research report received Compensation that is based upon various factors including Credit Suisse's total revenues, a portion of which are generated by Credit Suisse's investment banking activities
As of December 10, 2012 Analysts’ stock rating are defined as follows:
Outperform (O) : The stock’s total return is expected to outperform the relevant benchmark*over the next 12 months.
Neutral (N) : The stock’s total return is expected to be in line with the relevant benchmark* over the next 12 months.
Underperform (U) : The stock’s total return is expected to underperform the relevant benchmark* over the next 12 months.
*Relevant benchmark by region: As of 10th December 2012, Japanese ratings are based on a stock’s total return relative to the analyst's coverage universe which consists of all companies covered by the analyst within the relevant sector, with Outperforms representing the most attract ive, Neutrals the less attractive, and Underperforms the least attractive investment opportunities. As of 2nd October 2012, U.S. and Canadian as well as European ra tings are based on a stock’s total return relative to the analyst's coverage universe which consists of all companies covered by the analyst within the relevant sector, with Outperforms representing the most attractive, Neutrals the less attractive, and Underperforms the least attractive investment opportunities. For Latin Ame rican and non-Japan Asia stocks, ratings are based on a stock’s total return relative to the average total return of the relevant country or regional benchmark; prior to 2nd October 2012 U.S. and Canadian

02 February 2015
Eagle High Plantations
(BWPT.JK / BWPT IJ) 21
ratings were based on (1) a stock’s absolute total return potential to its current share price and (2) the relative attractiveness of a stock’s total return potential within an analyst’s coverage universe. For Australian and New Zealand stocks, 12 -month rolling yield is incorporated in the absolute total return calculation and a 15% and a 7.5% threshold replace the 10-15% level in the Outperform and Underperform stock rating definitions, respectively. The 15% and 7.5% thresholds replace the +10-15% and -10-15% levels in the Neutral stock rating definition, respectively. Prior to 10th December 2012, Japanese ratings were based on a stock’s total return relative to the average total return of the relevant country or regional benchmark.
Restricted (R) : In certain circumstances, Credit Suisse policy and/or applicable law and regulations preclude certain types of communications, including an investment recommendation, during the course of Credit Suisse's engagement in an investment banking transaction and in certain other circumstances.
Volatility Indicator [V] : A stock is defined as volatile if the stock price has moved up or down by 20% or more in a month in at least 8 of the past 24 months or the analyst expects significant volatility going forward.
Analysts’ sector weightings are distinct from analysts’ stock ratings and are based on the analyst’s expectations for the fundamentals and/or valuation of the sector* relative to the group’s historic fundamentals and/or valuation:
Overweight : The analyst’s expectation for the sector’s fundamentals and/or valuation is favorable over the next 12 months.
Market Weight : The analyst’s expectation for the sector’s fundamentals and/or valuation is neutral over the next 12 months.
Underweight : The analyst’s expectation for the sector’s fundamentals and/or valuation is cautious over the next 12 months.
*An analyst’s coverage sector consists of all companies covered by the analyst within the relevant sector. An analyst may cover multiple sectors.
Credit Suisse's distribution of stock ratings (and banking clients) is:
Global Ratings Distribution
Rating Versus universe (%) Of which banking clients (%)
Outperform/Buy* $disclosure.disclosureModel.stockRatingDistribution.outperformDist% ($disclosure.disclosureModel.stockRatingDistribution.outperformBanking% banking clients)
Neutral/Hold* $disclosure.disclosureModel.stockRatingDistribution.neutralDist% ($disclosure.disclosureModel.stockRatingDistribution.neutralDistBanking% banking clients)
Underperform/Sell* $disclosure.disclosureModel.stockRatingDistribution.underperformDist% ($disclosure.disclosureModel.stockRatingDistribution.underperformDistBanking% banking clients)
Restricted $disclosure.disclosureModel.stockRatingDistribution.restrictedDist%
*For purposes of the NYSE and NASD ratings distribution disclosure requirements, our stock ratings of Outperform, Neutral, and Underperform most closely correspond to Buy, Hold, and Sell, respectively; however, the meanings are not the same, as our stock ratings are determined on a relative basis. (Please refer to definitions above.) An investor's decision to buy or sell a security should be based on investment objectives, current holdings, and other individual factors.
Credit Suisse’s policy is to update research reports as it deems appropriate, based on developments with the subject company, the sector or the market that may have a material impact on the research views or opinions stated herein.
Credit Suisse's policy is only to publish investment research that is impartial, independent, clear, fair and not misleading. For more detail please refer to Credit Suisse's Policies for Managing Conflicts of Interest in connection with Investment Research: http://www.csfb.com/research-and-analytics/disclaimer/managing_conflicts_disclaimer.html
Credit Suisse does not provide any tax advice. Any statement herein regarding any US federal tax is not intended or written to be used, and cannot be used, by any taxpayer for the purposes of avoiding any penalties.
Price Target: (12 months) for Eagle High Plantations (BWPT.JK)
Method: Our target price of Rp350 for PT BW Plantation (BWPT.JK) is based on 14x 2015E P/E (price/earnings) or at discount to 15E P/E implied by our target price for AALI. The lower 15E P/E implied by our target price for BWPT is due to BWPT's smaller plantation size, concentrated area, and higher net gearing ratio.
Risk: The following risks could impede achievement of our Rp350 target price for BWPT: 1) the company's realised selling prices for CPO are materially different from our estimates; 2) the company's cash flow could be adversely affected by production costs, particularly if FFB purchase prices, fuel and consumable materials costs increase at a significantly different rate than we forecast because of movements in input commodity prices; 3) major changes in government policy and regulation, including taxation, concession terms etc., which could significantly impact the company's cash flow; 4) any significant fluctuation of the Indonesian rupiah against the US dollar and Malaysian ringgit against the US dollar could have a material impact on revenues and earnings; and 5) a continued surge in CPO prices may also spark further government intervention, creating regulatory uncertainties as the government seeks to curb inflation driven by higher cooking oil prices.
Please refer to the firm's disclosure website at https://rave.credit-suisse.com/disclosures for the definitions of abbreviations typically used in the target price method and risk sections.
See the Companies Mentioned section for full company names

02 February 2015
Eagle High Plantations
(BWPT.JK / BWPT IJ) 22
The subject company (BWPT.JK, AALI.JK, LSIP.JK, IFAR.SI, SGRO.JK, SIMP.JK, GAGR.SI, GENP.KL, BOPL.KL, MNCN.JK, SMGR.JK, EXCL.JK) currently is, or was during the 12-month period preceding the date of distribution of this report, a client of Credit Suisse.
Credit Suisse provided investment banking services to the subject company (BWPT.JK, LSIP.JK, IFAR.SI, SIMP.JK, GAGR.SI, BOPL.KL, SMGR.JK) within the past 12 months.
Credit Suisse has managed or co-managed a public offering of securities for the subject company (BWPT.JK, BOPL.KL, SMGR.JK) within the past 12 months.
Credit Suisse has received investment banking related compensation from the subject company (BWPT.JK, LSIP.JK, IFAR.SI, SIMP.JK, GAGR.SI, BOPL.KL, SMGR.JK) within the past 12 months
Credit Suisse expects to receive or intends to seek investment banking related compensation from the subject company (BWPT.JK, AALI.JK, LSIP.JK, FRLD.SI, BUMI.SI, IFAR.SI, SGRO.JK, SIMP.JK, FGVH.KL, GAGR.SI, IOIB.KL, KLKK.KL, GENP.KL, BOPL.KL, MNCN.JK, SMGR.JK, EXCL.JK) within the next 3 months.
Credit Suisse may have interest in (BWPT.JK, AALI.JK, LSIP.JK, DSNG.JK, FRLD.SI, BUMI.SI, IFAR.SI, SGRO.JK, SIMP.JK, MNCN.JK, SMGR.JK, EXCL.JK)
Credit Suisse may have interest in (FGVH.KL, SIME.KL, IOIB.KL, KLKK.KL, GENP.KL, BOPL.KL)
As of the end of the preceding month, Credit Suisse beneficially own 1% or more of a class of common equity securities of (BWPT.JK).
Credit Suisse has a material conflict of interest with the subject company (WLIL.SI) . Credit Suisse is acting as financial advisor to Goodman Fielder in relation to the receipt of the announced proposal from Wilmar International Limited and First Pacific Company Limited.
For other important disclosures concerning companies featured in this report, including price charts, please visit the website at https://rave.credit-suisse.com/disclosures or call +1 (877) 291-2683.
Important Regional Disclosures
Singapore recipients should contact Credit Suisse AG, Singapore Branch for any matters arising from this research report.
The analyst(s) involved in the preparation of this report have not visited the material operations of the subject company (BWPT.JK, AALI.JK, LSIP.JK, DSNG.JK, FRLD.SI, BUMI.SI, IFAR.SI, SGRO.JK, SIMP.JK, FGVH.KL, WLIL.SI, GAGR.SI, SIME.KL, IOIB.KL, KLKK.KL, GENP.KL, BOPL.KL, MNCN.JK, SMGR.JK, EXCL.JK) within the past 12 months
Restrictions on certain Canadian securities are indicated by the following abbreviations: NVS--Non-Voting shares; RVS--Restricted Voting Shares; SVS--Subordinate Voting Shares.
Individuals receiving this report from a Canadian investment dealer that is not affiliated with Credit Suisse should be advised that this report may not contain regulatory disclosures the non-affiliated Canadian investment dealer would be required to make if this were its own report.
For Credit Suisse Securities (Canada), Inc.'s policies and procedures regarding the dissemination of equity research, please visit http://www.csfb.com/legal_terms/canada_research_policy.shtml.
Credit Suisse has acted as lead manager or syndicate member in a public offering of securities for the subject company (BWPT.JK, DSNG.JK, GAGR.SI, BOPL.KL, SMGR.JK) within the past 3 years.
As of the date of this report, Credit Suisse acts as a market maker or liquidity provider in the equities securities that are the subject of this report.
Principal is not guaranteed in the case of equities because equity prices are variable.
Commission is the commission rate or the amount agreed with a customer when setting up an account or at any time after that.
To the extent this is a report authored in whole or in part by a non-U.S. analyst and is made available in the U.S., the following are important disclosures regarding any non-U.S. analyst contributors: The non-U.S. research analysts listed below (if any) are not registered/qualified as research analysts with FINRA. The non-U.S. research analysts listed below may not be associated persons of CSSU and therefore may not be subject to the NASD Rule 2711 and NYSE Rule 472 restrictions on communications with a subject company, public appearances and trading securities held by a research analyst account.
PT Credit Suisse Securities Indonesia ................................................................................................................................................. Priscilla Tjitra
For Credit Suisse disclosure information on other companies mentioned in this report, please visit the website at https://rave.credit-suisse.com/disclosures or call +1 (877) 291-2683.

02 February 2015
Eagle High Plantations
(BWPT.JK / BWPT IJ) 23
References in this report to Credit Suisse include all of the subsidiaries and affiliates of Credit Suisse operating under its investment banking division. For more information on our structure, please use the following link: https://www.credit-suisse.com/who_we_are/en/This report may contain material that is not directed to, or intended for distribution to or use by, any person or entity who is a citizen or resident of or located in any locality, state, country or other jurisdiction where such distribution, publication, availability or use would be contrary to law or regulation or which would subject Credit Suisse AG or its affiliates ("CS") to any registration or licensing requirement within such jurisdiction. All material presented in this report, unless specifically indicated otherwise, is under copyright to CS. None of the material, nor its content, nor any copy of it, may be altered in any way, transmitted to, copied or distributed to any other party, without the prior express written permission of CS. All trademarks, service marks and logos used in this report are trademarks or service marks or registered trademarks or service marks of CS or its affiliates. The information, tools and material presented in this report are provided to you for information purposes only and are not to be used or considered as an offer or the solicitation of an offer to sell or to buy or subscribe for securities or other financial instruments. CS may not have taken any steps to ensure that the securities referred to in this report are suitable for any particular investor. CS will not treat recipients of this report as its customers by virtue of their receiving this report. The investments and services contained or referred to in this report may not be suitable for you and it is recommended that you consult an independent investment advisor if you are in doubt about such investments or investment services. Nothing in this report constitutes investment, legal, accounting or tax advice, or a representation that any investment or strategy is suitable or appropriate to your individual circumstances, or otherwise constitutes a personal recommendation to you. CS does not advise on the tax consequences of investments and you are advised to contact an independent tax adviser. Please note in particular that the bases and levels of taxation may change. Information and opinions presented in this report have been obtained or derived from sources believed by CS to be reliable, but CS makes no representation as to their accuracy or completeness. CS accepts no liability for loss arising from the use of the material presented in this report, except that this exclusion of liability does not apply to the extent that such liability arises under specific statutes or regulations applicable to CS. This report is not to be relied upon in substitution for the exercise of independent judgment. CS may have issued, and may in the future issue, other communications that are inconsistent with, and reach different conclusions from, the information presented in this report. Those communications reflect the different assumptions, views and analytical methods of the analysts who prepared them and CS is under no obligation to ensure that such other communications are brought to the attention of any recipient of this report. Some investments referred to in this report will be offered solely by a single entity and in the case of some investments solely by CS, or an associate of CS or CS may be the only market maker in such investments. Past performance should not be taken as an indication or guarantee of future performance, and no representation or warranty, express or implied, is made regarding future performance. Information, opinions and estimates contained in this report reflect a judgment at its original date of publication by CS and are subject to change without notice. The price, value of and income from any of the securities or financial instruments mentioned in this report can fall as well as rise. The value of securities and financial instruments is subject to exchange rate fluctuation that may have a positive or adverse effect on the price or income of such securities or financial instruments. Investors in securities such as ADR's, the values of which are influenced by currency volatility, effectively assume this risk. Structured securities are complex instruments, typically involve a high degree of risk and are intended for sale only to sophisticated investors who are capable of understanding and assuming the risks involved. The market value of any structured security may be affected by changes in economic, financial and political factors (including, but not limited to, spot and forward interest and exchange rates), time to maturity, market conditions and volatility, and the credit quality of any issuer or reference issuer. Any investor interested in purchasing a structured product should conduct their own investigation and analysis of the product and consult with their own professional advisers as to the risks involved in making such a purchase. Some investments discussed in this report may have a high level of volatility. High volatility investments may experience sudden and large falls in their value causing losses when that investment is realised. Those losses may equal your original investment. Indeed, in the case of some investments the potential losses may exceed the amount of initial investment and, in such circumstances, you may be required to pay more money to support those losses. Income yields from investments may fluctuate and, in consequence, initial capital paid to make the investment may be used as part of that income yield. Some investments may not be readily realisable and it may be difficult to sell or realise those investments, similarly it may prove difficult for you to obtain reliable information about the value, or risks, to which such an investment is exposed. This report may provide the addresses of, or contain hyperlinks to, websites. Except to the extent to which the report refers to website material of CS, CS has not reviewed any such site and takes no responsibility for the content contained therein. Such address or hyperlink (including addresses or hyperlinks to CS's own website material) is provided solely for your convenience and information and the content of any such website does not in any way form part of this document. Accessing such website or following such link through this report or CS's website shall be at your own risk. This report is issued and distributed in Europe (except Switzerland) by Credit Suisse Securities (Europe) Limited, One Cabot Square, London E14 4QJ, England, which is authorised by the Prudential Regulation Authority and regulated by the Financial Conduct Authority and the Prudential Regulation Authority. This report is being distributed in Germany by Credit Suisse Securities (Europe) Limited Niederlassung Frankfurt am Main regulated by the Bundesanstalt fuer Finanzdienstleistungsaufsicht ("BaFin"). This report is being distributed in the United States and Canada by Credit Suisse Securities (USA) LLC; in Switzerland by Credit Suisse AG; in Brazil by Banco de Investimentos Credit Suisse (Brasil) S.A or its affiliates; in Mexico by Banco Credit Suisse (México), S.A. (transactions related to the securities mentioned in this report will only be effected in compliance with applicable regulation); in Japan by Credit Suisse Securities (Japan) Limited, Financial Instruments Firm, Director-General of Kanto Local Finance Bureau (Kinsho) No. 66, a member of Japan Securities Dealers Association, The Financial Futures Association of Japan, Japan Investment Advisers Association, Type II Financial Instruments Firms Association; elsewhere in Asia/ Pacific by whichever of the following is the appropriately authorised entity in the relevant jurisdiction: Credit Suisse (Hong Kong) Limited, Credit Suisse Equities (Australia) Limited, Credit Suisse Securities (Thailand) Limited, regulated by the Office of the Securities and Exchange Commission, Thailand, having registered address at 990 Abdulrahim Place, 27th Floor, Unit 2701, Rama IV Road, Silom, Bangrak, Bangkok 10500, Thailand, Tel. +66 2614 6000, Credit Suisse Securities (Malaysia) Sdn Bhd, Credit Suisse AG, Singapore Branch, Credit Suisse Securities (India) Private Limited (CIN no. U67120MH1996PTC104392) regulated by the Securities and Exchange Board of India (registration Nos. INB230970637; INF230970637; INB010970631; INF010970631), having registered address at 9th Floor, Ceejay House, Dr.A.B. Road, Worli, Mumbai - 18, India, T- +91-22 6777 3777, Credit Suisse Securities (Europe) Limited, Seoul Branch, Credit Suisse AG, Taipei Securities Branch, PT Credit Suisse Securities Indonesia, Credit Suisse Securities (Philippines ) Inc., and elsewhere in the world by the relevant authorised affiliate of the above. Research on Taiwanese securities produced by Credit Suisse AG, Taipei Securities Branch has been prepared by a registered Senior Business Person. Research provided to residents of Malaysia is authorised by the Head of Research for Credit Suisse Securities (Malaysia) Sdn Bhd, to whom they should direct any queries on +603 2723 2020. This report has been prepared and issued for distribution in Singapore to institutional investors, accredited investors and expert investors (each as defined under the Financial Advisers Regulations) only, and is also distributed by Credit Suisse AG, Singapore branch to overseas investors (as defined under the Financial Advisers Regulations). By virtue of your status as an institutional investor, accredited investor, expert investor or overseas investor, Credit Suisse AG, Singapore branch is exempted from complying with certain compliance requirements under the Financial Advisers Act, Chapter 110 of Singapore (the "FAA"), the Financial Advisers Regulations and the relevant Notices and Guidelines issued thereunder, in respect of any financial advisory service which Credit Suisse AG, Singapore branch may provide to you. This information is being distributed by Credit Suisse AG, Dubai Branch, duly licensed and regulated by the Dubai Financial Services Authority (DFSA), and is directed at Professional Clients or Market Counterparties only, as defined by the DFSA. The financial products or financial services to which the information relates will only be made available to a client who meets the regulatory criteria to be a Professional Client or Market Counterparty only, as defined by the DFSA, and is not intended for any other person. This research may not conform to Canadian disclosure requirements. In jurisdictions where CS is not already registered or licensed to trade in securities, transactions will only be effected in accordance with applicable securities legislation, which will vary from jurisdiction to jurisdiction and may require that the trade be made in accordance with applicable exemptions from registration or licensing requirements. Non-U.S. customers wishing to effect a transaction should contact a CS entity in their local jurisdiction unless governing law permits otherwise. U.S. customers wishing to effect a transaction should do so only by contacting a representative at Credit Suisse Securities (USA) LLC in the U.S. Please note that this research was originally prepared and issued by CS for distribution to their market professional and institutional investor customers. Recipients who are not market professional or institutional investor customers of CS should seek the advice of their independent financial advisor prior to taking any investment decision based on this report or for any necessary explanation of its contents. This research may relate to investments or services of a person outside of the UK or to other matters which are not authorised by the Prudential Regulation Authority and regulated by the Financial Conduct Authority and the Prudential Regulation Authority or in respect of which the protections of the Prudential Regulation Authority and Financial Conduct Authority for private customers and/or the UK compensation scheme may not be available, and further details as to where this may be the case are available upon request in respect of this report. CS may provide various services to US municipal entities or obligated persons ("municipalities"), including suggesting individual transactions or trades and entering into such transactions. Any services CS provides to municipalities are not viewed as "advice" within the meaning of Section 975 of the Dodd-Frank Wall Street Reform and Consumer Protection Act. CS is providing any such services and related information solely on an arm's length basis and not as an advisor or fiduciary to the municipality. In connection with the provision of the any such services, there is no agreement, direct or indirect, between any municipality (including the officials, management, employees or agents thereof) and CS for CS to provide advice to the municipality. Municipalities should consult with their financial, accounting and legal advisors regarding any such services provided by CS. In addition, CS is not acting for direct or indirect compensation to solicit the municipality on behalf of an unaffiliated broker, dealer, municipal securities dealer, municipal advisor, or investment adviser for the purpose of obtaining or retaining an engagement by the municipality for or in connection with Municipal Financial Products, the issuance of municipal securities, or of an investment adviser to provide investment advisory services to or on behalf of the municipality. If this report is being distributed by a financial institution other than Credit Suisse AG, or its affiliates, that financial institution is solely responsible for distribution. Clients of that institution should contact that institution to effect a transaction in the securities mentioned in this report or require further information. This report does not constitute investment advice by Credit Suisse to the clients of the distributing financial institution, and neither Credit Suisse AG, its affiliates, and their respective officers, directors and employees accept any liability whatsoever for any direct or consequential loss arising from their use of this report or its content. Principal is not guaranteed. Commission is the commission rate or the amount agreed with a customer when setting up an account or at any time after that.
Copyright © 2015 CREDIT SUISSE AG and/or its affiliates. All rights reserved.
Investment principal on bonds can be eroded depending on sale price or market price. In addition, there are bonds on which investment principal can be eroded due to changes in redemption amounts. Care is required when investing in such instruments. When you purchase non-listed Japanese fixed income securities (Japanese government bonds, Japanese municipal bonds, Japanese government guaranteed bonds, Japanese corporate bonds) from CS as a seller, you will be requested to pay the purchase price only.
AG0155.doc