eagle project groundwater discharge permit application · 2.2.11 management of non ... report for...
TRANSCRIPT

Application
Eagle Project Groundwater Discharge Permit Application Project I.D.: 04W018
Kennecott Eagle Minerals Company Marquette, Michigan
February 2006
Printed on Recycled Paper


LJS\J:\scopes\04w018\10000\FVD reports\Final GWP\r-gw discharge permit app.doc\10000
Distribution List
No. of Copies Sent To
4 Mr. James R. Janiczek Michigan Department of Environmental Quality Chief-Groundwater Permits Unit Constitution Hall 525 West Allegan Street Lansing, MI 48909
1 Ms. Kristen Mariuzza Michigan Department of Environmental Quality 420 5th Street Gwinn, MI 49841
1 Mr. David R. Porter, P.E. Michigan Department of Environmental Quality Cadillac District Office 120 West Chapin Street Cadillac, MI 49601
1 Mr. Hal Fitch Michigan Department of Environmental Quality 525 West Allegan St Lansing, MI 48909
1 Mr. Joe Maki District Geologist Michigan Department of Environmental Quality 420 5th St Gwinn, MI 49841
2 Mr. Gene Smary Warner Norcross & Judd LLP 900 Fifth Third Center, 111 Lyon St, N.W. Grand Rapids, MI 49503-2489

LJS\J:\scopes\04w018\10000\FVD reports\Final GWP\r-gw discharge permit app.doc ii
Eagle Project Kennecott Eagle Minerals Company
Groundwater Discharge Permit Application
Contents Page 1 Introduction .............................................................................................................................1
1.1 Background....................................................................................................................1 1.2 Schedule.........................................................................................................................1 1.3 Project Contacts .............................................................................................................2 1.4 Project Checklist ............................................................................................................2
2 General Project Description ....................................................................................................3 2.1 Project Location .............................................................................................................3
2.1.1 Land Ownership.................................................................................................3 2.2 Proposed Surface Facilities............................................................................................3
2.2.1 Mine Dry/Office and Warehouse.......................................................................3 2.2.2 Truck Wash & Scales.........................................................................................3 2.2.3 Assay Lab and Cold Storage..............................................................................4 2.2.4 Fuel Storage .......................................................................................................4 2.2.5 Site Access, Parking and Roads.........................................................................4 2.2.6 Ore Storage and Crushing..................................................................................4 2.2.7 Ore Transportation .............................................................................................5 2.2.8 Temporary Development Rock Storage Area....................................................5 2.2.9 Soil Stockpiles ...................................................................................................5 2.2.10 Contact Water Basins.........................................................................................6 2.2.11 Management of Non-Contact Water..................................................................6 2.2.12 Wastewater Treatment Plant ..............................................................................6 2.2.13 Treated Water Infiltration System .....................................................................6 2.2.14 Backfill Surface Facility ....................................................................................6 2.2.15 Site Utilities .......................................................................................................7
2.2.15.1 Electric Power ....................................................................................7 2.2.15.2 Communications.................................................................................7
2.2.16 Site Security Measures.......................................................................................7 2.2.17 Potable and Sanitary Water................................................................................7
2.3 Proposed Underground Facilities...................................................................................7 2.3.1 Mine Description ...............................................................................................7 2.3.2 Mine Ventilation System ...................................................................................9
2.4 Reclamation ...................................................................................................................9 2.5 Mine Schedule ...............................................................................................................9
3 Summary of Hydrogeologic Conditions................................................................................10 3.1 Land Use ......................................................................................................................10
3.1.1 Designated Well-Head Protection Areas and Surrounding Features...............10 3.2 Site Investigation and Key Findings ............................................................................10
3.2.1 Hydrostratigraphic Units..................................................................................11

Contents (continued) Page
J:\scopes\04w018\10000\FVD reports\Final GWP\r-gw discharge permit app.doc iii
3.2.2 Test Pits and Infiltrometer Tests ......................................................................11 3.2.3 Groundwater Flow and Aquifer Hydraulic Characteristics .............................12 3.2.4 Background Groundwater Quality...................................................................12 3.2.5 Acceptability of the Site for Discharge............................................................12
4 Description of Mine Water Sources and Characteristics.......................................................15 4.1 Operational Water Sources and Characteristics...........................................................15
4.1.1 Mine Drainage .................................................................................................15 4.1.2 Water from Temporary Development Rock Storage Area ..............................17 4.1.3 Runoff from Other Areas of the Mine Site ......................................................19 4.1.4 Potable Water Supply and Sanitary Wastewater .............................................19
4.2 Water Balance..............................................................................................................20 5 Wastewater Management Alternatives Evaluation ...............................................................22
5.1 General Alternatives ....................................................................................................22 5.1.1 Minimizing the Volume of Wastewater...........................................................22 5.1.2 Recycling Wastewater .....................................................................................23 5.1.3 Connection to a Municipal Treatment System.................................................23 5.1.4 Discharging to Surface Water..........................................................................23
5.2 Treatment Processes Considered .................................................................................23 5.2.1 Flocculation......................................................................................................23 5.2.2 Settling .............................................................................................................24 5.2.3 Oxidation..........................................................................................................24 5.2.4 Filtration...........................................................................................................24 5.2.5 Ion Exchange ...................................................................................................25 5.2.6 Reverse Osmosis..............................................................................................25 5.2.7 Electrolytic Recovery.......................................................................................25 5.2.8 Analysis of Secondary Processes.....................................................................26
6 Basis of Design for Proposed Wastewater Treatment System ..............................................27 6.1 Treatment Method Overview.......................................................................................27 6.2 Discharge Standards.....................................................................................................28 6.3 Design Flows and Pollutant Loading...........................................................................31 6.4 Schematic Flow Diagram.............................................................................................31 6.5 Description of Treatment Units ...................................................................................31
6.5.1 Wastewater Storage .........................................................................................31 6.5.2 Main Wastewater Treatment Process...............................................................31
6.5.2.1 Metals Precipitation/Sedimentation .................................................32 6.5.2.2 pH Adjustment .................................................................................33 6.5.2.3 Gravity Filters ..................................................................................33 6.5.2.4 First Pass Reverse Osmosis System.................................................35 6.5.2.5 Second Pass Reverse Osmosis System.............................................36 6.5.2.6 Final Effluent pH Adjustment ..........................................................37 6.5.2.7 Final Effluent Storage ......................................................................37 6.5.2.8 Effluent Pumping .............................................................................37 6.5.2.9 Treated Water Infiltration System....................................................37 6.5.2.10 Treated Wastewater Reuse ...............................................................37
6.5.3 Concentrate Reduction Process........................................................................37 6.5.3.1 Breakpoint Chlorination...................................................................38

Contents (continued) Page
J:\scopes\04w018\10000\FVD reports\Final GWP\r-gw discharge permit app.doc iv
6.5.3.2 Softening/Metals Precipitation.........................................................39 6.5.3.3 Microfiltration ..................................................................................39 6.5.3.4 pH Adjustment .................................................................................40 6.5.3.5 Weak Acid Ion Exchange System....................................................40 6.5.3.6 pH Adjustment .................................................................................41 6.5.3.7 CRP Reverse Osmosis......................................................................41 6.5.3.8 Boron Ion Exchange.........................................................................42
6.5.4 Sludge Handling Process .................................................................................42 6.5.5 Evaporator/Crystallizer Process.......................................................................43
6.6 Description of Sludge Management.............................................................................43 6.7 Instrumentation and Controls.......................................................................................44 6.8 Adverse Weather Strategies.........................................................................................44 6.9 Quality Control ............................................................................................................44 6.10 Operation and Maintenance .........................................................................................45 6.11 Contingencies...............................................................................................................46
7 Land Application of Treated Wastewater..............................................................................47 7.1 Discharge Method - Rapid Infiltration.........................................................................47 7.2 Basis of Design ............................................................................................................47
7.2.1 Surface Runoff Prevention Methods................................................................47 7.2.2 Hydraulic Design .............................................................................................47 7.2.3 Engineering Plans ............................................................................................47
7.3 Discharge Management Plan .......................................................................................47 8 Contact Water Basins ............................................................................................................48
8.1 Basis of Design ............................................................................................................48 8.1.1 Design Capacity ...............................................................................................48 8.1.2 Liner System ....................................................................................................48
8.2 Site Development.........................................................................................................49 8.2.1 Subgrade Excavation .......................................................................................49 8.2.2 Liner System Construction ..............................................................................49 8.2.3 Quality Assurance Reporting...........................................................................50
8.2.3.1 Subgrade Surface..............................................................................51 8.2.3.2 GCL..................................................................................................51 8.2.3.3 Geomembrane Liner.........................................................................52 8.2.3.4 Geotextile Protection Layer .............................................................53 8.2.3.5 Sand Protection Layer ......................................................................53
8.2.4 Certification Report .........................................................................................53 8.3 Basin Pumping Systems...............................................................................................54
9 Proposed Discharge and Groundwater Monitoring During Operations ................................55 9.1 Effluent Monitoring .....................................................................................................55 9.2 Groundwater Monitoring .............................................................................................56
9.2.1 Monitoring Wells .............................................................................................56 9.2.1.1 Infiltration Performance Monitoring................................................56 9.2.1.2 Background Monitoring Wells.........................................................56 9.2.1.3 Compliance Monitoring Wells .........................................................56 9.2.1.4 Monitoring of Surface Water Quality ..............................................57
9.2.2 Sampling Frequency ........................................................................................57

Contents (continued) Page
J:\scopes\04w018\10000\FVD reports\Final GWP\r-gw discharge permit app.doc v
9.2.3 Parameters........................................................................................................57 9.2.4 Sampling Procedures. ......................................................................................57 9.2.5 Data Analysis and Presentation .......................................................................57
10 Compliance with Antidegradation.........................................................................................60 10.1 Economic Benefits .......................................................................................................60
10.1.1 Estimated Employment....................................................................................60 10.1.2 Economic Improvements .................................................................................61 10.1.3 Improvements to Present Road and Rail Systems ...........................................62 10.1.4 Social Benefits .................................................................................................62
10.2 Lake Superior Basin - Bioaccumulative Substances of Immediate Concern ..............63 10.3 Technical Evaluation of Best Technology in Process and Treatment .........................63
10.3.1 Wastewater Treatment Processes for Mercury Reduction...............................63 10.4 Compliance with Mercury Standards...........................................................................64
11 References .............................................................................................................................66
Tables Table 3-1 Background Groundwater Quality and Proposed Groundwater Quality Standards................................................................................................................13 Table 4-1 Mine Drainage Water Characteristics....................................................................16 Table 4-2 Contact Water Characteristics................................................................................18 Table 6-1 Wastewater Flows and Pollutant Concentrations ..................................................29 Table 6-2 Design Criteria for Major Wastewater Treatment System Processes....................34 Table 8-1 Contact Water Basin Design Criteria.....................................................................48 Table 8-2 QA Inspector Tests ................................................................................................51 Table 9-1 Proposed Compliance Monitoring Parameter List and Sampling Frequency........58 Table 10-1 Project Employment...............................................................................................61
Figures (Note: All figures are located after Section 11, page 66)
Figure 2-1 Project Location Figure 2-2 Project Area – Aerial Photographic Map Figure 2-3 Existing Site Conditions Figure 2-4 Project Mineral Rights Figure 2-5 Project Surface Ownership Figure 2-6 Surface Facility Plan Figure 2-7 Underground Material Handling Schematic Figure 2-8 Overall Project Timeline Figure 3-1 Michigamme Township Zoning Map Figure 3-2 Project Facility on Aerial Photograph Figure 4-1 Water Balance - Maximum Annual Precipitation and Mine Inflow Figure 4-2 Water Balance – Average Annual Precipitation and Expected Case Mine Inflow Figure 6-1 Process Flow Diagram - Main Wastewater Treatment Process Figure 6-2 Process Flow Diagram - Concentrate Reduction Process

Contents (continued)
J:\scopes\04w018\10000\FVD reports\Final GWP\r-gw discharge permit app.doc vi
Figure 6-3 Process Flow Diagram - Sludge Handling and Evaporation/Crystallization Process Figure 7-1 Treated Water Infiltration System - Layout and Details Figure 7-2 Treated Water Infiltration System - Design and Details Figure 8-1 Contact Water Basin - Typical Section and Details Figure 9-1 Mercury Monitoring Program
Appendices Appendix A Groundwater Discharge Permit Application Form Appendix B Hydrogeologic Report for the Eagle Project Groundwater Discharge Permit
Application Appendix C Water Well Records Appendix D Background Groundwater Quality Calculations Appendix E Estimated Inflow to Mine and Modeling of Treated Water Infiltration System E-1 Estimated Inflow to Mine E-2 Analytical Model Calculations for the Treated Water Infiltration System E-3 Groundwater Flow Model of the Treated Water Infiltration System Appendix F Water Chemistry Data F-1 Water Chemistry of Groundwater Samples Collected in Exploration Holes F-2 Water Chemistry of Mine Drainage Water and TDRSA Water Appendix G WWTP Influent and Effluent Calculations G-1 Calculations G-2 U.S. Filter Documentation Appendix H Sizing Calculations for Contact Water Basins and Non-Contact Water
Infiltration Basins Appendix I Mine Water Balance Calculations – McIntosh Engineering Appendix J Discharge Management Plan Appendix K GCL, HDPE, PVC Product Data and Manufacturer Data and Specifications Appendix L Analysis of Water Samples for LSB - BSICs Appendix M Advection Dispersion Model

LJS\J:\scopes\04w018\10000\FVD reports\Final GWP\r-gw discharge permit app.doc vii
Eagle Project Groundwater Discharge Permit Application List of Abbreviations, Acronyms, and Symbols
BTPT Best Technology in Process and Treatment CL Clay COSA Coarse ore storage area CWB Contact water basin CR County road CRP Concentrate reduction process m3 Cubic meters yd3 Cubic yards ft Feet ft/d feet per day gal Gallons gpm Gallons per minute GCL Geosynthetic clay liner HDPE High density polyethylene in. Inches KEMC Kennecott Eagle Minerals Company kW Kilowatt LSB-BSIC Lake Superior Basin – Bioaccumulative Substance of Immediate Concern m Meters mil One thousandth of an inch MCRC Marquette County Road Commission MDEQ Michigan Department of Environmental Quality MDNR Michigan Department of Natural Resources ML Silt mW Megawatt NCWIB Non-contact water infiltration basin NREPA National Resources and Environmental Protection Act % Percent P.E. Professional Engineer RO Reverse osmosis RP-20 Resources Production District 20 SM Silty sand SP Poorly graded sand ft2 Square feet m2 Square meters TDRSA Temporary development rock storage area tonnes (t) Metric tonnes (1,000 kg) TWIS Treated water infiltration system WWTP Wastewater treatment plant TDS Total Dissolved Solids

LJS\J:\scopes\04w018\10000\FVD reports\Final GWP\r-gw discharge permit app.doc Foth & Van Dyke and Assoc., Inc. • 1
1 Introduction This document, titled Eagle Project Groundwater Discharge Permit Application, has been prepared in accordance with Part 31 of the Natural Resources and Environmental Protection (NREPA) Act, 1994 PA 451 (hereafter referred to as the Act); and Part 22 Rules of the Michigan Administrative Code which regulates the land application of treated water. The treatment and discharge facilities addressed in this application are part of the Kennecott Eagle Minerals Company (KEMC) proposed underground nickel and copper mine in Marquette County, Michigan, hereafter referred to as the Eagle Project. The Eagle Project will have an extensive water management program. The goal of the water management program is to protect water resources at the Eagle Project site. Runoff basins and control measures will be used to control sediment and erosion during construction activities. Groundwater that flows into the mine during construction and operation, and other surface water runoff that has the potential to come in contact with mining equipment and materials, will be pumped to lined contact water storage basins (CWBs) before being treated in a wastewater treatment plant (WWTP). The WWTP will be used for removing metals and other dissolved ions in the water before the water is discharged to an on-site treated water infiltration system (TWIS). The water management system for the Eagle Project will result in the protection of water resources during construction, operation, and after closure and reclamation. A number of parallel documents and permit applications have been or will be submitted to the Michigan Department of Environmental Quality (MDEQ), Marquette County, and Michigamme Township in support of the Eagle Project permitting process. These applications are listed in the Mining Permit Application for the Eagle Project (Foth & Van Dyke, 2006). 1.1 Background
The Eagle Deposit is a high-grade magmatic sulfide deposit containing nickel and copper mineralization and minor amounts cobalt and gold. The Eagle Deposit was discovered in 2002 by drilling known sulfide-bearing peridotite intrusions. The economic minerals are predominantly pentlandite and chalcopyrite. KEMC is proposing to mine the Eagle Deposit by underground mining methods. Extracted ore will be brought to the surface where it will be crushed and trucked off-site to a railhead. The ore will be transferred to rail cars for shipment to an off-site processor. There will be no milling or chemical processing of ore at the Eagle Project site. As such, surface facilities for the operation will be limited to those necessary for ore storage and crushing, managing development rock; water storage, treatment and discharge facilities; backfilling operations; ventilation and other ancillary operations. 1.2 Schedule
KEMC expects to have all major permit applications submitted to the MDEQ, Marquette County and Michigamme Township by early 2006. With this submittal schedule, it is anticipated that all state and county permits will be issued by late 2006.
LJS\J:\scopes\04w018\10000\FVD reports\Final GWP\r-gw discharge permit app.doc Foth & Van Dyke and Assoc., Inc. • 2
1.3 Project Contacts
The primary contact for the KEMC Eagle Project is Mr. Jonathan C. Cherry, P.E., Manager of Environment and Governmental Affairs for KEMC. Jonathan C. Cherry, P.E. Kennecott Eagle Minerals Company 1004 Harbor Hills Drive, Suite 103 Marquette, MI 49855 Phone: 906/225-5791 e-mail: [email protected] The primary contact for the MDEQ’s coordinated review of the Eagle Project is Mr. Joe Maki, District Geologist. Joe Maki District Geologist Michigan Department of Environmental Quality 420 5th Street Gwinn, Michigan 49841 Phone: 906/346-8563 e-mail: [email protected] The primary contact for review of this Groundwater Discharge Permit Application is: Mr. James R. Janiczek Chief-Groundwater Permits Unit
Michigan Department of Environmental Quality Constitution Hall, 2nd Floor North 525 West Allegan Street Lansing, MI 48909 1.4 Project Checklist
A check list in the way of a completed Groundwater Discharge Permit Application Form is provided in Appendix A.

LJS\J:\scopes\04w018\10000\FVD reports\Final GWP\r-gw discharge permit app.doc Foth & Van Dyke and Assoc., Inc. • 3
2 General Project Description
2.1 Project Location
The Eagle Project is located entirely in Sections 11 and 12, Township 50 North, Range 29 West, Marquette County, Michigan. Sections 11 and 12 are located entirely within Michigamme Township. Figure 2-1 shows the location of the project in Michigamme Township. Figures 2-2 and 2-3 are aerial and planimetric maps of the project area showing the mining facility boundaries, surrounding natural features and topography, and project soil borings and monitoring wells. In reviewing the figures contained in this report, the reviewer will notice that a variety of units are used with respect to elevations. The basic site plan has been tied to UTM Zone 16 coordinates in meters. Thus the planimetric elevation and coordinate system appears in metric units of meters. Additional data with respect to elevations (topography and water table elevations) have been converted to English units of feet and occasionally appear on figures in this report. 2.1.1 Land Ownership KEMC owns a 100% interest in the Eagle Project site through a mixture of private mineral title and state mineral leases. Figure 2-4 and Figure 2-5 show the location of the mineral title and leases and the surface ownership, respectively. KEMC owns the surface title over the mineral deposit as shown in Figure 2-5. Two surface facilities will be constructed for the project. The aggregate backfill surface facility and vent shaft will be located on KEMC owned land near the ore body. The main project surface facility will be located on lands currently owned by the State of Michigan. KEMC leases the mineral rights on these state-owned lands and through the terms of the leases has the right to obtain a permit from the Michigan Department of Natural Resources (MDNR) for the construction of mining-related surface facilities. 2.2 Proposed Surface Facilities
The buildings and structures that will be constructed to support the Eagle Project are shown on Figure 2-6. A description of the major buildings and structures is provided below. 2.2.1 Mine Dry/Office and Warehouse The mine dry/office and warehouse will be adjoining facilities where the bulk of the non-labor workforce will be stationed. The mine dry/office is a standard size building that adjoins a warehouse. Adjacent to the warehouse will be a building for emergency response. 2.2.2 Truck Wash & Scales All vehicles leaving the main operations area, as displayed on Figure 2-6, will be required to go through a truck wash to clean vehicles before they leave the main operations area. The main operations area is the area of the mine site that contains the temporary development rock storage area (TDRSA), coarse ore storage area (COSA), crushing operations, and truck, excavation and other equipment associated with the mine operations. The truck wash is an enclosed system that recycles the wash water. Water that is not recyclable due to excessive sediment loading will be routed to the water treatment plant for processing.

LJS\J:\scopes\04w018\10000\FVD reports\Final GWP\r-gw discharge permit app.doc Foth & Van Dyke and Assoc., Inc. • 4
The truck scale (see Figure 2-6) is located on the truck access road within the fenced area. The primary function of the scales will be to weigh the loaded trucks before the ore is shipped off-site for processing. 2.2.3 Assay Lab and Cold Storage An assay lab, shown on Figure 2-6, will be used to process and analyze ore samples and assist with ore grade control and other mining engineering functions. The lab will also support limited wet chemistry testing for performance monitoring of the WWTP and environmental monitoring. Additional testing for environmental monitoring will be completed by qualified independent laboratories. Adjacent to the assay lab will be a small building for the storage of drill core. 2.2.4 Fuel Storage The fuel storage facility will be located within the fenced and secured area shown on Figure 2-6, and will likely contain three diesel fuel storage tanks within a secondary containment system. Fuel storage will likely include one smaller tank for regular unleaded gasoline as well. The secondary containment system will be constructed with a roof over the facility. A building containing diesel-fueled generators will be located south of the fuel storage tanks. Propane storage will be located within the secure area of the mine property adjacent to a building that will contain a propane-fired air heating system for the mine. 2.2.5 Site Access, Parking and Roads Figure 2-6 shows the location of the Eagle Project site access roads, parking areas and internal roadways. Approved trucking routes will be used to access the project site. Access to the Eagle Project site is from Marquette CR 550 to CR 510 and CR AAA (Triple A Road). Both truck and other vehicular traffic will enter the site on the same access road. The traffic will be split between truck/operations traffic and visitor/employee traffic. Only construction and operations traffic will be allowed in the main operations area (refer to Figure 2-6). Any vehicle that is used in the main operations area will be washed at the truck wash prior to leaving the site or going into the non-contact area. Employee and visitor parking located south of the mine dry/office and warehouse is in the non-contact area where there is no direct exposure to mined materials. Access roads, parking areas and mine site roads will be constructed with site soils and/or crushed road aggregates and bituminous designed to maintain a drivable surface during all weather conditions. 2.2.6 Ore Storage and Crushing Coarse ore, uncrushed ore from the underground mine, will be trucked to the surface and dumped in the COSA. The COSA will be a three-sided building with a full roof that is used for temporary storage of stockpiled coarse ore. The COSA will have a concrete floor that will be sloped to a floor drain that will collect any contact water associated with the ore. This contact water will be drained or pumped into a composite-lined CWB where it is stored until treatment at the WWTP. The capacity of the COSA is sized for approximately 5,000 tonnes of coarse ore. Coarse ore will be transferred by a font-end loader from the stockpile to the crushing operations.

LJS\J:\scopes\04w018\10000\FVD reports\Final GWP\r-gw discharge permit app.doc Foth & Van Dyke and Assoc., Inc. • 5
2.2.7 Ore Transportation The ore will be loaded onto trucks equipped with secure covers and transported to a railhead location in the vicinity of Marquette. All loaded ore trucks will have the tires, sides and undercarriages washed at the on-site truck wash prior to leaving the site. KEMC is continuing to study available transportation routes and railhead locations. The railhead facility will be an enclosed facility constructed with a concrete floor. The loading of rail cars will occur inside the facility. Presently the following approved trucking route is proposed for moving the ore from the Eagle Project site to the railhead:
♦ East on Triple A Road 9.0 miles to County Road (CR) 510. ♦ East on CR 510 3.0 miles to CR 550. ♦ South on CR 550, approximately 20 miles, to a railhead in the vicinity of Marquette.
The location of the railhead is currently under negotiation. The trucks will be covered rear-dump gravel trains with a length limit of 60 feet. The truck will handle approximately 50 tons per load on average. During seasonal weight restrictions designated by the Marquette County Road Commission (MCRC) loads will be reduced to a 65% load at approximately 33 tons/load. Ore will be trucked to the railhead and dumped into an enclosed ore load-out shed. At the ore load-out shed the ore will be loaded onto rail cars and railed to an off-site processor. 2.2.8 Temporary Development Rock Storage Area Development rock is rock that is mined to develop the mine workings. The TDRSA is designed to contain approximately 189,500 m3 (247,900 yd3) of development rock that will eventually be used to backfill the mine. The development rock will be amended with limestone and contained in an earthen bermed area that has a composite liner. The composite liner of the TDRSA will be placed over a compacted subgrade on which the liner and collection system are constructed. The composite liner will include a geosynthetic clay liner (GCL). A 60-mil high density polyethylene (HDPE) liner will be placed over the clay. The base of the TDRSA will be sloped so that any liquid from precipitation and drainage through the development rock is routed through a collection system to a collection sump where it will be pumped out of the facility to the CWB. The collection system will have a leak detection system that is used to monitor the TDRSA performance. As the TDRSA is filled with development rock, a temporary geomembrane liner or equivalent approved material will be installed over the top of the development rock pile that has reached the design grades. The temporary cover will minimize the amount of water that reaches the development rock. The TDRSA is expected to be in service for about seven years. After it is filled, development rock stored in the TDRSA will be removed on a regular schedule and used to backfill mined out stopes. 2.2.9 Soil Stockpiles Surficial soils will be stockpiled in the area labeled on Figure 2-6 as the Construction Staging and Soil Stockpile Area. Topsoil will be stockpiled during construction and saved for reclamation needs. Stockpiled soils will be surrounded with appropriate erosion control devices. In addition, all surface water runoff from the stockpile area will be routed to a non-contact water infiltration basin (NCWIB) where the water will infiltrate back into the subsurface. Stockpiles that are planned to exist for one year or more will be seeded to minimize erosion and dusting.

LJS\J:\scopes\04w018\10000\FVD reports\Final GWP\r-gw discharge permit app.doc Foth & Van Dyke and Assoc., Inc. • 6
2.2.10 Contact Water Basins Water that comes in contact with underground rock, or development rock, will be considered contact water and will be pumped to and stored in CWBs lined with a composite liner. Storm water runoff from the main operations area will also be routed to the CWBs. Geochemical modeling of the mine water and TDRSA water suggests that the water will contain suspended sediments, dissolved metals, chloride, and sulfate. All water in the CWBs will be contained and treated on-site. 2.2.11 Management of Non-Contact Water The non-contact areas are shown on Figure 2-6 and include the employee parking lot, visitor parking lot, mine dry/offices, loading dock/warehouse, gate house, emergency response facility, and the backfill facility. Storm water runoff from areas shown as non-contact areas on Figure 2-6 will be segregated from the main operations area and directed to a NCWIB. The NCWIB allows runoff from non-contact areas to seep through the on-site sandy soils. The NCWIBs have been sized to contain and infiltrate storm water runoff from peak events that occur during the spring snowmelt. 2.2.12 Wastewater Treatment Plant A WWTP will be constructed at the site. The major sources of water requiring treatment are groundwater inflow to the mine, contact water from the TDRSA and storm water runoff from the main operations area. These waters will be treated to meet MDEQ Part 22 Groundwater Quality Standards and returned to the subsurface at the TWIS. The basic treatment processes for the facility as detailed in this document include filtration, hydroxide precipitation, reverse osmosis, ion exchange and mechanical evaporation. Solids generated from the WWTP will be disposed of in accordance with applicable regulations. 2.2.13 Treated Water Infiltration System Treated water will be piped from the WWTP to the TWIS in a buried pipeline. The treated water will be discharged to the on-site sandy soils through the TWIS. The TWIS will include a flow distribution structure, and multiple infiltration cells that include perforated piping bedded in clean gravel. The distribution structure will control the flow of treated water to each cell in proportion to the hydraulic capacity of that cell. Each cell will be designed to operate independently and to handle flow variations. Perforated discharge piping will be placed underground to allow for year-round operation of the system. Since the discharge from the WWTP will be treated to meet the MDEQ Part 22 Groundwater Quality Standards, no additional treatment from the soils is required or planned. Therefore, the key design feature for the TWIS is the even distribution of treated water across the soil to allow for even infiltration. 2.2.14 Backfill Surface Facility West of the main surface facility and south of the Triple A Road, KEMC will develop a small, approximately 4-acre backfill surface facility. The backfill surface facility will contain storage silos for fly ash and Portland cement, and a covered storage area for clean aggregate. The clean

LJS\J:\scopes\04w018\10000\FVD reports\Final GWP\r-gw discharge permit app.doc Foth & Van Dyke and Assoc., Inc. • 7
aggregate will be supplied by a local quarry operator. Aggregate, fly ash and Portland cement will be passed to an underground mixing plant where cement and fly ash will be mixed with aggregate to create backfill for mined out stopes. The main ventilation raise for the mine will also be located at this facility as will a NCWIB for storm water runoff from this area. 2.2.15 Site Utilities
2.2.15.1 Electric Power Electric power for the operations and support facilities will be provided by diesel-powered generators. Peak demand is estimated to be approximately 2.6 megawatts (mW). To provide the power, the generator plant for the project will contain three 1,825 kilowatt (kW) generators. The required power will be generated by running two of the generators with one in reserve. 2.2.15.2 Communications Communication to the underground mine and the other mine facilities will include approximately 30 handheld and 10 vehicle-mounted radio units. The main control is in a dispatch center at the surface. A tag reading system is proposed for installation in critical areas to ensure that all people are accounted for within the controlled areas of the mine. Communications to the mine site will occur via satellite telephone or other means. 2.2.16 Site Security Measures Figure 2-6 shows that the entire surface operations are within a fenced area. Vehicular access to the Eagle Project will be controlled by a gate house and the fence system. Within the fenced operations area, construction traffic going into the main operations area is separated from traffic going into the non-contact area. Any traffic leaving the main operations area will go through the site truck wash. 2.2.17 Potable and Sanitary Water Potable water will be supplied by a Type II Non-Transient Non-Community Water Supply Well permitted by Marquette County. The potable well will likely be located on KEMC property south of the Triple A Road. Sanitary wastewater generated on-site will be segregated from other project wastewaters and treated via a commercial septic system permitted by the Marquette County Health Department. The septic system is likely to generate less than 6,000 gallons per day and is thus regulated under R 323.2210(a)(ii). Sanitary wastewater will be discharged to the soil through a drain field that is separate from the TWIS. 2.3 Proposed Underground Facilities
2.3.1 Mine Description
Mine studies and geotechnical analyses concluded that blasthole stoping followed by backfilling with cemented and uncemented rock is the most favorable mining method. Blasthole stoping with cemented and uncemented backfill is a proven mining method. Because the ore is extremely competent, stopes can be opened and bulk mining methods used. The use of the development rock as part of the backfill for the mined out stopes is beneficial since long-term storage of development rock at the surface is eliminated.

LJS\J:\scopes\04w018\10000\FVD reports\Final GWP\r-gw discharge permit app.doc Foth & Van Dyke and Assoc., Inc. • 8
An evaluation of the stope sequencing indicated that a production rate of approximately 2,000 tonnes per day is sustainable. This will result in an annualized production rate that is typically between 400,000 to 500,000 tonnes per year and the potential to produce approximately 600,000 tonnes during peak years. The mine portal shown on Figure 2-6 will be the start of the decline tunnel driven at an approximate grade of -12.0%. Figure 2-7 is a schematic of an underground material handling plan that shows the underground workings listed below:
♦ Main decline designed with passing bays through the length of the decline. ♦ Main access ramp. ♦ Footwall drift. ♦ Exhaust drift. ♦ Main exhaust raise. ♦ Return air raises. ♦ Ore passes. ♦ Aggregate raise and binder borehole.
The Eagle Project ore and development rock handling system summarized in Figure 2-7 is described below. Ore Handling
♦ Ore will be removed from the stope with production loaders.
♦ On lower levels, ore will be loaded into low profile production trucks.
♦ On the upper levels, ore will be trammed to ore passes where it is dumped and loaded into low profile production trucks.
♦ Production trucks will haul the ore up the decline tunnel to the COSA on the surface.
♦ The COSA capacity is approximately 5,000 tonnes.
♦ Ore loaded from the coarse ore stockpile by a front end loader will be dumped into a
surface crusher.
♦ Ore will be crushed and conveyed to one of the two 300-tonne fine ore bins. Development Rock Handling
♦ Development rock is trucked to the surface using haul trucks and placed in the TDRSA and amended with limestone. Whenever possible development rock will be used to backfill open secondary stopes.
♦ The TDRSA is sized to hold approximately 189,500 m3 (~247,900 yd3 of development
rock).

LJS\J:\scopes\04w018\10000\FVD reports\Final GWP\r-gw discharge permit app.doc Foth & Van Dyke and Assoc., Inc. • 9
♦ Limestone amended development rock stored at the surface will be trucked back underground to be used as uncemented backfill in secondary stopes.
♦ Limestone will be mixed with the development rock to compensate for the acid
generating potential of the rock. 2.3.2 Mine Ventilation System The ventilation design for the Eagle Project is based on providing sufficient airflow to the underground operations to maintain safe working conditions. Intake air to the mine will be provided by the main mine decline. The ventilation system is designed for fire control in the unlikely event of a fire in the stoping area (active mining area). A fan will be located at the top of the main exhaust raise to circulate air through the mine. This fan will provide for safe and healthy conditions in all mine areas where personnel are required to work or travel. 2.4 Reclamation
The goal of the reclamation plan is to restore the Eagle Project site in a manner that is consistent with end use goals for the property such that long-term environmental impacts resulting from mining are negligible. Reclamation of the property will consist of restoring areas disturbed by mine facilities at the surface and backfilling the mine. The proposed reclamation plan will restore the property to a condition that blends with the natural landscape including use of native vegetation that enhances wildlife habitat. The final land use of the site will be compatible with existing uses on adjacent properties. Reclamation of the Eagle Project is regulated under R 425.101 et seq and is described in the Mining Permit Application (Foth & Van Dyke, 2006). 2.5 Mine Schedule
The overall schedule for the permitting, construction, operations and reclamation of the Eagle Project is provided on Figure 2-8.

LJS\J:\scopes\04w018\10000\FVD reports\Final GWP\r-gw discharge permit app.doc Foth & Van Dyke and Assoc., Inc. • 10
3 Summary of Hydrogeologic Conditions This section provides a summary of the hydrogeologic conditions at the site and addresses the requirements of R 323.2221. More detailed information is provided in the Eagle Project Supplemental Hydrogeologic Study for Groundwater Discharge that is contained in Appendix B. Overall, the proposed location for the TWIS is well suited for the discharge of treated water. The aquifer is comprised of permeable outwash sands. The unsaturated zone at the site, also comprised of outwash sands, is between 60 and 100 feet in thickness. Infiltrometer tests conducted at the TWIS site yielded a measured infiltration rate of approximately 60 ft/d. Pump tests have measured the horizontal hydraulic conductivity of the aquifer at 25 ft/d. Analytical calculations and modeling confirm that the mound beneath the TWIS will remain well below the land surface and infiltrated water will be readily transmitted by the aquifer. 3.1 Land Use
Figure 3-1 shows the location of the Eagle Project on a reproduction of the Michigamme Township Official Zoning Map ‘D/E” dated May 25, 1992. The Eagle Project is located on land that is zoned as RP-20 (Resource Production Twenty). On land zoned RP-20, mineral extraction is a permitted principal use. Historically, the land comprising the Eagle Project site has been used for logging. Recent, extensive clear cutting is evident on the local aerial map of the project site (see Figure 3-2). There has been no other industrial, commercial or domestic use of the Eagle Project site. There are no known areas of existing contamination at or adjacent to the Eagle Project site that would be classified as a “Facility” under Part 201 of the Act. 3.1.1 Designated Well-Head Protection Areas and Surrounding Features Information from the MDEQ website was reviewed for the location of nearby wellhead protection areas. The Powell Township well, located near Big Bay, and approximately 9.5 miles northeast of the project site, is the nearest wellhead protection area and is located in a different watershed than the project site. Ishpeming/Negaunee is the next closest well-head protection area located approximately 20 miles south of the project site. Pertaining to R 323.2221(2)(d) the Eagle Project TWIS is not located in an established designated well-head protection area. MDEQ and Marquette County water well construction records were reviewed for the location of domestic wells within the vicinity of the Eagle Project site. Documentation on this search can be found in Appendix C. Pertaining to R 323.2221(4)(g)(v) there are no wells, lakes, ponds, streams, or springs within a ½-mile radius of the TWIS. There is one wetland to the south of the TWIS that is within ½-mile of the TWIS. However, this wetland is upgradient of the TWIS and will not be affected by the discharge. 3.2 Site Investigation and Key Findings
Several investigations have been completed to characterize the hydrogeologic conditions in the vicinity of the Eagle Project site. In April 2005, KEMC submitted to the MDEQ an Interim Hydrology Report (North Jackson Company, 2005a) which documented the results of extensive regional and site specific geologic and hydrologic data collection programs in the vicinity of the

LJS\J:\scopes\04w018\10000\FVD reports\Final GWP\r-gw discharge permit app.doc Foth & Van Dyke and Assoc., Inc. • 11
Eagle Project site. In April 2005, KEMC also submitted to MDEQ a Hydrogeologic Study Work Plan (North Jackson Company, 2005b) for completion of the site specific investigation program for this Groundwater Discharge Permit Application. Figure 2-6 shows the location of soil borings, monitoring wells, and test pits that have been completed for characterizing the Eagle Project site including the TWIS. The following sections provide a summary of key findings documented in Appendix B that relate to this Groundwater Discharge Permit Application. 3.2.1 Hydrostratigraphic Units Seven distinct hydrostratigraphic units have been identified at the Eagle Project site which, descending the stratigraphic column, include the following:
♦ Unsaturated A Zone outwash and beach deposits that consist predominantly of poorly graded fine- to medium-textured sand (SP), averaging less than 10 percent silt and clay. From a soil texture standpoint, these unsaturated deposits are ideally suited for infiltration of treated water.
♦ Saturated A Zone outwash and beach deposits that consist of predominantly poorly
graded fine- to medium-textured sand (SP) and silty-sand, averaging less than 15 percent silt and clay.
♦ Transitional saturated to unsaturated B Zone glacial melt water deposits consisting of a
mix of fine sand, silt and clay (SM) fining downward to predominantly silt (ML) and clay (CL).
♦ Saturated C Zone lacustrine massive clay (CL) deposits. The C Zone and B Zone
deposits pinch out in the vicinity of the proposed TWIS and are absent downgradient of the proposed site.
♦ Saturated D Zone outwash and ablation till deposits consisting of predominantly fine- to
medium-grained sand (SP to SM).
♦ Saturated E Zone basal till deposits consisting of a mixture of silty sands, clayey sands, clay, and silt.
The unsaturated zone at the location of the TWIS consists of predominantly unsaturated A Zone deposits with an approximate thickness of 80 ft. Where B Zone deposits comprise a portion of the unsaturated zone, the thickness of the overlying unsaturated A Zone deposits is approximately 50 ft. Overall, the substantial deposit of unsaturated sand at the Eagle Project site is ideally suited for the TWIS. Cross sections through the Eagle Project Site which display the stratigraphy described above are provided in Appendix B. 3.2.2 Test Pits and Infiltrometer Tests Test pits and double ring infiltrometer tests were completed adjacent to the soil borings completed within the approximate 10 acre TWIS area. The test pits were completed to characterize the physical characteristics of the shallow soils that exist immediately beneath the

LJS\J:\scopes\04w018\10000\FVD reports\Final GWP\r-gw discharge permit app.doc Foth & Van Dyke and Assoc., Inc. • 12
TWIS. Test pit logs presented in Appendix B show that the shallow soils within the TWIS area are unsaturated poorly graded fine- to medium-textured sands. In several test pits weakly cemented layers of sand were noted within the upper three feet of the soil profile. The design of the infiltration system (see Section 7) requires the removal of these layers as part of the construction process. Results of the infiltrometer tests provided in Appendix B yielded uniform infiltration rates of approximately 62 ft/d. There was negligible evidence of horizontal flow of the infiltrated water in test pits completed after the infiltrometer tests. Based on R 323.2233(4)(a)(v), the design hydraulic loading of the TWIS cannot exceed approximately 1.8 ft/d (three percent of the infiltration rate measured by the tests). Overall, the test pits and infiltrometer tests show that the physical and hydraulic characteristics of the soils at the TWIS area are well suited for infiltrating treated water for the Eagle Project. 3.2.3 Groundwater Flow and Aquifer Hydraulic Characteristics Regional and local groundwater elevation maps are provided in Appendix B. Groundwater flow at the Eagle Project site occurs primarily within the transmissive portions of the glacial deposits which are primarily the fine- to medium-textured outwash sand deposits that form the A Zone and D Zone hydrostratigraphic units. On a local and regional basis, groundwater flow at the Eagle Project site is predominantly northeast towards the Salmon Trout River East Branch, and its headwater tributaries that are fed by groundwater seeps along the north terrace of the Yellow Dog Plains. Infiltrated water at the TWIS site will act as additional recharge to the water table in the outwash aquifer. The ability of the aquifer to transmit infiltrated water away from the site will be controlled by the hydraulic characteristics of the aquifer. As described in Appendix B, the horizontal hydraulic conductivity of the aquifer in the vicinity of the TWIS is approximately 25 ft/d. The measured horizontal hydraulic conductivity at the TWIS site is consistent with other pump tests completed for the Eagle Project (North Jackson Company, 2005a). Collectively, site specific data show that the hydraulic characteristics of the outwash deposits are conducive to the lateral transmission of infiltrated water away from the TWIS area. 3.2.4 Background Groundwater Quality Background groundwater quality monitoring for this Groundwater Discharge Permit Application is presented in Appendix B. Based on this data, background groundwater quality for the TWIS has been established per MDEQ requirements as outlined in MDEQ’s Guidance Document titled Guide Sheet I – Hydrogeologic Study Requirements. Appendix D provides a technical memorandum on the statistical analysis of the data that establishes background concentrations. Background groundwater quality, and proposed groundwater quality standards based on R 323.2222(3) and R 323.2222(5)(a) are summarized in Table 3-1. 3.2.5 Acceptability of the Site for Discharge The acceptability of the proposed TWIS area for discharge of treated water is based on the ability of the site to: 1) infiltrate treated water, and 2) transmit the water laterally away from the infiltration area resulting in a groundwater mound that is contained within the pre-existing

LJS\J:\scopes\04w018\10000\FVD reports\Final GWP\r-gw discharge permit app.doc Foth & Van Dyke and Assoc., Inc. • 13
Table 3-1 Background Groundwater Quality and
Proposed Groundwater Quality Standards1
Parameter Units A Zone
Background D Zone
Background
Proposed A Zone
Standard
Proposed D Zone
Standard Part 201
Standard(2) Aluminum μg/l 49 47 175 173 300 Antimony μg/l 3.3 3.3 4.7 4.7 6 Arsenic μg/l 1.5 5 26 28 50 Barium μg/l 14 18 1010 1010 2000 Beryllium μg/l 0.67 0.67 2.3 2.3 4 Boron μg/l 67 67 283 283 500 Cadmium μg/l 0.33 1.1 2.7 3 5 Chloride mg/l 8.9 14 250 250 250 Chromium μg/l 3.3 3.3 52 52 100 Cobalt μg/l 6.7 6.7 23 23 40 Copper μg/l 3.3 3.3 702 702 1400 Fluoride mg/l 0.07 0.15 1 1 2 Iron μg/l 100 281 1050 1140 2000 Lead μg/l 0.67 0.67 2.3 2.3 4 Lithium μg/l 6.5 6.5 88 88 170 Magnesium mg/l 1.3 3.3 201 202 400 Manganese μg/l 18 88 439 474 860 Mercury ng/l 0.47 0.41 1000 1000 2000 Molybdenum μg/l 7.7 6.7 40 40 73 Nickel μg/l 17 17 58 58 100 Nitrate mg/l 0.14 0.04 5.1 5 10 Selenium μg/l 0.67 0.67 25 25 50 Silver μg/l 0.13 0.17 17 17 34 Sodium mg/l 0.87 2.2 120 120 120 Sulfate mg/l 8.4 4.2 250 250 250 Zinc μg/l 8.2 7.4 1200 1200 2400 1 Source: Appendix D 2 Part 201 Residential Drinking Water Criteria, Table 1 R 299.5744
Prepared by: LJS Checked by: SVD1

LJS\J:\scopes\04w018\10000\FVD reports\Final GWP\r-gw discharge permit app.doc Foth & Van Dyke and Assoc., Inc. • 14
unsaturated zone. In assessing the area requirements for the TWIS, several assumptions were made as follows:
♦ The expected inflow rate of water to the mine will be approximately 75 gpm on a sustained basis as described in the Technical Memorandum from Golder Associates Ltd. contained in Appendix E-1. The upper bound estimated inflow rate is approximately 215 gpm. The design basis in developing the water balance for the project and sizing the WWTP assumed an inflow rate to the mine of 250 gpm.
♦ With the design basis mine inflow rate of 250 gpm, the water balance for the site (see
Section 4) shows that on average the discharge rate to the TWIS, assuming maximum annual precipitation conditions, will be about 290 gpm. The 290 gpm average discharge to the TWIS includes water pumped from the mine and storm water runoff from the main operations area.
♦ The WWTP will be sized to accommodate up to 350 gpm in treatment capacity to
accommodate peak storm water runoff events.
♦ The TWIS will be sized to infiltrate at least 400 gpm, a value that exceeds the capacity of the WWTP.
♦ The basis of design for the footprint of the TWIS will be based on an application rate
(infiltration rate) that does not exceed 1.8 ft/d as required by R 323.2233(4)(a)(v).
♦ The horizontal hydraulic conductivity of the aquifer that will transmit water away from the TWIS is approximately 25 ft/d.
♦ The groundwater mound beneath the TWIS should, conservatively, be no greater than
about 40 ft. With these assumptions, an analytical solution (Hantush, 1967 and Finnemore, 1995) was used to determine the layout of the TWIS and approximate the mound height. These calculations are described in detail in Appendix E-2. The results of the design calculations show that a TWIS with a footprint that measures 150 ft wide (parallel to the ambient regional hydraulic gradient) and 1,030 ft long (perpendicular to ambient regional hydraulic gradient) will be sufficient to accommodate the average discharge to the TWIS and peak discharge rates greater than 400 gpm. A discharge rate of 400 gpm is 50 gpm greater than the design capacity of the WWTP. As an additional safety factor, the TWIS was designed so that the capacity exceeds the WWTP capacity. Additional analysis on the mounding that will take place at the TWIS was further evaluated with a groundwater flow model also described in Appendix E-3. The analysis with the groundwater flow model provides additional confirmation on the ability of the site to accommodate the planned discharge of treated water from the Eagle Project.

LJS\J:\scopes\04w018\10000\FVD reports\Final GWP\r-gw discharge permit app.doc Foth & Van Dyke and Assoc., Inc. • 15
4 Description of Mine Water Sources and Characteristics The Eagle Project will have an extensive water management program. Figure 2-6 shows the locations of the main water management facilities including the CWBs, the WWTP, and the TWIS. Mine water streams will be generated during construction, operation, and closure of the Eagle Project. Each of the major sources of mine water is discussed in more detail below. The design of the facilities to be used for collection, treatment, and disposal of these wastewaters is discussed in Section 6. 4.1 Operational Water Sources and Characteristics
4.1.1 Mine Drainage Sources of water inflow to the mine will include groundwater infiltration into the mine, water vapor contained in ventilation air, utility water used in mining operations, and water contained in the mine backfill material. The flows from the mine will include mine drainage, water vapor contained in ventilation air exiting the mine, and water retained in the ore brought to the surface for processing. The mine drainage water will primarily consist of a composite of groundwater that infiltrates into the mine and utility water used in the mine for dust suppression and for operation of mining equipment. Drainage from the mine backfill material is anticipated to be negligible and is not included in the water balance. The mine drainage water will be collected in underground sumps and will be pumped to the CWBs. Two sources of groundwater are anticipated to be encountered during development and operation of the mine. The primary source will be groundwater that flows from the upper bedrock into the upper mining levels. The upper bedrock groundwater is expected to be encountered during both the mine development and mine operation phases and will represent the bulk of the water pumped from the mine. The second source of groundwater is saline water, that is contained within weakly connected and widely spaced fractures in the lower bedrock formation, and which is expected to be encountered most significantly during development of the mine. As described in Section 3, for WWTP design purposes it has been assumed that 250 gpm of groundwater will be flowing into the mine. This inflow rate exceeds the upper bound or peak inflow estimate. The chemical characteristics of the groundwater in the area of the Eagle Project were determined from background groundwater sampling and analysis work conducted by Golder Associates, Ltd. and is provided in Appendix F-1. Analysis of samples from exploration holes open to the upper bedrock and yielding non-saline water derived from the upper bedrock were used to determine the chemical characteristics for the upper bedrock groundwater. Samples from testing of deep exploration holes were used to determine the chemical characteristics of the stored saline water in weakly connected and widely spaced fractures in the lower bedrock. Table 4-1 summarizes the groundwater sampling data for both the upper bedrock groundwater and the stored saline groundwater in the lower bedrock.

LJS\J:\scopes\04w018\10000\FVD reports\Final GWP\r-gw discharge permit app.doc Foth & Van Dyke and Assoc., Inc. • 16
Table 4-1 Mine Drainage Water Characteristics
Parameter
Upper Bedrock
Groundwater
(1)
Lower Bedrock
Groundwater (2)
Composite Groundwater
(3)
Incremental Change
(4)
Composite Mine
Drainage (5)
Percentage of Total Mine Groundwater Inflow
55% 45% na na na
Aluminum, μg/l 83 50 68 88 156 Antimony, μg/l 5.0 5 5.0 16 21 Arsenic, μg/l 2.0 19 10 17.0 27 Barium, μg/l 28 20 24 4.0 28 Beryllium μg/l, 1.0 1.0 1.0 na 1.0 Boron, μg/l 2,397 5,900 3,973 70 4,043 Cadmium, μg/l 0.5 5.0 2.5 10.0 13 Calcium, μg/l 15,983 76,000 42,991 4,000 46,991 Chloride, μg/l 41,367 2,000,000 922,752 1,580 924,332 Chromium, μg/l 5.0 5.0 5.0 4.5 10 Cobalt, μg/l 10.0 10.0 10.0 720 730 Copper, μg/l 5.0 5.0 5.0 150 155 Fluoride, μg/l 333 1,000 633 98 731 Iron, μg/l 67 1,800 847 6,400 7,247 Lead, μg/l 1.0 1.0 1.0 9.0 10 Lithium, μg/l 15 130 67 26 93 Magnesium, μg/l 2,897 61,000 29,043 5,000 34,043 Manganese, μg/l 20 68 42 950 992 Mercury, μg/l 0.00183 0.00021 0.00110 0.04 0.0411 Molybdenum, μg/l 10 10 10 13 23 Nickel, μg/l 26 25 25 36,400 36,425 Nitrogen (Ammonia)6, μg/l 85 260 163 10,000 10,163 Nitrogen (Nitrate), μg/l 50 50 50 0 50 Phosphorus, total 22 15 18 na 18 Potassium, μg/l 4,350 9,200 6,533 1,000 7,533 Selenium, μg/l 1.0 17 8 20.0 28 Silver, μg/l 0.2 0.5 0.3 4.5 4.8 Sodium, μg/l 38,833 970,000 457,858 1,000 458,858 Strontium, μg/l 131 4,800 2,232 20 2,252 Sulfate, μg/l 10,317 5,000 7,924 110,000 117,924 Thallium, μg/l not analyzed not analyzed not analyzed 8.0 8.0 Vanadium, μg/l not analyzed not analyzed not analyzed 7.0 7.0 Zinc, μg/l 11 19 15 150 165
(1) Average value based on average of sample analysis from wells 04EA-054A, 04EA-054B, 04EA-054D, 04EA-054F (Golder 2005) and 05EA-107 (18-34 m, and 97-114 m in Appendix F-1)
(2) Based on sample analysis (04EA-084 86 purges, 249-302 m) documented in Appendix F-1 (3) Calculated as: (Upper Bedrock Groundwater Conc.)(Upper Bedrock % of Inflow) + (Lower Bedrock
Groundwater Conc.)(Lower Bedrock % of Inflow). Total mine inflow assumed to be 250 gpm. (4) Incremental change in concentration of indicated groundwater chemical constituents due to contact with mine
workings. (Appendix F-2) (5) Composite groundwater concentration plus incremental change (Appendix G). (6) Incremental change is estimated increase due to blasting residuals . na = not applicable Prepared by: JJF1 Checked by: SVD1

LJS\J:\scopes\04w018\10000\FVD reports\Final GWP\r-gw discharge permit app.doc Foth & Van Dyke and Assoc., Inc. • 17
The chemical characteristics of the composite mine drainage water will depend on the background characteristics of the groundwater that infiltrates into the mine and the impact of groundwater contact with the mine workings. The mine drainage water will contain readily soluble substances, mineral oxidation products, and colloidal materials that will result from the short-term reactions between water and materials within the mine. The incremental increases in the concentrations of the various constituents of the groundwater, due to contact with the mine workings, were calculated based on geochemical characterization studies conducted by Geochimica, Inc. as described in Appendix F-2. The estimated chemical characteristics of the mine drainage water are shown in Table 4-1. The values shown were calculated as a composite of the upper bedrock groundwater and the saline groundwater in the lower bedrock using the indicated constituent concentrations for each groundwater source and using the indicated percentage of total mine inflow indicated for each groundwater source. Additionally, the mine drainage water chemical characteristics include the incremental increases in the concentrations of the individual chemical constituents due to contact of the groundwater with the mine workings. The distribution of groundwater inflow to the mine from the two groundwater sources was based on the mine inflow modeling by Golder Associates, Ltd., provided in Appendix E-1 and represents the worst case condition where the stored saline water is at a maximum percentage of the total mine inflow. Table 4-1 conservatively assumes that 45% of the inflow is saline water from the deep bedrock. Note that results from the groundwater modeling effort are documented in the Environmental Impact Assessment for the Eagle Project which is contained in the Mining Permit Application (Foth & Van Dyke, 2006). The mine utility water is estimated to have the same water chemistry as the composite mine drainage water. Although ammonia and nitrates are not anticipated to occur in the groundwater in significant concentrations, they will be present in the mine drainage water as byproducts from blasting operations. Ammonia and nitrate concentrations in the mine drainage water were estimated based on information supplied by Kennecott from other representative mines. The estimated ammonia and nitrate concentrations for the mine drainage water are shown in Table 4-1. 4.1.2 Water from Temporary Development Rock Storage Area Rock removed during development of the mine access workings will be stored at the TDRSA as shown on Figure 2-6. This material will be amended with limestone and temporarily stored during the operations of the mine. The amended development rock will ultimately be used as mine backfill material. The TDRSA will be a lined facility designed to capture any precipitation falling within the perimeter of the storage area. Any water that accumulates in the TDRSA will be transferred to the CWBs and discharged to the WWTP. Water coming in contact with the stored development rock may contain readily soluble substances, mineral oxidation products, and colloidal materials that will result from the short-term reactions between water and rock materials. The chemical characteristics of the TDRSA contact water were calculated based on characterization studies conducted by Geochimica, Inc. and are included in Appendix F-2. The chemical characteristics for the contact water from the TDRSA are shown in Table 4-2.

LJS\J:\scopes\04w018\10000\FVD reports\Final GWP\r-gw discharge permit app.doc Foth & Van Dyke and Assoc., Inc. • 18
Table 4-2 Contact Water Characteristics
Parameter Composite Mine
Drainage (1) TDRSA Contact
Runoff (2) Influent
Wastewater(3)
Aluminum, μg/l 156 1.0 140 Antimony, μg/l 21 0.4 19 Arsenic, μg/l 27 83 33 Barium, μg/l 28 30 28 Beryllium μg/l, 1.0 not analyzed 1.0 Boron, μg/l 4,043 580 3,671 Cadmium, μg/l 13 0.2 11 Calcium, μg/l 46,991 199,000 63,345 Chloride, μg/l 924,332 10,000 825,963 Chromium, μg/l 10 0.45 8.5 Cobalt, μg/l 730 0.80 652 Copper, μg/l 155 60 145 Fluoride, μg/l 731 500 706 Iron, μg/l 7,247 2.0 6,467 Lead, μg/l 10 0.40 9.0 Lithium, μg/l 93 19 85 Magnesium, μg/l 34,043 18,000 32,317 Manganese, μg/l 992 0.5 885 Mercury, μg/l 0.04110 0.04000 0.0410 Molybdenum, μg/l 23 1.5 21 Nickel, μg/l 36,425 8,330 33,403 Nitrogen (Ammonia), μg/l 10,163 not analyzed 163 Nitrogen (Nitrate), μg/l 50 not analyzed 50 Phosphorus, total 18 not analyzed 18.5 Potassium, μg/l 7,533 29,000 9,842 Selenium, μg/l 28 4.0 26 Silver, μg/l 4.8 0.05 4.3 Sodium, μg/l 458,858 19,000 411,536 Strontium 2,252 200 2,031 Sulfate, μg/l 117,924 575,000 167,099 Thallium 8.0 0.05 7.1 Vanadium 70 0.75 6.3 Zinc, μg/l 165 1,900 351
(1) Composite mine drainage water characteristics are from Table 4-1 of this report. (2) Appendix F-2 (3) Appendix G
Prepared by: JJF1 Checked by: SVD1

LJS\J:\scopes\04w018\10000\FVD reports\Final GWP\r-gw discharge permit app.doc Foth & Van Dyke and Assoc., Inc. • 19
4.1.3 Runoff from Other Areas of the Mine Site The main operations area is shown on Figure 2-6 and includes the fuel storage area, the ore crusher area, the laydown area, the truck wash and scale area, the lab and maintenance building, and other areas in which the runoff could come in contact with process equipment and materials. Storm water runoff from the main operations area will generally contain suspended solids and other substances related to the materials stored in the area. The runoff from the main operations area will be collected in the CWBs and, for design purposes, is conservatively estimated to have the same water chemistry as the combined contact water listed in Table 4-2. During construction and operation of the mine, non-contact storm water runoff will be generated in areas where the runoff will not come in contact with process equipment, materials, or chemicals. Non-contact storm water runoff will be generated in areas such as:
‚ Construction staging/soil storage area ‚ Roadways to and from the site ‚ Employee parking lot areas ‚ Roof of mine office and warehouse building
The non-contact runoff areas are shown on Figure 2-6. Four NCWIBs will be provided to accommodate runoff. One basin will be located in the northwest area of the main site and will receive runoff from the construction staging/soil storage area. The second and third basins will be located southeast of the main site along the access road and will receive runoff from the office/warehouse and employee parking lot areas. The fourth basin will be located at the aggregate backfill site and will receive runoff from the clean backfill surface facility. Note that the CWBs and NCWIBs are designed to contain peak runoff events during periods of combined rapid snow melt and spring rains. In the case of the lined CWB, enough storage capacity exists to store peak runoff from the main operations area for eventual treatment at the WWTP. In the case of the NCWIBs, the basins have been sized to accommodate peak runoff events from non-contact areas. NCWIBs are designed to allow the collected storm water to infiltrate to groundwater. Appendix H includes a Technical Memorandum on the sizing of the CWBs and NCWIBs. 4.1.4 Potable Water Supply and Sanitary Wastewater A potable water system will be provided to supply potable water to the site buildings, the lab, and to the mine. A well, pump, fresh water tank, and distribution system will be provided for potable water. KEMC plans to use well QAL011D (See Figure 2-3) as a potable well for the project and will apply for a Type II Non-Transient Non-Community Water Supply Permit from the Marquette County Health Department. Sanitary waste generated by toilets, sinks and showers at the site will be routed to on-site septic system. The septic system will include settling tanks and buried infiltration fields per R 323.2210(a)(ii). KEMC plans to apply for a septic system permit from the Marquette County Health Department.

LJS\J:\scopes\04w018\10000\FVD reports\Final GWP\r-gw discharge permit app.doc Foth & Van Dyke and Assoc., Inc. • 20
Wastewater will be generated from the laboratory and shops. The wastewater generated in the laboratory will include small amounts of laboratory chemicals used in ore analysis and in analysis of wastewaters. Wastes generated in the laboratories will be disposed of off-site by a qualified contractor or will be discharged to the CWBs and processed though the WWTP. Wastewater generated in the shops will include small amounts of grease and oil, metal shavings, other particulate materials, and wash water. Most of the grease will be captured in traps. These wastewaters will be discharged to the CWBs and processed through the WWTP. 4.2 Water Balance
A detailed water balance has been developed for the Eagle Project. Water inputs for the water balance include groundwater inflow to the mine, water contained in ventilation air entering the mine, and storm water runoff from the main operations area. Water uses shown on the water balance include mine utility water, truck washing, ore crushing operations, and mine backfilling operations. Water discharges for the water balance include evaporation from the CWBs, water retained in the mine backfill material, water contained in ventilation air exiting the mine, and treated water discharged to the TWIS. Potable water for sanitary uses will be obtained from an on-site well. Sanitary wastewater will be collected, treated, and disposed of separately from mine groundwater inflow water and storm water runoff from the main operations area. The water balance on Figure 4-1 shows peak water flow conditions. The key parameters used in development of the water balance are as follows:
‚ The WWTP design basis groundwater inflow into the mine of 250 gpm. This exceeds the upper bound inflow of 215 gpm based on modeling by Golder Associates, Ltd. (Appendix E-1).
‚ Annual average operations area storm water runoff is based on maximum annual
precipitation of 54 in/yr for record period from 1948 to 2004; (Data source: National Weather Service, Houghton, Michigan). Precipitation data from Houghton was used since it receives similar amounts of snowfall as the Project Site.
‚ Average annual evaporation losses from CWBs based on average annual free water
surface evaporation of 19 in/yr; (Average Annual Evaporation for Marquette County, Data Source: USDA, Natural Resources Conservation Service). Marquette County evaporation rates were used as they are likely the most representative of annual evaporation losses at the site.
‚ Mine ventilation inflow and exhaust water rates based on calculations prepared by
McIntosh Engineering for KEMC and contained in Appendix I.

LJS\J:\scopes\04w018\10000\FVD reports\Final GWP\r-gw discharge permit app.doc Foth & Van Dyke and Assoc., Inc. • 21
The water balance on Figure 4-2 shows average annual precipitation and expected case mine inflow conditions. The key parameters used in development of the average inflow water balance are as follows:
‚ Expected groundwater inflow into the mine of 75 gpm based on modeling by Golder Associates, Ltd. (Appendix E-1).
‚ Annual average operations area storm water runoff is based on average annual
precipitation of 33 in/yr for record period from 1948 to 2004; (Data source: National Weather Service, Houghton, Michigan). Precipitation data from Houghton was used since it receives similar amounts of snowfall as the Project Site.
‚ Average annual evaporation losses from CWBs based on average annual free water
surface evaporation of 19 in/yr; (Average Annual Evaporation for Marquette County, Data Source: USDA, Natural Resources Conservation Service). Marquette County evaporation rates were used as they are likely the most representative of annual evaporation losses at the site.
‚ Mine ventilation inflow and exhaust water rates based on calculations prepared by
McIntosh Engineering for KEMC and contained in Appendix I. Water flows associated with precipitation and runoff from non-contact areas of the site have been excluded from the water balances because these flows are solely dependent on precipitation and will be routed to natural drainage ways at the site. The small amounts of evapotranspiration from the site have been excluded from the site water balance because these flows are minor compared to the other water flows described previously and would not significantly affect the site water balance.

LJS\J:\scopes\04w018\10000\FVD reports\Final GWP\r-gw discharge permit app.doc Foth & Van Dyke and Assoc., Inc. • 22
5 Wastewater Management Alternatives Evaluation This section describes general alternatives for wastewater management and discharge, and alternative treatment technologies. 5.1 General Alternatives
R 323.2219 requires that an alternative analysis be completed as part of the Groundwater Discharge Permit Application. Alternatives that must be considered include:
♦ Wastewater minimization. ♦ Wastewater recycling. ♦ Discharge to a municipal treatment system. ♦ Discharge to surface water.
5.1.1 Minimizing the Volume of Wastewater The steps identified in R 323.2219(2) for minimizing the volume of the wastewater include equipment or technology modifications, process or procedure modification, reformulation or redesign of products, substitution of raw materials, and improvements in housekeeping, maintenance, training, or inventory control. The sources of water requiring treatment are natural groundwater inflow to the mine and contact storm water. The quality of this water will be determined by the background water quality as well as a variety of mine operations. One major part of the overall water management strategy will be to minimize unnecessary exposure of water with mine materials, particularly the massive sulfide and semi-massive sulfide ores. Exposure of water to mine materials will be limited with respect to contact time and water quantities by covering the TDRSA, and minimizing the facility footprint of operations involving these mine materials. A key element to the strategy of the site water balance will be to segregate water streams. Sanitary water will be kept separate, and it will be treated on-site and through a permitted septic system. Potable water will also be kept separate from wastewater, process water, sanitary wastewater, and storm water. Overall water use will be reduced by using recycle streams or treated water for equipment washing and mine utility water. The following pollution prevention alternatives were considered for minimizing the volume of wastewater.
♦ Equipment or technology modifications - Standard mining industry equipment and technology will be used. Modifying mining equipment or technology is not expected to significantly affect the volume of the wastewater.
♦ Process or procedure modifications - Wastewater generation will be reduced by the use of
recycled water as noted above.
♦ Reformulation or redesign of products - Minimizing the volume of wastewater by reformulation or redesign of products is not applicable to this project as the product is crushed ore.

LJS\J:\scopes\04w018\10000\FVD reports\Final GWP\r-gw discharge permit app.doc Foth & Van Dyke and Assoc., Inc. • 23
♦ Substitution of raw materials - Minimizing the volume of wastewater by substitution of
raw materials is not applicable to this project as the raw material source of the constituents in the wastewater is the ore and development rock.
♦ Improvements in housekeeping, maintenance, training, or inventory control - Standard
mining industry practices are incorporated into the mining operations to minimize the volume of the wastewater.
5.1.2 Recycling Wastewater As the site water balance was developed, opportunities for effective and safe use of recycle water was explored. Recycle streams are specified within the site water management plan and water balance diagrams shown in Figures 4-1 and 4-2. 5.1.3 Connection to a Municipal Treatment System The alternative discharge of partially treated process water (effluent) to a municipal treatment system was considered as impractical, since the nearest municipal system of adequate size (Marquette, Michigan) is more than 20 miles (32 km) away. Very high capital costs and large environmental impacts from the construction of a pipeline connection through forests and streams are considered to outweigh any potential advantages of a connection to municipal treatment system. Trucking partially treated process water to a municipal treatment system is also considered impractical due to transportation logistics. 5.1.4 Discharging to Surface Water The alternative for discharge of treated water to surface water was considered, but considered less than optimal because of overall water balance concerns. Since most of the treated water is expected to come from groundwater inflow to the mine, infiltration back into the groundwater system is a preferred discharge option. Another goal of the overall water management strategy is to minimize acute alteration of aquatic habitats caused by a point source discharge to surface water. 5.2 Treatment Processes Considered
The mine inflow water, storm water runoff from the main operations area, and other miscellaneous contact waters will be treated prior to discharge to conform to applicable standards and regulations specified in R 323.2222. The water influent to the water treatment system contains metals and inorganic ions. The water is not expected to contain volatile or nonvolatile organic compounds at levels that would require treatment, and biological degradation processes are not required. The treatment processes applicable to treating metals and inorganic ions are considered and are discussed below per the requirements of R 323.2219(3). 5.2.1 Flocculation Flocculation is a common, physical-chemical treatment process that enhances the removal of particles in water by sedimentation (settling) or filtration. Fine particles that would normally be stable in a water suspension are removed when they collide with other particles, attach to form larger particles, and settle or filter out to a sludge layer that can be removed physically.
LJS\J:\scopes\04w018\10000\FVD reports\Final GWP\r-gw discharge permit app.doc Foth & Van Dyke and Assoc., Inc. • 24
Flocculation is typically used with chemical coagulants that adsorb onto particles, neutralize stabilizing static charges, cause chemical precipitation, or interparticle bridging. The chemical coagulants often improve the removal efficiency, especially for fine particles. In addition, chemical coagulants can also remove dissolved metal ions and other compounds, by enhancing precipitation or adsorption to particles. Routine performance sampling and automatic control of pH and coagulation dosing is common, and efforts are taken to minimize the unnecessary chemical additions that may have a negative effect on downstream treatment processes and effluent water quality. In some cases, additional water conditioning processes, such as pH adjustment, are needed prior to discharge. The Eagle Project will treat the wastewater with a hydroxide precipitation process. This hydroxide precipitation process includes a flocculation process which will occur within the solids contact clarifier. See Section 6.5.2.1 Metals Precipitation/Sedimentation for further details. 5.2.2 Settling Settling, or sedimentation, is a straight-forward process that allows suspended particles to settle in an influent basin or clarifier. Settling is often used in conjunction with flocculation. Depending on solids loading, settled solids are removed manually on a regular schedule, or are removed continuously by a sludge rake and sludge pump. Settling is often a necessary pretreatment measure for other processes, especially for chemical and physical processes that are meant to treat dissolved compounds (such as ion exchange). Settling may also be needed to reduce solids loadings on filters and to improve operability of pumps and other process equipment used to treat the water. The Eagle Project will treat the wastewater with a hydroxide precipitation process. This hydroxide precipitation process includes a sedimentation process which will occur within the solids contact clarifier. See Section 6.5.2.1 Metals Precipitation/Sedimentation for further details. 5.2.3 Oxidation Oxidation is a chemical process that uses an oxidant (such as chlorine, ozone, or dissolved oxygen) to react with dissolved compounds and particulate matter. The oxidized form of the compounds and particulate matter may be less toxic or easier to remove by follow-up processes. For removal of organics or microbiological contamination, oxidation is applied after other processes have been applied to destroy or inactivate the contaminants. A breakpoint chlorination process will be used in the Eagle Project for ammonia treatment. In this process, chlorine will be added to the wastewater. The chlorine oxidizes the ammonia to nitrogen gas. See Section 6.5.3.1 Breakpoint Chlorination, for further details. 5.2.4 Filtration Filtration is a common process for removal of suspended solids. Filtration can be applied with mechanical belt, drum, and press filters for cases with high solids loadings without sedimentation, or from granular filter beds and pressure filters for lower solids loadings. If a sedimentation basin is used, granular filter beds are most common. Suspended particles are removed as they attach to granular solids and are strained out of finer pores. Granular filter beds

LJS\J:\scopes\04w018\10000\FVD reports\Final GWP\r-gw discharge permit app.doc Foth & Van Dyke and Assoc., Inc. • 25
and filter media are backwashed routinely to maintain throughput, and the backwashed solids are brought back to settling basins or handled as a separate waste stream. Gravity filtration will be used in the Eagle Project to remove suspended solids which may carry over from the solids contact clarifier in the metals precipitation/sedimentation process. See Section 6.5.2.3 Gravity Filters, for further details 5.2.5 Ion Exchange Ion exchange is a chemical process that allows selective removal of dissolved ions, and works by exchange of those ions with more inert ions on an exchange media. Exchange media are available for a broad range of compounds, but each medium is highly selective for a limited set of targeted ions. The number of targeted ions addressed improves when different exchange media are used in series. Suspended solids must be removed prior to ion exchange and performance is best when the background water chemistry is not variable. Exchange media are regenerated on a regular schedule, and the effluent from the regeneration step typically requires post-treatment. An ion exchange process will be used in the Eagle Project for boron treatment and metals polishing. See Section 6.5.3.8 Boron Ion Exchange and Section 6.5.3.5 Weak Acid Ion Exchange System, for further details. 5.2.6 Reverse Osmosis Reverse osmosis (RO), also referred to as membrane filtration, uses high pressures to cause water to pass through a membrane that rejects passage of ions and other dissolved compounds. Suspended solids are commonly removed prior to RO. Very high effluent quality is possible. Different RO membranes can be selected based on wastewater characteristics and desired removal efficiencies for targeted compounds. The retained water that does not pass through the RO membrane is a more concentrated wastewater stream than the RO feed water and requires post-treatment. A reverse osmosis process will be used in the Eagle Project. The system will provide polishing of the metals precipitation/sedimentation system effluent and remove other contaminants not removed by metals precipitation/sedimentation system such as sodium, chlorides, etc. See Section 6.5.2.4 First Pass Reverse Osmosis System and Section 6.5.2.5 Second Pass Reverse Osmosis System for further details. 5.2.7 Electrolytic Recovery Electrolytic recovery uses electric fields to pass ions across selective ion membranes to capture and concentrate ions. Suspended solids are removed prior to electrolytic recovery. Cations migrate toward the cathode and anions migrate toward the anode. Most of the water passes through the system, but ions can be selectively removed. The captured ions can be treated further with other processes to the point where refined waste streams have economic value. For electroplating wastes, the recovered metals can be recycled back to the electroplating operations. However, for wastewater with trace levels of dissolved ions of low value, electrolytic recovery is less attractive. The Eagle Project will not use an electrolytic recovery process for mine water treatment.

LJS\J:\scopes\04w018\10000\FVD reports\Final GWP\r-gw discharge permit app.doc Foth & Van Dyke and Assoc., Inc. • 26
5.2.8 Analysis of Secondary Processes Further analysis of secondary processes, such as the management of RO reject water and the handling of filtration backwash residuals, is addressed as part of the Section 6, Basis of Design for Proposed Wastewater Treatment System. The overall management of solids is also addressed in Section 6.
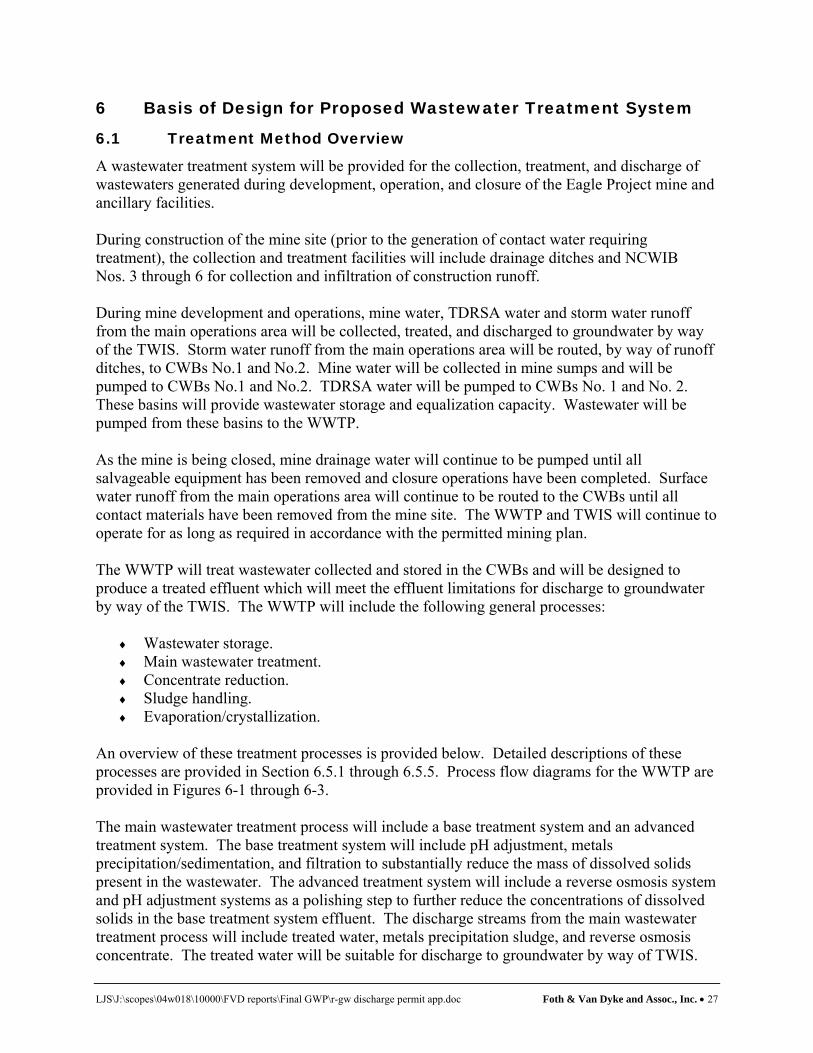
LJS\J:\scopes\04w018\10000\FVD reports\Final GWP\r-gw discharge permit app.doc Foth & Van Dyke and Assoc., Inc. • 27
6 Basis of Design for Proposed Wastewater Treatment System
6.1 Treatment Method Overview
A wastewater treatment system will be provided for the collection, treatment, and discharge of wastewaters generated during development, operation, and closure of the Eagle Project mine and ancillary facilities. During construction of the mine site (prior to the generation of contact water requiring treatment), the collection and treatment facilities will include drainage ditches and NCWIB Nos. 3 through 6 for collection and infiltration of construction runoff. During mine development and operations, mine water, TDRSA water and storm water runoff from the main operations area will be collected, treated, and discharged to groundwater by way of the TWIS. Storm water runoff from the main operations area will be routed, by way of runoff ditches, to CWBs No.1 and No.2. Mine water will be collected in mine sumps and will be pumped to CWBs No.1 and No.2. TDRSA water will be pumped to CWBs No. 1 and No. 2. These basins will provide wastewater storage and equalization capacity. Wastewater will be pumped from these basins to the WWTP. As the mine is being closed, mine drainage water will continue to be pumped until all salvageable equipment has been removed and closure operations have been completed. Surface water runoff from the main operations area will continue to be routed to the CWBs until all contact materials have been removed from the mine site. The WWTP and TWIS will continue to operate for as long as required in accordance with the permitted mining plan. The WWTP will treat wastewater collected and stored in the CWBs and will be designed to produce a treated effluent which will meet the effluent limitations for discharge to groundwater by way of the TWIS. The WWTP will include the following general processes:
♦ Wastewater storage. ♦ Main wastewater treatment. ♦ Concentrate reduction. ♦ Sludge handling. ♦ Evaporation/crystallization.
An overview of these treatment processes is provided below. Detailed descriptions of these processes are provided in Section 6.5.1 through 6.5.5. Process flow diagrams for the WWTP are provided in Figures 6-1 through 6-3. The main wastewater treatment process will include a base treatment system and an advanced treatment system. The base treatment system will include pH adjustment, metals precipitation/sedimentation, and filtration to substantially reduce the mass of dissolved solids present in the wastewater. The advanced treatment system will include a reverse osmosis system and pH adjustment systems as a polishing step to further reduce the concentrations of dissolved solids in the base treatment system effluent. The discharge streams from the main wastewater treatment process will include treated water, metals precipitation sludge, and reverse osmosis concentrate. The treated water will be suitable for discharge to groundwater by way of TWIS.
LJS\J:\scopes\04w018\10000\FVD reports\Final GWP\r-gw discharge permit app.doc Foth & Van Dyke and Assoc., Inc. • 28
The metals precipitation sludge will be routed to the sludge handling process for dewatering. The reverse osmosis concentrate will be routed to the concentrate reduction process (CRP) for treatment and volume reduction. The CRP will be provided to maximize the water recovery and correspondingly minimize the volume of concentrate treated by the evaporator/crystallizer process. The CRP will treat the concentrate from the main wastewater treatment process reverse osmosis system. The treatment processes proposed for this system include breakpoint chlorination, softening/metals precipitation, microfiltration, pH adjustment, reverse osmosis, and ion exchange. The discharge streams from the CRP will include treated water, microfiltration sludge, and reverse osmosis concentrate. The treated water will be suitable for discharge to groundwater by way of the TWIS. The microfiltration sludge will be routed to the sludge handling process for dewatering. The reverse osmosis concentrate will be routed to an evaporation/crystallization process for volume reduction or will be incorporated with the underground cemented mine backfill. The sludge handling process will dewater sludge from the main wastewater treatment process metals precipitation/sedimentation system and sludge from the CRP microfiltration system. A plate and frame filter press will be used for sludge dewatering. Filtrate from the filter press will be routed back to the head end of the CRP for treatment. The dewatered sludge from the filter press will be managed in accordance with applicable regulations. The evaporation/crystallization process is provided for volume reduction of the reverse osmosis concentrate from the CRP. Distillate from the evaporator will be discharged through the TWIS along with treated water from the main wastewater treatment process. Brine solids from the crystallizer will be managed in accordance with applicable regulations. 6.2 Discharge Standards
The WWTP will be designed to provide a level of treatment sufficient to ensure consistent compliance with the Part 22 Groundwater Quality Standards. Table 6-1 summarizes wastewater flows and pollutant concentrations and the groundwater quality standards based on background monitoring.
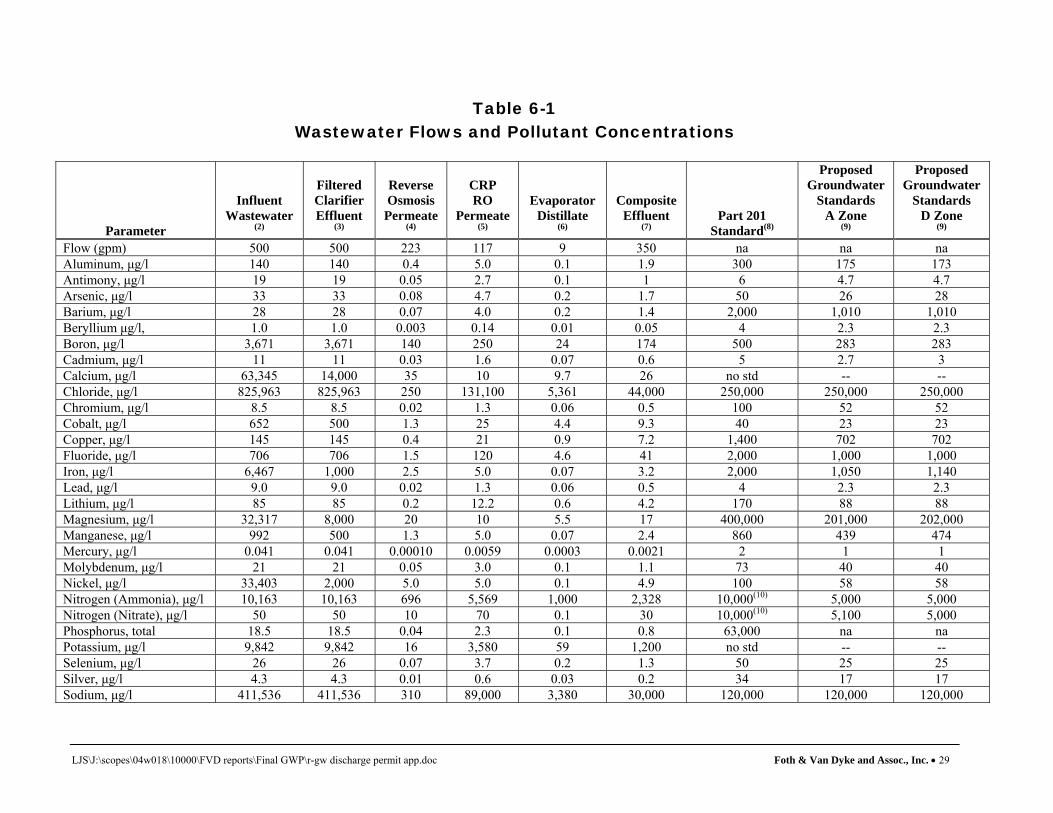
LJS\J:\scopes\04w018\10000\FVD reports\Final GWP\r-gw discharge permit app.doc Foth & Van Dyke and Assoc., Inc. • 29
Table 6-1 Wastewater Flows and Pollutant Concentrations
Parameter
Influent Wastewater
(2)
Filtered Clarifier Effluent
(3)
Reverse Osmosis Permeate
(4)
CRP RO
Permeate (5)
Evaporator Distillate
(6)
Composite Effluent
(7) Part 201
Standard(8)
Proposed Groundwater
Standards A Zone
(9)
Proposed Groundwater
Standards D Zone
(9)
Flow (gpm) 500 500 223 117 9 350 na na na Aluminum, μg/l 140 140 0.4 5.0 0.1 1.9 300 175 173 Antimony, μg/l 19 19 0.05 2.7 0.1 1 6 4.7 4.7 Arsenic, μg/l 33 33 0.08 4.7 0.2 1.7 50 26 28 Barium, μg/l 28 28 0.07 4.0 0.2 1.4 2,000 1,010 1,010 Beryllium μg/l, 1.0 1.0 0.003 0.14 0.01 0.05 4 2.3 2.3 Boron, μg/l 3,671 3,671 140 250 24 174 500 283 283 Cadmium, μg/l 11 11 0.03 1.6 0.07 0.6 5 2.7 3 Calcium, μg/l 63,345 14,000 35 10 9.7 26 no std -- -- Chloride, μg/l 825,963 825,963 250 131,100 5,361 44,000 250,000 250,000 250,000 Chromium, μg/l 8.5 8.5 0.02 1.3 0.06 0.5 100 52 52 Cobalt, μg/l 652 500 1.3 25 4.4 9.3 40 23 23 Copper, μg/l 145 145 0.4 21 0.9 7.2 1,400 702 702 Fluoride, μg/l 706 706 1.5 120 4.6 41 2,000 1,000 1,000 Iron, μg/l 6,467 1,000 2.5 5.0 0.07 3.2 2,000 1,050 1,140 Lead, μg/l 9.0 9.0 0.02 1.3 0.06 0.5 4 2.3 2.3 Lithium, μg/l 85 85 0.2 12.2 0.6 4.2 170 88 88 Magnesium, μg/l 32,317 8,000 20 10 5.5 17 400,000 201,000 202,000 Manganese, μg/l 992 500 1.3 5.0 0.07 2.4 860 439 474 Mercury, μg/l 0.041 0.041 0.00010 0.0059 0.0003 0.0021 2 1 1 Molybdenum, μg/l 21 21 0.05 3.0 0.1 1.1 73 40 40 Nickel, μg/l 33,403 2,000 5.0 5.0 0.1 4.9 100 58 58 Nitrogen (Ammonia), μg/l 10,163 10,163 696 5,569 1,000 2,328 10,000(10) 5,000 5,000 Nitrogen (Nitrate), μg/l 50 50 10 70 0.1 30 10,000(10) 5,100 5,000 Phosphorus, total 18.5 18.5 0.04 2.3 0.1 0.8 63,000 na na Potassium, μg/l 9,842 9,842 16 3,580 59 1,200 no std -- -- Selenium, μg/l 26 26 0.07 3.7 0.2 1.3 50 25 25 Silver, μg/l 4.3 4.3 0.01 0.6 0.03 0.2 34 17 17 Sodium, μg/l 411,536 411,536 310 89,000 3,380 30,000 120,000 120,000 120,000

Table 6-1 (cont’d)
LJS\J:\scopes\04w018\10000\FVD reports\Final GWP\r-gw discharge permit app.doc Foth & Van Dyke and Assoc., Inc. • 30
Parameter
Influent Wastewater
(2)
Filtered Clarifier Effluent
(3)
Reverse Osmosis Permeate
(4)
CRP RO
Permeate (5)
Evaporator Distillate
(6)
Composite Effluent
(7) Part 201
Standard(8)
Proposed Groundwater
Standards A Zone
(9)
Proposed Groundwater
Standards D Zone
(9)
Strontium, μg/l 2,031 2,031 1.5 281 13 95 4,600 TBD TBD Sulfate, μg/l 167,099 167,099 10 4,800 1,135 1,700 250,000 250,000 250,000 Thallium, μg/l 7.1 7.1 0.02 1.0 0.05 0.4 2 TBD TBD Vanadium, μg/l 6.3 6.3 0.01 0.9 0.04 0.3 4.5 TBD TBD Zinc, μg/l 351 351 0.9 50 0.07 17 2,400 1,200 1,200
(1) Wastewater flows are for maximum design capacity (350 gpm of effluent) which is greater than water balance for maximum annual precipitation. (2) Influent concentrations are based on composite values in Table 4-2. Influent wastewater flow rate to the clarifier includes the utility water which is
recycled back to the mine and is not treated with the RO process. (3) Filtered effluent concentration only accounts for precipitation of calcium, cobalt, magnesium, manganese and nickel compounds. The co-precipitation of
additional metals have conservatively not been estimated. (4) Reverse osmosis permeate concentrations are based on estimated permeate quality of double pass RO system in main treatment process. (5) Concentrate reduction process (CRP) concentrations are based on estimated permeate quality in CRP RO system after the boron ion exchange system. (6) Evaporator distillate concentrations are based on estimated distillate quality in the evaporator process. (7) Composite effluent concentrations are based on the combined effluent from the main RO system, CRP RO system and evaporator. (8) Part 201 Residential Drinking Water Criteria Table 1, R 299.5744. (9) Appendix D. (10) The total inorganic nitrogen standard is for ammonia-nitrogen + nitrate nitrogen + nitrite nitrogen. No Std = No standard specified in R 323.2222 or R 299.5744. TBD = To be determined based on additional monitoring (see Section 9) na = not applicable
Prepared by: JJF1 Checked by: HJA

LJS\J:\scopes\04w018\10000\FVD reports\Final GWP\r-gw discharge permit app.doc Foth & Van Dyke and Assoc., Inc. • 31
6.3 Design Flows and Pollutant Loading
As shown in Figures 4-1 and 4-2, and as discussed in Section 4, the primary sources of wastewater for the Eagle Project will include the following:
♦ Mine drainage water. ♦ Contact water from the TDRSA. ♦ Storm water runoff. ♦ Truck wash contact water. ♦ Crusher contact water.
The basis for the flows and pollutant concentrations for the mine drainage water, TDRSA contact water, and the storm water runoff from the main operations area is provided in Section 4. Flows for the truck wash and crusher contact waters are based on typical values for similar mining operations. The pollutant concentrations for the truck wash and crusher contact waters are conservatively estimated as being equivalent to the mine drainage water. The wastewater pollutant concentrations are summarized in Table 4-2. 6.4 Schematic Flow Diagram
Process flow diagrams for the WWTP are provided in Figures 6-1 through 6-3. A description of the WWTP facilities, including the design basis for these facilities, is provided below. 6.5 Description of Treatment Units
The WWTP will include the following general processes:
♦ Wastewater storage. ♦ Main wastewater treatment. ♦ Concentrate reduction. ♦ Sludge handling. ♦ Evaporation/Crystallization.
The following sections provide a detailed description of these processes. 6.5.1 Wastewater Storage
A description of the CWB design and size is provided in Section 8 and Appendix H. 6.5.2 Main Wastewater Treatment Process A process flow diagram for the main wastewater treatment process is provided in Figure 6-1. This process will include the following facilities:
‚ Metals precipitation/sedimentation ‚ First stage pH adjustment. ‚ Sand filtration ‚ First pass reverse osmosis

LJS\J:\scopes\04w018\10000\FVD reports\Final GWP\r-gw discharge permit app.doc Foth & Van Dyke and Assoc., Inc. • 32
‚ Second pass reverse osmosis ‚ Final effluent pH adjustment
6.5.2.1 Metals Precipitation/Sedimentation The first step in treatment of the wastewater will be metals precipitation and separation through sedimentation. This step is provided to remove the bulk of metals present in the wastewater. The clarification process will also serve to remove some of the suspended solids present in the wastewater. Hydroxide precipitation will be used to precipitate out (remove) metals present in the wastewater. This is a well established technology commonly used to remove metals from wastewater. During hydroxide precipitation, metal removal occurs by adjusting the pH of the wastewater to the point where metals exhibit minimum solubilities and precipitate as metal hydroxides. These precipitates can then be separated from the wastewater through sedimentation. The effectiveness of hydroxide precipitation is dependent on wastewater characteristics such as pH, the form of metal ions present, and the presence of complexing agents. The extent of metals removal by this process is limited by the solubilities of the metal hydroxides generated. The minimum solubilities for most metal hydroxides occur in the pH range of 9 to 11; hence metal precipitation, in general, is optimal within this range. However, each metal hydroxide has a unique point of minimum solubility. The optimum pH for the hydroxide treatment process, corresponding to the maximum overall removal of metals, or corresponding to the maximum removal of key metals, will need to be determined once the WWTP is in operation and may need to be adjusted periodically in response to changing wastewater characteristics. To allow flexibility in operation, the metals hydroxide process will be designed for an operating range of pH 9.0 to pH 11.0. Lime (Ca(OH)2) and sodium hydroxide (NaOH) are commonly used for metals hydroxide precipitation. The use of lime is proposed for the Eagle Project. The principle precipitation reactions, in the case where lime is used, can be represented with the following general equations:
‚ M+2 + Ca(OH)2 ↔ M(OH)2↓ + Ca+2
‚ 2M+3 + 3Ca(OH)2 ↔ 2M(OH)3↓ + 3Ca+2
where M+2 includes divalent metals such as copper, zinc, lead, nickel, and cadmium, and M+3 includes trivalent metals such as aluminum and iron. In the hydroxide precipitation process, wastewater will be mixed with lime in a reaction tank and will subsequently flow to a solids contact-type clarifier. Rapid mixing of lime and wastewater and subsequent precipitation of heavy metals will occur in the reaction tank. Flocculation and settling of the precipitates will occur within the clarifier and will result in the formation of metal hydroxide solids in the bottom of the clarifier. Polymer addition will be used as required to optimize the solids sedimentation process. Solids generated by the precipitation process will be pumped from the clarifier to the sludge handling process for dewatering. Effluent from the clarifier will be routed to the downstream gravity filters.

LJS\J:\scopes\04w018\10000\FVD reports\Final GWP\r-gw discharge permit app.doc Foth & Van Dyke and Assoc., Inc. • 33
The facilities for the metals precipitation/sedimentation process will include a reaction tank equipped with a mixing system, lime storage, a lime solution make-up and feed system, a solids contact-type clarifier, a polymer feed system, sludge pumping, and instrumentation for monitoring and control purposes. One reaction tank and one clarifier will be provided. In the event that the metals precipitation/sedimentation system is out of service for repairs or maintenance, wastewater will either be temporarily stored in the CWBs or will be bypassed around the precipitation/clarification system to the gravity filters. Design flows and sizing parameters for the metals precipitation/clarification system are provided in Table 6-2. The projected filtered effluent quality is shown in Table 6-1. The projected filter effluent concentrations listed in Table 6-1 only account for precipitation of calcium, cobalt, magnesium, manganese and nickel compounds. The co-precipitation of additional metals has not been estimated. 6.5.2.2 pH Adjustment The wastewater pH will be adjusted to between 9.0 and 11.0 in the metals precipitation process. The pH of the wastewater will be adjusted back down to the 6.5 to 7.5 range after the metals precipitation/clarification process to minimize the potential for scaling of the downstream reverse osmosis membranes. A sulfuric acid storage and feed system will be provided for pH control purposes. An in-line pH control system is proposed. Design flows and sizing parameters for the pH adjustment system are provided in Table 6-2. 6.5.2.3 Gravity Filters Effluent from the solids contact clarifier will flow to the gravity sand filters. The primary function of the gravity filter system will be to remove suspended solids that could clog or damage the downstream reverse osmosis system. A single-media filter system is proposed. Instrumentation will be provided for monitoring and control of the filter system. Multiple filter units will be provided to allow continued wastewater treatment in the event that one of the filters is down for maintenance or repairs. The filter system will be designed to meet peak flow conditions with one of the filters off line. The filters will be equipped with automatic backwash systems. The backwash water will be routed to the CRP. A gravity filter effluent storage tank will be provided. This tank will provide water for backwashing of the filters, will serve as a pumping wet well for the downstream reverse osmosis pumps, and will serve as a pumping wet well for the mine utility water pumps. The tank will be sized consistent with the flow rates and operating requirements of the three pumping systems served. Design flows and sizing parameters for the gravity filter system are provided in Table 6-2.

LJS\J:\scopes\04w018\10000\FVD reports\Final GWP\r-gw discharge permit app.doc Foth & Van Dyke and Assoc., Inc. • 34
Table 6-2 Design Criteria for Major Wastewater
Treatment System Processes
Process/Equipment Design Flow
(gpm) Design Criteria(3) Contact Storage Basins 350(1) Storage capacity = 15 days Main Wastewater Treatment Process:
Metals Precipitation Tank 500(2) Reaction time pH range
= 15 minutes = 9.0 – 11.0
Solids Contact Clarifier 500(2) Hydraulic loading rate = 0.2 gpm/ft2 effective area Gravity filters 500(2) Hydraulic loading rate = 5 gpm/ft2 Double Pass Reverse Osmosis 350 Percent recovery = 67% Final Effluent pH Adjustment Tank 350 Reaction time
pH range = 5 minutes = 6.5 – 7.5
Final Effluent Storage Tank 350 Storage Capacity = 60 minutes Concentrate Reduction Process: Reaction Tank No.1 (Breakpoint Chlorination)
140 Reaction time pH range Chlorine: ammonia
= 30 minutes = 7.0 – 8.0 = 8:1 – 10:1 weight
Reaction Tank No.2 (Softening/Metal Precipitation)
140 Reaction time pH range
= 10 minutes = 9.0 – 11.0
Microfiltration System 140 Concentrate slurry = 0.15 gpm/ft2
pH Adjustment Tank 140 Reaction time pH range
= 10 minutes = 6.5 – 7.5
Weak Acid Ion Exchange 205 Volume flow rate = 2.5 gpm/ft3
Reverse Osmosis 205 Percent recovery = 93% Boron Ion Exchange 140 Volume flow rate = 1.0 gpm/ft3
Sludge Handling Process: Sludge Storage Tank 5 Storage capacity = 24 hr Plate and Frame Filter Press 5 Flow capacity
Solids capacity Dewatered solids
210 ft3/day 22-25 % solids
Sludge Storage Area Storage capacity 14 days Evaporator/Crystallizer Process: Evaporator/Crystallizer 10 Capacity 100% RO concentrate flow Crystallizer Solids Storage Area Storage capacity 14 days
(1) Design capacity of WWTP is 350 gpm. (2) Influent wastewater flow rate through the clarifier and gravity filters includes the utility water which is
recycled back to the mine and is not treated with the RO process. (3) The design criteria may change based upon final equipment selection.
Prepared by: JJF1 Checked by: HJA

LJS\J:\scopes\04w018\10000\FVD reports\Final GWP\r-gw discharge permit app.doc Foth & Van Dyke and Assoc., Inc. • 35
6.5.2.4 First Pass Reverse Osmosis System Effluent from the gravity filters will be pumped to a reverse osmosis system. This system will provide polishing of the metals precipitation/sedimentation system effluent with respect to heavy metals and will also remove other contaminants not removed by the metals precipitation/sedimentation system such as sodium, chlorides, sulfate, etc. Reverse osmosis (RO) is a treatment process which uses semi-permeable membranes to remove inorganic and organic constituents from wastewater. RO separation of high molecular weight molecules, such as organic compounds, is achieved through physical “straining”. RO separation of low molecular weight wastewater constituents, such as metals and inorganic salts, is achieved through electro-chemical interactions between the membrane surface and the ions in solution. The basic principles of operation for an RO system are as follows. A wastewater feed stream is passed tangentially across the membrane surface and is driven by applied hydrostatic pressure through the membrane. Constituents present in the wastewater are rejected at the membrane surface and become concentrated in the "reject" or “concentrate” stream while purified "permeate" or “product water” passes through the membrane. This process separates the membrane system feed stream into two new aqueous streams, the purified "permeate" stream and the concentrated "reject" or “concentrate” stream. Typical RO rejection rates for most anions and cations commonly found in wastewater have been established and published by RO equipment manufacturers based on laboratory testing and/or historical operating performance data. Although, RO removal efficiencies will vary from application to application, due to differences in water chemistry and operating parameters, the published RO removal efficiencies provide a reasonable engineering basis for determining probable system performance. For the present evaluation, permeate water quality is provided by U.S. Filter (Industrial Water Systems Division). Permeate water quality is based on operating experience and project specific operating parameters. The projected effluent quality for the RO system is presented in Table 6-1. Two RO process trains will be provided for the first pass system. Each train will be designed for 50% of the peak design flow rate. The two trains will be operated in parallel. This configuration will allow continued operation of the RO system in the event that either of the RO trains is off line for maintenance or repairs. Each train will include a high pressure feed pump, cartridge pre-filters, multiple RO element arrays, and miscellaneous control and monitoring devices. Instrumentation will be provided for monitoring and control of the RO system. Storage and feed facilities for chemicals used for minimization of biological fouling (biocides) and/or chemical scaling (anti-scalants) will be provided for use as required. A membrane cleaning system will also be provided for maintenance of the RO membranes. Membrane cleaning wastewater will be routed to the CRP for treatment. The RO concentrate will be routed to the CRP. The RO permeate will be routed to the second pass RO system. Design flows and sizing parameters for the first pass reverse osmosis system are provided in Table 6-2.

LJS\J:\scopes\04w018\10000\FVD reports\Final GWP\r-gw discharge permit app.doc Foth & Van Dyke and Assoc., Inc. • 36
6.5.2.5 Second Pass Reverse Osmosis System Effluent from the first pass RO system will be pumped to the second pass RO system. The second pass system is provided for additional removal of contaminants. Additionally, the second pass RO system will remove boron from the permeate stream. The rejection rate of boron by RO membranes is relatively low in the neutral pH range that the first pass RO system will be operated at. In the neutral pH range, boron is typically present as undissociated boric acid which is not readily rejected by RO membranes. However, at elevated pH levels, boron takes the form of dissociated borate which is more readily rejected by RO membranes. At pH levels in the 10.0 to 11.0 range, RO boron rejection rates above 90% can be achieved. Note that operation of the first pass RO system at an elevated pH range is not practical due to the high potential for membrane scaling. Because of the relatively high wastewater constituent concentrations in the feed stream to the first pass RO system, the potential for membrane scaling by metal hydroxides, calcium precipitates, etc., would be an operational concern at elevated pH levels. For this reason, boron removal in the first pass RO system is not practical. However, the second pass RO system will be treating the treated permeate from the first pass RO system and, consequently, the potential for membrane scaling at elevated operating pH levels will be minimized. Therefore, the second pass RO system will be used for boron removal. Two RO process trains will be provided for the second pass system. Each train will be designed for 50% of the peak design flow rate. The two trains will be operated in parallel. Each train will include a high pressure feed pump, cartridge pre-filters, multiple RO element arrays, and miscellaneous control and monitoring devices. Instrumentation will be provided for monitoring and control of the RO system. Storage and feed facilities for chemicals used for minimization of biological fouling (biocides) and/or chemical scaling (anti-scalants) will be provided for use as required. A membrane cleaning system will also be provided for maintenance of the RO membranes. Membrane cleaning wastewater will be routed to the CRP for treatment. With the exception of boron, the combined first pass and second pass RO system will be designed for operation at a combined recovery rate of approximately 67%. This means that 67% of the RO feed stream will be recovered as product water (“permeate”) and 33% of the feed stream will end up in the concentrated reject stream (“concentrate”). The estimated recovery rate is based on meeting effluent quality objectives and on membrane scaling considerations. The RO concentrate will be routed to the CRP. The RO permeate will be routed to the final effluent pH adjustment tank. Design flows and sizing parameters for the second pass reverse osmosis system are provided in Table 6-2. Projected effluent limits for the RO system are provided in Table 6-1. Note that alternate processes for boron removal may be considered during the design phase of the Eagle Project. An ion exchange system using boron selective resin may also be evaluated. These types of systems can provide a level of boron removal comparable to the proposed RO system. Final selection of a boron removal system will be based on economic and technical considerations at the time of final engineering.
LJS\J:\scopes\04w018\10000\FVD reports\Final GWP\r-gw discharge permit app.doc Foth & Van Dyke and Assoc., Inc. • 37
6.5.2.6 Final Effluent pH Adjustment Prior to discharge to the TWIS, the pH of the main WWTP final effluent will be adjusted as required to achieve a pH in the range of 6.5 to 7.5. A pH adjustment tank will be provided for this purpose. Sodium hydroxide and sulfuric acid storage and feed systems will be provided for pH control purposes. Note that final effluent from the main wastewater treatment process, the evaporation/crystallizer process, and the CRP, will all be directed to this tank for final pH adjustment prior to discharge. Design flows and sizing parameters for the final effluent pH adjustment system are provided in Table 6-2. 6.5.2.7 Final Effluent Storage An effluent storage tank will be provided for short term storage of WWTP final effluent. The effluent storage tank water will be continuously monitored for conductivity. In the event that the final effluent conductivity exceeds operational limits, the effluent will be automatically pumped from the storage tank back to the CWBs for reprocessing through the WWTP. Design flows and sizing parameters for the final effluent storage tank are provided in Table 6-2. 6.5.2.8 Effluent Pumping Pumps will be provided to transfer final effluent from the effluent storage tank to the TWIS. Two pumps will be provided with each pump being sized for 100% of the TWIS design flow capacity. 6.5.2.9 Treated Water Infiltration System The TWIS is described in Section 7 of this report. 6.5.2.10 Treated Wastewater Reuse As shown in Figure 6-1, some of the treated wastewater will be reused in the mine operations. Partially treated wastewater, taken after the metals precipitation/sedimentation and gravity filtration processes, will be routed to a utility water storage tank. This water will be used for various mine operations. Note that the utility water represents an internal recycle loop in the mine overall water balance; the utility water eventually will return to the WWTP after use in the mine operations. The impact of the utility water internal recycle loop is that the metals precipitation/sedimentation and gravity filtration processes will be sized for a higher flow rate than the downstream wastewater treatment processes. Projected utility water requirements for the Eagle Project are shown on the project water balance (Figures 4-1 and 4-2). 6.5.3 Concentrate Reduction Process The CRP will be provided to maximize water recovery for the WWTP and correspondingly minimize the volume of concentrate treated by the evaporation\crystallization system. The CRP will treat the concentrate from the main wastewater treatment process RO system. The RO system for the CRP will be designed to operate at a recovery rate of approximately 93%. This means that 93% of the main wastewater feed stream to the RO system will be recovered as product water and 7% of the feed stream will end up as concentrate.

LJS\J:\scopes\04w018\10000\FVD reports\Final GWP\r-gw discharge permit app.doc Foth & Van Dyke and Assoc., Inc. • 38
A process flow diagram for the proposed CRP is provided in Figure 6-2. This process will include the following facilities:
♦ Breakpoint chlorination (ammonia removal) ♦ Softening/Metals Precipitation ♦ Microfiltration (solids separation) ♦ pH adjustment ♦ Ion exchange (metals/inorganic salt removal) ♦ Reverse osmosis (volume reduction) ♦ pH adjustment ♦ Ion exchange (boron removal)
The CRP will result in two waste streams and a treated wastewater stream. The waste streams will include an RO concentrate stream which will be routed to the evaporator/crystallizer system for volume reduction and a microfiltration system sludge slurry which will be routed to the sludge handling process for dewatering. The treated wastewater stream will be discharged to the main wastewater treatment process final effluent pH adjustment tank. Note that alternate CRPs may be considered during the final design and construction phase of the Eagle Project. One alternative that may be considered is an evaporator/crystallizer system. This type of system could provide the same process functions as the system outlined above. Final selection of a CRP will be based on economic and technical considerations. 6.5.3.1 Breakpoint Chlorination Ammonia present in the raw wastewater feed stream will be rejected and concentrated by the reverse osmosis membranes used in the main wastewater treatment process. The ammonia will be present in the RO concentrate which will be routed to the CRP. A breakpoint chlorination process will be used to remove the ammonia from the RO concentrate. In this process, chlorine will be added to the wastewater. The chlorine oxidizes the ammonia through a progression of oxidation products including monochloramine, dichloramine, nitrogen trichloride, and finally nitrogen gas. The point at which nearly all the ammonia in the wastewater is oxidized to nitrogen gas, and additional application of chlorine results in free chlorine residual in the wastewater, is referred to as breakpoint chlorination. The stoichiometric weight ratio of chlorine to ammonia required to reach the breakpoint is 7.6:1. In practice, additional chlorine may need to be applied to account for consumption of chlorine in competing reactions. The optimal pH for breakpoint chlorination is typically in the range of 7.0 to 8.0. The breakpoint chlorination process will occur in the first of the two reaction tanks proposed for the CRP. Liquid sodium hypochlorite will be used as a chlorine source. Sodium hydroxide and sulfuric acid will be used for pH control in the reaction tank. Chemical storage and feed equipment will be provided. A mixer will provide rapid mixing of the wastewater and chlorine solution. Instrumentation will be provided for monitoring and control of the breakpoint chlorination process. Design flows and sizing parameters for the breakpoint chlorination process are provided in Table 6-2.
LJS\J:\scopes\04w018\10000\FVD reports\Final GWP\r-gw discharge permit app.doc Foth & Van Dyke and Assoc., Inc. • 39
6.5.3.2 Softening/Metals Precipitation A softening/metals precipitation process will be provided to remove metals from the main wastewater treatment process RO concentrate stream. The purpose of this process is to allow operation of the downstream RO system at a higher water recovery rate while minimizing the potential for scaling of the membranes by calcium and heavy metal precipitates. Sodium hydroxide will be added to raise the RO concentrate pH into the range of 9.0 to 11.0. In this pH range, the solubilities of the heavy metals present in the wastewater will be sufficiently reduced so that the metals will precipitate as metal hydroxides. Additionally, the solubilities of calcium and magnesium salts are minimal in this pH range and, consequently, calcium will precipitate out as carbonates while magnesium will precipitate out as a hydroxide. The softening/metals precipitation process will occur in the second of the two reaction tanks proposed of the concentration reduction process. Sodium hydroxide will be introduced into the wastewater in the reaction tank. A mixer will provide rapid mixing of the sodium hydroxide and the wastewater. A coagulant, such as ferric chloride, will be added to the reaction tank as required to coagulate the precipitates into larger size floc which can be more readily removed from the wastewater stream. The precipitates formed in the softening/metals precipitation process will be removed from the wastewater stream by the downstream microfiltration system. The softening/metals precipitation process will also be designed for silica removal. Silica removal may be required to prevent scaling of the downstream reverse osmosis membranes. Silica can be removed from wastewater through magnesium hydroxide co-precipitation. Silica is removed through magnesium silicate formation and adsorption of silica onto magnesium hydroxide floc. Where insufficient magnesium is initially available in the wastewater for precipitation of silica to the level required, magnesium can be added. Chemical storage and feed facilities are proposed for adding magnesium chloride to the wastewater to optimize silica removal. Magnesium chloride will be added to the first of the two reaction tanks proposed for the CRP. Silica precipitation will occur in the second of the two reactions tanks under elevated pH conditions. The softening/metals precipitation process facilities will include a reaction tank, a reaction tank mixing system, chemical storage and feed facilities for sodium hydroxide and ferric chloride, and instrumentation for monitoring and control purposes. Design flows and sizing parameters for the softening/metals precipitation process are provided in Table 6-2. 6.5.3.3 Microfiltration A microfiltration system is proposed for separation of the solids generated in the softening/metals precipitation process. The solids removed by the microfiltration system will be discharged to the sludge handling process. The product water from the microfiltration system will be discharged to the downstream reverse osmosis and ion exchange treatment systems. Microfiltration is a process in which wastewater is passed tangentially across the face of microfiltration membranes. The wastewater is forced through the membrane surface by applied hydrostatic pressure. Solids are rejected by the membrane surface and are retained in the microfiltration concentrate. The primary mechanism for removal of solids, in a microfiltration system, is physical “straining”. The degree of solids rejection will depend on the size and shape

LJS\J:\scopes\04w018\10000\FVD reports\Final GWP\r-gw discharge permit app.doc Foth & Van Dyke and Assoc., Inc. • 40
of the solids relative to the size of the membrane pores. Microfiltration membranes typically have pore sizes in the range of 0.1 to 3.0 microns with the pore size being selected based on the requirements of the given application. Under the proposed configuration, wastewater from the softening/metals precipitation process will be discharged into the microfiltration system “concentrate tank”. The wastewater will then be pumped from this tank to the microfiltration system where the feed stream will be separated into a solids concentrate stream and a permeate (product water) stream. The permeate stream will be routed to downstream treatment processes. The concentrate stream will be recirculated back to the microfiltration concentrate tank where it will mix in new wastewater coming in from the softening/metals precipitation process. A portion of the solids slurry in the microfiltration concentrate tank is periodically pumped to the solids handling process for dewatering. The main components of the microfiltration system include the concentrate tank, the microfiltration feed pumps, the microfiltration modules, the microfiltration cleaning system, and instrumentation for monitoring and control purposes. Three microfiltration process trains are proposed. Each train will be designed to accommodate 33% of the peak design flow. The three trains will be designed for parallel operation. The proposed configuration will allow continued operation of the microfiltration system if one of the process trains is off line for maintenance or repairs. A cleaning system will be provided for maintenance of the microfiltration membranes. Sodium hydroxide, sulfuric acid, and sodium hypochlorite are typically used in the cleaning process. Chemical storage and feed facilities will be provided for these chemicals. Additionally, a cleaning water tank and cleaning water feed system will be provided. Membrane cleaning wastewater will be routed back to the microfiltration system concentrate tank with eventual discharge to the sludge handling system. Design flows and sizing parameters for the microfiltration process are provided in Table 6-2. 6.5.3.4 pH Adjustment Permeate from the microfiltration system will be routed to a pH adjustment tank. As indicated previously, the pH of the wastewater will be increased to between 10.0 and 11.0 for the softening/metals precipitation process. This pH will be maintained through the microfiltration system. The pH of the microfiltration permeate will adjusted back down into the neutral range in the pH adjustment tank. The pH reduction is required for optimization of the downstream treatment processes. The pH adjustment system will include a reaction tank, a tank mixer, and chemical feed equipment. Sodium hydroxide and sulfuric acid storage and feed systems will be provided for pH control purposes. Design flows and sizing parameters for the final effluent pH adjustment system are provided in Table 6-2. 6.5.3.5 Weak Acid Ion Exchange System Microfiltration permeate from the microfiltration pH adjustment tank will be routed to the reverse osmosis feed storage tank. The permeate will be pumped from this tank to the downstream ion exchange and reverse osmosis systems. Biocide will be added to this tank as required to limit growth of bacteria on the downstream reverse osmosis membranes.

LJS\J:\scopes\04w018\10000\FVD reports\Final GWP\r-gw discharge permit app.doc Foth & Van Dyke and Assoc., Inc. • 41
Additionally, sodium bisulfite will be added to this tank as required to remove any chlorine residual present in the wastewater from the upstream breakpoint chlorination process. Removal of chlorine residual is required to protect the downstream ion exchange resins and RO membranes. Chemical storage and feed systems will be provided. Microfiltration system permeate will be pumped from the RO feed storage tank to a weak acid ion exchange system. The ion exchange system is provided to further reduce the level of heavy metals and inorganic salt cations remaining in the wastewater after the softening/metals precipitation and microfiltration processes. Reduction of these wastewater constituents will allow operation of the downstream RO system at a higher level of recovery and will thereby minimize the RO concentrate flow to the downstream evaporator/crystallizer process. The potential for membrane fouling through precipitation of metal hydroxides and inorganic salts increases with the RO recovery rate due to the increasing concentrations of these constituents within the RO system as a function of increasing recovery rate. Reducing the concentrations of these constituents in the initial RO feed stream will result in lower concentrations within the RO system, will reduce the potential for membrane fouling, and will thereby allow a higher recovery rate. The proposed ion exchange system will include feed pumps, multiple ion exchange columns, an ion exchange regeneration/backwash system, and instrumentation for monitoring and control purposes. Two ion exchange columns will be provided with each column being designed to handle 100% of the design peak flow. The columns will be operated in parallel. This configuration will allow continued operation of the ion exchange system in the event that either of the columns is off line for regeneration, maintenance, or repairs. The regeneration process will use acid to regenerate the ion exchange column resin. Regeneration waste will be routed back to the head end of the CRP for treatment. Design flows and sizing parameters for the ion exchange system are provided in Table 6-2. 6.5.3.6 pH Adjustment A pH adjustment system will be provided to control the pH of the wastewater going from the ion exchange system to the downstream reverse osmosis system. Processing of the wastewater through the weak acid ion exchange system will result in a reduction of the wastewater pH. A sodium hydroxide storage and feed system will be provided for pH adjustment. In-line pH control is proposed. 6.5.3.7 CRP Reverse Osmosis
Effluent from the weak acid ion exchange (IX) system will be pumped to the CRP RO system. The primary function of the CRP RO system will be reduction of the final volume of the waste stream discharged from the CRP. Additionally, the CRP RO system will provide polishing of the IX effluent, further reducing the concentrations of any residual heavy metals or inorganic salts present in the IX effluent. Two RO process trains will be provided. Each train will be designed for 50% of the peak design flow rate. The two trains will be operated in parallel. This configuration will allow continued operation of the RO system in the event that either of the CRP RO trains is off line for maintenance or repairs. Each train will include a high pressure feed pump, cartridge pre-filters, multiple RO element arrays, and miscellaneous control and monitoring devices. Storage and

LJS\J:\scopes\04w018\10000\FVD reports\Final GWP\r-gw discharge permit app.doc Foth & Van Dyke and Assoc., Inc. • 42
feed facilities for chemicals used for minimization of biological fouling (biocides) and/or chemical scaling (anti-scalants) will be provided for use as required. A membrane cleaning system will also be provided for maintenance of the RO membranes. Membrane cleaning wastewater will be routed back to the head end of the CRP for treatment. The RO system will be designed for operation at a recovery rate of approximately 93%. The estimated recovery rate is based on effluent quality requirements and on membrane scaling considerations. Permeate from the RO system will be routed to the downstream ion exchange system for additional treatment. Concentrate from the RO system will be routed to the evaporator/crystallizer process for final volume reduction. Design flows and sizing parameters for the RO system are provided in Table 6-2. 6.5.3.8 Boron Ion Exchange Boron removed by the main wastewater treatment process will be contained in the RO system concentrate routed to the CRP. Boron will not be significantly removed from the wastewater by softening/metals precipitation process, the microfiltration system, the weak acid ion exchange system, or the reverse osmosis system used in the CRP. Therefore, a final stage treatment system will be used for boron removal. An ion exchange system using boron selective resin will be used for this purpose. The boron selective ion exchange system will include a pH control system, feed pumps, multiple ion exchange columns, and an IX resin regeneration/backwash system. The pH control system will be used to increase the pH of the RO system effluent to the 10.0 to 11.0 range. In this pH range, boron will be predominantly present in the dissociated borate form which is more readily removed by the IX resin. Three IX columns will be provided with each column being designed to handle 33% of the peak design flow. The three columns will be operated in parallel. This configuration will allow continued operation of the IX system in the event that one of the columns is off line for regeneration, maintenance, or repairs. Effluent from the IX system will be routed to the final effluent pH adjustment tank where it will be combined with effluent from the main WWTP and discharged to the TWIS. The boron ion exchange system will either be regenerated on-site, or the ion exchange columns will be shipped to an off-site vendor for regeneration. If regeneration takes place on-site, the regenerate will be pumped to the evaporator. Design flows and sizing parameters for the boron IX system are provided in Table 6-2. The projected effluent quality for the IX system is shown in Table 6-1. 6.5.4 Sludge Handling Process A sludge handling process will be provided to dewater sludge discharged from the main wastewater treatment process solids contact clarifier and sludge from the CRP microfiltration system. A process flow diagram for the sludge handling process is provided in Figure 6-3. The sludge handling process will include the following equipment:
♦ Sludge storage tank ♦ Sludge feed pump ♦ Plate and frame filter press ♦ Filtrate pump station ♦ Chemical feed equipment

LJS\J:\scopes\04w018\10000\FVD reports\Final GWP\r-gw discharge permit app.doc Foth & Van Dyke and Assoc., Inc. • 43
Sludge from the solids contact clarifier and the microfiltration system will be pumped to the sludge storage tank. This tank will provide short term storage and equalization of the sludge. A pumping system will be provided to transfer sludge from the storage tank to the filter press. A plate and frame filter press is proposed for sludge dewatering. Polymer and/or coagulant will be added to the sludge, prior to the filter press, as required to optimize the sludge dewatering characteristics. The sludge will be dewatered to a 20% or greater solids content. Filtrate from the filter press will flow to a pump station wet well and will then be recirculated back to the head end of the CRP for treatment. Dewatered sludge will be contained in a storage area and will be managed in accordance with applicable regulations. Design flows and sizing parameters for the sludge handling process are provided in Table 6-2. 6.5.5 Evaporator/Crystallizer Process Reverse osmosis concentrate from the CRP will either be discharged to the evaporator/ crystallizer process or will be incorporated into the cemented mine backfill. An evaporator/ crystallizer system will used to treat concentrate in excess of that which can be used in the mine backfill operations, to treat concentrate during those periods of time when the backfill system is not in operation, or to treat concentrate in the event that it is determined to not be suitable for use in the cemented backfill. A process flow diagram for the proposed evaporator/crystallizer process is provided in Figure 6-3. The evaporator/crystallizer system will remove water from the RO concentrate. The objectives of this process are to minimize the volume of the RO concentrate and to generate a waste material that can be more readily managed in accordance with applicable regulations. A covered, contained storage area will be provided for temporary storage of the waste solids. The water removed from the RO concentrate during the evaporation/crystallization process will initially be in a vapor form. This vapor will be returned to a liquid form through a condensation process. The resulting “distillate” will be treated water meeting groundwater quality standards. The distillate will be routed to the final effluent pH adjustment tank where it will be combined with effluent from the main WWTP and discharged to the TWIS. Chemicals, including acid and/or anti-scalants, may be used, if required, to minimize fouling of the evaporator/crystallizer heat exchange surfaces. Chemical storage and feed systems will be provided as required. Design flows and sizing parameters for the evaporator/crystallizer process are provided in Table 6-2. 6.6 Description of Sludge Management
Two waste materials will be generated by the WWTP. The first waste material will be sludge from the sludge handling system. This system will dewater sludge generated by the main wastewater treatment process solids contact clarifier and sludge generated by the CRP microfiltration system. The dewatering process is anticipated to generate a sludge with a solids content of 20% or higher. The second waste material will be waste solids generated by the evaporator/crystallizer system.

LJS\J:\scopes\04w018\10000\FVD reports\Final GWP\r-gw discharge permit app.doc Foth & Van Dyke and Assoc., Inc. • 44
The waste solids from the sludge handling system and the evaporator/crystallizer system will be managed in accordance with applicable regulations. Covered, contained storage areas will be provided for temporary storage of the solids. In addition to solids generated by the wastewater treatment process, the CWBs will accumulate solids from the settling of suspended solids contained in the runoff and other wastewaters entering the basins. The solids that accumulate in the basins will be removed as required. The solids from the CWBs will be disposed of in the cemented mine backfill. 6.7 Instrumentation and Controls
The WWTP will include computerized automated control of the WWTP components. Displays associated with the computerized automated controls will provide the WWTP operators with information concerning key WWTP operating data such as wastewater flow rates and pH; the levels of the CWBs, reaction tanks, effluent storage tank, and chemical feed tanks; and the operating status of the major WWTP equipment and alarms. The operator will also be able to control the major WWTP operating functions, such as starting and stopping equipment, adjusting set point pHs and dosage rates for treatment chemicals, and selecting automatic or manual control of key treatment equipment and processes. 6.8 Adverse Weather Strategies
The WWTP equipment, with the exception of the solids contact clarifier, will be located in a building. The equipment will be operable under all weather conditions. Additionally, discharge to the TWIS will be maintained throughout the year since the system will be a buried infiltration gallery (see Section 7). 6.9 Quality Control
The WWTP will be rigorously operated, controlled, maintained, and monitored in order to consistently provide a treated wastewater of sufficient water quality to meet the design discharge standards. A quality control program will be developed to ensure consistently reliable performance of the WWTP. Key components of the quality control system will include the following:
‚ A certified WWTP operator experienced in the operation and maintenance of the treatment processes and equipment used in the wastewater water treatment system.
‚ Standardized routine operation and maintenance procedures
‚ Instrumentation systems designed to allow remote operator monitoring of all critical
WWTPs operations.
‚ Standardized procedures for routine calibration of all wastewater system instrumentation devices such as flow meters, pH meters, ORP meters, conductivity meters, etc.
‚ Standardized procedures for storage and handling of wastewater treatment chemicals.

LJS\J:\scopes\04w018\10000\FVD reports\Final GWP\r-gw discharge permit app.doc Foth & Van Dyke and Assoc., Inc. • 45
‚ Standardized procedures for approved alternate modes of operation in the event that an individual treatment process is out of operation.
‚ Standardized procedures for responding to WWTP alarm conditions including
immediate shutdown of all WWTPs if effluent quality may be compromised by the event triggering the alarm.
‚ Routine testing of raw wastewater, final effluent, and effluent from intermediate
treatment processes as required to verify proper and consistent system performance.
‚ Standardized procedures for routing treated water from the effluent storage tank back to the CWBs in the event that the effluent quality does not meet the design discharge standards.
‚ Wastewater laboratory personnel certified in all analyses required for monitoring of the
WWTP.
‚ Standardized wastewater sample collection, sample analysis, and analysis reporting procedures.
‚ Implementation of a laboratory quality assurance/quality control plan.
6.10 Operation and Maintenance
The general duties associated with operation will include:
‚ Monitor the operating status of wastewater treatment processes and equipment.
‚ Monitor the wastewater influent and effluent quality and make necessary process adjustments to maintain the required level of treatment.
‚ Collect samples for testing.
‚ Daily inspection of equipment.
‚ Record keeping.
‚ Coordination of routine maintenance or repairs.
‚ Troubleshooting.
‚ Facilities management.

LJS\J:\scopes\04w018\10000\FVD reports\Final GWP\r-gw discharge permit app.doc Foth & Van Dyke and Assoc., Inc. • 46
Preventative maintenance will be a priority for the project. Facility systems which will require routine maintenance include the following:
♦ Monitoring and control instrumentation. ♦ Chemical storage, handling, and feeding systems. ♦ Reverse osmosis membranes ♦ Microfiltration membranes ♦ Ion exchange resins ♦ Evaporator/crystallizer equipment ♦ Electrical distribution system. ♦ Plant utilities, e.g., heating, ventilating, instrument air, non-potable water. ♦ Pumps and process equipment.
6.11 Contingencies
The wastewater treatment system will be designed to handle various contingencies. A listing of contingencies and remedies include the following:
♦ A rain or snow melt event which exceeds the design basis of the CWBs as described in Section 8. Excess water from a rain or snow melt event which exceeds the design capacity of the contact water storage basins will be routed to the TDRSA for emergency temporary storage as described in the contingency plan presented in the Mining Permit Application (Foth & Van Dyke, 2006).
♦ Wastewater treatment facility equipment failure. The contact water storage basins are
designed to hold 14 days of mine drainage water. This allows sufficient time to repair or replace the faulty equipment.
♦ Wastewater treatment facility process upset. The wastewater effluent will be continually
monitored for key indicator parameters to verify the proper operation. Out of specification effluent will be pumped back to the contact water storage basins for re-treatment. The storage capacity of the CWBs exceeds 14 days of inflow to the mine and will allow sufficient time to correct the process upset.
In addition to the above identified contingencies, the wastewater treatment facility will be designed in general to be able to handle other contingencies through the storage of influent water or through the operational flexibility of the facility.
LJS\J:\scopes\04w018\10000\FVD reports\Final GWP\r-gw discharge permit app.doc Foth & Van Dyke and Assoc., Inc. • 47
7 Land Application of Treated Wastewater
7.1 Discharge Method - Rapid Infiltration
The treated effluent will be discharged to groundwater through the TWIS. The TWIS will be located in highly permeable soil. The treated effluent will be applied evenly within five infiltration cells and discharged to groundwater. Because of the high water quality being discharged from the water treatment system, the land application system will not require any further water treatment from on-site soils or vegetation. Soil attenuation and vegetative uptake of contaminants are not part of the overall treatment process. The treated effluent will be applied to the TWIS through five separate infiltration cells. This design will allow at least one cell to be out of service for resting and/or maintenance while the other cells are being loaded. 7.2 Basis of Design
7.2.1 Surface Runoff Prevention Methods The TWIS is located in a relatively flat area with a slope of less than 1%. With the low slope and a mounded soil cover over the infiltration system, storm water will not run on to the TWIS. The TWIS will be designed to have the distribution pipes buried in a raised mound. The design will minimize storm water runoff from draining onto the infiltration cells and will also protect the piping system from freezing. The area around the infiltration cells will have a peripheral drainage system to intercept water and route it away from the infiltration cells. 7.2.2 Hydraulic Design The TWIS is designed for a flow rate of at least 400 gallons per minute (gpm). This rate is conservative in that it is greater than the design maximum flow rate of 350 gpm for the WWTP. The infiltration rate of the soil was measured through field testing with a double ring infiltrometer. The infiltration rate was measured at 62 feet per day. Appendix B contains the infiltrometer test data. The design annual hydraulic loading rate is required to be less than 3% of the permeability as determined by the infiltrometer test method. This requirement is contained in R 323.2233 (4)(a)(v). With a permeability of 62 feet per day, the hydraulic loading rate shall be 3% of the measured 62 ft/d or about 1.8 ft/d. A more conservative hydraulic loading value of about 0.5 feet per day was selected for the design of the infiltration cells as noted in Appendix E. 7.2.3 Engineering Plans Figures 7-1 and 7-2 show the location and engineering plans for the TWIS. 7.3 Discharge Management Plan
The discharge management plan required per R 323.2218 (2)(c)(iii) is suitable as a stand alone document and is provided in Appendix J.

LJS\J:\scopes\04w018\10000\FVD reports\Final GWP\r-gw discharge permit app.doc Foth & Van Dyke and Assoc., Inc. • 48
8 Contact Water Basins
8.1 Basis of Design
The CWBs are designed pursuant to R 323.2237. The design basis for the CWBs includes state-of-engineering practices that will demonstrate system performance exceeding state regulatory requirements. Facility contact water is primarily from two sources, mine dewatering and surface water runoff and snow melt from surface operations. The design intent of the contact basins is to collect and contain contact water prior to treatment. 8.1.1 Design Capacity Appendix H contains a technical memorandum on the sizing of the CWB. Several factors were considered in sizing the CWB. These factors include:
♦ KEMC’s desire to have enough basin capacity for up to 14 days of storage for maintenance of the WWTP.
♦ Storage for normal mine inflow and a 100-yr 24-hour storm event which would generate
peak storm water runoff to the CWB.
♦ Peak runoff events from combined snowmelt and spring rain. Table 8-1 presents a summary of the required CWB size based upon mine inflow and precipitation events. The supporting calculations are provided in Appendix H. Based upon the results, the critical storage capacity will be required for the snow melt/spring rainfall event.
Table 8-1 Contact Water Basin Design Criteria
Criteria Required Capacity
14 days of storage of mine inflow 5.0 million gal 100-yr 24-hr storm event 4.7 million gal 50-yr snow melt/spring rain runoff event 7.8 million gal
Prepared by: JOS1 Checked by: SVD1
The CWB has a total design capacity of approximately 10.5 million gallons including freeboard and sediment loading. Excluding the freeboard and sediment loading, the operating capacity of the basin(s) is approximately 7.8 million gallons. 8.1.2 Liner System The proposed liner system for the CWBs will be either a 40-mil thick polyvinyl chloride (PVC) or 60-mil thick HDPE geomembrane underlain by a GCL. Because of the absence of clay soils in the vicinity of the Eagle Project, KEMC has elected to use a GCL in lieu of a 2-foot thick clay

LJS\J:\scopes\04w018\10000\FVD reports\Final GWP\r-gw discharge permit app.doc Foth & Van Dyke and Assoc., Inc. • 49
liner. A cross-section of the liner system is shown on Figure 8-1. Overlying the geomembrane liner will be geotextile fabric and 6 inches of sand for protection. 8.2 Site Development
8.2.1 Subgrade Excavation In order to provide sufficient storage capacity, the contact basin will be excavated approximately 10 to 12 feet below grade. The upper 3 feet of the basin will be constructed of compacted fill soil. The side of the basin will be graded to not steeper than a 4:1 (H:V) slope. Upon subgrade excavation, the surface will be inspected for oversized material (such as boulders) that may cause damage to the liner components. These materials will be removed from the subgrade. The subgrade surface will then be recompacted and proof-rolled. Proof-rolling will establish the stability of the subgrade. Areas of the subgrade found to be unstable as determined by proof-rolling, will be over-excavated and replaced with clean, on-site backfill compacted to 95% of the maximum dry density as determined by the modified Proctor test (ASTM D 1557), or 100% of the maximum dry density as determined by the Standard Proctor Test (ASTM D 698). Subgrade fill will consist of on-site soils free of organic matter, deleterious materials, and over-sized material that may cause damage to the liner components. 8.2.2 Liner System Construction After subgrade proof-rolling, the subgrade will be final inspected and certified. The GCL will be installed directly on the subgrade. Individual GCL rolls will be installed from the top of the dike and rolled across the subgrade. The edges of each GCL roll will be overlapped approximately 6 inches for longitudinal seams and a minimum of 20 inches on end seams. Typical GCL rolls are 150 feet long and 15.5 feet wide. All panels will be deployed such that edges are parallel to the slope of the sidewall. Panels will not be deployed during wet weather or in standing water. Typical GCL product data, manufacturing specifications and installation specifications are provided in Appendix K. After GCL installation quality assurance testing and certification, the geomembrane liner will be installed. The geomembrane liner will either consist of 40-mil PVC or 60-mil HDPE. Typically, the HDPE geomembrane panels are 22.5 by 560 feet long. PVC panels can be prefabricated at the manufacturing facility in a variety of sizes. The geomembrane will be unrolled from the top of the berm of the basin down the 4:1 (H:V) sideslopes across the floor. The panels will be deployed parallel to the sideslopes such that all seams will be orientated parallel to the slope. After the panels are deployed, the panels will be welded together. Depending upon the type of geomembrane selected (either PVC or HDPE) panel seaming will require different methods. For PVC, individual panels are seamed using solvent. Much of the PVC seaming is conducted at the factory to attain higher levels of seam integrity. HDPE panel seaming is done in the field using either extrusion or fusion methods.

LJS\J:\scopes\04w018\10000\FVD reports\Final GWP\r-gw discharge permit app.doc Foth & Van Dyke and Assoc., Inc. • 50
Fusion welding produces two parallel welds separated by an air channel for testing. This technique is commonly deployed for seaming two parallel panels. Extrusion welding produces a bead of extruded HDPE to seam panels. Commonly, this method of seaming is used with irregular panel edges where a fusion device cannot be used and for capping repairs in panels. Non-destructive quality assurance (QA) testing is conducted on every welded seam. Again, depending upon the type of geomembrane deployed, QA testing will be different. QA testing of seamed PVC involves the use of an air lance to detect unwelded or improperly welded portions of a seam. The quality assurance technician, using the air lance, will direct a jet of pressurized air aimed perpendicularly to the seamed edge and any unbonded or loose areas will visibly flap showing an imperfection through the weld. These areas are recorded on a repair log, repaired, and re-checked. QA testing of HDPE welds utilizes two methods for the two seam types. For fusion welds, the seam is tested for integrity by filling the air channel with air and observing any pressure drop over a specified time period. If a pressure drop is observed (following a stabilization time period), the seam is not acceptable and further testing to document the failed location is performed. QA testing of extrusion welds involves the use of a vacuum box and a pressure gauge. A vacuum box is placed over the welded seam. A soapy solution is coated over the seam and then a vacuum is applied. If bubbles are observed being released from the seam, a defect is present in the seam. Weld defects are repaired by capping with a piece of HDPE, which is welded to the parent panel. Non-destructive seam testing is then performed on the repaired seam. All QA testing is observed and recorded on seam testing logs, as well as the location of all repairs. 100% of field seams are non-destructively tested. In addition to the non-destructive QA seam testing, destructive seam testing is also employed to check the strength and continuity of the welded seams. Destructive seam testing requires removing a sample of the welded seam and testing for “peel” and “shear” strength using a tensiometer. Destructive samples are typically removed every 500 linear feet of welded seam. Areas where the samples have been removed are recorded and capped with an HDPE or PVC panel. Peel and shear testing are index tests used to determine the continuity and strength of the weld quality. Typical HDPE and PVC product data, manufacturing specifications, and installation specifications are included in Appendix K. Following geomembrane installation, quality assurance testing and certification, the overlying geotextile will be deployed. The geotextile panels are typically 15 feet wide by 300 feet long and are deployed by pulling the panels down the sideslopes, overlapping the edges by a minimum of 18 inches. Separate pieces of geotextile will be joined by overlapping or sewing. Six inches of sand will then be placed over the geotextile for added protection 8.2.3 Quality Assurance Reporting
Quality Assurance (QA) observation, testing and reporting will be conducted by a qualified quality assurance technician under the direction of a Professional Engineer. QA will be conducted for compacted soil base, liner components (including the GCL and geomembrane), and protection layer (geotextile and 6-inch sand layer) as described in the following sections. A

LJS\J:\scopes\04w018\10000\FVD reports\Final GWP\r-gw discharge permit app.doc Foth & Van Dyke and Assoc., Inc. • 51
quality assurance/quality control plan will be prepared prior to construction and will outline all aspects of the QA program. The following QA procedures are based upon good engineering practice and applicable sections of the MDEQ rules. 8.2.3.1 Subgrade Surface Initially, the subgrade surface will be proof-rolled by a smooth drum roller to densify the surface soils. The QA inspector will observe and document the subgrade surface for the presence of any material that would be potentially damaging to the overlying liner components and documentation that these materials are removed. All fill materials utilized to bring the basin area up to design grade will be tested as summarized in Table 8-2.
Table 8-2 QA Inspector Tests
Test Minimum Frequency Acceptable Test Values Compaction characteristics: modified Proctor (ASTM D 1557) or standard Proctor (ASTM D 698)
1 test per 500 ft2 of subbase
NA
In-Place Density and Percent Compaction:
(ASTM D 2922 or ASTM D 1556)
100-ft grid/1-ft lift 95% of modified Proctor or 100% of standard Proctor
maximum dry density
Prepared by: JOS1 Checked by: SVD1
8.2.3.2 GCL QA activities for installation of the GCL will consist of the following:
♦ Observation of the subgrade for acceptability prior to installation of the GCL.
♦ Review of manufacturer’s test data to assure the GCL meets project requirements.
♦ Observation of GCL installation to assure compliance with manufacturer’s installation specifications and the QA/QC plan. The QA technician will be on-site at all times during the GCL installation.
Attached as Appendix K are sample GCL specifications outlining the material and installation requirements for the GCL.

LJS\J:\scopes\04w018\10000\FVD reports\Final GWP\r-gw discharge permit app.doc Foth & Van Dyke and Assoc., Inc. • 52
8.2.3.3 Geomembrane Liner QA activities for installation of the geomembrane component (HDPE or PVC) will consist of the following:
♦ Observation of the GCL for acceptability prior to installation of the geomembrane. ♦ Review of manufacturer’s test data to assure the geomembrane delivered to the site meets
project specifications.
♦ Observation of geomembrane installation to assure compliance with project specifications and manufacturer’s installation specifications. The QA technician will be on-site at all times during the geomembrane installation.
On-site QA includes:
♦ Sample selection of on-site geomembrane for off-site conformance testing. ♦ Documentation of proper on-site storage of geomembrane.
♦ Visual review of geomembrane as it is unrolled and deployed at the site.
♦ Monitoring geomembrane panel placement.
♦ Monitoring trial seam tests.
♦ Monitoring field seaming procedures and documenting non-destructive testing of all field
seams and seam repairs.
♦ Selection of destructive sample locations.
♦ Destructive seam samples will be performed on at least 1 field-seamed sample per day per seaming crew or machine. The sampling frequency shall be at least 1 test every 500 feet of seam, not including repairs.
♦ Interpretation of destructive seam sample tests.
♦ Documentation that field seaming has not been performed in adverse weather conditions.
♦ Documentation that anchor trench construction has been completed as specified.
♦ Documentation that the geomembrane is covered with the overlying protective material
in a timely manner, no later than 30 days after installation.. Attached as Appendix K are sample HDPE and PVC specifications outlining the material and installation requirements for the geomembrane.

LJS\J:\scopes\04w018\10000\FVD reports\Final GWP\r-gw discharge permit app.doc Foth & Van Dyke and Assoc., Inc. • 53
8.2.3.4 Geotextile Protection Layer QA activities during installation of the geotextile protection layer will include documentation that installation procedures do not damage the underlying liner components. The QA technician will be on-site at all times during geotextile installation to observe installation procedures, document that adjacent panel overlap/sewing is in accordance with project specifications, and document that the geotextile has been placed as specified, prior to placement of the overlying sand protection layer. Attached as Appendix K are sample specifications outlining the material and installation requirements for the geotextile. 8.2.3.5 Sand Protection Layer QA activities during placement of the 6-inch thick sand protection layer over the geotextile will include:
♦ Full-time observation by the QA technician to ensure that the underlying liner components are not damaged by sand placement procedures.
♦ Observation that the sand protection layer does not contain any material that could
potentially damage the underlying liner components.
♦ Thickness testing on a 100-foot grid.
♦ Gradation analyses of the sand protection layer. 8.2.4 Certification Report Following completion of liner installation, and prior to placing in service, a certification report will be prepared documenting that the installation of the various liner components was performed in accordance with project specifications and manufacturer’s specifications. The report will include, at a minimum, the following information:
♦ Certification by a professional engineer, registered in the State of Michigan, that, based on his/her knowledge and review of the construction records, the construction has been performed in conformance with the engineering plans and specifications, and in accordance with the conditions of the Groundwater Discharge Permit.
♦ Detailed narrative describing the construction events in chronological order and results of
the quality assurance testing.
♦ Daily field reports prepared by the on-site QA technician.
♦ Field and laboratory test data relevant to subgrade preparation.
♦ Field and laboratory test data relevant to installation of geosynthetic components of the liner (GCL, geomembrane, geotextile).
♦ Field and laboratory test data relevant to sand protection layer placement.

LJS\J:\scopes\04w018\10000\FVD reports\Final GWP\r-gw discharge permit app.doc Foth & Van Dyke and Assoc., Inc. • 54
♦ Discussion of any construction material or equipment which deviated from the engineering plans and specifications, reasons for deviation, methods to bring the deviation into compliance, and approval of deviations by the MDEQ.
♦ Photographs documenting all aspects of construction.
♦ Record drawings, sealed by a licensed professional engineer, documenting the “as
constructed” elevations of the various components of the construction (± 0.5 feet), locations of field testing performed, geomembrane panel layout, and cross sections of the construction.
8.3 Basin Pumping Systems
Contact water from the basins will be pumped to the WWTP by submersible pumps. The submersible pump will be installed in 18” to 24” diameter SDR-11 HDPE as presented on the cross section in Figure 8-1. Within each riser a 350-gpm pump will be installed. The riser will be perforated or slotted to allow continuous water flow to pumps. Using a sideslope riser approach for the pumps will eliminate separate wet wells that would require lateral conveyance pipes that would perforate the liner. Liquid from the basins will be pumped through a double containment force main to the treatment plant. Final design of pipe sizes will be made upon final selection of the riser pumps.

LJS\J:\scopes\04w018\10000\FVD reports\Final GWP\r-gw discharge permit app.doc Foth & Van Dyke and Assoc., Inc. • 55
9 Proposed Discharge and Groundwater Monitoring During Operations
KEMC will implement a detailed monitoring program for the WWTP and TWIS at the Eagle Project Site. Per the requirements of R 323.2223 the monitoring program will consist of:
♦ Real time performance monitoring of the effluent coming from the project’s WWTP.
♦ Quarterly monitoring of the effluent to the TWIS for parameters specified in R 323.2222(3).
♦ Quarterly monitoring of groundwater monitoring wells at compliance monitoring points
located per R 323.2224.
♦ Quarterly monitoring at background monitoring wells at locations that are upgradient of the TWIS and main surface facility. Note that the designated background monitoring wells will serve as background monitoring points for the TWIS and main mining facility.
As described in Section 3, background monitoring has been completed in the vicinity of the proposed Eagle Project and for purposes of this application has been used to establish probable standards. The wells that will be used for compliance and background monitoring at the TWIS and mine site have not been installed at this time. They cannot be installed until the review process for the Mining Permit Application has progressed sufficiently for KEMC to know that the facility footprint will not be altered as a result of the State’s review of the Alternatives Analysis in the Environmental Impact Assessment. At that time KEMC will install the proposed compliance wells and complete background monitoring at each designated well. Each well will be sampled six times over a period of six months to one year. The data will be summarized and analyzed via appropriate statistical methods similar to those described in Appendix D. The updated data on background concentrations and standards will be provided to the MDEQ prior to startup of the WWTP and TWIS. During operations, compliance monitoring reports (R 323.2225) will be supplied to the MDEQ on a quarterly basis. 9.1 Effluent Monitoring
Effluent monitoring will consist of the following:
♦ Real time continuous monitoring of the specific conductance in the treated effluent tank. This monitoring will provide a rapid assessment of RO units performance.
♦ Quarterly monitoring of the effluent for aluminum, chloride, sodium, iron, and
manganese to demonstrate compliance with R 323.2222(3). The effluent from the WWTP will be high quality water that contains very little total dissolved solids (TDS). TDS is controlled largely by the concentration of major ions that will primarily be removed by the proposed RO system. Monitoring the TDS (by way of specific conductance) in the treated effluent tank will provide a simple means of continuously monitoring basic system

LJS\J:\scopes\04w018\10000\FVD reports\Final GWP\r-gw discharge permit app.doc Foth & Van Dyke and Assoc., Inc. • 56
performance. If the measured specific conductance in the treated effluent tank exceeds operational thresholds, the treatment system will be instrumented to automatically send water from the effluent tank back to the lined CWB until system performance is reestablished. 9.2 Groundwater Monitoring
Groundwater monitoring will take place at a variety of monitoring points to assess system performance with regards to infiltration and compliance with groundwater quality standards per the requirements of R 323.2223. 9.2.1 Monitoring Wells This section describes the existing and proposed monitoring wells that will be used to assess system performance and compliance with groundwater quality standards. 9.2.1.1 Infiltration Performance Monitoring In addition to monitoring wells that will be used for assessing compliance, the design of the TWIS includes the installation of shallow observation pipes within the infiltration cells. The location of the observation pipes are displayed in Figures 7-1 and 7-2. The purpose of these observation points is to confirm that water is not building up within the infiltration cells. KEMC will monitor the water levels within the observation pipes on a weekly basis. Existing well QAL031D is located on the down gradient edge to the infiltration system. During the construction phase and through the first year of operations, well QAL031D will be monitored on a weekly basis for groundwater elevation. The purpose of monitoring well QALO31D is to assess mounding of the water table beneath the infiltration system during the initial years of operation. 9.2.1.2 Background Monitoring Wells Figure 7-1 displays the location of existing well QAL026A and proposed well QAL026D. These wells are located upgradient of the TWIS and mine site and will serve as background groundwater monitoring points for the TWIS and other mining related facilities such as the TDRSA and lined CWB. Well QAL026D will be installed per the requirements of R 323.2223 as summarized on the well construction diagram in Figure 7-1. 9.2.1.3 Compliance Monitoring Wells R 323.2224(1) requires that compliance wells be: 1) on land leased/owned by the operator; 2) located at points that will allow for effective sampling; and, 3) no more than 150 ft from the point of discharge of the treated water. KEMC is proposing to install compliance monitoring wells at four locations around the TWIS that meet these criteria. As shown on Figure 7-1, three proposed compliance monitoring wells (QAL050A, QAL051A, and QAL052A) will be installed on the east side of the TWIS 150 ft from the infiltration system. The wells will be constructed with 10 ft screens that intercept the existing water table. Piezometer QAL051D will be nested with QAL051A and will be screened at the base of the D Zone per the requirements of R 323.2223(4). Due to the mounding and local alteration of flow conditions at the TWIS, a proposed compliance monitoring well (QAL053A) will also be

LJS\J:\scopes\04w018\10000\FVD reports\Final GWP\r-gw discharge permit app.doc Foth & Van Dyke and Assoc., Inc. • 57
installed on the west side of the TWIS. QAL053A will also be installed with a 10 ft well screen that intercepts the existing water table. 9.2.1.4 Monitoring of Surface Water Quality The hydrogeologic investigation that has been completed for this Groundwater Discharge Permit Application (Appendix B) has identified the Salmon Trout River East Branch as the venting point for groundwater in the vicinity of the TWIS. To demonstrate compliance with applicable surface water quality standards, specifically mercury, KEMC is proposing to monitor groundwater quality at downstream well QAL054 and stream gage STRE002, STRE006, STRE012 and CDRM004. The location of these monitoring points are displayed on Figure 9-1. 9.2.2 Sampling Frequency Compliance and background monitoring wells will be sampled on a quarterly basis for groundwater quality parameters and groundwater elevation. 9.2.3 Parameters Table 9-1 provides a list of the groundwater quality parameters that will be included in the quarterly and annual compliance monitoring program. 9.2.4 Sampling Procedures. The collection and analysis of surface water and groundwater samples will be completed in accordance with the Eagle Project’s Quality Assurance Project Plan (North Jackson Company 2004a) and Standard Operating Procedures (North Jackson Company 2004b) which have been provided to the MDEQ and describe the following per R 323.2223:
♦ Well purging procedures. ♦ Procedures to prevent cross contamination. ♦ QA/QC program including the use of field blanks and duplicates. ♦ Procedures for collecting groundwater and surface water field data. ♦ Sample preservation, documentation and chain-of-custody procedures. ♦ Data validation procedures. ♦ Well installation, development and abandonment procedures.
9.2.5 Data Analysis and Presentation During operations, groundwater quality data will be statistically assessed for distributional changes as a result of site operations. Statistical methods will include testing for trends in water chemistry, and comparing constituent concentration levels to those observed in background or upgradient locations. Appropriate parametric or nonparametric statistical methods will be selected in consideration of the observed data characteristics, namely, the distributional form of the data and the degree of left censuring (amount of data below detection). In addition, sources of variation in the data unrelated to site activities, such as seasonality, will be statistically estimated and controlled. Relevant documents containing guidance for selecting appropriate statistical tests are:

LJS\J:\scopes\04w018\10000\FVD reports\Final GWP\r-gw discharge permit app.doc Foth & Van Dyke and Assoc., Inc. • 58
Table 9-1 Proposed Groundwater Quality Monitoring Program
Parameter List and Sampling Frequency
Parameter Frequency Analytical Method Method
Reporting Limit Units Alkalinity, Bicarbonate Quarterly USEPA-310.1 2.0 mg/l Alkalinity, Carbonate Quarterly USEPA-310.1 2.0 mg/l Aluminum Annual USEPA-6010B 50 ug/l Antimony Annual USEPA-6020 5.0 ug/l Arsenic Quarterly USEPA-6020 2.0 ug/l Barium Annual USEPA-6020 20 ug/l Beryllium Annual USEPA-6020 1.0 ug/l Boron Quarterly USEPA-6010B 100 ug/l Cadmium Annual USEPA-6020 0.50 ug/l Calcium Annual USEPA-6010B 0.50 mg/l Chloride Quarterly USEPA-325.2 1.0 mg/l Chromium Annual USEPA-6020 5.0 ug/l Cobalt Annual USEPA-6010B 10 ug/l Copper Quarterly USEPA-6020 5.0 ug/l Fluoride Annual APHA 4500-F C 0.10 mg/l Iron Quarterly USEPA-6010B 20 ug/l Lead Annual USEPA-6020 1.0 ug/l Lithium Annual USEPA-6010B 8.0 ug/l Magnesium Annual USEPA-6010B 0.50 mg/l Manganese Quarterly USEPA-6010B 20 ug/l Mercury Quarterly USEPA-1631E 0.25 ng/l Molybdenum Annual USEPA-6020 10 ug/l Nickel Quarterly USEPA-6020 25 ug/l Nitrate Quarterly USEPA-353.2 0.05 mg/l Potassium Annual USEPA-6010B 0.50 mg/l Selenium Quarterly USEPA-6020 1.0 ug/l Silver Annual USEPA-6020 0.20 ug/l Sodium Quarterly USEPA-6010B 0.50 mg/l Sulfate Quarterly USEPA-375.4 2.0-5.0 mg/l Strontium Annual USEPA-6010B 50 ug/l Thallium Annual USEPA-200.8/6020 2 ug/l Vanadium Annual USEPA-200.8/6020 10 ug/l Zinc Annual USEPA-6020 10 ug/l Redox Quarterly Field Na mV Field pH Quarterly Field NA su Groundwater Elevation Quarterly Field NA ft MSL Specific Conductance Quarterly Field NA umhos/cm
Prepared by: SVD1
Checked by: JSK
LJS\J:\scopes\04w018\10000\FVD reports\Final GWP\r-gw discharge permit app.doc Foth & Van Dyke and Assoc., Inc. • 59
♦ MDEQ, 2002. Sampling Strategies and Statistics Training Materials for Part 201 Cleanup Criteria.
♦ Gilbert, R.O., 1987. Statistical Methods for Environmental Pollution Monitoring, Van
Nostrand Reinhold, New York.
♦ USEPA, 2000. Practical Methods for Data Analysis–EPA QA/G-9, EPA/600/R-96/084.
♦ USEPA, 1992. Statistical Analysis for Groundwater Monitoring Data at RCRA Facilities – Addendum to Interim Final Guidance, PB89-151047.
On a quarterly basis, compliance monitoring data will be submitted to the MDEQ. Data will be submitted in appropriate electronic formats. On an annual basis KEMC will submit to the MDEQ an annual Mining and Reclamation Report as required under R 425.501. The Annual Mining and Reclamation Report will include a compilation of groundwater quality summary tables and water table maps that assess overall project compliance with various environmental regulations as well as compliance with the Groundwater Discharge Permit requirements regulating the operations of the WWTP and TWIS. It is expected that KEMC will submit multiple copies of the annual report to MDEQ’s designated project manager for the Eagle Project who will coordinate MDEQ’s review of the Eagle Project’s annual compliance data.

LJS\J:\scopes\04w018\10000\FVD reports\Final GWP\r-gw discharge permit app.doc Foth & Van Dyke and Assoc., Inc. • 60
10 Compliance with Antidegradation In a letter dated September 14, 2005 the MDEQ issued a preliminary determination regarding proposed groundwater discharge at the Eagle Project site. That determination is as follows:
‚ The proposed discharge to groundwater represents a new loading of mercury to surface waters of the state and therefore R 323.1098 applies to the project.
‚ R 323.1098(4)(b)(i) and (iii) applies for potential mercury anticipated in the discharge.
KEMC does not agree with the MDEQs interpretation on the application of R 323.1098 to the groundwater discharge at the Eagle Project site. The discharge underling this application is to groundwater at a location more than 4,500 feet from the nearest surface water and will not result in any measurable increased loadings of any pollutants to surface waters of the state through venting or other processes. While KEMC is reserving its rights to challenge this determination at a later date, the following requested information is being provided:
‚ An analysis of the economic and social development contribution to the area by the Proposed Eagle Project per R 323.1098(4)(a).
‚ Demonstration that other Lake Superior Basin-Bioaccumulative Substances of
Immediate Concern (LSB-BSIC) as listed in R 323.1043(pp) will not be present in the discharge.
‚ Documentation satisfying R 323.1098(4)(b)(i) and (iii) that mercury levels in the
discharge are being reduced through cost-effective pollution prevention alternatives and by the application of best technology in process and treatment (BTPT) that has been adequately demonstrated and is reasonably available in the market place.
‚ Advection dispersion analysis demonstrating that groundwater concentrations of
mercury will be below 1.3 ng/l at the potential venting point. 10.1 Economic Benefits
The purpose of this section is to address the requirements of R 323.1098(4)(a). The development of the Eagle Project will result in a variety of economic benefits for the Marquette County area. Specifically, the Eagle Project will increase employment; will encourage industrial, commercial, and residential growth; and will provide social benefits to the project area. In addition, the project will improve transportation linkages which will result in other benefits to the local economy. The project will also generate revenue for state and local taxing entities which in turn will promote economic and social benefits for the local area. These benefits are summarized in the following sections. 10.1.1 Estimated Employment The projected personnel requirements during operations are based on an operating schedule of eleven hours per shift, two shifts per day. It is estimated that the mine will operate about 250 days per year considering holidays and snow days. On-site personnel requirements during operations is expected to begin at 87 employees during the first year of operation with an

LJS\J:\scopes\04w018\10000\FVD reports\Final GWP\r-gw discharge permit app.doc Foth & Van Dyke and Assoc., Inc. • 61
anticipated increase to about 110 employees at full production. Table 10-1 shows the maximum expected number of employees for the Eagle Project for various professional classifications.
Table 10-1 Project Employment
Mining Clerical/Accounting HR HSE GM Total
Salary Hourly
24 65
7 2 10 2 45 65
Total 89 7 2 10 2 110 HR – Human Resources HSE – Health Safety and Environment GM – General Management 10.1.2 Economic Improvements The economic effects of the Eagle Project on Michigamme Township and Marquette County include:
♦ Capital investment ♦ Jobs, salaries and benefits ♦ Local, state and federal taxes ♦ Local and state royalties
KEMC has estimated that capital investment of approximately $117 million will be required for pre-production development and construction, mine equipment, mine surface facilities, county road upgrades, rail head load-out area, etc. In addition, the working capital to operate the mine is estimated at $4.8 million annually. Much of the capital and operating purchases will likely be from local vendors and suppliers. This will stimulate economic growth as increases in sales and employment typically lead to increased spending on consumer goods. Table 10-1 lists the approximate number of employees required for the Eagle Project. Approximately 87 personnel are expected to be employed at the beginning of construction increasing to about 110 employees at full production. This employment level will be sustained until the end of mining. About 75% of the mine employees are expected to be local hires. The major employment benefit to the Marquette County area will be in the period of construction and operations. During this time period the capital and operating purchases made by KEMC will create an economic stimulus that results in new jobs in the Marquette County area. State and local revenues that will be positively impacted by the Eagle Project include individual income tax, general sales tax, transportation tax, road tax and property taxes. Royalties will also be paid for state leases and private leases.

LJS\J:\scopes\04w018\10000\FVD reports\Final GWP\r-gw discharge permit app.doc Foth & Van Dyke and Assoc., Inc. • 62
10.1.3 Improvements to Present Road and Rail Systems KEMC proposes to make improvements to the portions of an approved trucking route, including the nine miles of Triple A Road from the mine site to CR 510 and three miles of CR 510 between the Triple A Road and CR 550. The road improvements include:
♦ Completing a geotechnical and engineering design on the proposed road improvements
♦ Providing additional compacted sand subbase soil and aggregate to raise the road grade above the surrounding terrain in needed areas
♦ Provide ditches on both sides of the road to keep water off the road and stabilize the
grade during spring thaw
♦ Provide an improved road on Triple A Road from the project site to CR 510
♦ Provide an improved road on CR 510 between Triple A Road to CR 550 The improvements noted above will provide an all-weather route from the Eagle Project site to the railhead and improve local roads for travel. KEMC also proposes improvements at the railhead for the temporary storage of approximately 12,000 tons of ore and facilities for loading of the ore onto rail cars. The preliminary railhead plan, the location of which is currently under negotiation, includes the following:
♦ Construction of an enclosed 200-foot by 250-foot ore load-out shed constructed with a concrete pad, a 32-foot high ceiling, and a ramp to an ore unloading dock;
♦ Construction of a rail spur;
♦ Construction of a gravel turn-around to the ore load-out shed and
♦ Construction of an approximate 24-foot by 36-foot office building on the ore load-out
site. 10.1.4 Social Benefits Employment, real disposable income, and state and local revenue are forecasted to increase as a result of the operation of the Eagle Project. These economic changes will have a positive benefit to the local economy. It is KEMC’s goal to fill approximately 75% of its workforce from the Marquette County area. The remaining 25% will be filled from outside the Marquette County area representing a small local population increase. An increase in employment and population is viewed as a positive economic stimulus to the local economy. The improvements to Triple A and CR 510 discussed above will improve local transportation routes to and from the Eagle Project. These improvements will benefit mine employees and local goods and service vendors by providing more efficient and safe transportation. The road improvements will serve the local economy for many years to come.

LJS\J:\scopes\04w018\10000\FVD reports\Final GWP\r-gw discharge permit app.doc Foth & Van Dyke and Assoc., Inc. • 63
10.2 Lake Superior Basin - Bioaccumulative Substances of Immediate Concern
The following substances are LSB-BSIC:
♦ 2,3,7,8-tetrachlorodibenzo-p-dioxin (2,3,7,8-TCDD). ♦ Octachlorostyrene. ♦ Hexachlorobenzene. ♦ Chlordane. ♦ Dichloro-diphenyl-trichloroethane (DDT) and metabolites. ♦ Dieldrin. ♦ Toxaphene. ♦ Polychlorinated biphenyls (PCBs). ♦ Mercury.
The only LSB-BSIC that will be present in the treated water at the Eagle Project site is mercury. The mercury present in the project wastewaters and treated effluent comes from natural sources. Mercury will not be used in any aspect of the Eagle Project operations. KEMC completed analysis of groundwater and surface water samples for additional LSB-BSICs. The results of these analyses are provided in Appendix L and show that there are no other LSB-BSICs in groundwater and surface water in the vicinity of the Eagle Project. Since none of these LSB-BSICs will be used in the operations and they are not present in the natural waters, they will not be present in the Eagle Project’s wastewaters or treated water. 10.3 Technical Evaluation of Best Technology in Process and
Treatment
R 323.1098(4)(b)(i) requires that an applicant implemented cost effective pollution prevention measures as a first step in reducing potential discharges of mercury. As previously stated, mercury will not be used in the Eagle Project operations and is only present in the Project’s wastewaters as a by product of natural materials. As such there are no additional “pollution prevention” measures that can be implemented for the Eagle Project beyond those that are already incorporated into the project plan (i.e. amending development rock in the TDRSA with limestone, and covering the TDRSA). As such, the requirements of R 323.1098(4)(b)(i) are already factored into the operational plans for the Eagle Project. 10.3.1 Wastewater Treatment Processes for Mercury Reduction The wastewater treatment processes for the Eagle Project are described in detail in Section 6. The main treatment processes for mercury are the metals precipitation/sedimentation process and the reverse osmosis process. The metals precipitation/sedimentation process treats the metals by increasing the pH of a wastewater and precipitating the resultant metal hydroxides. This method is a relatively common method for treating dissolved metal cations in wastewater. Although some precipitation of mercury hydroxide will occur in this process, a reduction in mercury concentration is conservatively not included in the mercury effluent concentration estimate provided in Table 6-1. The wastewater flows from the precipitation/sedimentation process through the filtration process and to the reverse osmosis process. Reverse osmosis is an advanced treatment technique for the reduction of ions in a wastewater stream. Furthermore, the Eagle Project will use a double pass

LJS\J:\scopes\04w018\10000\FVD reports\Final GWP\r-gw discharge permit app.doc Foth & Van Dyke and Assoc., Inc. • 64
system, where the permeate from the first reverse osmosis membrane will be further treated by a second RO membrane. The RO process for the Eagle Project is estimated to remove 95% of the mercury in the wastewater stream. Other advanced treatment processes include the use of an evaporator and crystallizer in the CRP. The combined precipitation/sedimentation, RO process, and evaporator/crystallizer are advanced treatment systems that meet the BTPT requirement R 323.1098(4)(b)(iii) in that:
‚ RO and evaporation are advanced treatment techniques.
‚ RO and evaporation are adequately demonstrated technologies.
‚ RO and evaporation systems are both reasonably available in the market place. Alternate treatment techniques were also reviewed and are discussed in Section 5. In addition to the alternatives evaluated in Section 5, a taconite tailings filter process for treating mercury was reviewed. Based on publicly available information, the technology for the taconite tailings filter is in the development phase with no large scale facilities as of May, 2005. Therefore, this technology is not considered to be adequately demonstrated and reasonably available for the Eagle Project. 10.4 Compliance with Mercury Standards
The mercury concentration in the treated water at the Eagle Project is conservatively estimated to be approximately 2.1 ng/l. The actual concentration may certainly be less than 2.1 ng/l as this estimate does not reflect the benefits of the metals precipitation/sedimentation treatment step. Nonetheless, analysis has been completed to assess the concentration of mercury in groundwater between the TWIS and downgradient venting points assuming that the mercury levels in the treated effluent is 2.1 ng/l. As described in Appendix M, an advection dispersion model was used to evaluate the concentration of mercury in groundwater downgradient of the TWIS. Model inputs of hydraulic gradient, hydraulic conductivity, porosity, etc. were based on-site specific data. Background mercury levels in the groundwater of approximately 0.5 ng/ are factored into the analysis. Downgradient observation points were examined and included:
♦ A point 2,000 feet from the TWIS, representing a monitoring well (QAL054) between the TWIS and venting points.
♦ A point 4,500 feet from the TWIS representing a venting point north of the TWIS.
♦ A point 5,500 feet from the TWIS representing a venting point northeast of the TWIS.
The projected mercury concentration at the monitoring well 2,000 feet from the TWIS is projected to be approximately 1 ng/l. More importantly, at the venting points, the projected theoretical concentrations of mercury in the groundwater are approximately 0.6 to 0.8 ng/l, only a tenth to several tenths of a nanogram per liter above background levels of approximately 0.5 ng/l. The theoretical increase of a tenth to several tenths of a nanogram per liter in groundwater at the venting point does not consider the mixing that will take place when the groundwater vents and mixes with the surface water. Surface water exhibits background levels between 0.6 and 3.9 ng/l at monitoring stations on the Salmon Trout River East Branch. Based

LJS\J:\scopes\04w018\10000\FVD reports\Final GWP\r-gw discharge permit app.doc Foth & Van Dyke and Assoc., Inc. • 65
on the above, and the fact that the flow in the Salmon Trout River East Branch is on average above 10 cubic feet per second, the theoretical changes in mercury concentrations at the venting points will result in an immeasurable change in the surface water quality of the Salmon Trout River East Branch. Note that this advection dispersion analysis is conservative, not only because it does not account for the benefits of the metals precipitation/sedimentation process, but it also ignores mercury attenuation in the aquifer. Mercury concentrations in precipitation runoff is higher than background groundwater levels indicating that mercury is attenuated in the aquifer matrix. Overall, the analysis demonstrates that the discharge of treated water from the Eagle Project will comply with MDEQs September 14, 2005 determination. During operations, KEMC is proposing to monitor for mercury at downgradient groundwater and surface water monitoring points, displayed in Figure 9-1, to demonstrate that the mercury levels in groundwater are in line with the predictions of Appendix M, and that mercury levels in the Salmon Trout River East Branch remain consistent with baseline and background data.

LJS\J:\scopes\04w018\10000\FVD reports\Final GWP\r-gw discharge permit app.doc Foth & Van Dyke and Assoc., Inc. • 66
11 References Finnemore, E.J. (1995), A Program to Calculate Ground-Water mound Heights, Groundwater
33(1): 139-143. Foth & Van Dyke, 2006, Eagle Project Mining Permit Application, Volume I and Volume II (and
associated appendices). Gilbert, R.O., 1987. Statistical Methods for Environmental Pollution Monitoring, Van Nostrand
Reinhold, New York. Golder Associates Ltd., April 24, 2005. Kennecott Minerals Company Eagle Project
Environmental Baseline Study, Bedrock Hydrogeologic Investigation. Hantush, M.S. (1967), Grown and Decay of Groundwater Mounds in Response to Uniform
Percolation, Water Resources Research, 3(1): 227-234. MDEQ, 2002. Sampling Strategies and Statistics Training Materials for Part 201 Cleanup
Criteria.
North Jackson Company, 2004a. Eagle Project Quality Assurance Project Plan for Stage II Hydrologic Assessments, Version 2.0.
North Jackson Company, 2004b. Eagle Project Hydrologic Assessments Standard Operating
Procedures Manual, Version 2.0. North Jackson Company, 2005a. Kennecott Minerals Company Eagle Project. Environmental
Baseline Study, Interim Hydrology Report. North Jackson Company, 2005b. Eagle Project Supplemental Hydrogeologic Study Work Plan
for Groundwater Discharge. USEPA, 2000. Practical Methods for Data Analysis–EPA QA/G-9, EPA/600/R-96/084. USEPA, 1992. Statistical Analysis for Groundwater Monitoring Data at RCRA
Facilities – Addendum to Interim Final Guidance, PB89-151047.