eagle third quarter report 2017 - eagle energy inc. q3 quarterly report.pdf · eagle third quarter...
TRANSCRIPT
EAGLE THIRD QUARTER REPORT 2017
1
Management’s Discussion and Analysis November 9, 2017
This Management’s Discussion and Analysis (“MD&A”) of financial condition and results of operations for Eagle Energy Inc. (“Eagle”), dated November 9, 2017, should be read in conjunction with Eagle’s unaudited condensed consolidated interim financial statements and accompanying notes for the three months and nine months ended September 30, 2017 (“Interim Financial Statements”) and Eagle’s audited consolidated financial statements and accompanying notes and related MD&A for the year ended December 31, 2016 and Eagle’s Annual Information Form dated March 16, 2017 (“AIF”), which are available online under Eagle’s issuer profile at www.sedar.com and on Eagle’s website at www.EagleEnergy.com.
The Interim Financial Statements have been prepared in accordance with International Financial Reporting Standards (“IFRS”). Items included in the financial statements of Eagle and each of its subsidiaries are measured using the currency of the primary economic environment in which the entity operates (the “functional currency”). The Interim Financial Statements are presented in Canadian dollars, which is the functional and presentation currency of Eagle.
Figures within this MD&A are presented in Canadian dollars unless otherwise indicated.
The foreign exchange rate at September 30, 2017 was $US 1.00 equal to $CA 1.25 (December 31, 2016 - $US 1.00 equal to $CA 1.34), and the average foreign exchange rate for the nine months ended September 30, 2017 was $US 1.00 equal to $CA 1.31 (for the nine months ended September 30, 2016 - $US 1.00 equal to $CA 1.32).
Throughout this MD&A, Eagle and its subsidiaries are collectively referred to as “Eagle” for purposes of convenience. In addition, references to the results of operations refer to operations of Eagle’s subsidiaries in the U.S. and in Canada.
This MD&A contains information that is forward-looking and refers to non-IFRS financial measures. Investors should read the “Note about Forward-Looking Statements” and “Non-IFRS Financial Measures” sections at the end of this MD&A.
Financial data other than non-IFRS financial measures has been prepared in accordance with IFRS.
Overview of Eagle
On January 27, 2016, Eagle Energy Trust closed a plan of arrangement (the “Arrangement”) involving an acquisition by way of share exchange and conversion of Eagle Energy Trust into a corporate structure. The resulting public entity, named Eagle Energy Inc., is listed on the Toronto Stock Exchange with its common shares trading under the symbol “EGL”.
This MD&A discusses Eagle’s operating segments in the United States and Canada, in addition to its Corporate segment. The United States segment relates to Eagle’s assets in Texas and the Canadian segment relates to
EAGLE THIRD QUARTER REPORT 2017
2
Eagle’s assets in Alberta. The Corporate segment includes expenditures related to Eagle’s hedging program, public company, and other expenses incurred in the overall financing and administration of Eagle.
Highlights for the Three Months ended September 30, 2017
• During the third quarter, Eagle successfully drilled the first horizontal well on its North Texas property with reservoir quality appearing as good or better than expected along the lateral length. Eagle expects to complete fracking operations and test the well by the end of the year.
• Year-to-date general and administrative charges were 21% lower than the prior year with expectations of a 23% year over year drop for the full year. Eagle previously announced that effective September 1, 2017 its aggregate executive compensation (cash and non-cash on an annualized basis) had been reduced by 50% from 2016 levels of $2.8 million. Eagle also announced that it had negotiated a new Houston office lease which will reduce its 2018 annual rent by 60%, or $US 170,000, and realize average annual savings of 30% when compared to the terms of its current office lease.
2017 Outlook
This outlook section is intended to provide shareholders with information about Eagle’s expectations for capital expenditures, production and operating costs for 2017. Readers are cautioned that the information may not be appropriate for any other purpose. This information constitutes forward-looking information. Readers should note the assumptions, risks and discussions under “Note about Forward-Looking Statements” at the end of this MD&A.
As a result of higher than anticipated service and supply costs in the third quarter, Eagle is reinstating its capital budget to its original level prior to the August 10, 2017 downward revision. Average production and monthly operating cost guidance remains unchanged from what Eagle previously announced on August 10, 2017 and is as follows:
Guidance
2017 Revised Guidance 2017 Previous Guidance Notes
Capital Budget $23.0 mm $21.0 mm (1)
Average Production 3,700 to 3,900 boe/d 3,700 to 3,900 boe/d (2)
Operating Costs per month $2.1 to $2.3 mm $2.1 to $2.3 mm (3)
Notes:
The revised 2017 capital budget of $23.0 million consists of $US 11.8 million for Eagle’s operations in the United States and $7.8 million for (1)Eagle’s operations in Canada.
The production mix consists of 83% oil, 4% natural gas liquids (“NGLs”) and 13% natural gas. These numbers include working interest and (2)royalty interest volumes.
Operating expense guidance is stated on a per month basis rather than per boe basis due to the mostly fixed nature of the costs. (3)
Eagle’s Expected Funds Flow from Operations, Ending Net Debt and Field Netback
As a result of guidance revisions and updated commodity price and foreign exchange rate assumptions of management, resulting expected funds flow from operations, ending net debt and field netback and related sensitivities are as follows:
Amount Notes
Funds Flow from Operations $12.2 mm (1)
Ending Net Debt $71.4 mm Field Netback (excluding hedges) $20.47 / boe (2)
Notes:
2017 funds flow from operations is expected to be approximately $12.2 million (previously $10.7 million) based on the following assumptions: (1)
(a) average production of 3,800 boe/d (the mid-point of the guidance range);
(b) pricing at $US 51.75 (previously $US 50.00) per barrel WTI oil, $US 3.03 (previously $US 3.05) per Mcf NYMEX gas, $CA 2.12 (previously $CA 2.22) per Mcf AECO and $US 18.11 (previously $US 17.48) per barrel of NGL (NGL price is calculated as 35% of the WTI price);
EAGLE THIRD QUARTER REPORT 2017
3
(c) differential to WTI is $US 3.18 discount per barrel in Salt Flat, $US 3.50 discount per barrel in North Texas, $CA 11.50 discount per barrel in Dixonville and $CA 8.00 discount per barrel in Twining;
(d) average operating costs of $2.2 million per month ($US 0.8 million per month for Eagle’s operations in the United States and $1.2 million per month for Eagle’s operations in Canada), the mid-point of the guidance range; and
(e) a foreign exchange rate of $US 1.00 equal to $CA 1.25 (previously $CA 1.24).
This figure assumes average operating costs of $2.2 million per month (the mid-point of the guidance range) and a $US 51.75 (previously $US (2)50.00) WTI price. Field netback is a non-IFRS financial measure. See “Non-IFRS Financial Measures”.
2017 Sensitivities
The following tables show the sensitivity of Eagle’s 2017 expected funds flow from operations to changes in commodity prices, production and foreign exchange (“FX”) rates:
Funds Flow from Operations 2017 Average Production (3,800 boe/d)
Sensitivity to Commodity Price FX 1.20 FX 1.25 FX 1.30
$US 46.75 WTI $11.5 mm $11.8 mm $12.1 mm
$US 51.75 WTI $11.9 mm $12.2 mm $12.5 mm
$US 56.75 WTI $12.3 mm $12.6 mm $13.0 mm
Sensitivity to Production 2017 Average Production (WTI $US 51.75, FX 1.25)
3,700 3,800 3,900
Funds Flow from Operations ($CA) $11.5 mm $12.2 mm $13.0 mm
Assumptions:
Operating costs are assumed to be $2.2 million per month (mid-point of guidance range). (1)
Differential to WTI is held constant. (2)
The foreign exchange rate is assumed to be $US 1.00 equal to $CA 1.25, unless otherwise indicated in the table. (3)
Consolidated Results of Operations
Production
Three Months Ended
September 30, 2017
Three Months Ended
September 30, 2016 %
Nine Months Ended
September 30, 2017
Nine Months Ended
September 30, 2016 %
Working interest (boe/d) 3,529 3,841 (8) 3,613 3,800 (5)
Royalty interest (boe/d) 220 244 (10) 214 229 (7)
Total (boe/d) 3,749 4,085 (8) 3,827 4,029 (5)
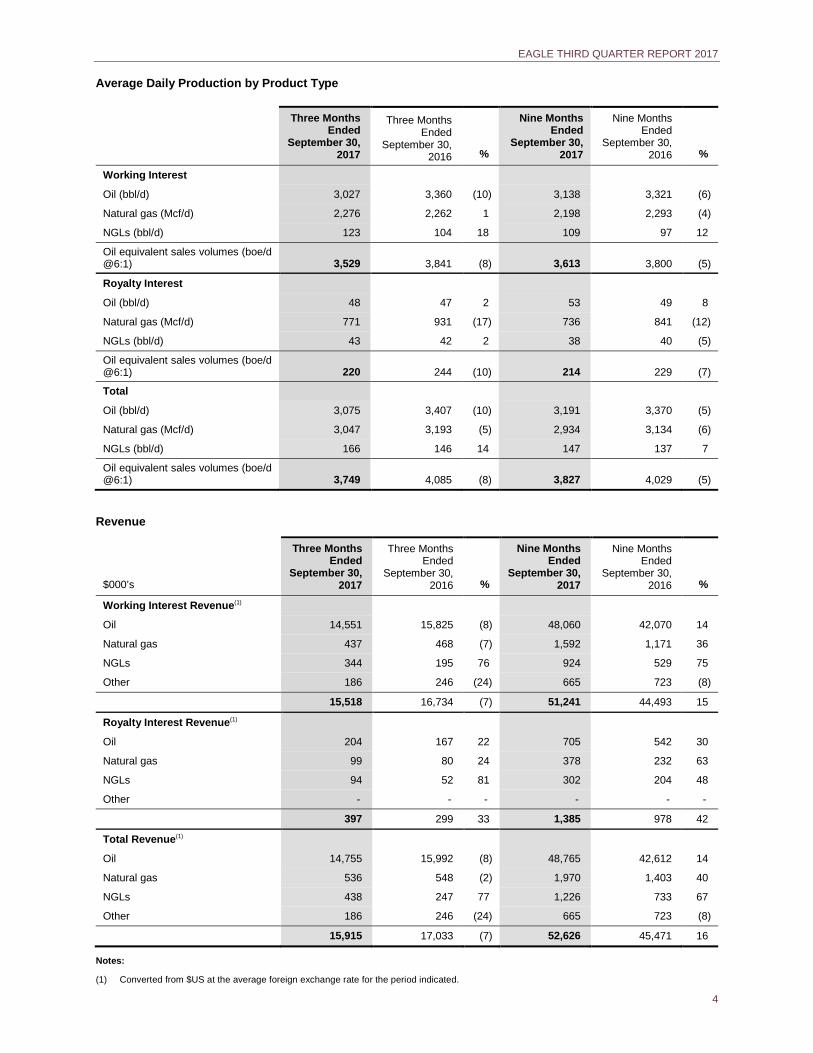
Product mix (83% oil, 4% NGLs, 13% natural gas) remained relatively consistent for both the three month and nine month periods. Working interest production for the three and nine month periods was down due to natural decline, offset by the drilling program completed in the first half of 2017, as well as temporary weather-related effects in September 2017 from Hurricane Harvey in Texas.
EAGLE THIRD QUARTER REPORT 2017
4
Average Daily Production by Product Type
Three Months Ended
September 30, 2017
Three Months Ended
September 30, 2016 %
Nine Months Ended
September 30, 2017
Nine Months Ended
September 30, 2016 %
Working Interest
Oil (bbl/d) 3,027 3,360 (10) 3,138 3,321 (6)
Natural gas (Mcf/d) 2,276 2,262 1 2,198 2,293 (4)
NGLs (bbl/d) 123 104 18 109 97 12
Oil equivalent sales volumes (boe/d @6:1) 3,529 3,841 (8) 3,613 3,800 (5)
Royalty Interest
Oil (bbl/d) 48 47 2 53 49 8
Natural gas (Mcf/d) 771 931 (17) 736 841 (12)
NGLs (bbl/d) 43 42 2 38 40 (5)
Oil equivalent sales volumes (boe/d @6:1) 220 244 (10) 214 229 (7)
Total
Oil (bbl/d) 3,075 3,407 (10) 3,191 3,370 (5)
Natural gas (Mcf/d) 3,047 3,193 (5) 2,934 3,134 (6)
NGLs (bbl/d) 166 146 14 147 137 7
Oil equivalent sales volumes (boe/d @6:1) 3,749 4,085 (8) 3,827 4,029 (5)
Revenue
$000’s
Three Months Ended
September 30, 2017
Three Months Ended
September 30, 2016 %
Nine Months Ended
September 30, 2017
Nine Months Ended
September 30, 2016 %
Working Interest Revenue(1)
Oil 14,551 15,825 (8) 48,060 42,070 14
Natural gas 437 468 (7) 1,592 1,171 36
NGLs 344 195 76 924 529 75
Other 186 246 (24) 665 723 (8)
15,518 16,734 (7) 51,241 44,493 15
Royalty Interest Revenue(1)
Oil 204 167 22 705 542 30
Natural gas 99 80 24 378 232 63
NGLs 94 52 81 302 204 48
Other - - - - - -
397 299 33 1,385 978 42
Total Revenue(1)
Oil 14,755 15,992 (8) 48,765 42,612 14
Natural gas 536 548 (2) 1,970 1,403 40
NGLs 438 247 77 1,226 733 67
Other 186 246 (24) 665 723 (8)
15,915 17,033 (7) 52,626 45,471 16
Notes:
Converted from $US at the average foreign exchange rate for the period indicated. (1)

EAGLE THIRD QUARTER REPORT 2017
5
Product Prices
Realized Prices
Three Months Ended
September 30, 2017
Three Months Ended
September 30, 2016 %
Nine Months Ended
September 30, 2017
Nine Months Ended
September 30, 2016 %
Oil ($/bbl) 52.16 51.02 2 55.98 46.15 21
Natural gas ($/Mcf) 1.91 1.86 3 2.46 1.63 51
NGLs ($/bbl) 28.68 18.39 56 30.55 19.58 56
Other ($/bbl) 0.54 0.66 (18) 0.64 0.66 (4)
Revenue ($/boe) 46.14 45.32 2 50.37 41.19 22
Benchmark prices
Three Months Ended
September 30, 2017
Three Months Ended
September 30, 2016 %
Nine Months Ended
September 30, 2017
Nine Months Ended
September 30, 2016 %
WTI crude oil ($US/bbl) 48.20 44.94 7 49.47 41.33 20
Exchange rate ($CA/$US) 1.25 1.32 (5) 1.31 1.32 (1)
Edmonton Par crude oil ($CA/bbl) 57.15 54.19 5 60.57 50.14 21
NYMEX Gas ($US/Mcf) 2.96 2.79 6 3.05 2.34 30
AECO natural gas ($CA/Mcf) 1.61 2.36 (32) 2.36 1.87 26
Eagle’s revenue for the three and nine months ended September 30, 2017 was 93% derived from oil, compared to 94% for the three and nine months ended September 30, 2016. When compared to last year’s comparative periods, realized oil prices in Canadian dollars for the three and nine months ended September 30, 2017 increased due to a higher benchmark WTI crude oil price.
For Eagle’s U.S. properties, there is a quality differential between the benchmark $US WTI price and the $US price realized by Eagle. Eagle enters into field marketing contracts to obtain predictable pricing. Management monitors pricing regularly and endeavours to maximize realized sales prices while minimizing counterparty risk.
For the Salt Flat properties in the U.S., the field marketing contracts use Louisiana light sweet (“LLS”) as a benchmark reference price instead of WTI. Commencing January 1, 2017, Eagle entered into a 6 month contract with a fixed field pricing adjustment, while allowing the LLS-WTI differential and the Argus P+ differential to float. This contract was renewed for an additional 6 months effective July 1, 2017. For the North Texas properties, field marketing contracts are on a month-to-month term using WTI as a reference price and holding all other field pricing adjustments fixed while letting the Argus P+ differential to float.
For the Dixonville properties in Canada, the entire differential to WTI, including quality and transportation, is a discount of approximately $CA 16.71 per barrel. For the Twining properties in Canada, the entire differential to WTI, including quality and transportation, is a discount of approximately $CA 9.09 per barrel. Eagle also has a fixed price physical swap on 986 barrels per day of oil fixing the price differential between Edmonton light sweet and WTI at $US 3.25 per barrel for the period January 1, 2017 to December 31, 2017. The portion of the differential between Edmonton light sweet and realized field price was not fixed in this transaction. The differential was hedged at a narrower amount than the historical WTI to Edmonton light sweet differential was at that time.
The above prices do not include realized gains or losses from financial commodity contracts, which amounted to a loss of $0.9 million ($0.86/boe) for the nine months ended September 30, 2017. See “Realized and Unrealized Risk Management Gain/Loss”.
EAGLE THIRD QUARTER REPORT 2017
6
Royalties
Three Months Ended
September 30, 2017
Three Months Ended
September 30, 2016 %
Nine Months Ended
September 30, 2017
Nine Months Ended
September 30, 2016 %
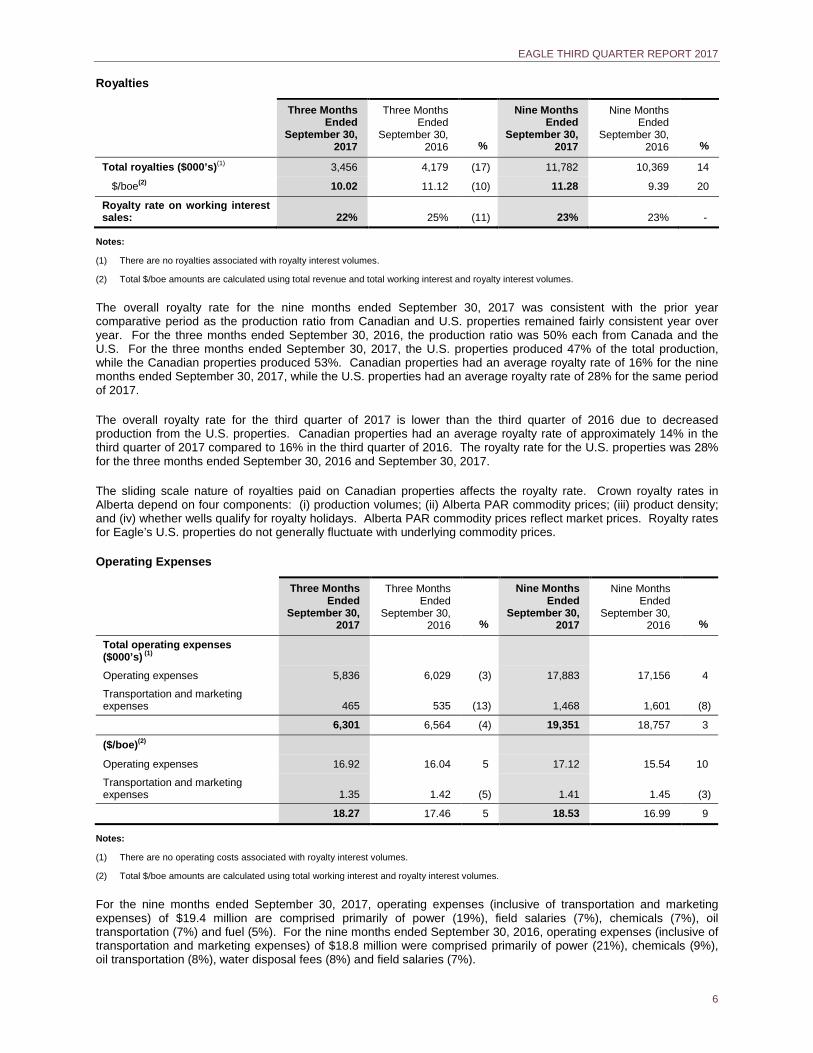
Total royalties ($000’s)(1) 3,456 4,179 (17) 11,782 10,369 14
$/boe(2) 10.02 11.12 (10) 11.28 9.39 20
Royalty rate on working interest sales: 22% 25% (11) 23% 23% -
Notes:
There are no royalties associated with royalty interest volumes. (1)
Total $/boe amounts are calculated using total revenue and total working interest and royalty interest volumes. (2)
The overall royalty rate for the nine months ended September 30, 2017 was consistent with the prior year comparative period as the production ratio from Canadian and U.S. properties remained fairly consistent year over year. For the three months ended September 30, 2016, the production ratio was 50% each from Canada and the U.S. For the three months ended September 30, 2017, the U.S. properties produced 47% of the total production, while the Canadian properties produced 53%. Canadian properties had an average royalty rate of 16% for the nine months ended September 30, 2017, while the U.S. properties had an average royalty rate of 28% for the same period of 2017.
The overall royalty rate for the third quarter of 2017 is lower than the third quarter of 2016 due to decreased production from the U.S. properties. Canadian properties had an average royalty rate of approximately 14% in the third quarter of 2017 compared to 16% in the third quarter of 2016. The royalty rate for the U.S. properties was 28% for the three months ended September 30, 2016 and September 30, 2017.
The sliding scale nature of royalties paid on Canadian properties affects the royalty rate. Crown royalty rates in Alberta depend on four components: (i) production volumes; (ii) Alberta PAR commodity prices; (iii) product density; and (iv) whether wells qualify for royalty holidays. Alberta PAR commodity prices reflect market prices. Royalty rates for Eagle’s U.S. properties do not generally fluctuate with underlying commodity prices.
Operating Expenses
Three Months Ended
September 30, 2017
Three Months Ended
September 30, 2016 %
Nine Months Ended
September 30, 2017
Nine Months Ended
September 30, 2016 %
Total operating expenses ($000’s) (1)
Operating expenses 5,836 6,029 (3) 17,883 17,156 4
Transportation and marketing expenses 465 535 (13) 1,468 1,601 (8)
6,301 6,564 (4) 19,351 18,757 3
($/boe)(2)
Operating expenses 16.92 16.04 5 17.12 15.54 10
Transportation and marketing expenses 1.35 1.42 (5) 1.41 1.45 (3)
18.27 17.46 5 18.53 16.99 9
Notes:
There are no operating costs associated with royalty interest volumes. (1)
Total $/boe amounts are calculated using total working interest and royalty interest volumes. (2)
For the nine months ended September 30, 2017, operating expenses (inclusive of transportation and marketing expenses) of $19.4 million are comprised primarily of power (19%), field salaries (7%), chemicals (7%), oil transportation (7%) and fuel (5%). For the nine months ended September 30, 2016, operating expenses (inclusive of transportation and marketing expenses) of $18.8 million were comprised primarily of power (21%), chemicals (9%), oil transportation (8%), water disposal fees (8%) and field salaries (7%).
EAGLE THIRD QUARTER REPORT 2017
7
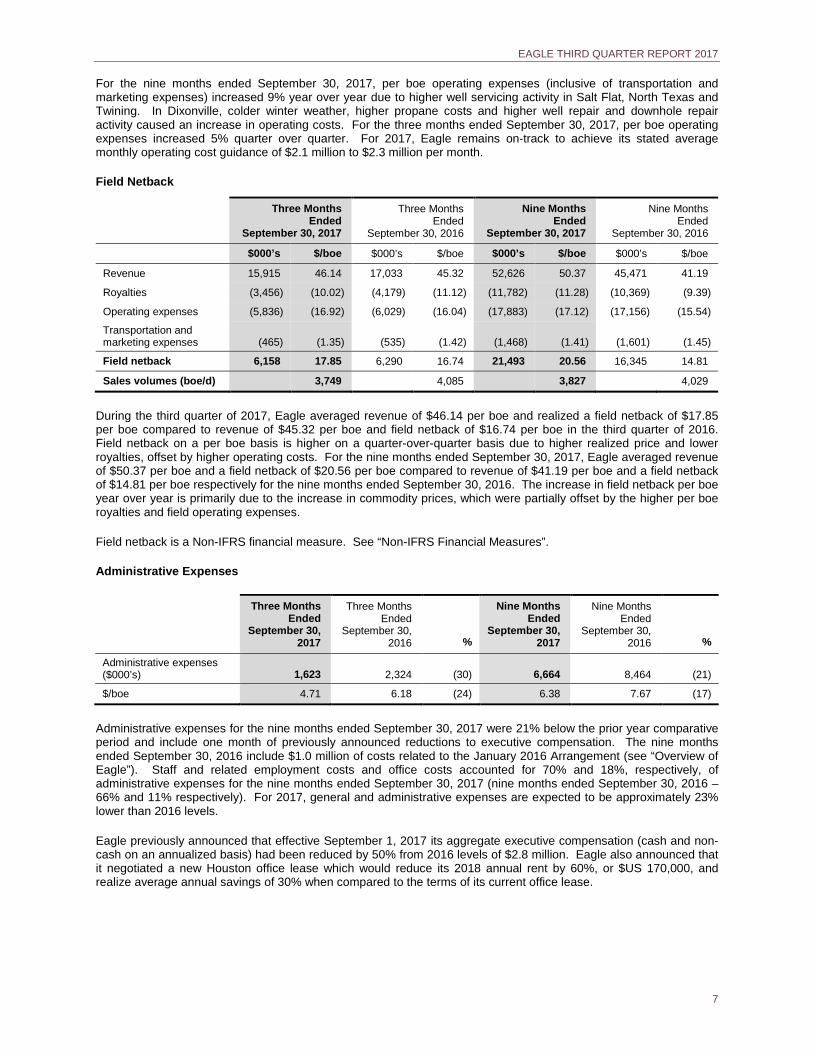
For the nine months ended September 30, 2017, per boe operating expenses (inclusive of transportation and marketing expenses) increased 9% year over year due to higher well servicing activity in Salt Flat, North Texas and Twining. In Dixonville, colder winter weather, higher propane costs and higher well repair and downhole repair activity caused an increase in operating costs. For the three months ended September 30, 2017, per boe operating expenses increased 5% quarter over quarter. For 2017, Eagle remains on-track to achieve its stated average monthly operating cost guidance of $2.1 million to $2.3 million per month.
Field Netback
Three Months Ended
September 30, 2017
Three Months Ended
September 30, 2016
Nine Months Ended
September 30, 2017
Nine Months Ended
September 30, 2016
$000’s $/boe $000’s $/boe $000’s $/boe $000’s $/boe
Revenue 15,915 46.14 17,033 45.32 52,626 50.37 45,471 41.19
Royalties (3,456) (10.02) (4,179) (11.12) (11,782) (11.28) (10,369) (9.39)
Operating expenses (5,836) (16.92) (6,029) (16.04) (17,883) (17.12) (17,156) (15.54)
Transportation and marketing expenses (465) (1.35) (535) (1.42) (1,468) (1.41) (1,601) (1.45)
Field netback 6,158 17.85 6,290 16.74 21,493 20.56 16,345 14.81
Sales volumes (boe/d) 3,749 4,085 3,827 4,029
During the third quarter of 2017, Eagle averaged revenue of $46.14 per boe and realized a field netback of $17.85 per boe compared to revenue of $45.32 per boe and field netback of $16.74 per boe in the third quarter of 2016. Field netback on a per boe basis is higher on a quarter-over-quarter basis due to higher realized price and lower royalties, offset by higher operating costs. For the nine months ended September 30, 2017, Eagle averaged revenue of $50.37 per boe and a field netback of $20.56 per boe compared to revenue of $41.19 per boe and a field netback of $14.81 per boe respectively for the nine months ended September 30, 2016. The increase in field netback per boe year over year is primarily due to the increase in commodity prices, which were partially offset by the higher per boe royalties and field operating expenses.
Field netback is a Non-IFRS financial measure. See “Non-IFRS Financial Measures”.
Administrative Expenses
Three Months Ended
September 30, 2017
Three Months Ended
September 30, 2016 %
Nine Months Ended
September 30, 2017
Nine Months Ended
September 30, 2016 %
Administrative expenses ($000’s) 1,623 2,324 (30) 6,664 8,464 (21)
$/boe 4.71 6.18 (24) 6.38 7.67 (17)
Administrative expenses for the nine months ended September 30, 2017 were 21% below the prior year comparative period and include one month of previously announced reductions to executive compensation. The nine months ended September 30, 2016 include $1.0 million of costs related to the January 2016 Arrangement (see “Overview of Eagle”). Staff and related employment costs and office costs accounted for 70% and 18%, respectively, of administrative expenses for the nine months ended September 30, 2017 (nine months ended September 30, 2016 – 66% and 11% respectively). For 2017, general and administrative expenses are expected to be approximately 23% lower than 2016 levels.
Eagle previously announced that effective September 1, 2017 its aggregate executive compensation (cash and non-cash on an annualized basis) had been reduced by 50% from 2016 levels of $2.8 million. Eagle also announced that it negotiated a new Houston office lease which would reduce its 2018 annual rent by 60%, or $US 170,000, and realize average annual savings of 30% when compared to the terms of its current office lease.
EAGLE THIRD QUARTER REPORT 2017
8
Realized and Unrealized Risk Management Loss (Gain)
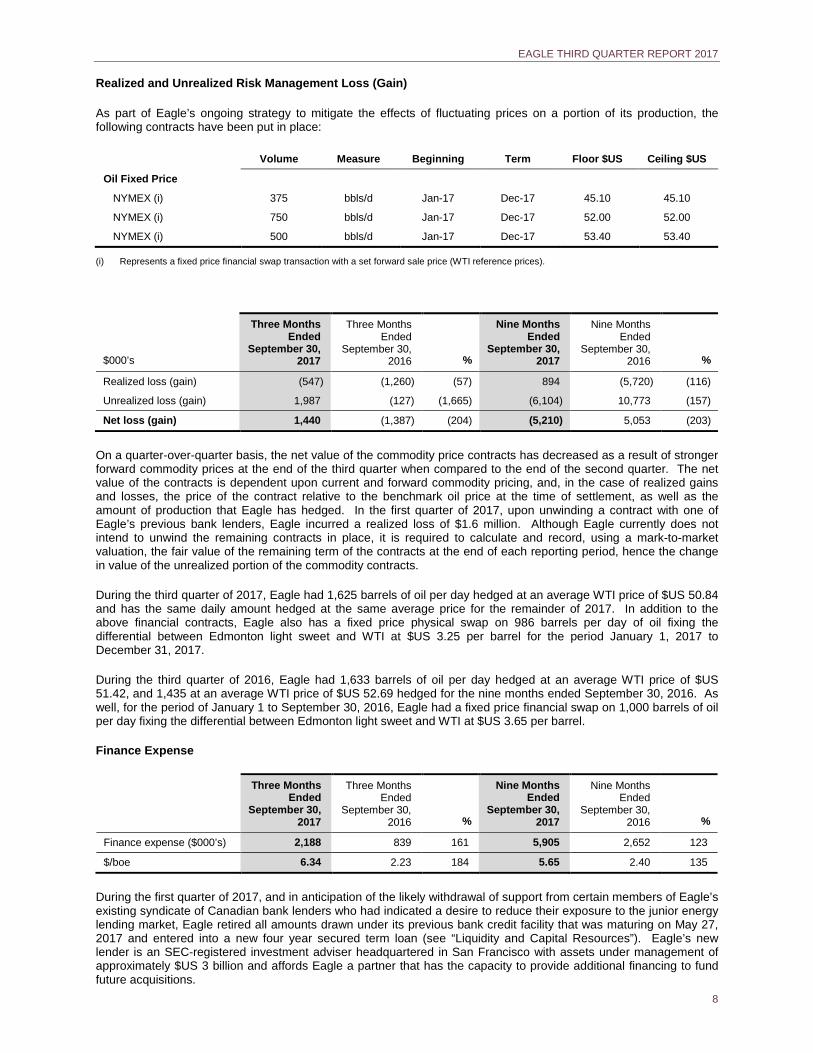
As part of Eagle’s ongoing strategy to mitigate the effects of fluctuating prices on a portion of its production, the following contracts have been put in place:
Volume Measure Beginning Term Floor $US Ceiling $US
Oil Fixed Price NYMEX (i) 375 bbls/d Jan-17 Dec-17 45.10 45.10
NYMEX (i) 750 bbls/d Jan-17 Dec-17 52.00 52.00
NYMEX (i) 500 bbls/d Jan-17 Dec-17 53.40 53.40
(i) Represents a fixed price financial swap transaction with a set forward sale price (WTI reference prices).
$000’s
Three Months Ended
September 30, 2017
Three Months Ended
September 30, 2016 %
Nine Months Ended
September 30, 2017
Nine Months Ended
September 30, 2016 %
Realized loss (gain) (547) (1,260) (57) 894 (5,720) (116)
Unrealized loss (gain) 1,987 (127) (1,665) (6,104) 10,773 (157)
Net loss (gain) 1,440 (1,387) (204) (5,210) 5,053 (203)
On a quarter-over-quarter basis, the net value of the commodity price contracts has decreased as a result of stronger forward commodity prices at the end of the third quarter when compared to the end of the second quarter. The net value of the contracts is dependent upon current and forward commodity pricing, and, in the case of realized gains and losses, the price of the contract relative to the benchmark oil price at the time of settlement, as well as the amount of production that Eagle has hedged. In the first quarter of 2017, upon unwinding a contract with one of Eagle’s previous bank lenders, Eagle incurred a realized loss of $1.6 million. Although Eagle currently does not intend to unwind the remaining contracts in place, it is required to calculate and record, using a mark-to-market valuation, the fair value of the remaining term of the contracts at the end of each reporting period, hence the change in value of the unrealized portion of the commodity contracts.
During the third quarter of 2017, Eagle had 1,625 barrels of oil per day hedged at an average WTI price of $US 50.84 and has the same daily amount hedged at the same average price for the remainder of 2017. In addition to the above financial contracts, Eagle also has a fixed price physical swap on 986 barrels per day of oil fixing the differential between Edmonton light sweet and WTI at $US 3.25 per barrel for the period January 1, 2017 to December 31, 2017.
During the third quarter of 2016, Eagle had 1,633 barrels of oil per day hedged at an average WTI price of $US 51.42, and 1,435 at an average WTI price of $US 52.69 hedged for the nine months ended September 30, 2016. As well, for the period of January 1 to September 30, 2016, Eagle had a fixed price financial swap on 1,000 barrels of oil per day fixing the differential between Edmonton light sweet and WTI at $US 3.65 per barrel.
Finance Expense
Three Months Ended
September 30, 2017
Three Months Ended
September 30, 2016 %
Nine Months Ended
September 30, 2017
Nine Months Ended
September 30, 2016 %
Finance expense ($000’s) 2,188 839 161 5,905 2,652 123
$/boe 6.34 2.23 184 5.65 2.40 135
During the first quarter of 2017, and in anticipation of the likely withdrawal of support from certain members of Eagle’s existing syndicate of Canadian bank lenders who had indicated a desire to reduce their exposure to the junior energy lending market, Eagle retired all amounts drawn under its previous bank credit facility that was maturing on May 27, 2017 and entered into a new four year secured term loan (see “Liquidity and Capital Resources”). Eagle’s new lender is an SEC-registered investment adviser headquartered in San Francisco with assets under management of approximately $US 3 billion and affords Eagle a partner that has the capacity to provide additional financing to fund future acquisitions.
EAGLE THIRD QUARTER REPORT 2017
9
Funds borrowed are denominated in U.S. dollars and have a coupon rate of LIBOR plus 8% (with LIBOR having a floor of 1%). For the prior year’s comparative quarter, funds were borrowed primarily by way of banker’s acceptance and drawn in Canadian dollars.
For the three and nine months ended September 30, 2017, finance expense increased over the comparative prior period due to a higher interest rate on the term loan and a higher debt level. In addition, costs associated with securing the new term loan are amortized over the life of the loan and included in finance expense.
For the three and nine months ended September 30, 2017, the effective interest rate was 11.38% and 10.36%, respectively (4.53% and 4.62% for the comparable periods in 2016).
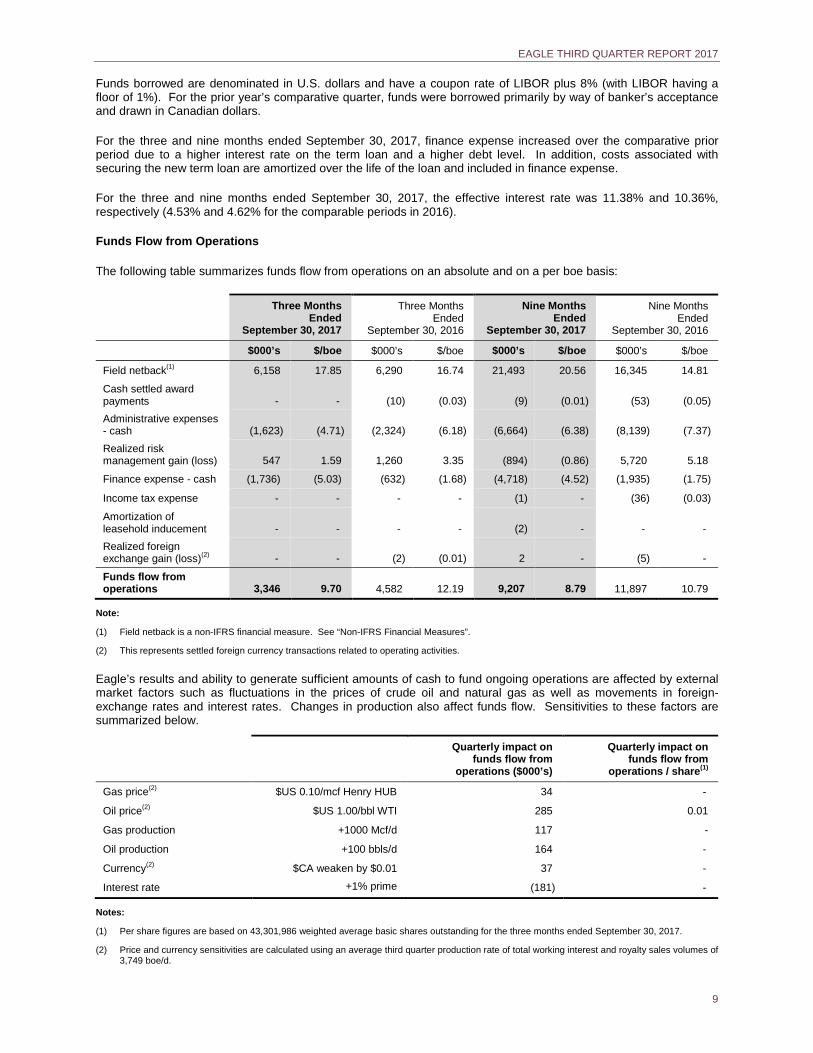
Funds Flow from Operations
The following table summarizes funds flow from operations on an absolute and on a per boe basis:
Three Months Ended
September 30, 2017
Three Months Ended
September 30, 2016
Nine Months Ended
September 30, 2017
Nine Months Ended
September 30, 2016
$000’s $/boe $000’s $/boe $000’s $/boe $000’s $/boe
Field netback(1) 6,158 17.85 6,290 16.74 21,493 20.56 16,345 14.81
Cash settled award payments - - (10) (0.03) (9) (0.01) (53) (0.05) Administrative expenses - cash (1,623) (4.71) (2,324) (6.18) (6,664) (6.38) (8,139) (7.37)
Realized risk management gain (loss) 547 1.59 1,260 3.35 (894) (0.86) 5,720 5.18
Finance expense - cash (1,736) (5.03) (632) (1.68) (4,718) (4.52) (1,935) (1.75)
Income tax expense - - - - (1) - (36) (0.03)
Amortization of leasehold inducement - - - - (2) - - - Realized foreign exchange gain (loss)(2) - - (2) (0.01) 2 - (5) -
Funds flow from operations 3,346 9.70 4,582 12.19 9,207 8.79 11,897 10.79
Note:
Field netback is a non-IFRS financial measure. See “Non-IFRS Financial Measures”. (1)
This represents settled foreign currency transactions related to operating activities. (2)
Eagle’s results and ability to generate sufficient amounts of cash to fund ongoing operations are affected by external market factors such as fluctuations in the prices of crude oil and natural gas as well as movements in foreign-exchange rates and interest rates. Changes in production also affect funds flow. Sensitivities to these factors are summarized below.
Quarterly impact on funds flow from
operations ($000’s)
Quarterly impact on funds flow from
operations / share(1)
Gas price(2) $US 0.10/mcf Henry HUB 34 -
Oil price(2) $US 1.00/bbl WTI 285 0.01
Gas production +1000 Mcf/d 117 -
Oil production +100 bbls/d 164 -
Currency(2) $CA weaken by $0.01 37 -
Interest rate +1% prime (181) -
Notes:
Per share figures are based on 43,301,986 weighted average basic shares outstanding for the three months ended September 30, 2017. (1)
Price and currency sensitivities are calculated using an average third quarter production rate of total working interest and royalty sales volumes of (2)3,749 boe/d.
EAGLE THIRD QUARTER REPORT 2017
10
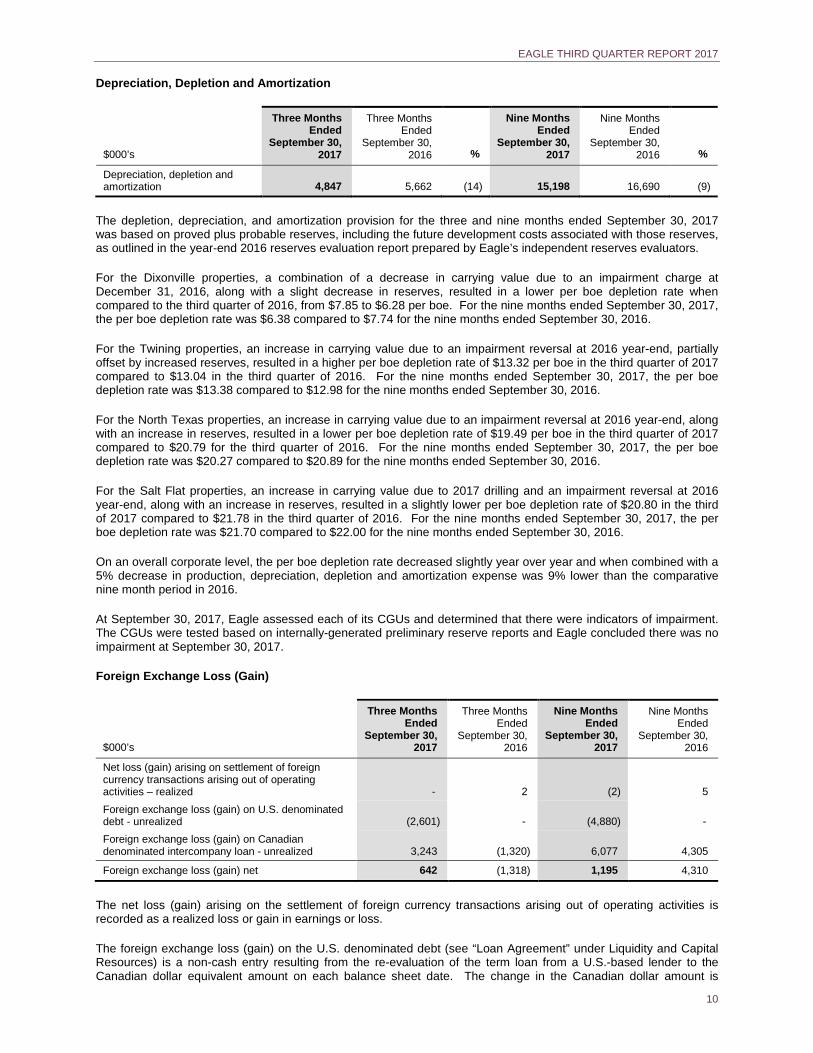
Depreciation, Depletion and Amortization
$000’s
Three Months Ended
September 30, 2017
Three Months Ended
September 30, 2016 %
Nine Months Ended
September 30, 2017
Nine Months Ended
September 30, 2016 %
Depreciation, depletion and amortization 4,847 5,662 (14) 15,198 16,690 (9)
The depletion, depreciation, and amortization provision for the three and nine months ended September 30, 2017 was based on proved plus probable reserves, including the future development costs associated with those reserves, as outlined in the year-end 2016 reserves evaluation report prepared by Eagle’s independent reserves evaluators.
For the Dixonville properties, a combination of a decrease in carrying value due to an impairment charge at December 31, 2016, along with a slight decrease in reserves, resulted in a lower per boe depletion rate when compared to the third quarter of 2016, from $7.85 to $6.28 per boe. For the nine months ended September 30, 2017, the per boe depletion rate was $6.38 compared to $7.74 for the nine months ended September 30, 2016.
For the Twining properties, an increase in carrying value due to an impairment reversal at 2016 year-end, partially offset by increased reserves, resulted in a higher per boe depletion rate of $13.32 per boe in the third quarter of 2017 compared to $13.04 in the third quarter of 2016. For the nine months ended September 30, 2017, the per boe depletion rate was $13.38 compared to $12.98 for the nine months ended September 30, 2016.
For the North Texas properties, an increase in carrying value due to an impairment reversal at 2016 year-end, along with an increase in reserves, resulted in a lower per boe depletion rate of $19.49 per boe in the third quarter of 2017 compared to $20.79 for the third quarter of 2016. For the nine months ended September 30, 2017, the per boe depletion rate was $20.27 compared to $20.89 for the nine months ended September 30, 2016.
For the Salt Flat properties, an increase in carrying value due to 2017 drilling and an impairment reversal at 2016 year-end, along with an increase in reserves, resulted in a slightly lower per boe depletion rate of $20.80 in the third of 2017 compared to $21.78 in the third quarter of 2016. For the nine months ended September 30, 2017, the per boe depletion rate was $21.70 compared to $22.00 for the nine months ended September 30, 2016.
On an overall corporate level, the per boe depletion rate decreased slightly year over year and when combined with a 5% decrease in production, depreciation, depletion and amortization expense was 9% lower than the comparative nine month period in 2016.
At September 30, 2017, Eagle assessed each of its CGUs and determined that there were indicators of impairment. The CGUs were tested based on internally-generated preliminary reserve reports and Eagle concluded there was no impairment at September 30, 2017.
Foreign Exchange Loss (Gain)
$000’s
Three Months Ended
September 30, 2017
Three Months Ended
September 30, 2016
Nine Months Ended
September 30, 2017
Nine Months Ended
September 30, 2016
Net loss (gain) arising on settlement of foreign currency transactions arising out of operating activities – realized - 2 (2) 5
Foreign exchange loss (gain) on U.S. denominated debt - unrealized (2,601) - (4,880) - Foreign exchange loss (gain) on Canadian denominated intercompany loan - unrealized 3,243 (1,320) 6,077 4,305
Foreign exchange loss (gain) net 642 (1,318) 1,195 4,310
The net loss (gain) arising on the settlement of foreign currency transactions arising out of operating activities is recorded as a realized loss or gain in earnings or loss.
The foreign exchange loss (gain) on the U.S. denominated debt (see “Loan Agreement” under Liquidity and Capital Resources) is a non-cash entry resulting from the re-evaluation of the term loan from a U.S.-based lender to the Canadian dollar equivalent amount on each balance sheet date. The change in the Canadian dollar amount is
EAGLE THIRD QUARTER REPORT 2017
11
recorded as an unrealized amount in earnings or loss. The three months ended September 30, 2017 show an unrealized gain of $2.6 million and the nine months ended September 30, 2017 show an unrealized gain of $4.9 million due to a decrease in the period-end foreign exchange rate.
The foreign exchange loss (gain) on the intercompany loan is a non-cash entry resulting from the U.S. subsidiary holding a Canadian dollar denominated loan issued by its parent, Eagle Energy Trust. Although the intercompany loan is eliminated on consolidation, it is no longer considered part of the net investment in the subsidiary because amounts have been repaid, thus any related period-end foreign exchange translation adjustment is recorded as an unrealized amount in earnings or loss. For the three and nine months ended September 30, 2017, the foreign exchange loss was $3.2 million and $6.1 million, respectively, due to a decrease in the period-end foreign exchange rate.
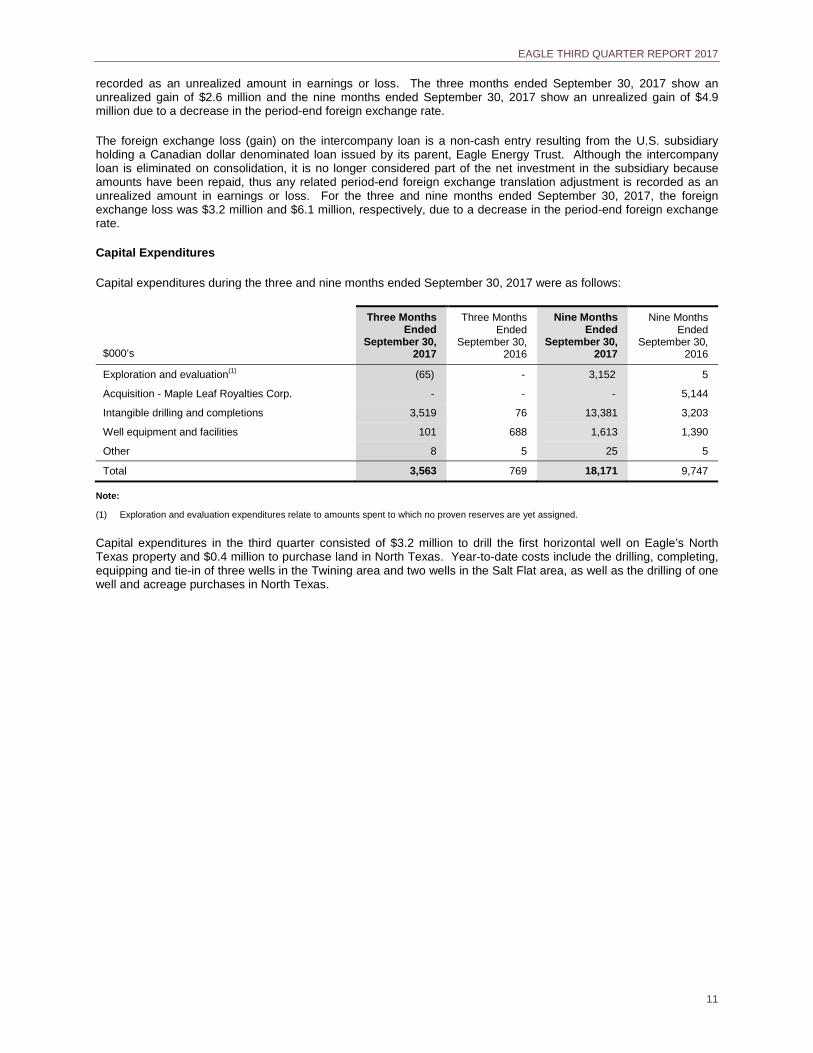
Capital Expenditures
Capital expenditures during the three and nine months ended September 30, 2017 were as follows:
$000’s
Three Months Ended
September 30, 2017
Three Months Ended
September 30, 2016
Nine Months Ended
September 30, 2017
Nine Months Ended
September 30, 2016
Exploration and evaluation(1) (65) - 3,152 5
Acquisition - Maple Leaf Royalties Corp. - - - 5,144
Intangible drilling and completions 3,519 76 13,381 3,203
Well equipment and facilities 101 688 1,613 1,390
Other 8 5 25 5
Total 3,563 769 18,171 9,747
Note:
Exploration and evaluation expenditures relate to amounts spent to which no proven reserves are yet assigned. (1)
Capital expenditures in the third quarter consisted of $3.2 million to drill the first horizontal well on Eagle’s North Texas property and $0.4 million to purchase land in North Texas. Year-to-date costs include the drilling, completing, equipping and tie-in of three wells in the Twining area and two wells in the Salt Flat area, as well as the drilling of one well and acreage purchases in North Texas.
EAGLE THIRD QUARTER REPORT 2017
12
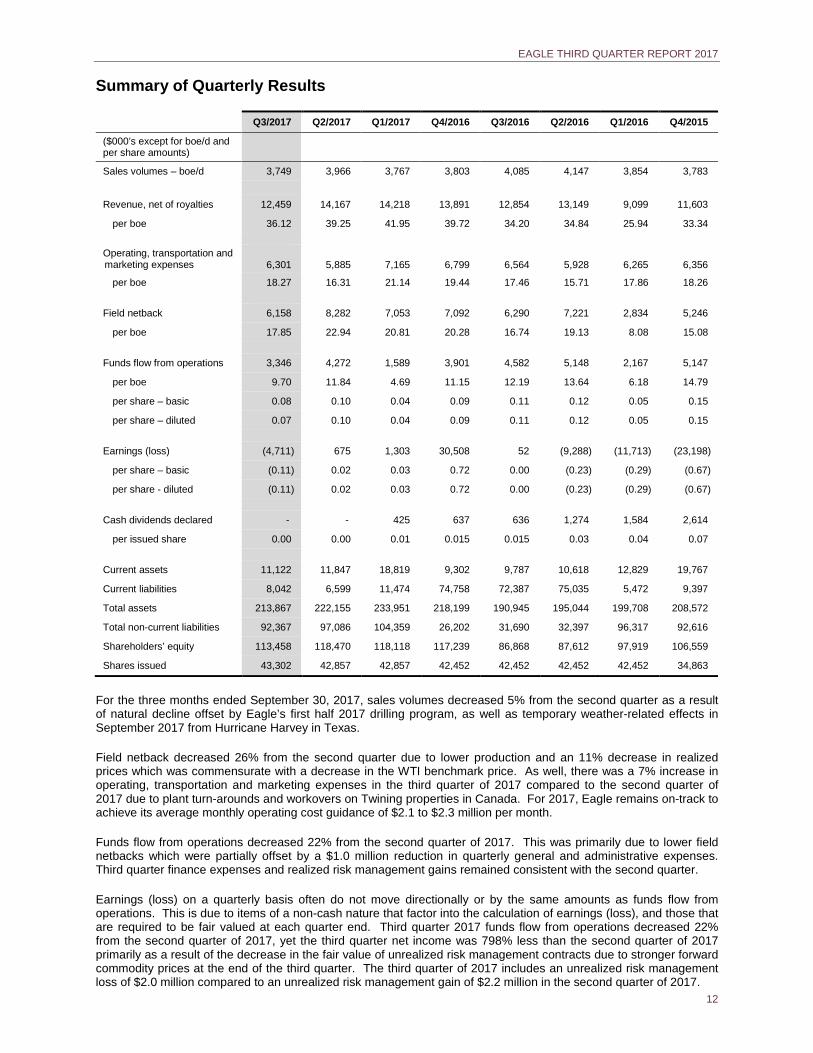
Summary of Quarterly Results
Q3/2017 Q2/2017 Q1/2017 Q4/2016 Q3/2016 Q2/2016 Q1/2016 Q4/2015
($000’s except for boe/d and per share amounts)
Sales volumes – boe/d 3,749 3,966 3,767 3,803 4,085 4,147 3,854 3,783 Revenue, net of royalties 12,459 14,167 14,218 13,891 12,854 13,149 9,099 11,603
per boe 36.12 39.25 41.95 39.72 34.20 34.84 25.94 33.34 Operating, transportation and marketing expenses 6,301 5,885 7,165 6,799 6,564 5,928 6,265 6,356
per boe 18.27 16.31 21.14 19.44 17.46 15.71 17.86 18.26 Field netback 6,158 8,282 7,053 7,092 6,290 7,221 2,834 5,246
per boe 17.85 22.94 20.81 20.28 16.74 19.13 8.08 15.08 Funds flow from operations 3,346 4,272 1,589 3,901 4,582 5,148 2,167 5,147
per boe 9.70 11.84 4.69 11.15 12.19 13.64 6.18 14.79
per share – basic 0.08 0.10 0.04 0.09 0.11 0.12 0.05 0.15
per share – diluted 0.07 0.10 0.04 0.09 0.11 0.12 0.05 0.15 Earnings (loss) (4,711) 675 1,303 30,508 52 (9,288) (11,713) (23,198)
per share – basic (0.11) 0.02 0.03 0.72 0.00 (0.23) (0.29) (0.67)
per share - diluted (0.11) 0.02 0.03 0.72 0.00 (0.23) (0.29) (0.67) Cash dividends declared - - 425 637 636 1,274 1,584 2,614
per issued share 0.00 0.00 0.01 0.015 0.015 0.03 0.04 0.07 Current assets 11,122 11,847 18,819 9,302 9,787 10,618 12,829 19,767
Current liabilities 8,042 6,599 11,474 74,758 72,387 75,035 5,472 9,397
Total assets 213,867 222,155 233,951 218,199 190,945 195,044 199,708 208,572
Total non-current liabilities 92,367 97,086 104,359 26,202 31,690 32,397 96,317 92,616
Shareholders’ equity 113,458 118,470 118,118 117,239 86,868 87,612 97,919 106,559
Shares issued 43,302 42,857 42,857 42,452 42,452 42,452 42,452 34,863
For the three months ended September 30, 2017, sales volumes decreased 5% from the second quarter as a result of natural decline offset by Eagle’s first half 2017 drilling program, as well as temporary weather-related effects in September 2017 from Hurricane Harvey in Texas.
Field netback decreased 26% from the second quarter due to lower production and an 11% decrease in realized prices which was commensurate with a decrease in the WTI benchmark price. As well, there was a 7% increase in operating, transportation and marketing expenses in the third quarter of 2017 compared to the second quarter of 2017 due to plant turn-arounds and workovers on Twining properties in Canada. For 2017, Eagle remains on-track to achieve its average monthly operating cost guidance of $2.1 to $2.3 million per month.
Funds flow from operations decreased 22% from the second quarter of 2017. This was primarily due to lower field netbacks which were partially offset by a $1.0 million reduction in quarterly general and administrative expenses. Third quarter finance expenses and realized risk management gains remained consistent with the second quarter.
Earnings (loss) on a quarterly basis often do not move directionally or by the same amounts as funds flow from operations. This is due to items of a non-cash nature that factor into the calculation of earnings (loss), and those that are required to be fair valued at each quarter end. Third quarter 2017 funds flow from operations decreased 22% from the second quarter of 2017, yet the third quarter net income was 798% less than the second quarter of 2017 primarily as a result of the decrease in the fair value of unrealized risk management contracts due to stronger forward commodity prices at the end of the third quarter. The third quarter of 2017 includes an unrealized risk management loss of $2.0 million compared to an unrealized risk management gain of $2.2 million in the second quarter of 2017.
EAGLE THIRD QUARTER REPORT 2017
13
Total non-current liabilities decreased in the third quarter from the second quarter due to a lower foreign exchange rate applied to Eagle’s U.S.-denominated debt being slightly offset by additional principal of $US 0.7 million. During the first quarter of 2017, Eagle retired all amounts drawn under its bank credit facility that was classified as a “current” liability and entered into a new four year term loan agreement which is classified as a “non-current” liability. During the second quarter, Eagle prepaid $US 4.0 million of term loan principal.
Please refer to the “Consolidated Results of Operations” and “Segmented Operations” sections of this MD&A for detailed discussions on variations during the comparative quarters and to Eagle’s previously issued interim and annual MD&A for changes in prior quarters.
Segmented Operations
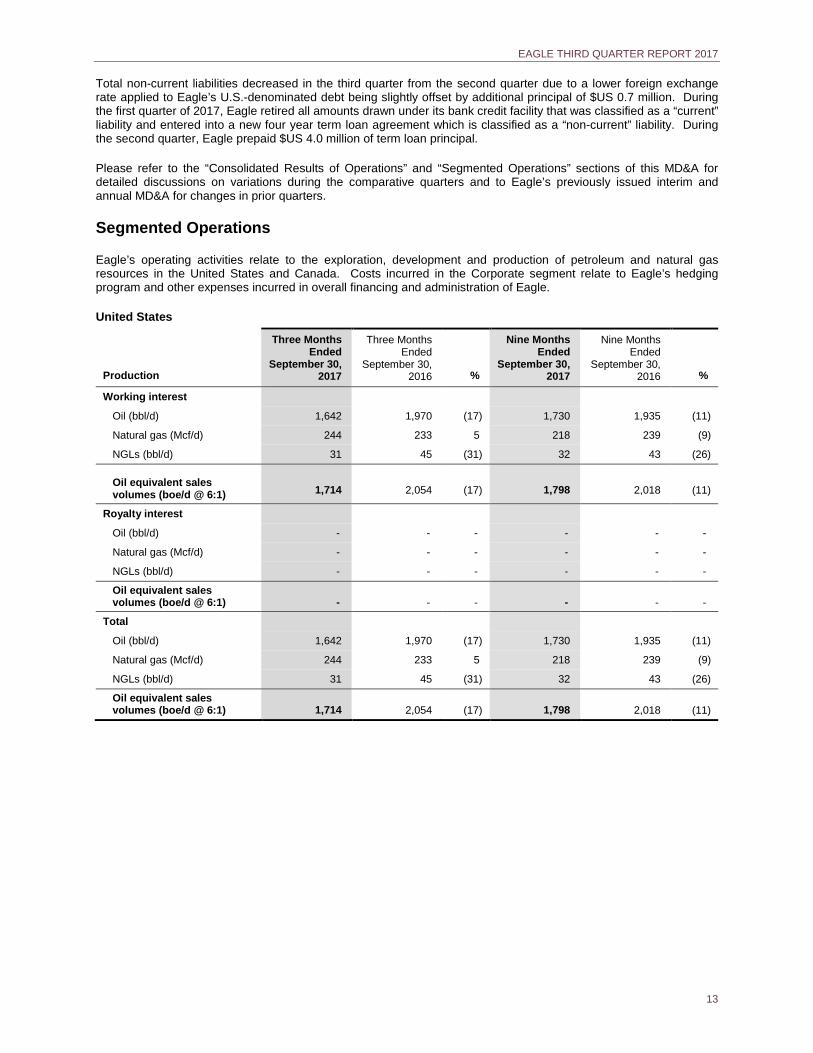
Eagle’s operating activities relate to the exploration, development and production of petroleum and natural gas resources in the United States and Canada. Costs incurred in the Corporate segment relate to Eagle’s hedging program and other expenses incurred in overall financing and administration of Eagle.
United States
Production
Three Months Ended
September 30, 2017
Three Months Ended
September 30, 2016 %
Nine Months Ended
September 30, 2017
Nine Months Ended
September 30, 2016 %
Working interest
Oil (bbl/d) 1,642 1,970 (17) 1,730 1,935 (11)
Natural gas (Mcf/d) 244 233 5 218 239 (9)
NGLs (bbl/d) 31 45 (31) 32 43 (26)
Oil equivalent sales volumes (boe/d @ 6:1) 1,714 2,054 (17) 1,798 2,018 (11)
Royalty interest
Oil (bbl/d) - - - - - -
Natural gas (Mcf/d) - - - - - -
NGLs (bbl/d) - - - - - -
Oil equivalent sales volumes (boe/d @ 6:1) - - - - - -
Total
Oil (bbl/d) 1,642 1,970 (17) 1,730 1,935 (11)
Natural gas (Mcf/d) 244 233 5 218 239 (9)
NGLs (bbl/d) 31 45 (31) 32 43 (26)
Oil equivalent sales volumes (boe/d @ 6:1) 1,714 2,054 (17) 1,798 2,018 (11)
EAGLE THIRD QUARTER REPORT 2017
14
Field Netback ($000’s)
Three Months Ended
September 30, 2017
Three Months Ended
September 30, 2016 %
Nine Months Ended
September 30, 2017
Nine Months Ended
September 30, 2016 %
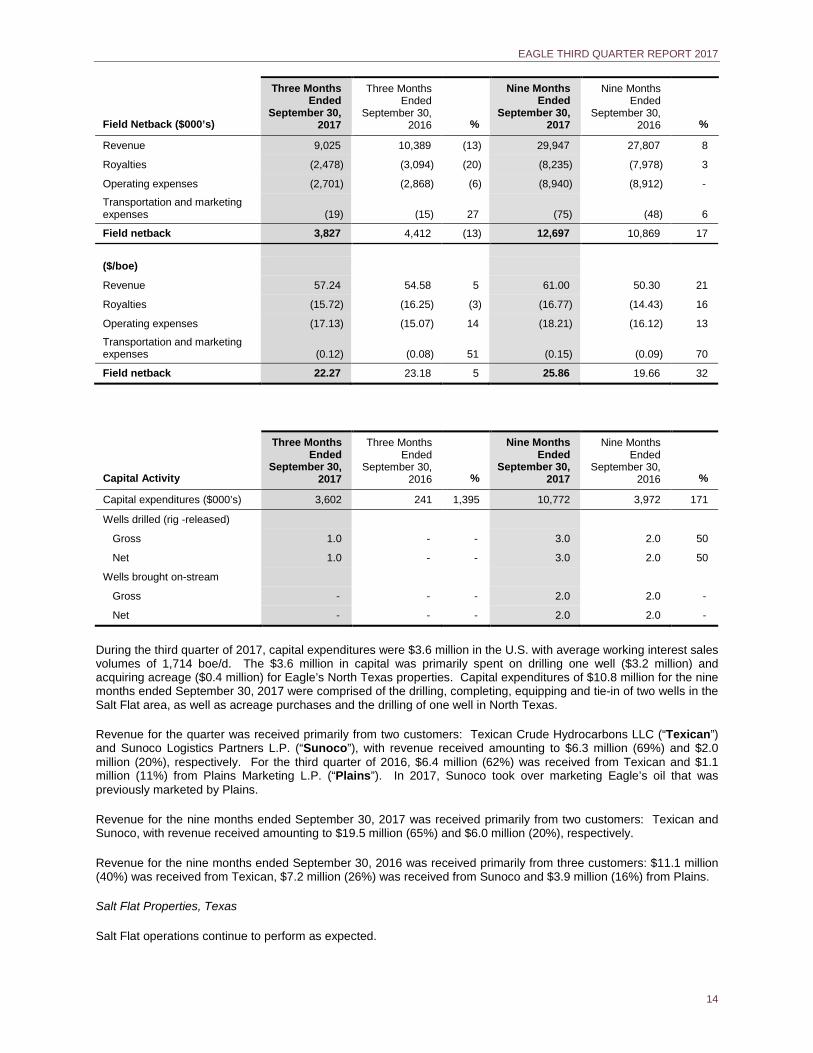
Revenue 9,025 10,389 (13) 29,947 27,807 8
Royalties (2,478) (3,094) (20) (8,235) (7,978) 3
Operating expenses (2,701) (2,868) (6) (8,940) (8,912) -
Transportation and marketing expenses (19) (15) 27 (75) (48) 6
Field netback 3,827 4,412 (13) 12,697 10,869 17 ($/boe)
Revenue 57.24 54.58 5 61.00 50.30 21
Royalties (15.72) (16.25) (3) (16.77) (14.43) 16
Operating expenses (17.13) (15.07) 14 (18.21) (16.12) 13
Transportation and marketing expenses (0.12) (0.08) 51 (0.15) (0.09) 70
Field netback 22.27 23.18 5 25.86 19.66 32
Capital Activity
Three Months Ended
September 30, 2017
Three Months Ended
September 30, 2016 %
Nine Months Ended
September 30, 2017
Nine Months Ended
September 30, 2016 %
Capital expenditures ($000’s) 3,602 241 1,395 10,772 3,972 171
Wells drilled (rig -released)
Gross 1.0 - - 3.0 2.0 50
Net 1.0 - - 3.0 2.0 50
Wells brought on-stream
Gross - - - 2.0 2.0 -
Net - - - 2.0 2.0 -
During the third quarter of 2017, capital expenditures were $3.6 million in the U.S. with average working interest sales volumes of 1,714 boe/d. The $3.6 million in capital was primarily spent on drilling one well ($3.2 million) and acquiring acreage ($0.4 million) for Eagle’s North Texas properties. Capital expenditures of $10.8 million for the nine months ended September 30, 2017 were comprised of the drilling, completing, equipping and tie-in of two wells in the Salt Flat area, as well as acreage purchases and the drilling of one well in North Texas.
Revenue for the quarter was received primarily from two customers: Texican Crude Hydrocarbons LLC (“Texican”) and Sunoco Logistics Partners L.P. (“Sunoco”), with revenue received amounting to $6.3 million (69%) and $2.0 million (20%), respectively. For the third quarter of 2016, $6.4 million (62%) was received from Texican and $1.1 million (11%) from Plains Marketing L.P. (“Plains”). In 2017, Sunoco took over marketing Eagle’s oil that was previously marketed by Plains.
Revenue for the nine months ended September 30, 2017 was received primarily from two customers: Texican and Sunoco, with revenue received amounting to $19.5 million (65%) and $6.0 million (20%), respectively.
Revenue for the nine months ended September 30, 2016 was received primarily from three customers: $11.1 million (40%) was received from Texican, $7.2 million (26%) was received from Sunoco and $3.9 million (16%) from Plains.
Salt Flat Properties, Texas
Salt Flat operations continue to perform as expected.
EAGLE THIRD QUARTER REPORT 2017
15
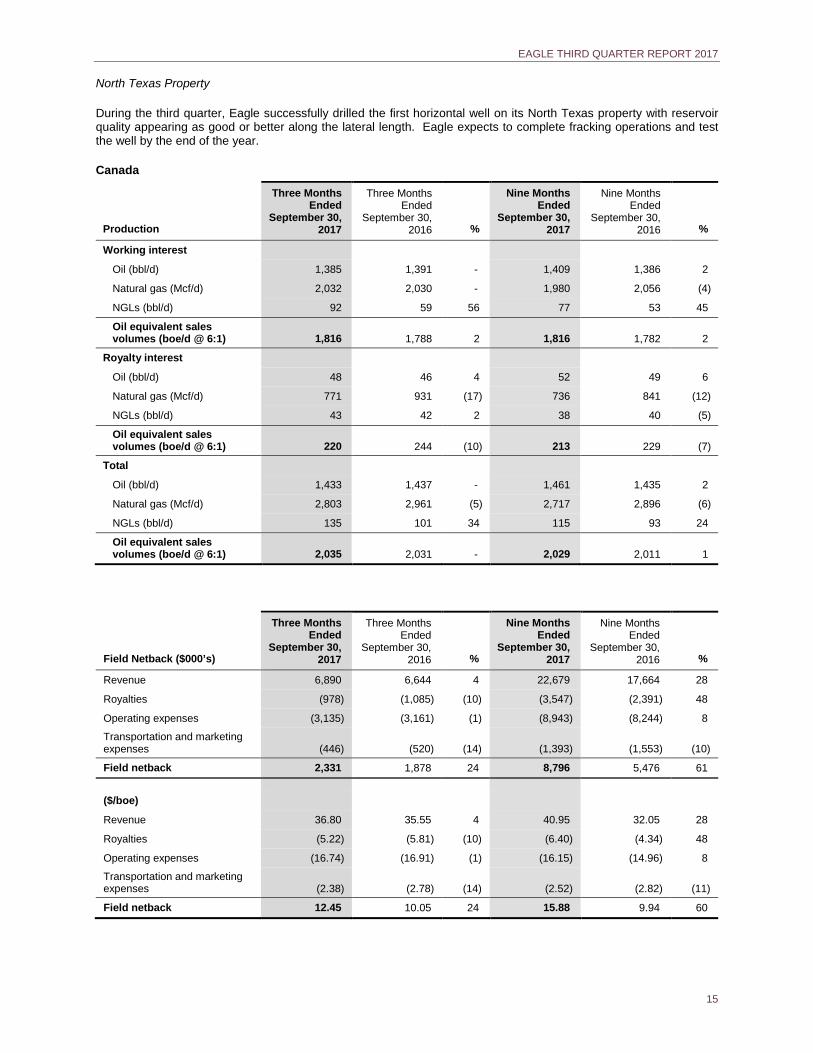
North Texas Property
During the third quarter, Eagle successfully drilled the first horizontal well on its North Texas property with reservoir quality appearing as good or better along the lateral length. Eagle expects to complete fracking operations and test the well by the end of the year.
Canada
Production
Three Months Ended
September 30, 2017
Three Months Ended
September 30, 2016 %
Nine Months Ended
September 30, 2017
Nine Months Ended
September 30, 2016 %
Working interest
Oil (bbl/d) 1,385 1,391 - 1,409 1,386 2
Natural gas (Mcf/d) 2,032 2,030 - 1,980 2,056 (4)
NGLs (bbl/d) 92 59 56 77 53 45
Oil equivalent sales volumes (boe/d @ 6:1) 1,816 1,788 2 1,816 1,782 2
Royalty interest
Oil (bbl/d) 48 46 4 52 49 6
Natural gas (Mcf/d) 771 931 (17) 736 841 (12)
NGLs (bbl/d) 43 42 2 38 40 (5)
Oil equivalent sales volumes (boe/d @ 6:1) 220 244 (10) 213 229 (7)
Total
Oil (bbl/d) 1,433 1,437 - 1,461 1,435 2
Natural gas (Mcf/d) 2,803 2,961 (5) 2,717 2,896 (6)
NGLs (bbl/d) 135 101 34 115 93 24
Oil equivalent sales volumes (boe/d @ 6:1) 2,035 2,031 - 2,029 2,011 1
Field Netback ($000’s)
Three Months Ended
September 30, 2017
Three Months Ended
September 30, 2016 %
Nine Months Ended
September 30, 2017
Nine Months Ended
September 30, 2016 %
Revenue 6,890 6,644 4 22,679 17,664 28
Royalties (978) (1,085) (10) (3,547) (2,391) 48
Operating expenses (3,135) (3,161) (1) (8,943) (8,244) 8
Transportation and marketing expenses (446) (520) (14) (1,393) (1,553) (10)
Field netback 2,331 1,878 24 8,796 5,476 61 ($/boe)
Revenue 36.80 35.55 4 40.95 32.05 28
Royalties (5.22) (5.81) (10) (6.40) (4.34) 48
Operating expenses (16.74) (16.91) (1) (16.15) (14.96) 8
Transportation and marketing expenses (2.38) (2.78) (14) (2.52) (2.82) (11)
Field netback 12.45 10.05 24 15.88 9.94 60
EAGLE THIRD QUARTER REPORT 2017
16
Capital Activity
Three Months Ended
September 30, 2017
Three Months Ended
September 30, 2016 %
Nine Months Ended
September 30, 2017
Nine Months Ended
September 30, 2016 %
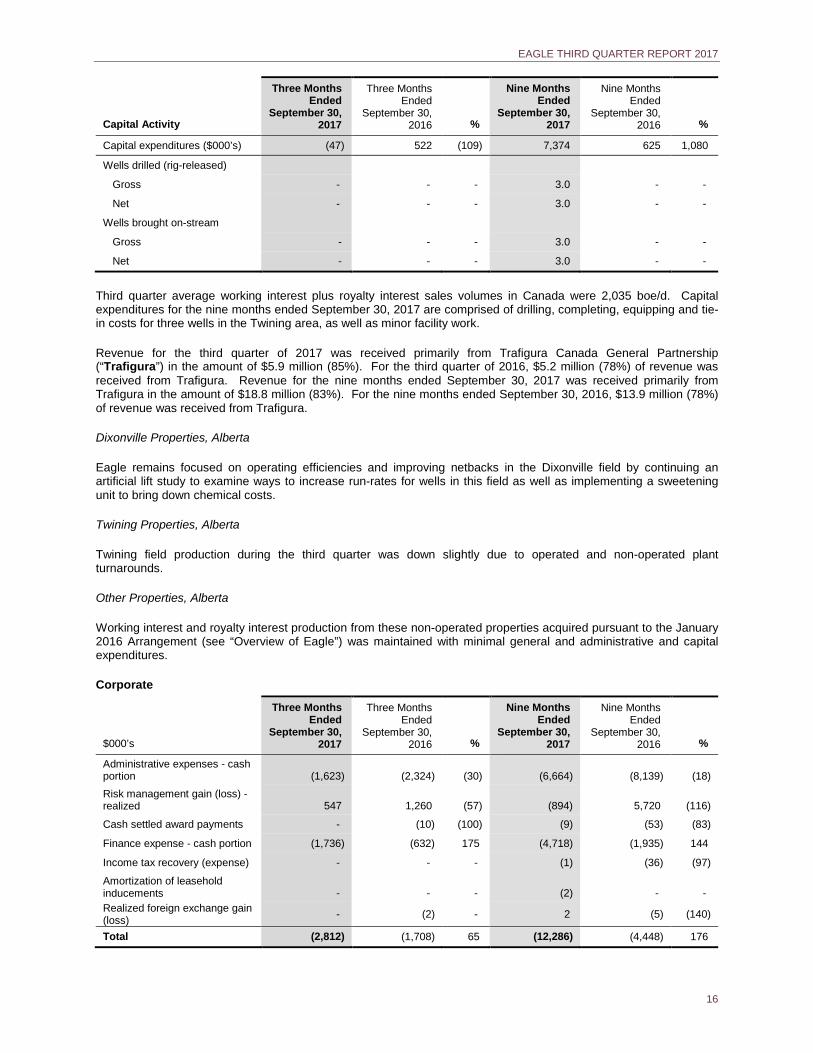
Capital expenditures ($000’s) (47) 522 (109) 7,374 625 1,080
Wells drilled (rig-released)
Gross - - - 3.0 - -
Net - - - 3.0 - -
Wells brought on-stream
Gross - - - 3.0 - -
Net - - - 3.0 - -
Third quarter average working interest plus royalty interest sales volumes in Canada were 2,035 boe/d. Capital expenditures for the nine months ended September 30, 2017 are comprised of drilling, completing, equipping and tie-in costs for three wells in the Twining area, as well as minor facility work.
Revenue for the third quarter of 2017 was received primarily from Trafigura Canada General Partnership (“Trafigura”) in the amount of $5.9 million (85%). For the third quarter of 2016, $5.2 million (78%) of revenue was received from Trafigura. Revenue for the nine months ended September 30, 2017 was received primarily from Trafigura in the amount of $18.8 million (83%). For the nine months ended September 30, 2016, $13.9 million (78%) of revenue was received from Trafigura.
Dixonville Properties, Alberta
Eagle remains focused on operating efficiencies and improving netbacks in the Dixonville field by continuing an artificial lift study to examine ways to increase run-rates for wells in this field as well as implementing a sweetening unit to bring down chemical costs.
Twining Properties, Alberta
Twining field production during the third quarter was down slightly due to operated and non-operated plant turnarounds.
Other Properties, Alberta
Working interest and royalty interest production from these non-operated properties acquired pursuant to the January 2016 Arrangement (see “Overview of Eagle”) was maintained with minimal general and administrative and capital expenditures.
Corporate
$000’s
Three Months Ended
September 30, 2017
Three Months Ended
September 30, 2016 %
Nine Months Ended
September 30, 2017
Nine Months Ended
September 30, 2016 %
Administrative expenses - cash portion (1,623) (2,324) (30) (6,664) (8,139) (18) Risk management gain (loss) - realized 547 1,260 (57) (894) 5,720 (116)
Cash settled award payments - (10) (100) (9) (53) (83)
Finance expense - cash portion (1,736) (632) 175 (4,718) (1,935) 144
Income tax recovery (expense) - - - (1) (36) (97)
Amortization of leasehold inducements - - - (2) - - Realized foreign exchange gain (loss) - (2) - 2 (5) (140)
Total (2,812) (1,708) 65 (12,286) (4,448) 176

EAGLE THIRD QUARTER REPORT 2017
17
Liquidity and Capital Resources
Generally, three sources of funding are available to Eagle: (1) internally-generated funds flow from operations; (2) debt financing, when appropriate; and (3) the issuance of additional shares, if available on favourable terms to the corporation and its shareholders. To better manage its liquidity risk, Eagle prepares annual capital expenditure budgets which are regularly monitored and updated as considered necessary. Further, Eagle utilizes authorizations for expenditures (“AFEs”) on both operated and non-operated projects to manage capital expenditures. Eagle attempts to match its payment cycle with the collection of its oil and natural gas revenue each month.
Loan Agreement
On March 13, 2017, Eagle retired all amounts drawn under its $70 million authorized bank credit facility that was held with a syndicate of Canadian chartered banks and replaced it with a new four year secured term loan from a U.S.-based lender which provided for an initial Borrowing Base of up to $US 65 million of financing (the “Loan Agreement”). This was done in anticipation of the likely withdrawal of support from certain members of Eagle’s existing syndicate of Canadian bank lenders who had indicated a desire to reduce their exposure to the junior energy lending market. Eagle’s new lender is an SEC-registered investment adviser headquartered in San Francisco with assets under management of approximately $US 3 billion and affords Eagle a partner that has the capacity to provide additional financing to fund future acquisitions.
On April 13, 2017, Eagle prepaid $US 4.0 million of term loan principal (together with all accrued and unpaid interest, but without application of any make-whole amount or repayment premium) and reduced the outstanding amount of the term loan from $US 61.5 million to $US 57.5 million.
Effective September 15, 2017, Eagle’s lender finalized its quarterly Borrowing Base redetermination and set the Borrowing Base at $76.0 million (the September 30, 2017 Canadian dollar equivalent of $US 60.9 million) to continue until the next scheduled redetermination, interim redetermination or other adjustment of the Borrowing Base pursuant to the Terms of the Loan Agreement.
On September 29, 2017, as consideration for the Loan Agreement amendment, Eagle was deemed to have drawn an additional $US 0.7 million on the term loan, bringing the total principal balance of the term loan outstanding to $US 58.2 million.
At September 30, 2017, there were no covenant violations and Eagle had a working capital surplus, excluding the non-cash risk management liability, of approximately $3.3 million and $72.7 million (the September 30, 2017 Canadian dollar equivalent of $US 58.2 million) drawn under the Loan Agreement, with the option to draw, by way of a Notice of Borrowing, the remaining incremental term loan amount up to the Borrowing Base of $US 60.9 million prior to March 13, 2018.
The details of Eagle’s debt were as follows:
$000’s September 30, 2017 December 31, 2016
Amount drawn 72,657 61,245
Less deferred financing charges (5,341) (163)
Debt 67,316 61,082
At September 30, 2017 and December 31, 2016 there were no covenant violations. Draws under the Loan Agreement are subject to quarterly covenant calculations which are directly impacted by commodity price and foreign exchange rate fluctuations. The amount available under the Loan Agreement is subject to quarterly borrowing base determinations, which are directly impacted by the value of the oil and natural gas reserves.
Violation of any financial covenant constitutes an immediate event of default under the Loan Agreement in which the lender may, without notice or demand, do any or all of the following: terminate the loan, declare amounts immediately due and payable; stop advancing money or extending credit; settle or adjust disputes and claims directly with debtors; or make any payments and do any act it considers necessary or reasonable to protect its collateral (including placing a hold on deposit accounts of Eagle and demanding and receiving possession of Eagle’s books and records).
Effective March 31, 2017, Eagle and its lender entered into the first amendment to the Loan Agreement (“First Amendment”). The purpose was to amend both the first test date for the quarterly Asset Coverage Ratio and the first scheduled date for the quarterly borrowing base redetermination to commence with a reserve report effective date of June 30, 2017 instead of March 31, 2017. The commencement dates for the Asset Coverage Ratio and the
EAGLE THIRD QUARTER REPORT 2017
18
borrowing base redetermination are now consistent with the commencement date of the quarterly Consolidated Leverage Ratio.
Effective June 29, 2017, Eagle and its lender entered into a second amendment to the Loan Agreement (“Second Amendment”). The purpose was to relax the covenant thresholds for the Consolidated Leverage Ratio and Consolidated Fixed Charge Ratio by 10% in recognition of prevailing low oil prices during the second quarter and to also amend certain definitions relating to the lending value calculation to make the calculation more practical, workable and less affected by single day volatility in commodity futures pricing.
Effective September 29, 2017 Eagle and its lender entered into the third amendment to the Loan Agreement (“Third Amendment”). The purpose was to relax the covenant threshold for the Consolidated Fixed Charge Ratio by 10% in recognition of prevailing low oil prices.
The following lists the key terms of the Loan Agreement between Eagle and its lender after giving effect to the First, Second and Third Amendments and the September 15, 2017 quarterly Borrowing Base redetermination:
• Effective Date - March 13, 2017
• Term - 4 years
• Maturity Date - March 13, 2021
• Aggregate Term Loan Commitment / Borrowing Base - $US 60.9 million
• Borrowing Base Redeterminations – The borrowing base is re-determined quarterly and becomes effective when the new borrowing base notice is received from the lender. Such borrowing base remains in effect until the next borrowing base redetermination. The quarterly borrowing base redeterminations are effective for Eagle and its lender on March 15, June 15, September 15 and December 15 of each year, commencing September 15, 2017. For purposes of quarterly borrowing base redeterminations, Eagle will provide its lender with quarterly reserve reports with effective dates of December 31, March 31, June 30 and September 30, commencing June 30, 2017. Failure of Eagle to provide a quarterly reserve report constitutes an immediate event of default.
Upon receipt by the lender of the quarterly reserve report (and other reports, data and supplemental information as may be reasonably requested), the lender will evaluate the information and propose a new borrowing base based upon an advance rate of 75% of the proved developed producing reserves value, before tax, discounted at 10% (“PDP PV10 reserves value”). The forward pricing used to calculate the PDP PV10 reserves value is based on 48 months of NYMEX futures contracts and is defined in the Loan Agreement.
In the event that a borrowing base redetermination results in the outstanding principal of the term loan exceeding the borrowing base then in effect (“Term Loan Excess”), then, after receiving a new borrowing base notice of such new or adjusted borrowing base (such date of receipt of notice being the “Borrowing Base Notification Date”), Eagle will, no later than twenty (20) business days from the Borrowing Base Notification Date, repay an amount equal to (A) the then applicable Term Loan Excess plus (B) 2% of the aggregate principal amount of any such repayment. If Eagle fails to pay the amount under (B), then that amount bears interest until paid in full at a rate of LIBOR plus 13% per annum. A non-payment by Eagle when and as required of amounts to be paid or repaid would constitute an immediate event of default.
• Coupon – LIBOR plus 8% (with LIBOR having a floor of 1%)
• Financial covenants – The four financial covenants in the Loan Agreement are briefly described below. Changes to the Consolidated Fixed Charge Ratio resulting from the Third Amendment as indicated in italics:
(a) Consolidated Leverage Ratio
As at the end of each fiscal quarter, commencing with the quarter ending June 30, 2017, Eagle is to maintain a Consolidated Leverage Ratio of not greater than (i) for the quarter ending June 30, 2017, 3.85 to 1.00 (ii) for the quarters ending September 30, 2017 and December 31, 2017, 3.50 to 1.00 and (iii) for each quarter ending on or after March 31, 2018, 3.00 to 1.00.
As at September 30, 2017, the Consolidated Leverage Ratio was 3.24 to 1.00.
The “Consolidated Leverage Ratio” is defined in the Loan Agreement as the ratio of Consolidated Funded Debt to Consolidated Adjusted EBITDAX (as defined below) for the trailing four fiscal quarters. Notwithstanding the foregoing, for the purposes of determining the Consolidated
EAGLE THIRD QUARTER REPORT 2017
19
Leverage Ratio, (i) Consolidated Adjusted EBITDAX for the four fiscal quarter period ending June 30, 2017 shall be deemed equal to Consolidated Adjusted EBITDAX for the fiscal quarter ending June 30, 2017 multiplied by 4, (ii) Consolidated Adjusted EBITDAX for the four fiscal quarter period ending on September 30, 2017 shall be deemed equal to Consolidated Adjusted EBITDAX for the two fiscal quarter period then ending multiplied by 2, and (iii) Consolidated Adjusted EBITDAX for the four fiscal quarter period ending on December 31, 2017 shall be deemed equal to Consolidated Adjusted EBITDAX for the three fiscal quarter period then ending multiplied by 4/3.
(b) Consolidated Fixed Charge Ratio
As at the end of each fiscal quarter, Eagle is to maintain a Consolidated Fixed Charge Ratio of not less than 2.25 to 1.00 (prior to the Third Amendment the ratio for September 30, 2017 and subsequent quarters was 2.50 to 1.00).
As at September 30, 2017, the Consolidated Fixed Charge Ratio was 2.32 to 1.00.
The “Consolidated Fixed Charge Ratio” for the fiscal quarter is defined in the Loan Agreement as the ratio that (i) Consolidated Adjusted EBITDAX plus (ii) income tax payments minus (iii) maintenance capital expenditures associated with proved developed producing reserves is to interest expense (each for the fiscal quarter).
(c) Asset Coverage Ratio
As at the end of each fiscal quarter, commencing with a June 30, 2017 effective date reserve report internally prepared by Eagle, Eagle is to maintain an Asset Coverage Ratio of not less than 1.333 to 1.000.
As at September 30, 2017, the Asset Coverage Ratio was 1.38 to 1.00.
The “Asset Coverage Ratio” is defined in the Loan Agreement as the ratio of the PDP PV10 reserves value (using prices quoted on NYMEX and before tax) to the aggregate principal balance outstanding under the term loan.
(d) Consolidated Current Ratio
As at the end of each fiscal quarter, commencing with the quarter ended March 31, 2017, Eagle is to maintain a Consolidated Current Ratio of not less than 1.00 to 1.00.
As at September 30, 2017, the Consolidated Current Ratio was 1.42 to 1.00.
The “Consolidated Current Ratio” is defined in the Loan Agreement as the ratio of Consolidated Current Assets to Consolidated Current Liabilities, but, in each case, excluding any risk management assets or risk management liabilities that are classified as current.
“Consolidated Adjusted EBITDAX” as defined in the Loan Agreement means:
(a) net income; plus;
(b) interest expense, accrued taxes, depreciation, depletion, amortization, exploration expense and other non-recurring expenses that do not represent a cash item in such period or any future period; plus or minus;
(c) gains or losses attributable to write-ups or write-downs of assets; plus or minus;
(d) unrealized foreign exchange gains or losses; plus or minus;
(e) non-cash gains, losses or adjustments under Financial Accounting Standards Board (FASB) Statement 133 as a result of changes in the fair market value of derivatives; plus or minus;
(f) non-cash share based compensation or recovery amounts.
In addition, EBITDAX is calculated after giving effect on a pro-forma basis to any permitted acquisition or asset disposition as if such acquisition or disposition occurred at the beginning of such period.
EAGLE THIRD QUARTER REPORT 2017
20
Working Capital
At September 30, 2017, Eagle had a working capital surplus, excluding the non-cash risk management liability, of approximately $3.3 million and $72.7 million (the September 30, 2017 Canadian dollar equivalent of $US 58.2 million) drawn under the Loan Agreement, with the option to draw, by way of a Notice of Borrowing, the remaining incremental term loan amount of up to the Borrowing Base of $US 60.9 million prior to March 13, 2018. See “Loan Agreement” above.
Shareholders’ Equity, Dividends and Outstanding Share Data
During the three months ended September 30, 2017, 321,433 RSUs and 123,401 PSUs (nine months ended September 30, 2017 - 609,116 and 241,247 respectively) vested and were settled through the issuance of 444,835 common shares from treasury with a value of $264,000 (nine months ended September 30, 2017 850,363 shares were issued with a value of $503,000).
Eagle suspended its dividend effective March 13, 2017.
At September 30, 2017, Eagle had issued 43,301,986 shares (December 31, 2016 – 42,451,623). As at the date of this MD&A, 43,301,986 shares are issued and outstanding and 1,635,668 RSUs and 607,956 PSUs are outstanding.
Commitments
Eagle has committed to future payments as follows:
$000’s Total Less than
1 year 1 – 3
years Greater than
3 years
Operating leases(1) (2) (3) 4,108 594 656 2,858
Total contractual obligations 4,108 594 656 2,858
Notes:
On January 1, 2013, Eagle entered into a lease for office space in Calgary which originally had an approximate 61 month term from January 8, (1)2013 to February 7, 2018. In May 2016, the lease was amended to extend the lease term and decrease the annual basic rental charge. The new term began August 1, 2016 and terminates February 28, 2023. Total minimum lease payments during the term of the lease from August 1, 2016 through February 28, 2023 approximate $3.1 million and include a leasehold improvement allowance up to $0.2 million, with 65 months and approximately $2.4 million remaining at September 30, 2017.
Eagle entered into a lease in Houston on April 1, 2011, which originally had an approximate 30 month term from April 7, 2011 through September (2)30, 2013. On November 21, 2012, the lease was extended for an additional 63 month period from October 1, 2013 to December 31, 2017 and the premise space was expanded to incorporate additional square footage. In September, 2017, Eagle received landlord permission to remain in the leased space through January 31, 2018. Total minimum lease payments during the term of the lease approximate $US 1.4 million ($CA 1.8 million) and include a leasehold improvement allowance of $US 0.1 million with 4 months and approximately $US 0.1 million remaining at September 30, 2017. In $CA, the remaining future minimum lease payments approximate $ 0.13 million translated at the exchange rate in effect at the balance sheet date of $US 1.00 equal to $CA 1.31.
Eagle entered into an office lease in Houston on September 22, 2017 to replace the lease expiring on December 31, 2017. The term of the lease (3)is from February 1, 2018 to August 31, 2025. Total minimum lease payments during the term of the lease approximate $US 1.2 million. In $CA, the total minimum lease payments approximate $1.5 million translated at the exchange rate in effect at the balance sheet date of $US 1.00 equal to $CA 1.31.
Non-IFRS Financial Measures
Statements throughout this MD&A make reference to the terms “field netback”, “Consolidated Adjusted EBITDAX”, “Consolidated Leverage Ratio”, “Consolidated Fixed Charge Ratio”, “Asset Coverage Ratio” and “Consolidated Current Ratio”, which are non-IFRS financial measures that do not have a standardized meaning prescribed by IFRS and may not be comparable to similar measures presented by other issuers.
“Field netback” is calculated by subtracting royalties, operating expenses, and transportation and marketing expenses from revenues. This method of calculating field netback is in accordance with the standards set out in the Canadian Oil and Gas Evaluation Handbook maintained by the Society of Petroleum Evaluation Engineers (Calgary Chapter). Management believes that field netback provides useful information to investors and management because such a measure reflects the quality of production and the level of profitability.
The terms “Consolidated Adjusted EBITDAX”, “Consolidated Leverage Ratio”, “Consolidated Fixed Charge Ratio”, “Asset Coverage Ratio” and “Consolidated Current Ratio” are used for purposes of covenant calculations in the Loan Agreement and are calculated as described above under the heading, “Liquidity and Capital Resources”.
EAGLE THIRD QUARTER REPORT 2017
21
No Change in Internal Controls over Financial Reporting during the Period July 1, 2017 to September 30, 2017
During the period beginning on July 1, 2017 and ended on September 30, 2017, there was no change in Eagle’s internal controls over financial reporting that has materially affected, or is reasonably likely to materially affect, Eagle’s internal controls over financial reporting. It should be noted that Eagle’s internal control system, no matter how well designed, can provide only reasonable, but not absolute assurance of detecting, preventing and deterring errors or fraud.
Critical Accounting Estimates and Judgments
There have been no changes made to Eagle’s critical accounting estimates and judgments for the third quarter of 2017. Further information about Eagle’s critical accounting estimates and judgments can be found in the notes to Eagle’s annual audited consolidated financial statements and MD&A for the year ended December 31, 2016.
Accounting Standards and Interpretations
The accounting policies followed in these Interim Financial Statements are consistent with those of the previous financial year, except for income tax expense for an interim period (which is based on an estimated average annual effective income tax rate).
There were no new or amended standards issued during the three and nine months ended September 30, 2017 which will be applicable to Eagle in future periods.
Note about Forward-Looking Statements
Certain of the statements made and information contained in this MD&A are forward-looking statements and forward-looking information (collectively referred to as “forward-looking statements”) within the meaning of Canadian securities laws. All statements other than statements of historic fact are forward-looking statements. Eagle cautions investors that important factors could cause Eagle’s actual results to differ materially from those projected, or set out, in any forward-looking statements included in this MD&A.
In particular, and without limitation, this MD&A contains forward-looking statements pertaining to the following:
• Eagle’s expectation that 2017 general and administrative expenses will be approximately 23% below 2016 levels;
• Eagle’s new office lease in Houston and expected 2018 annual rent reduction and average annual savings resulting therefrom;
• Eagle’s 2017 capital budget, specific uses, timing of commencement of drilling, drilling results and relationship to 2017 expected funds flow from operations;
• Eagle’s expectations regarding its 2017 full year average production, monthly operating costs, ending net debt and field netbacks (excluding hedges);
• Eagle’s expectations regarding its 2017 funds flow from operations and sensitivity of this metric to changes in commodity prices, production and foreign exchange rates;
• anticipated crude oil, NGLs and natural gas production weighting and prices; • Eagle’s loan with its lender, including terms relating to maturity date, borrowing base redeterminations, future
drawings, and financial covenant ratio calculations; and • Eagle’s expectations that its lender affords Eagle a partner that has the capacity to provide additional financing to
fund future acquisitions.
With respect to forward-looking statements contained in this MD&A, assumptions have been made regarding, among other things:
• future crude oil, NGL and natural gas prices, differentials and weighting; • future foreign exchange rates; • future production levels; • future capital expenditures and the ability of Eagle to obtain financing on acceptable terms for its capital projects,
operations and future acquisitions; • Eagle’s 2017 capital budget, which is subject to change in light of ongoing results, prevailing economic
circumstances, commodity prices and industry conditions and regulations; • not including capital required to pursue future acquisitions in the forecasted capital expenditures;
EAGLE THIRD QUARTER REPORT 2017
22
• future production estimates, which are based on the proposed drilling program with a success rate that, in turn, is based upon historical drilling success and an evaluation of the particular wells to be drilled, among other things; and
• projected operating costs, which are estimated based on historical information and anticipated changes in the cost of equipment and services, among other things.
Eagle’s actual results could differ materially from those anticipated in these forward-looking statements as a result of the risk factors set forth below and those in the AIF:
• volatility of crude oil, NGL, and natural gas prices; • commodity supply and demand; • fluctuations in foreign exchange and interest rates; • inherent risks and changes in costs associated with the development of petroleum properties; • ultimate recoverability of reserves; • timing, results and costs of drilling and production activities; • availability and terms of financing and capital; and • new regulations and legislation that apply to the operations of Eagle and its subsidiaries.
Additional risks and uncertainties affecting Eagle are contained in the AIF under the heading “Risk Factors”.
As a result of these risks, actual performance and financial results in 2017 may differ materially from any projections of future performance or results expressed or implied by these forward‐looking statements. Eagle’s production rates, operating costs, field netbacks, drilling program, 2017 capital budget, funds flow from operations, ending net debt and reserves are subject to change in light of ongoing results, prevailing economic circumstances, obtaining regulatory approvals, commodity prices, exchange rates, financing terms, and industry conditions and regulations. New factors emerge from time to time, and it is not possible for management to predict all of these factors or to assess, in advance, the impact of each such factor on Eagle’s business, or the extent to which any factor, or combination of factors, may cause actual results to differ materially from those contained in any forward-looking statement.
Undue reliance should not be placed on forward-looking statements, which are inherently uncertain, are based on estimates and assumptions, and are subject to known and unknown risks and uncertainties (both general and specific) that contribute to the possibility that the future events or circumstances contemplated by the forward-looking statements will not occur. Although management believes that the expectations conveyed by the forward-looking statements are reasonable based on information available to it on the date the forward-looking statements were made, there can be no assurance that the plans, intentions or expectations upon which forward-looking statements are based will in fact be realized. Actual results will differ, and the difference may be material and adverse to Eagle and its shareholders. These statements speak only as of the date of this MD&A and may not be appropriate for other purposes. Eagle does not undertake any obligation, except as required by applicable securities legislation, to update publicly or to revise any of the included forward-looking statements, whether as a result of new information, future events or otherwise.
Note Regarding Barrel of Oil Equivalency
This MD&A contains disclosure expressed as “boe” or “boe/d”. All oil and natural gas equivalency volumes have been derived using the conversion ratio of six thousand cubic feet (“Mcf”) of natural gas to one barrel (“bbl”) of oil. Equivalency measures may be misleading, particularly if used in isolation. A conversion ratio of 6 Mcf:1 bbl is based on an energy equivalency conversion method primarily applicable at the burner tip and does not represent a value equivalency at the well head. In addition, given that the value ratio based on the current price of oil as compared to natural gas is significantly different from the energy equivalent of six to one, utilizing a boe conversion ratio of 6 Mcf:1 bbl would be misleading as an indication of value.
EAGLE THIRD QUARTER REPORT 2017
Eagle Energy Inc. Condensed Consolidated Interim Financial Statements (in Canadian dollars) (unaudited) For the three and nine months ended September 30, 2017 and September 30, 2016
EAGLE THIRD QUARTER REPORT 2017
1
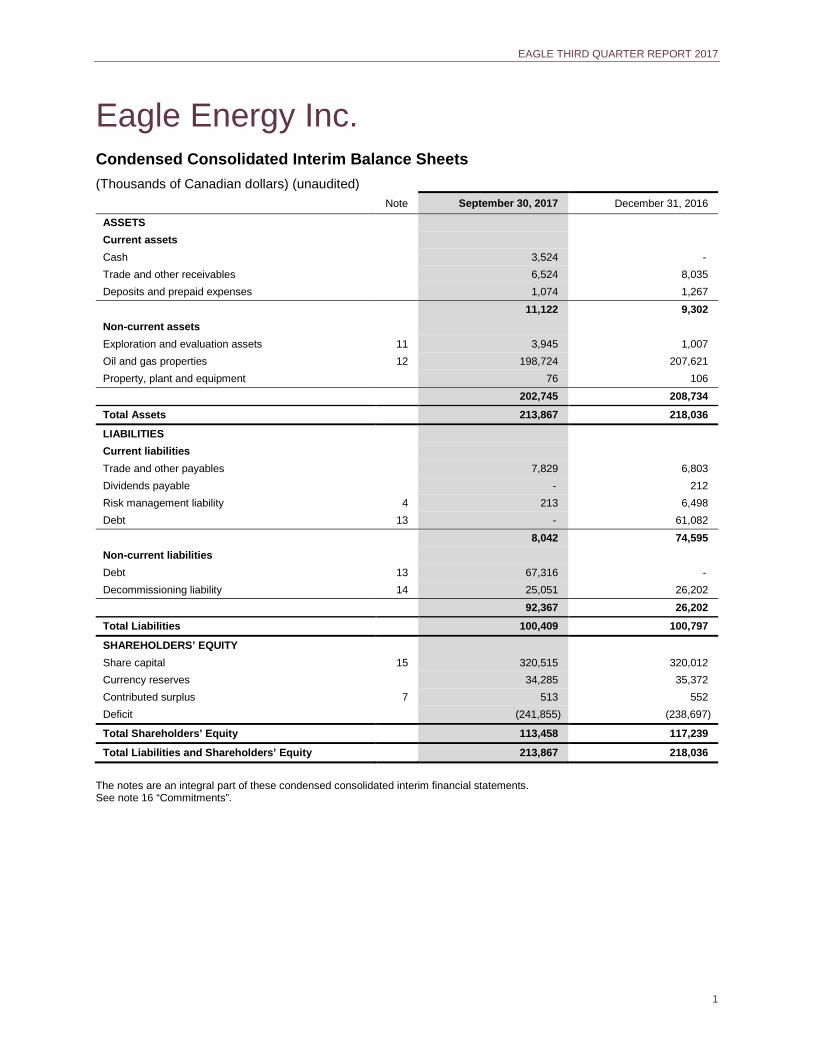
Eagle Energy Inc. Condensed Consolidated Interim Balance Sheets (Thousands of Canadian dollars) (unaudited)
Note September 30, 2017 December 31, 2016
ASSETS Current assets Cash 3,524 - Trade and other receivables 6,524 8,035 Deposits and prepaid expenses 1,074 1,267 11,122 9,302 Non-current assets Exploration and evaluation assets 11 3,945 1,007 Oil and gas properties 12 198,724 207,621 Property, plant and equipment 76 106
202,745 208,734 Total Assets 213,867 218,036
LIABILITIES Current liabilities Trade and other payables 7,829 6,803 Dividends payable - 212 Risk management liability 4 213 6,498 Debt 13 - 61,082 8,042 74,595 Non-current liabilities Debt 13 67,316 - Decommissioning liability 14 25,051 26,202
92,367 26,202 Total Liabilities 100,409 100,797
SHAREHOLDERS’ EQUITY Share capital 15 320,515 320,012 Currency reserves 34,285 35,372 Contributed surplus 7 513 552 Deficit (241,855) (238,697)
Total Shareholders’ Equity 113,458 117,239
Total Liabilities and Shareholders’ Equity 213,867 218,036
The notes are an integral part of these condensed consolidated interim financial statements. See note 16 “Commitments”.
EAGLE THIRD QUARTER REPORT 2017
2
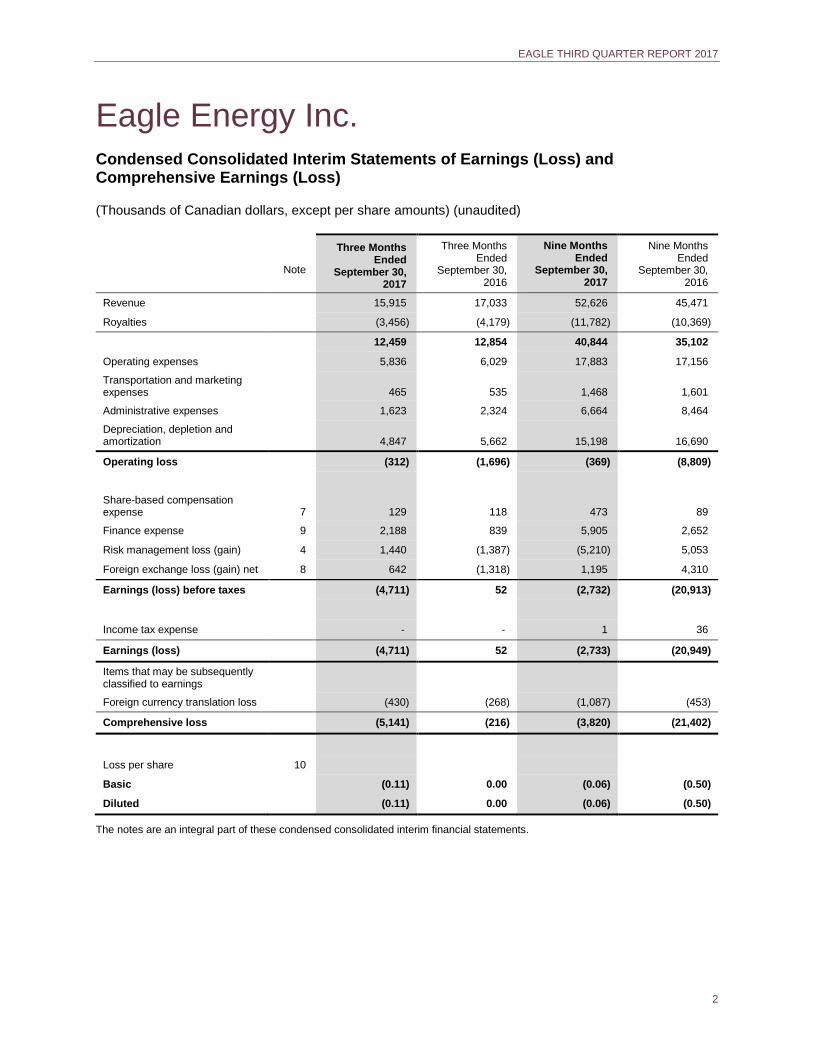
Eagle Energy Inc. Condensed Consolidated Interim Statements of Earnings (Loss) and Comprehensive Earnings (Loss)
(Thousands of Canadian dollars, except per share amounts) (unaudited)
Note
Three Months Ended
September 30, 2017
Three Months Ended
September 30, 2016
Nine Months Ended
September 30, 2017
Nine Months Ended
September 30, 2016
Revenue 15,915 17,033 52,626 45,471
Royalties (3,456) (4,179) (11,782) (10,369)
12,459 12,854 40,844 35,102
Operating expenses 5,836 6,029 17,883 17,156
Transportation and marketing expenses
465 535 1,468 1,601
Administrative expenses 1,623 2,324 6,664 8,464
Depreciation, depletion and amortization 4,847 5,662 15,198 16,690
Operating loss (312) (1,696) (369) (8,809)
Share-based compensation expense 7 129 118 473 89
Finance expense 9 2,188 839 5,905 2,652
Risk management loss (gain) 4 1,440 (1,387) (5,210) 5,053
Foreign exchange loss (gain) net 8 642 (1,318) 1,195 4,310
Earnings (loss) before taxes (4,711) 52 (2,732) (20,913)
Income tax expense - - 1 36
Earnings (loss) (4,711) 52 (2,733) (20,949)
Items that may be subsequently classified to earnings
Foreign currency translation loss (430) (268) (1,087) (453)
Comprehensive loss (5,141) (216) (3,820) (21,402)
Loss per share 10
Basic (0.11) 0.00 (0.06) (0.50)
Diluted (0.11) 0.00 (0.06) (0.50)
The notes are an integral part of these condensed consolidated interim financial statements.
EAGLE THIRD QUARTER REPORT 2017
3
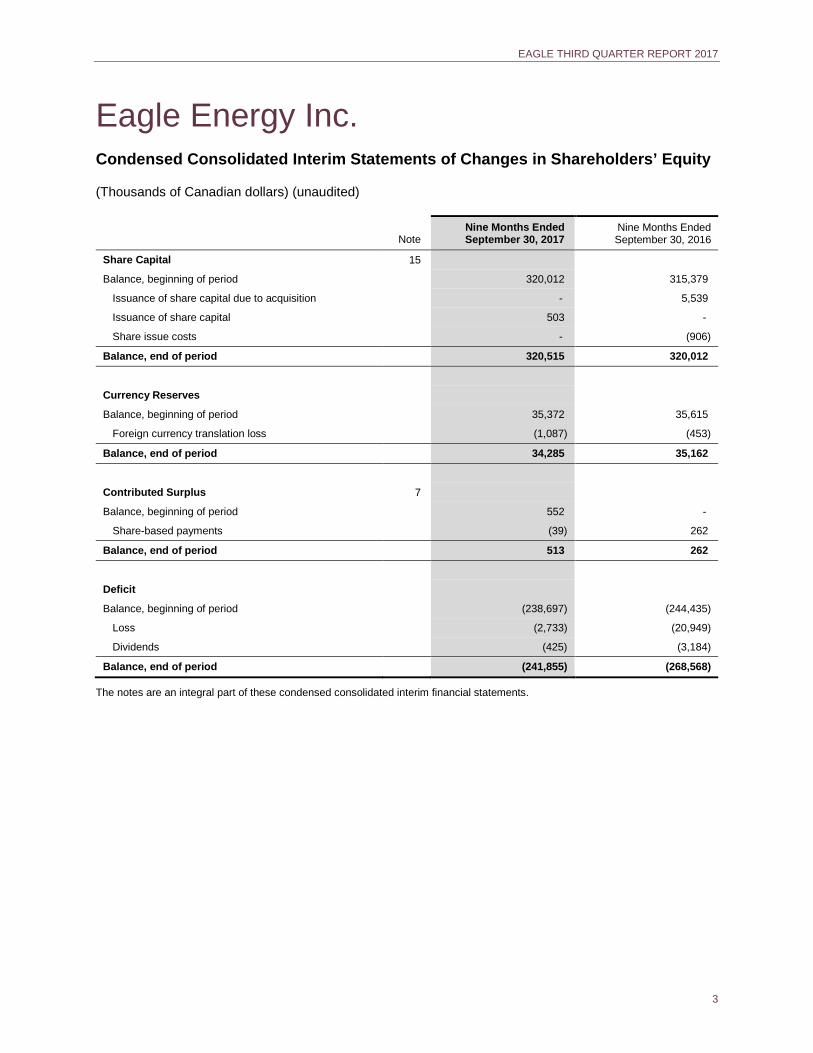
Eagle Energy Inc. Condensed Consolidated Interim Statements of Changes in Shareholders’ Equity
(Thousands of Canadian dollars) (unaudited)
Note Nine Months Ended September 30, 2017
Nine Months Ended September 30, 2016
Share Capital 15
Balance, beginning of period 320,012 315,379
Issuance of share capital due to acquisition - 5,539
Issuance of share capital 503 -
Share issue costs - (906)
Balance, end of period 320,515 320,012
Currency Reserves
Balance, beginning of period 35,372 35,615
Foreign currency translation loss (1,087) (453)
Balance, end of period 34,285 35,162
Contributed Surplus 7
Balance, beginning of period 552 -
Share-based payments (39) 262
Balance, end of period 513 262
Deficit
Balance, beginning of period (238,697) (244,435)
Loss (2,733) (20,949)
Dividends (425) (3,184)
Balance, end of period (241,855) (268,568)
The notes are an integral part of these condensed consolidated interim financial statements.
EAGLE THIRD QUARTER REPORT 2017
4
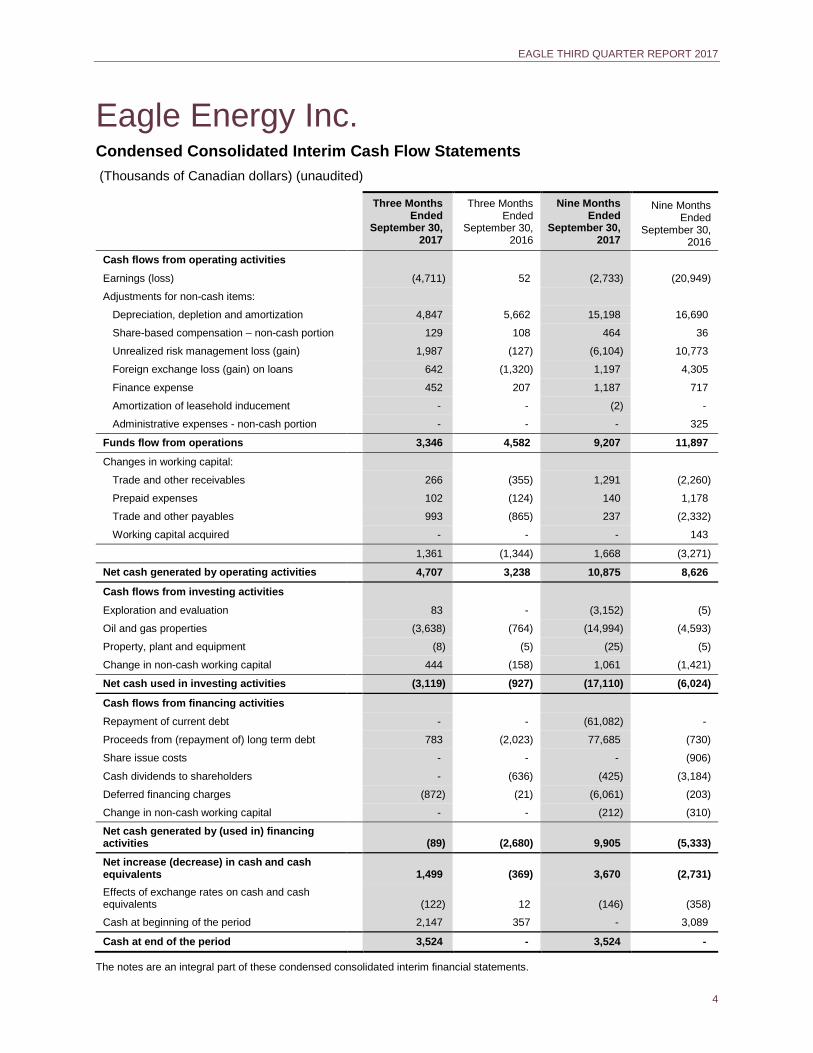
Eagle Energy Inc. Condensed Consolidated Interim Cash Flow Statements (Thousands of Canadian dollars) (unaudited)
Three Months Ended
September 30, 2017
Three Months Ended
September 30, 2016
Nine Months Ended
September 30, 2017
Nine Months Ended
September 30, 2016
Cash flows from operating activities Earnings (loss) (4,711) 52 (2,733) (20,949)
Adjustments for non-cash items:
Depreciation, depletion and amortization 4,847 5,662 15,198 16,690
Share-based compensation – non-cash portion 129 108 464 36
Unrealized risk management loss (gain) 1,987 (127) (6,104) 10,773
Foreign exchange loss (gain) on loans 642 (1,320) 1,197 4,305
Finance expense 452 207 1,187 717
Amortization of leasehold inducement - - (2) -
Administrative expenses - non-cash portion - - - 325
Funds flow from operations 3,346 4,582 9,207 11,897
Changes in working capital:
Trade and other receivables 266 (355) 1,291 (2,260)
Prepaid expenses 102 (124) 140 1,178
Trade and other payables 993 (865) 237 (2,332)
Working capital acquired - - - 143
1,361 (1,344) 1,668 (3,271)
Net cash generated by operating activities 4,707 3,238 10,875 8,626
Cash flows from investing activities
Exploration and evaluation 83 - (3,152) (5)
Oil and gas properties (3,638) (764) (14,994) (4,593)
Property, plant and equipment (8) (5) (25) (5)
Change in non-cash working capital 444 (158) 1,061 (1,421)
Net cash used in investing activities (3,119) (927) (17,110) (6,024)
Cash flows from financing activities
Repayment of current debt - - (61,082) -
Proceeds from (repayment of) long term debt 783 (2,023) 77,685 (730)
Share issue costs - - - (906)
Cash dividends to shareholders - (636) (425) (3,184)
Deferred financing charges (872) (21) (6,061) (203)
Change in non-cash working capital - - (212) (310)
Net cash generated by (used in) financing activities (89) (2,680) 9,905 (5,333)
Net increase (decrease) in cash and cash equivalents 1,499 (369) 3,670 (2,731) Effects of exchange rates on cash and cash equivalents (122) 12 (146) (358)
Cash at beginning of the period 2,147 357 - 3,089
Cash at end of the period 3,524 - 3,524 -
The notes are an integral part of these condensed consolidated interim financial statements.
EAGLE THIRD QUARTER REPORT 2017
5
Eagle Energy Inc. Notes to Condensed Consolidated Interim Financial Statements (unaudited)
For the three months and nine months ended September 30, 2017 and September 30, 2016
(in Canadian dollars)
1. Reporting Entity / Structure of Eagle Energy Inc.
On January 27, 2016, Eagle Energy Trust closed the plan of arrangement (the “Arrangement”) involving an acquisition, by way of share exchange and conversion of the Trust into a corporate structure. The resulting public entity, named Eagle Energy Inc. (“Eagle”), is listed on the Toronto Stock Exchange with its common shares trading under the symbol “EGL”. Refer to note 5 “Business Combination”.
Throughout these notes to the condensed consolidated interim financial statements, Eagle and its subsidiaries are referred to collectively as the “Company” or “Eagle” for purposes of convenience.
Eagle’s address is: Suite 2710, 500 - 4th Avenue SW, Calgary, AB T2P 2V6.
2.1. Basis of Preparation
The foreign exchange rate at September 30, 2017 was $US 1.00 equal to $CA 1.25 (December 31, 2016 - $US 1.00 equal to $CA 1.34), and the average foreign exchange rate for the nine months ended September 30, 2017 was $US 1.00 equal to $CA 1.31 (for the nine months ended September 30, 2016 - $US 1.00 equal to $CA 1.32).
Basis of Accounting
The condensed consolidated interim financial statements were authorized for issue in accordance with a resolution of the Board of Directors made on November 9, 2017.
These condensed consolidated interim financial statements have been prepared in accordance with International Financial Reporting Standards (“IFRS”) as issued by the International Accounting Standards Board (“IASB”) applicable to the preparation of interim financial statements, including IAS 34, interim Financial Reporting and have been prepared following the same accounting policies as the annual audited IFRS consolidated financial statements for the year ended December 31, 2016, except for income tax expense for an interim period (which is based on an estimated average annual effective income tax rate). Certain prior period amounts have been reclassified to conform to current period presentations. The condensed consolidated interim financial statements should be read in conjunction with the annual audited consolidated financial statements for the year ended December 31, 2016, which have been prepared in accordance with IFRS as issued by the IASB.
2.2. Changes in Accounting Policy and Disclosures
The accounting policies followed in these condensed consolidated interim financial statements are consistent with those of the previous financial year.
2.3. Accounting Pronouncements not yet Adopted
Revenue from Contracts with Customers
In May 2014, the IASB issued IFRS 15 Revenue from Contracts with Customers. It replaces existing revenue recognition guidance and provides a single, principles-based five-step model to be applied to all contracts with customers. Retrospective application of this standard is effective for fiscal years beginning on or after January 1, 2018, with earlier application permitted. IFRS 15 will be adopted by the Company on January 1, 2018. The Company is reviewing its sales contracts with customers and does not expect IFRS 15 to have a material impact on the consolidated financial statements including disaggregated revenue streams by product type and any impairment losses recognized on receivables arising from contracts with customers.
EAGLE THIRD QUARTER REPORT 2017
6
Financial Instruments
In July 2014, IFRS 9 Financial Instruments was issued as a complete standard, including the requirements previously issued related to classification and measurement of financial assets and liabilities, and additional amendments to introduce a new expected loss impairment model for financial assets including credit losses. Retrospective application of this standard with certain exemptions is effective for fiscal years beginning after January 1, 2018, with earlier application permitted. This amendment will be adopted by the Company on January 1, 2018 and the Company does not expect the adoption of the amendment to have a material impact on the valuation of its financial assets.
Leases
In January 2016, the IASB issued IFRS 16 Leases, which replaces the existing leasing standard (IAS 17 Leases) and requires the recognition of most leases on the balance sheet. For lessees, IFRS 16 effectively removes the classification of leases as either finance or operating leases and treats all leases as finance leases except for short-term leases where the term is twelve months or less and for leases of low value items. For lessors, the accounting treatment remains the same, which provides the choice of classifying a lease as either a finance or operating lease. IFRS 16 is effective January 1, 2019, with earlier application only being permitted for companies that also apply IFRS 15. IFRS 16 will be adopted by the Company on January 1, 2019. The Company is currently reviewing contracts that are identified as leases and expects that the adoption of this standard could have a material impact on the Company’s consolidated financial statements.
3. Critical Accounting Estimates and Judgments
The critical accounting estimates and judgments followed in these condensed consolidated interim financial statements are consistent with those of the previous financial year. Further information about Eagle’s critical accounting estimates and judgments can be found in the notes to Eagle’s annual audited consolidated financial statements and MD&A for the year ended December 31, 2016.
4. Financial Risk Management and Financial Instruments
Eagle’s activities expose it to a variety of financial risks that arise as a result of its exploration, development, production and financing activities such as:
• credit risk;
• liquidity risk; and
• market risk.
This note presents information about changes in Eagle’s exposure to each of the above risks since the year ended December 31, 2016.
Credit Risk
At September 30, 2017, there was no material change in credit risk compared to the December 31, 2016 year end.
Liquidity Risk
On March 13, 2017, Eagle retired all amounts drawn under its $70 million authorized bank credit facility that was held with a syndicate of Canadian chartered banks and replaced it with a new four year secured term loan from a U.S.-based lender (the “Loan Agreement”). Effective September 15, 2017, the lender finalized its quarterly Borrowing Base redetermination and set the Borrowing Base at CA$ 76.0 million (the September 30, 2017 Canadian dollar equivalent of $US 60.9 million).
At September 30, 2017, the Company had a working capital surplus of approximately $3.3 million, with $72.7 million (the September 30, 2017 Canadian dollar equivalent of $US 58.2 million) drawn under the Loan Agreement with the option to draw, by way of a Notice of Borrowing, the remaining incremental term loan amount of up to the Borrowing Base of $US 60.9 million prior to March 13, 2018.
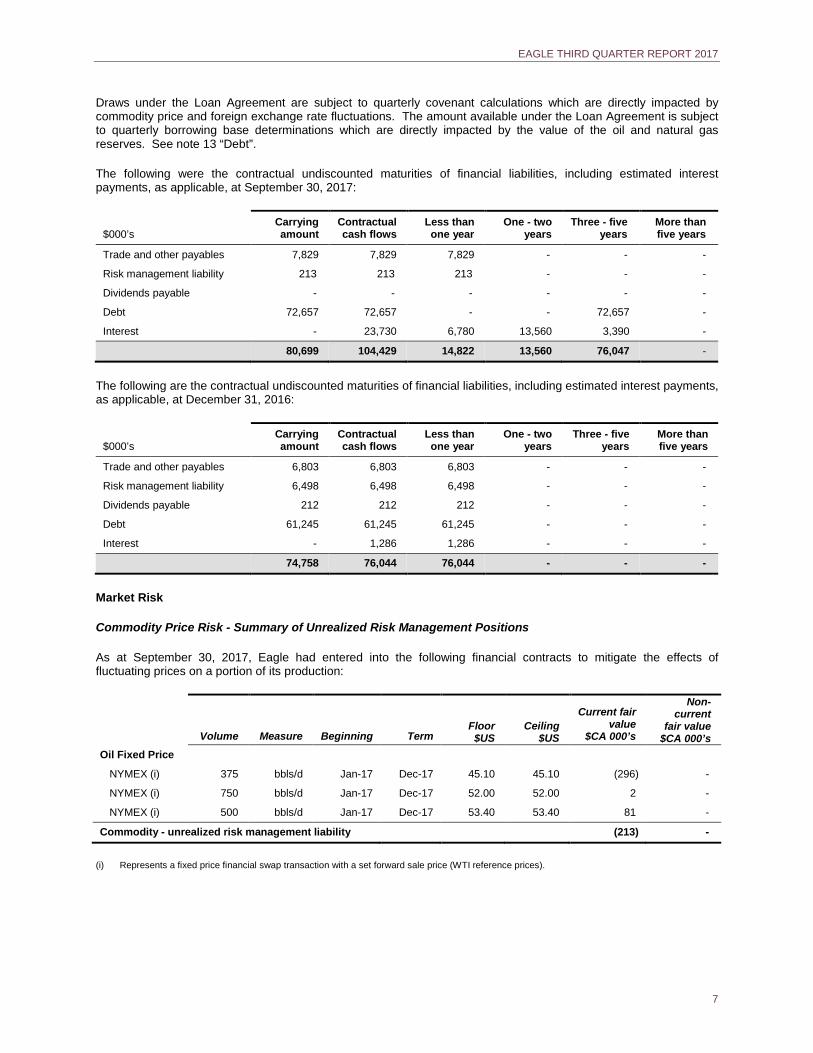
EAGLE THIRD QUARTER REPORT 2017
7
Draws under the Loan Agreement are subject to quarterly covenant calculations which are directly impacted by commodity price and foreign exchange rate fluctuations. The amount available under the Loan Agreement is subject to quarterly borrowing base determinations which are directly impacted by the value of the oil and natural gas reserves. See note 13 “Debt”.
The following were the contractual undiscounted maturities of financial liabilities, including estimated interest payments, as applicable, at September 30, 2017:
$000’s Carrying amount
Contractual cash flows
Less than one year
One - two years
Three - five years
More than five years
Trade and other payables 7,829 7,829 7,829 - - -
Risk management liability 213 213 213 - - -
Dividends payable - - - - - -
Debt 72,657 72,657 - - 72,657 -
Interest - 23,730 6,780 13,560 3,390 -
80,699 104,429 14,822 13,560 76,047 -
The following are the contractual undiscounted maturities of financial liabilities, including estimated interest payments, as applicable, at December 31, 2016:
$000’s Carrying amount
Contractual cash flows
Less than one year
One - two years
Three - five years
More than five years
Trade and other payables 6,803 6,803 6,803 - - -
Risk management liability 6,498 6,498 6,498 - - -
Dividends payable 212 212 212 - - -
Debt 61,245 61,245 61,245 - - -
Interest - 1,286 1,286 - - -
74,758 76,044 76,044 - - -
Market Risk
Commodity Price Risk - Summary of Unrealized Risk Management Positions
As at September 30, 2017, Eagle had entered into the following financial contracts to mitigate the effects of fluctuating prices on a portion of its production:
Volume Measure Beginning Term
Floor $US
Ceiling $US
Current fair value
$CA 000’s
Non-current
fair value $CA 000’s
Oil Fixed Price
NYMEX (i) 375 bbls/d Jan-17 Dec-17 45.10 45.10 (296) -
NYMEX (i) 750 bbls/d Jan-17 Dec-17 52.00 52.00 2 -
NYMEX (i) 500 bbls/d Jan-17 Dec-17 53.40 53.40 81 -
Commodity - unrealized risk management liability (213) -
(i) Represents a fixed price financial swap transaction with a set forward sale price (WTI reference prices).
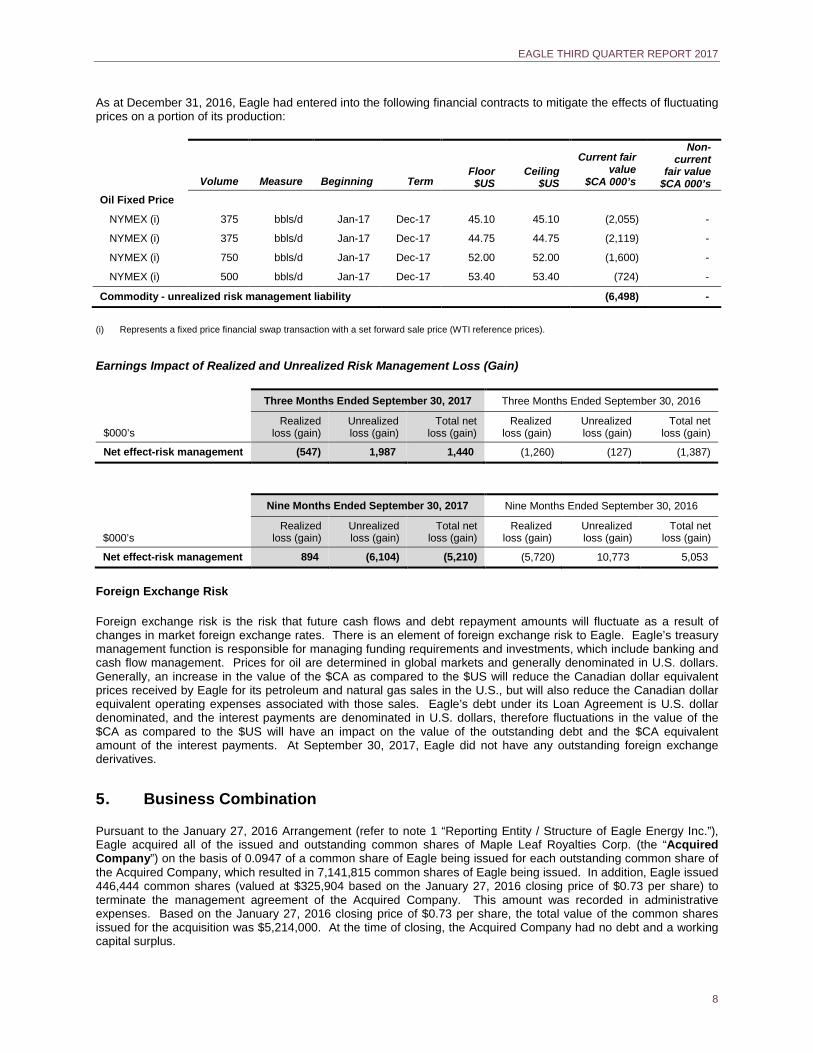
EAGLE THIRD QUARTER REPORT 2017
8
As at December 31, 2016, Eagle had entered into the following financial contracts to mitigate the effects of fluctuating prices on a portion of its production:
Volume Measure Beginning Term
Floor $US
Ceiling $US
Current fair value
$CA 000’s
Non-current
fair value $CA 000’s
Oil Fixed Price
NYMEX (i) 375 bbls/d Jan-17 Dec-17 45.10 45.10 (2,055) -
NYMEX (i) 375 bbls/d Jan-17 Dec-17 44.75 44.75 (2,119) -
NYMEX (i) 750 bbls/d Jan-17 Dec-17 52.00 52.00 (1,600) -
NYMEX (i) 500 bbls/d Jan-17 Dec-17 53.40 53.40 (724) -
Commodity - unrealized risk management liability (6,498) -
(i) Represents a fixed price financial swap transaction with a set forward sale price (WTI reference prices).
Earnings Impact of Realized and Unrealized Risk Management Loss (Gain)
Three Months Ended September 30, 2017 Three Months Ended September 30, 2016
$000’s Realized
loss (gain) Unrealized loss (gain)
Total net loss (gain)
Realized loss (gain)
Unrealized loss (gain)
Total net loss (gain)
Net effect-risk management (547) 1,987 1,440 (1,260) (127) (1,387)
Nine Months Ended September 30, 2017 Nine Months Ended September 30, 2016
$000’s Realized
loss (gain) Unrealized loss (gain)
Total net loss (gain)
Realized loss (gain)
Unrealized loss (gain)
Total net loss (gain)
Net effect-risk management 894 (6,104) (5,210) (5,720) 10,773 5,053
Foreign Exchange Risk
Foreign exchange risk is the risk that future cash flows and debt repayment amounts will fluctuate as a result of changes in market foreign exchange rates. There is an element of foreign exchange risk to Eagle. Eagle’s treasury management function is responsible for managing funding requirements and investments, which include banking and cash flow management. Prices for oil are determined in global markets and generally denominated in U.S. dollars. Generally, an increase in the value of the $CA as compared to the $US will reduce the Canadian dollar equivalent prices received by Eagle for its petroleum and natural gas sales in the U.S., but will also reduce the Canadian dollar equivalent operating expenses associated with those sales. Eagle’s debt under its Loan Agreement is U.S. dollar denominated, and the interest payments are denominated in U.S. dollars, therefore fluctuations in the value of the $CA as compared to the $US will have an impact on the value of the outstanding debt and the $CA equivalent amount of the interest payments. At September 30, 2017, Eagle did not have any outstanding foreign exchange derivatives.
5. Business Combination
Pursuant to the January 27, 2016 Arrangement (refer to note 1 “Reporting Entity / Structure of Eagle Energy Inc.”), Eagle acquired all of the issued and outstanding common shares of Maple Leaf Royalties Corp. (the “Acquired Company”) on the basis of 0.0947 of a common share of Eagle being issued for each outstanding common share of the Acquired Company, which resulted in 7,141,815 common shares of Eagle being issued. In addition, Eagle issued 446,444 common shares (valued at $325,904 based on the January 27, 2016 closing price of $0.73 per share) to terminate the management agreement of the Acquired Company. This amount was recorded in administrative expenses. Based on the January 27, 2016 closing price of $0.73 per share, the total value of the common shares issued for the acquisition was $5,214,000. At the time of closing, the Acquired Company had no debt and a working capital surplus.
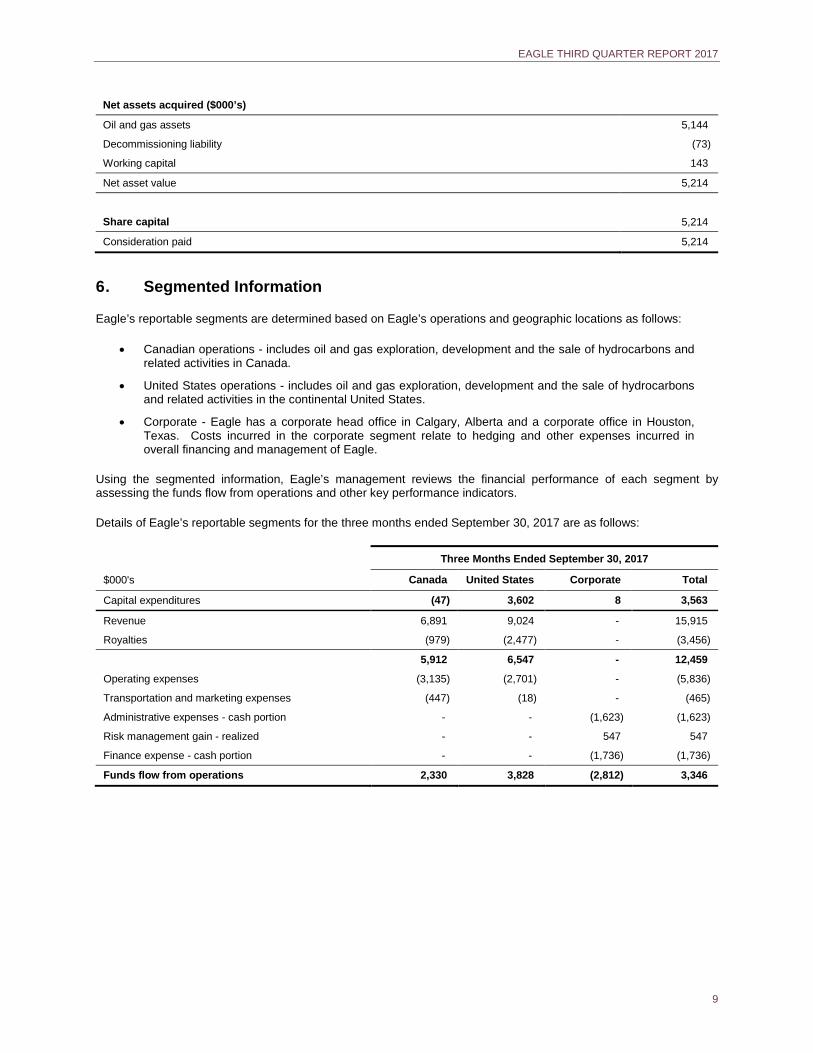
EAGLE THIRD QUARTER REPORT 2017
9
Net assets acquired ($000’s) Oil and gas assets 5,144
Decommissioning liability (73)
Working capital 143
Net asset value 5,214
Share capital 5,214
Consideration paid 5,214
6. Segmented Information
Eagle’s reportable segments are determined based on Eagle’s operations and geographic locations as follows:
• Canadian operations - includes oil and gas exploration, development and the sale of hydrocarbons and related activities in Canada.
• United States operations - includes oil and gas exploration, development and the sale of hydrocarbons and related activities in the continental United States.
• Corporate - Eagle has a corporate head office in Calgary, Alberta and a corporate office in Houston, Texas. Costs incurred in the corporate segment relate to hedging and other expenses incurred in overall financing and management of Eagle.
Using the segmented information, Eagle’s management reviews the financial performance of each segment by assessing the funds flow from operations and other key performance indicators.
Details of Eagle’s reportable segments for the three months ended September 30, 2017 are as follows:
Three Months Ended September 30, 2017
$000's Canada United States Corporate Total
Capital expenditures (47) 3,602 8 3,563
Revenue 6,891 9,024 - 15,915
Royalties (979) (2,477) - (3,456)
5,912 6,547 - 12,459
Operating expenses (3,135) (2,701) - (5,836)
Transportation and marketing expenses (447) (18) - (465)
Administrative expenses - cash portion - - (1,623) (1,623)
Risk management gain - realized - - 547 547
Finance expense - cash portion - - (1,736) (1,736)
Funds flow from operations 2,330 3,828 (2,812) 3,346
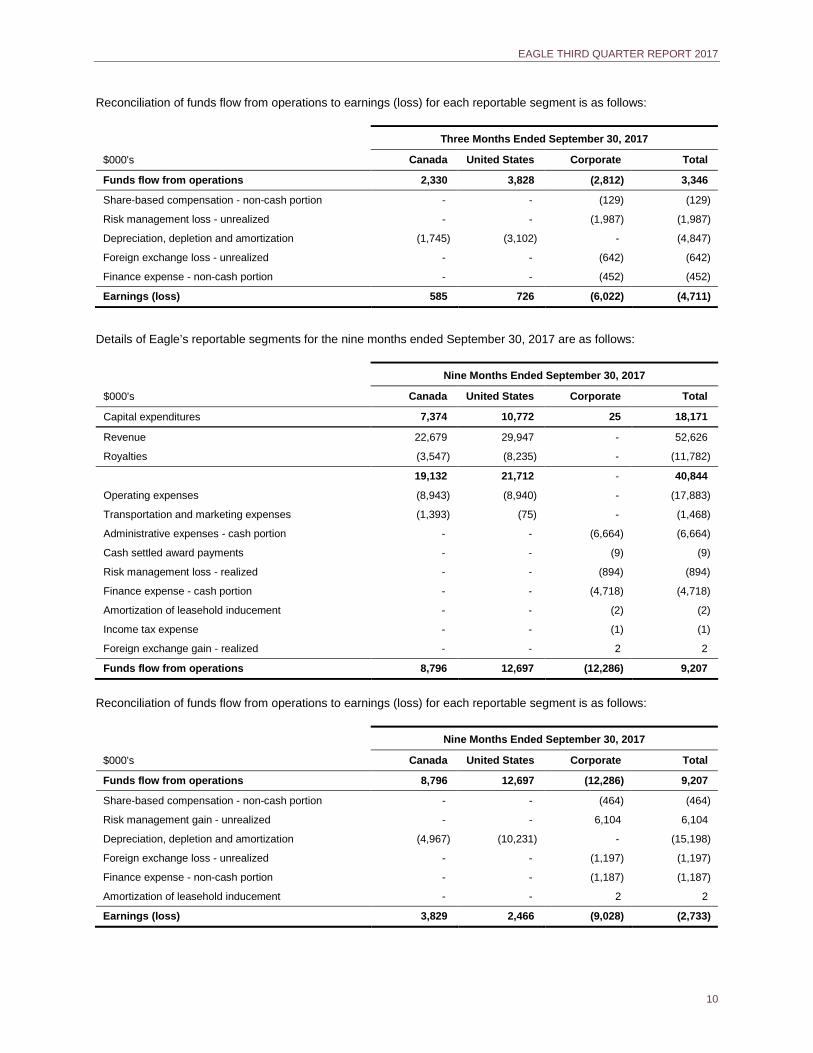
EAGLE THIRD QUARTER REPORT 2017
10
Reconciliation of funds flow from operations to earnings (loss) for each reportable segment is as follows:
Three Months Ended September 30, 2017
$000's Canada United States Corporate Total
Funds flow from operations 2,330 3,828 (2,812) 3,346
Share-based compensation - non-cash portion - - (129) (129)
Risk management loss - unrealized - - (1,987) (1,987)
Depreciation, depletion and amortization (1,745) (3,102) - (4,847)
Foreign exchange loss - unrealized - - (642) (642)
Finance expense - non-cash portion - - (452) (452)
Earnings (loss) 585 726 (6,022) (4,711)
Details of Eagle’s reportable segments for the nine months ended September 30, 2017 are as follows:
Nine Months Ended September 30, 2017
$000's Canada United States Corporate Total
Capital expenditures 7,374 10,772 25 18,171
Revenue 22,679 29,947 - 52,626
Royalties (3,547) (8,235) - (11,782)
19,132 21,712 - 40,844
Operating expenses (8,943) (8,940) - (17,883)
Transportation and marketing expenses (1,393) (75) - (1,468)
Administrative expenses - cash portion - - (6,664) (6,664)
Cash settled award payments - - (9) (9)
Risk management loss - realized - - (894) (894)
Finance expense - cash portion - - (4,718) (4,718)
Amortization of leasehold inducement - - (2) (2)
Income tax expense - - (1) (1)
Foreign exchange gain - realized - - 2 2
Funds flow from operations 8,796 12,697 (12,286) 9,207
Reconciliation of funds flow from operations to earnings (loss) for each reportable segment is as follows:
Nine Months Ended September 30, 2017
$000's Canada United States Corporate Total
Funds flow from operations 8,796 12,697 (12,286) 9,207
Share-based compensation - non-cash portion - - (464) (464)
Risk management gain - unrealized - - 6,104 6,104
Depreciation, depletion and amortization (4,967) (10,231) - (15,198)
Foreign exchange loss - unrealized - - (1,197) (1,197)
Finance expense - non-cash portion - - (1,187) (1,187)
Amortization of leasehold inducement - - 2 2
Earnings (loss) 3,829 2,466 (9,028) (2,733)
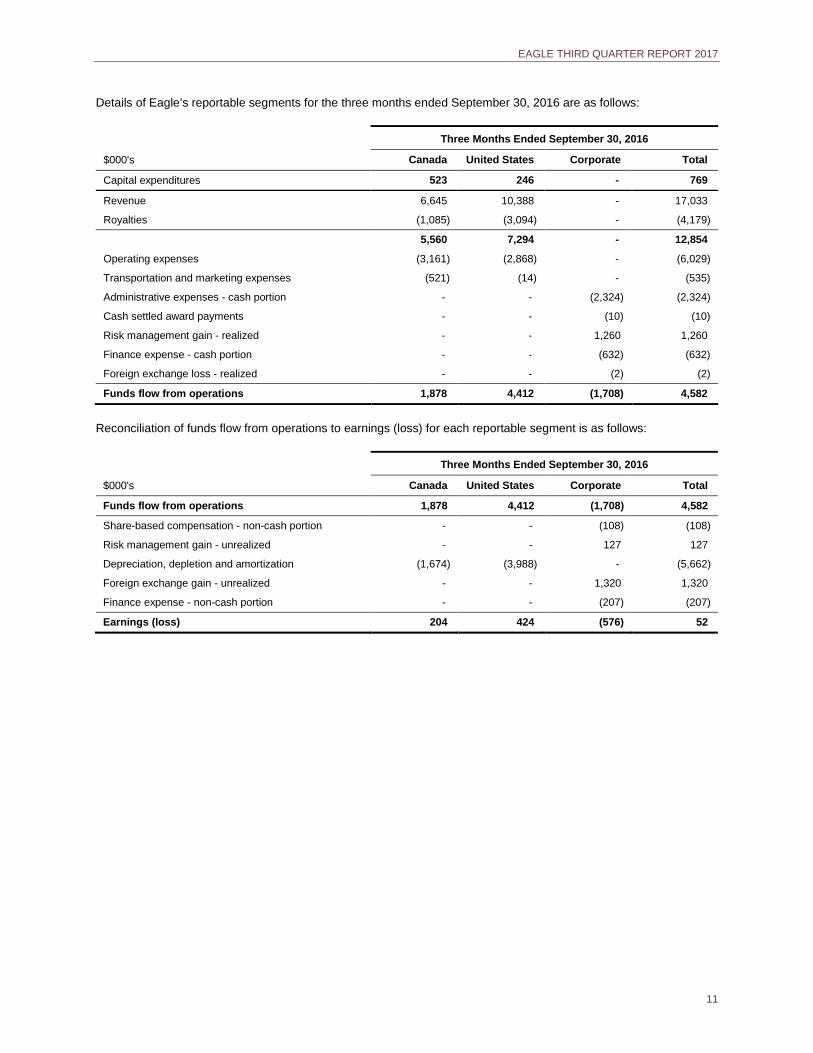
EAGLE THIRD QUARTER REPORT 2017
11
Details of Eagle’s reportable segments for the three months ended September 30, 2016 are as follows:
Three Months Ended September 30, 2016
$000's Canada United States Corporate Total
Capital expenditures 523 246 - 769
Revenue 6,645 10,388 - 17,033
Royalties (1,085) (3,094) - (4,179)
5,560 7,294 - 12,854
Operating expenses (3,161) (2,868) - (6,029)
Transportation and marketing expenses (521) (14) - (535)
Administrative expenses - cash portion - - (2,324) (2,324)
Cash settled award payments - - (10) (10)
Risk management gain - realized - - 1,260 1,260
Finance expense - cash portion - - (632) (632)
Foreign exchange loss - realized - - (2) (2)
Funds flow from operations 1,878 4,412 (1,708) 4,582
Reconciliation of funds flow from operations to earnings (loss) for each reportable segment is as follows:
Three Months Ended September 30, 2016
$000's Canada United States Corporate Total
Funds flow from operations 1,878 4,412 (1,708) 4,582
Share-based compensation - non-cash portion - - (108) (108)
Risk management gain - unrealized - - 127 127
Depreciation, depletion and amortization (1,674) (3,988) - (5,662)
Foreign exchange gain - unrealized - - 1,320 1,320
Finance expense - non-cash portion - - (207) (207)
Earnings (loss) 204 424 (576) 52
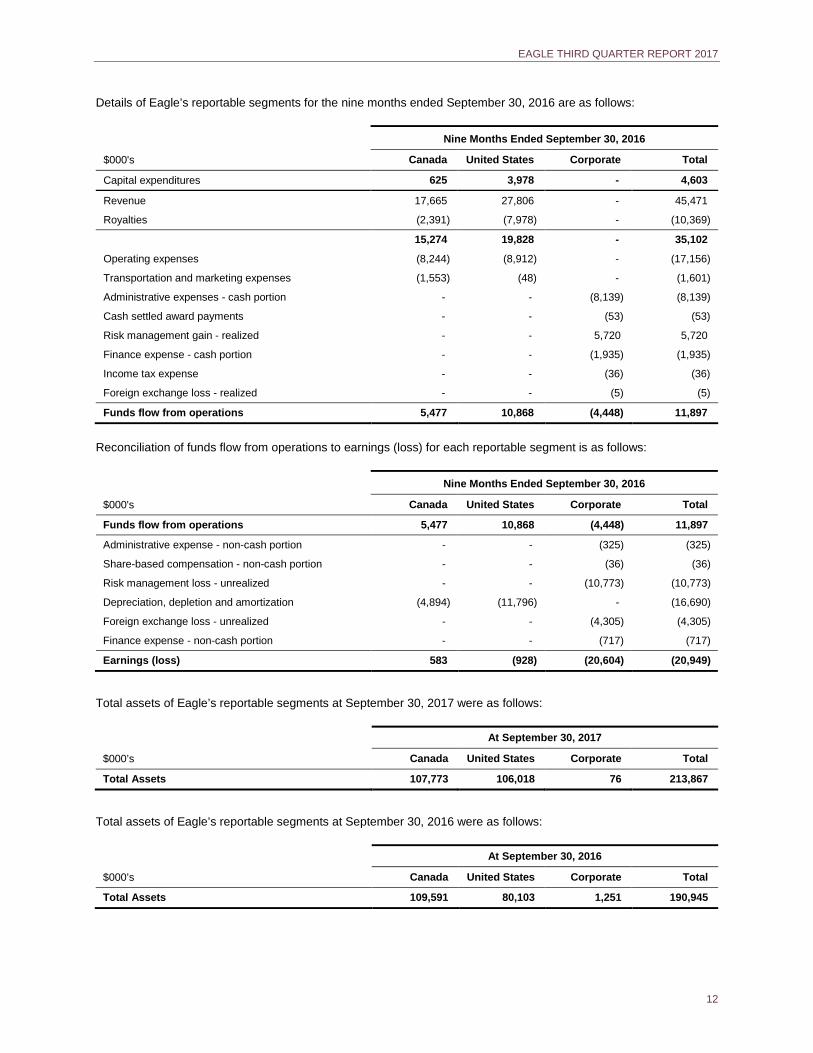
EAGLE THIRD QUARTER REPORT 2017
12
Details of Eagle’s reportable segments for the nine months ended September 30, 2016 are as follows:
Nine Months Ended September 30, 2016
$000's Canada United States Corporate Total
Capital expenditures 625 3,978 - 4,603
Revenue 17,665 27,806 - 45,471
Royalties (2,391) (7,978) - (10,369)
15,274 19,828 - 35,102
Operating expenses (8,244) (8,912) - (17,156)
Transportation and marketing expenses (1,553) (48) - (1,601)
Administrative expenses - cash portion - - (8,139) (8,139)
Cash settled award payments - - (53) (53)
Risk management gain - realized - - 5,720 5,720
Finance expense - cash portion - - (1,935) (1,935)
Income tax expense - - (36) (36)
Foreign exchange loss - realized - - (5) (5)
Funds flow from operations 5,477 10,868 (4,448) 11,897
Reconciliation of funds flow from operations to earnings (loss) for each reportable segment is as follows:
Nine Months Ended September 30, 2016
$000's Canada United States Corporate Total
Funds flow from operations 5,477 10,868 (4,448) 11,897
Administrative expense - non-cash portion - - (325) (325)
Share-based compensation - non-cash portion - - (36) (36)
Risk management loss - unrealized - - (10,773) (10,773)
Depreciation, depletion and amortization (4,894) (11,796) - (16,690)
Foreign exchange loss - unrealized - - (4,305) (4,305)
Finance expense - non-cash portion - - (717) (717)
Earnings (loss) 583 (928) (20,604) (20,949)
Total assets of Eagle’s reportable segments at September 30, 2017 were as follows:
At September 30, 2017
$000’s Canada United States Corporate Total
Total Assets 107,773 106,018 76 213,867
Total assets of Eagle’s reportable segments at September 30, 2016 were as follows:
At September 30, 2016
$000’s Canada United States Corporate Total
Total Assets 109,591 80,103 1,251 190,945
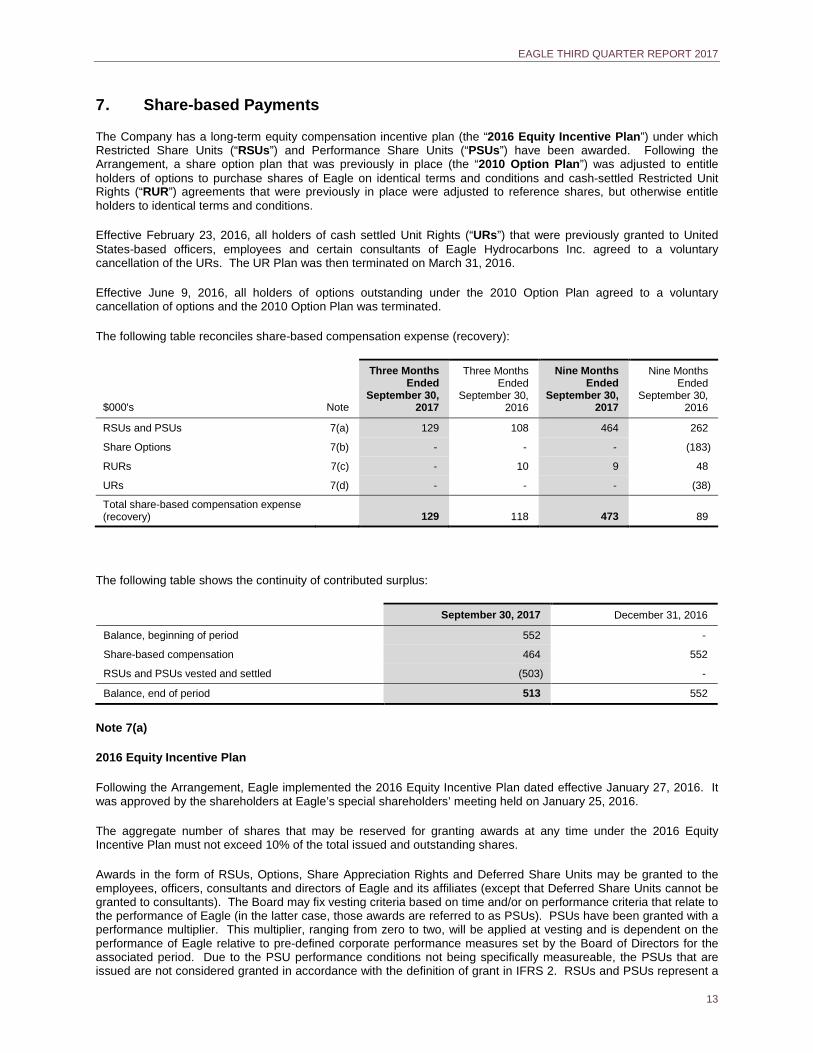
EAGLE THIRD QUARTER REPORT 2017
13
7. Share-based Payments
The Company has a long-term equity compensation incentive plan (the “2016 Equity Incentive Plan”) under which Restricted Share Units (“RSUs”) and Performance Share Units (“PSUs”) have been awarded. Following the Arrangement, a share option plan that was previously in place (the “2010 Option Plan”) was adjusted to entitle holders of options to purchase shares of Eagle on identical terms and conditions and cash-settled Restricted Unit Rights (“RUR”) agreements that were previously in place were adjusted to reference shares, but otherwise entitle holders to identical terms and conditions.
Effective February 23, 2016, all holders of cash settled Unit Rights (“URs”) that were previously granted to United States-based officers, employees and certain consultants of Eagle Hydrocarbons Inc. agreed to a voluntary cancellation of the URs. The UR Plan was then terminated on March 31, 2016.
Effective June 9, 2016, all holders of options outstanding under the 2010 Option Plan agreed to a voluntary cancellation of options and the 2010 Option Plan was terminated.
The following table reconciles share-based compensation expense (recovery):
$000's Note
Three Months Ended
September 30, 2017
Three Months Ended
September 30, 2016
Nine Months Ended
September 30, 2017
Nine Months Ended
September 30, 2016
RSUs and PSUs 7(a) 129 108 464 262
Share Options 7(b) - - - (183)
RURs 7(c) - 10 9 48
URs 7(d) - - - (38)
Total share-based compensation expense (recovery)
129 118 473 89
The following table shows the continuity of contributed surplus:
September 30, 2017 December 31, 2016
Balance, beginning of period 552 -
Share-based compensation 464 552
RSUs and PSUs vested and settled (503) -
Balance, end of period 513 552
Note 7(a)
2016 Equity Incentive Plan
Following the Arrangement, Eagle implemented the 2016 Equity Incentive Plan dated effective January 27, 2016. It was approved by the shareholders at Eagle’s special shareholders’ meeting held on January 25, 2016.
The aggregate number of shares that may be reserved for granting awards at any time under the 2016 Equity Incentive Plan must not exceed 10% of the total issued and outstanding shares.
Awards in the form of RSUs, Options, Share Appreciation Rights and Deferred Share Units may be granted to the employees, officers, consultants and directors of Eagle and its affiliates (except that Deferred Share Units cannot be granted to consultants). The Board may fix vesting criteria based on time and/or on performance criteria that relate to the performance of Eagle (in the latter case, those awards are referred to as PSUs). PSUs have been granted with a performance multiplier. This multiplier, ranging from zero to two, will be applied at vesting and is dependent on the performance of Eagle relative to pre-defined corporate performance measures set by the Board of Directors for the associated period. Due to the PSU performance conditions not being specifically measureable, the PSUs that are issued are not considered granted in accordance with the definition of grant in IFRS 2. RSUs and PSUs represent a
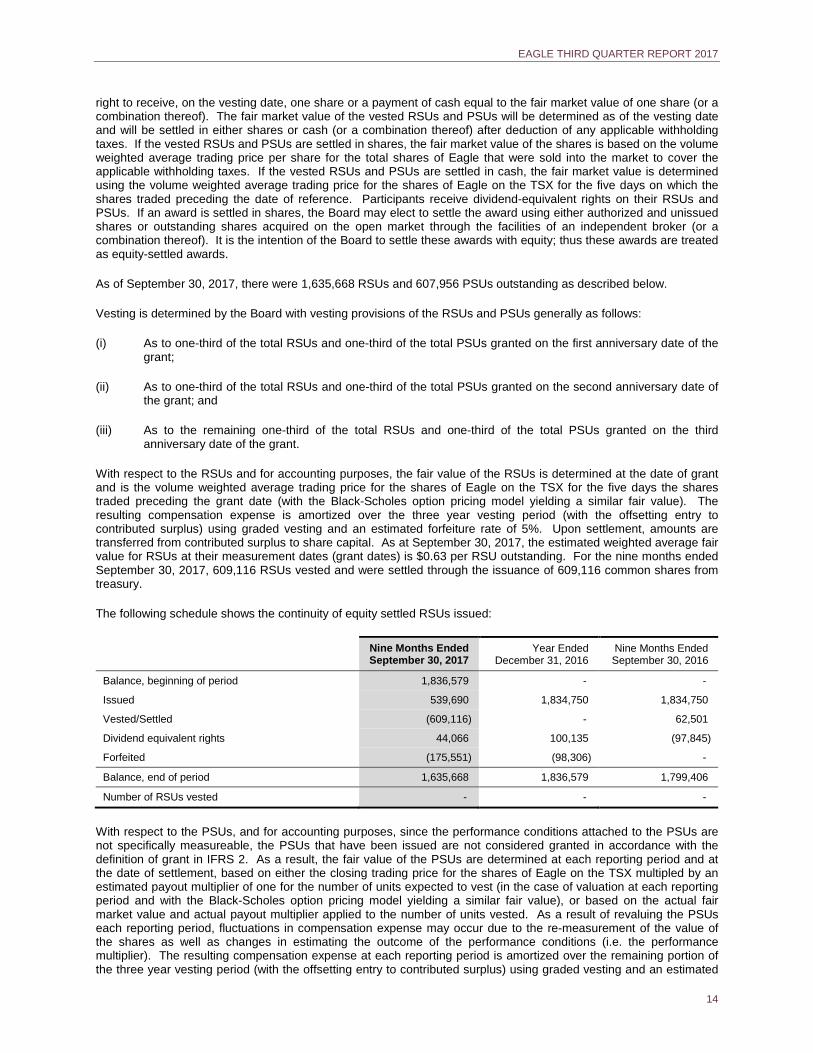
EAGLE THIRD QUARTER REPORT 2017
14
right to receive, on the vesting date, one share or a payment of cash equal to the fair market value of one share (or a combination thereof). The fair market value of the vested RSUs and PSUs will be determined as of the vesting date and will be settled in either shares or cash (or a combination thereof) after deduction of any applicable withholding taxes. If the vested RSUs and PSUs are settled in shares, the fair market value of the shares is based on the volume weighted average trading price per share for the total shares of Eagle that were sold into the market to cover the applicable withholding taxes. If the vested RSUs and PSUs are settled in cash, the fair market value is determined using the volume weighted average trading price for the shares of Eagle on the TSX for the five days on which the shares traded preceding the date of reference. Participants receive dividend-equivalent rights on their RSUs and PSUs. If an award is settled in shares, the Board may elect to settle the award using either authorized and unissued shares or outstanding shares acquired on the open market through the facilities of an independent broker (or a combination thereof). It is the intention of the Board to settle these awards with equity; thus these awards are treated as equity-settled awards.
As of September 30, 2017, there were 1,635,668 RSUs and 607,956 PSUs outstanding as described below.
Vesting is determined by the Board with vesting provisions of the RSUs and PSUs generally as follows:
(i) As to one-third of the total RSUs and one-third of the total PSUs granted on the first anniversary date of the grant;
(ii) As to one-third of the total RSUs and one-third of the total PSUs granted on the second anniversary date of the grant; and
(iii) As to the remaining one-third of the total RSUs and one-third of the total PSUs granted on the third anniversary date of the grant.
With respect to the RSUs and for accounting purposes, the fair value of the RSUs is determined at the date of grant and is the volume weighted average trading price for the shares of Eagle on the TSX for the five days the shares traded preceding the grant date (with the Black-Scholes option pricing model yielding a similar fair value). The resulting compensation expense is amortized over the three year vesting period (with the offsetting entry to contributed surplus) using graded vesting and an estimated forfeiture rate of 5%. Upon settlement, amounts are transferred from contributed surplus to share capital. As at September 30, 2017, the estimated weighted average fair value for RSUs at their measurement dates (grant dates) is $0.63 per RSU outstanding. For the nine months ended September 30, 2017, 609,116 RSUs vested and were settled through the issuance of 609,116 common shares from treasury.
The following schedule shows the continuity of equity settled RSUs issued:
Nine Months Ended September 30, 2017
Year Ended December 31, 2016
Nine Months Ended September 30, 2016
Balance, beginning of period 1,836,579 - -
Issued 539,690 1,834,750 1,834,750
Vested/Settled (609,116) - 62,501
Dividend equivalent rights 44,066 100,135 (97,845)
Forfeited (175,551) (98,306) -
Balance, end of period 1,635,668 1,836,579 1,799,406
Number of RSUs vested - - -
With respect to the PSUs, and for accounting purposes, since the performance conditions attached to the PSUs are not specifically measureable, the PSUs that have been issued are not considered granted in accordance with the definition of grant in IFRS 2. As a result, the fair value of the PSUs are determined at each reporting period and at the date of settlement, based on either the closing trading price for the shares of Eagle on the TSX multipled by an estimated payout multiplier of one for the number of units expected to vest (in the case of valuation at each reporting period and with the Black-Scholes option pricing model yielding a similar fair value), or based on the actual fair market value and actual payout multiplier applied to the number of units vested. As a result of revaluing the PSUs each reporting period, fluctuations in compensation expense may occur due to the re-measurement of the value of the shares as well as changes in estimating the outcome of the performance conditions (i.e. the performance multiplier). The resulting compensation expense at each reporting period is amortized over the remaining portion of the three year vesting period (with the offsetting entry to contributed surplus) using graded vesting and an estimated
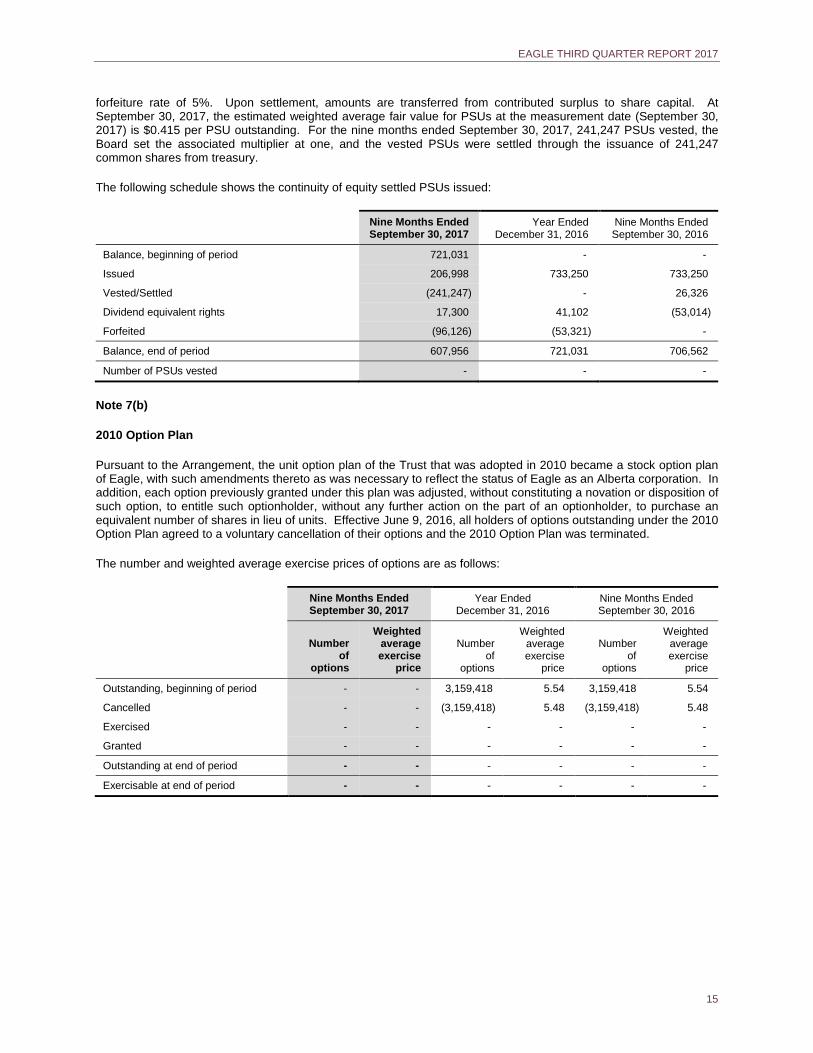
EAGLE THIRD QUARTER REPORT 2017
15
forfeiture rate of 5%. Upon settlement, amounts are transferred from contributed surplus to share capital. At September 30, 2017, the estimated weighted average fair value for PSUs at the measurement date (September 30, 2017) is $0.415 per PSU outstanding. For the nine months ended September 30, 2017, 241,247 PSUs vested, the Board set the associated multiplier at one, and the vested PSUs were settled through the issuance of 241,247 common shares from treasury.
The following schedule shows the continuity of equity settled PSUs issued:
Nine Months Ended September 30, 2017
Year Ended December 31, 2016
Nine Months Ended September 30, 2016
Balance, beginning of period 721,031 - -
Issued 206,998 733,250 733,250
Vested/Settled (241,247) - 26,326
Dividend equivalent rights 17,300 41,102 (53,014)
Forfeited (96,126) (53,321) -
Balance, end of period 607,956 721,031 706,562
Number of PSUs vested - - -
Note 7(b)
2010 Option Plan
Pursuant to the Arrangement, the unit option plan of the Trust that was adopted in 2010 became a stock option plan of Eagle, with such amendments thereto as was necessary to reflect the status of Eagle as an Alberta corporation. In addition, each option previously granted under this plan was adjusted, without constituting a novation or disposition of such option, to entitle such optionholder, without any further action on the part of an optionholder, to purchase an equivalent number of shares in lieu of units. Effective June 9, 2016, all holders of options outstanding under the 2010 Option Plan agreed to a voluntary cancellation of their options and the 2010 Option Plan was terminated.
The number and weighted average exercise prices of options are as follows:
Nine Months Ended September 30, 2017
Year Ended December 31, 2016
Nine Months Ended September 30, 2016
Number
of options
Weighted average exercise
price
Number of
options
Weighted average exercise
price
Number of
options
Weighted average exercise
price
Outstanding, beginning of period - - 3,159,418 5.54 3,159,418 5.54
Cancelled - - (3,159,418) 5.48 (3,159,418) 5.48
Exercised - - - - - -
Granted - - - - - -
Outstanding at end of period - - - - - -
Exercisable at end of period - - - - - -
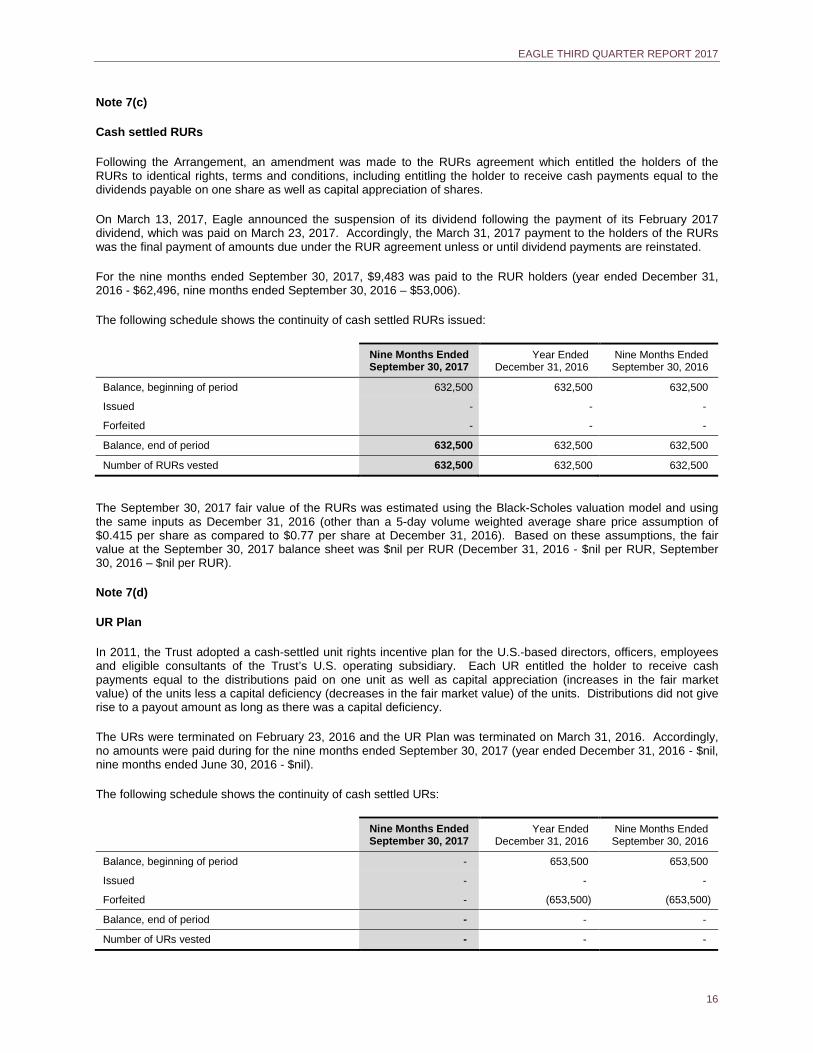
EAGLE THIRD QUARTER REPORT 2017
16
Note 7(c)
Cash settled RURs
Following the Arrangement, an amendment was made to the RURs agreement which entitled the holders of the RURs to identical rights, terms and conditions, including entitling the holder to receive cash payments equal to the dividends payable on one share as well as capital appreciation of shares.
On March 13, 2017, Eagle announced the suspension of its dividend following the payment of its February 2017 dividend, which was paid on March 23, 2017. Accordingly, the March 31, 2017 payment to the holders of the RURs was the final payment of amounts due under the RUR agreement unless or until dividend payments are reinstated.
For the nine months ended September 30, 2017, $9,483 was paid to the RUR holders (year ended December 31, 2016 - $62,496, nine months ended September 30, 2016 – $53,006).
The following schedule shows the continuity of cash settled RURs issued:
Nine Months Ended September 30, 2017
Year Ended December 31, 2016
Nine Months Ended September 30, 2016
Balance, beginning of period 632,500 632,500 632,500
Issued - - -
Forfeited - - -
Balance, end of period 632,500 632,500 632,500
Number of RURs vested 632,500 632,500 632,500
The September 30, 2017 fair value of the RURs was estimated using the Black-Scholes valuation model and using the same inputs as December 31, 2016 (other than a 5-day volume weighted average share price assumption of $0.415 per share as compared to $0.77 per share at December 31, 2016). Based on these assumptions, the fair value at the September 30, 2017 balance sheet was $nil per RUR (December 31, 2016 - $nil per RUR, September 30, 2016 – $nil per RUR).
Note 7(d)
UR Plan
In 2011, the Trust adopted a cash-settled unit rights incentive plan for the U.S.-based directors, officers, employees and eligible consultants of the Trust’s U.S. operating subsidiary. Each UR entitled the holder to receive cash payments equal to the distributions paid on one unit as well as capital appreciation (increases in the fair market value) of the units less a capital deficiency (decreases in the fair market value) of the units. Distributions did not give rise to a payout amount as long as there was a capital deficiency.
The URs were terminated on February 23, 2016 and the UR Plan was terminated on March 31, 2016. Accordingly, no amounts were paid during for the nine months ended September 30, 2017 (year ended December 31, 2016 - $nil, nine months ended June 30, 2016 - $nil).
The following schedule shows the continuity of cash settled URs:
Nine Months Ended September 30, 2017
Year Ended December 31, 2016
Nine Months Ended September 30, 2016
Balance, beginning of period - 653,500 653,500
Issued - - -
Forfeited - (653,500) (653,500)
Balance, end of period - - -
Number of URs vested - - -

EAGLE THIRD QUARTER REPORT 2017
17
8. Foreign Exchange
Eagle has recognized the following in the statement of earnings (loss) due to foreign currency fluctuations:
$000’s
Three Months Ended
September 30, 2017
Three Months Ended
September 30, 2016
Nine Months Ended
September 30, 2017
Nine Months Ended
September 30, 2016
Net loss (gain) arising on settlement of foreign currency transactions arising out of operating activities - realized - 2 (2) 5
Foreign exchange gain on U.S. denominated debt - unrealized (2,601) - (4,880) -
Foreign exchange loss (gain) on Canadian denominated intercompany loan - unrealized 3,243 (1,320) 6,077 4,305
Foreign exchange loss (gain) net 642 (1,318) 1,195 4,310
Eagle has recognized the following in shareholders’ equity due to the translation of its U.S. subsidiary, which has a U.S. dollar functional currency, to the presentation currency of Eagle, being the Canadian dollar, for financial statement presentation:
$000’s As at September 30, 2017 As at September 30, 2016
Beginning balance 35,372 35,615
Foreign currency translation loss (1,087) (453)
Ending balance 34,285 35,162
9. Finance Expense
$000’s
Three Months Ended
September 30, 2017
Three Months Ended
September 30, 2016
Nine Months Ended
September 30, 2017
Nine Months Ended
September 30, 2016
Interest expense on debt 1,732 620 4,672 1,777
Standby and bank fees 4 12 46 158
Accretion of decommissioning provision 127 107 367 354
Amortization of deferred financing costs 325 100 820 363
Finance expense 2,188 839 5,905 2,652
10. Earnings (Loss) per Share
$000’s
Three Months Ended
September 30, 2017
Three Months Ended
September 30, 2016
Nine Months Ended
September 30, 2017
Nine Months Ended
September 30, 2016
Earnings (loss) attributable to shareholders (4,711) 52 (2,733) (20,949)
Weighted average number of shares outstanding – basic (000’s) 42,944 42,452 42,481 41,704 Weighted average number of shares outstanding – diluted (000’s) 44,743 43,738 44,592 42,990
Earnings (loss) per share - basic (0.11) 0.00 (0.06) (0.50)
Earnings (loss) per share - diluted (0.11) 0.00 (0.06) (0.50)
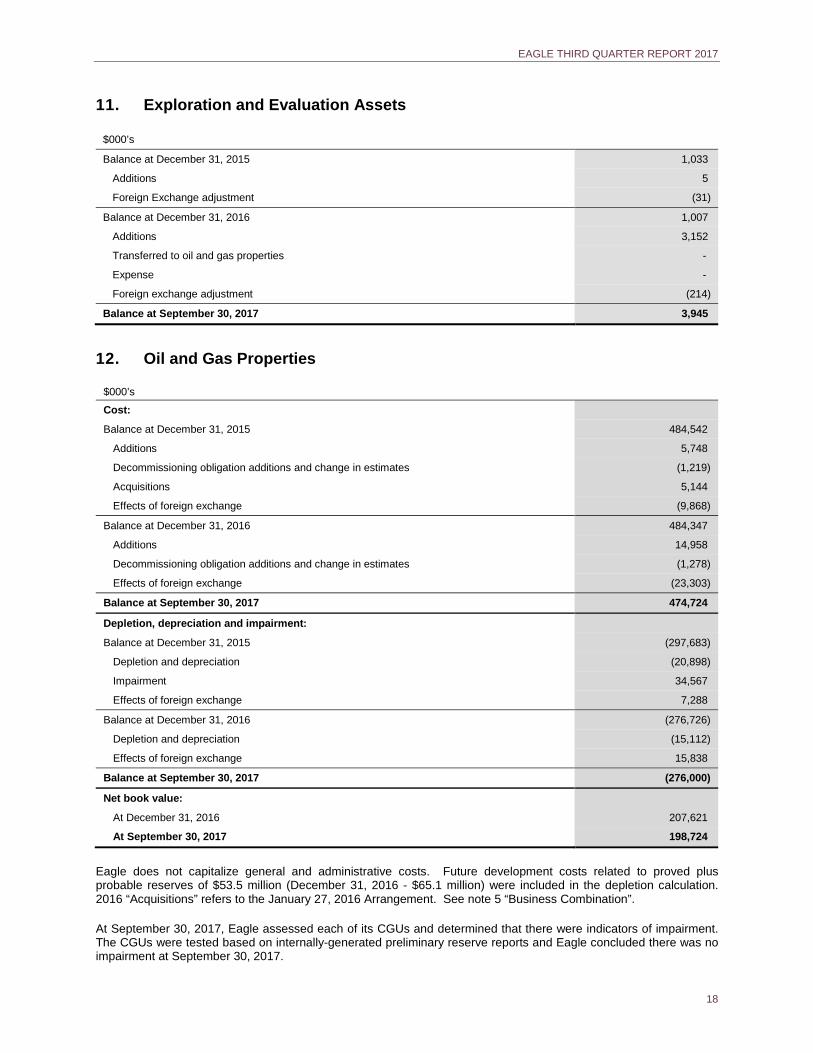
EAGLE THIRD QUARTER REPORT 2017
18
11. Exploration and Evaluation Assets
$000’s Balance at December 31, 2015 1,033
Additions 5
Foreign Exchange adjustment (31)
Balance at December 31, 2016 1,007
Additions 3,152
Transferred to oil and gas properties -
Expense -
Foreign exchange adjustment (214)
Balance at September 30, 2017 3,945
12. Oil and Gas Properties
$000’s Cost:
Balance at December 31, 2015 484,542
Additions 5,748
Decommissioning obligation additions and change in estimates (1,219)
Acquisitions 5,144
Effects of foreign exchange (9,868)
Balance at December 31, 2016 484,347
Additions 14,958
Decommissioning obligation additions and change in estimates (1,278)
Effects of foreign exchange (23,303)
Balance at September 30, 2017 474,724
Depletion, depreciation and impairment:
Balance at December 31, 2015 (297,683)
Depletion and depreciation (20,898)
Impairment 34,567
Effects of foreign exchange 7,288
Balance at December 31, 2016 (276,726)
Depletion and depreciation (15,112)
Effects of foreign exchange 15,838
Balance at September 30, 2017 (276,000)
Net book value:
At December 31, 2016 207,621
At September 30, 2017 198,724
Eagle does not capitalize general and administrative costs. Future development costs related to proved plus probable reserves of $53.5 million (December 31, 2016 - $65.1 million) were included in the depletion calculation. 2016 “Acquisitions” refers to the January 27, 2016 Arrangement. See note 5 “Business Combination”.
At September 30, 2017, Eagle assessed each of its CGUs and determined that there were indicators of impairment. The CGUs were tested based on internally-generated preliminary reserve reports and Eagle concluded there was no impairment at September 30, 2017.
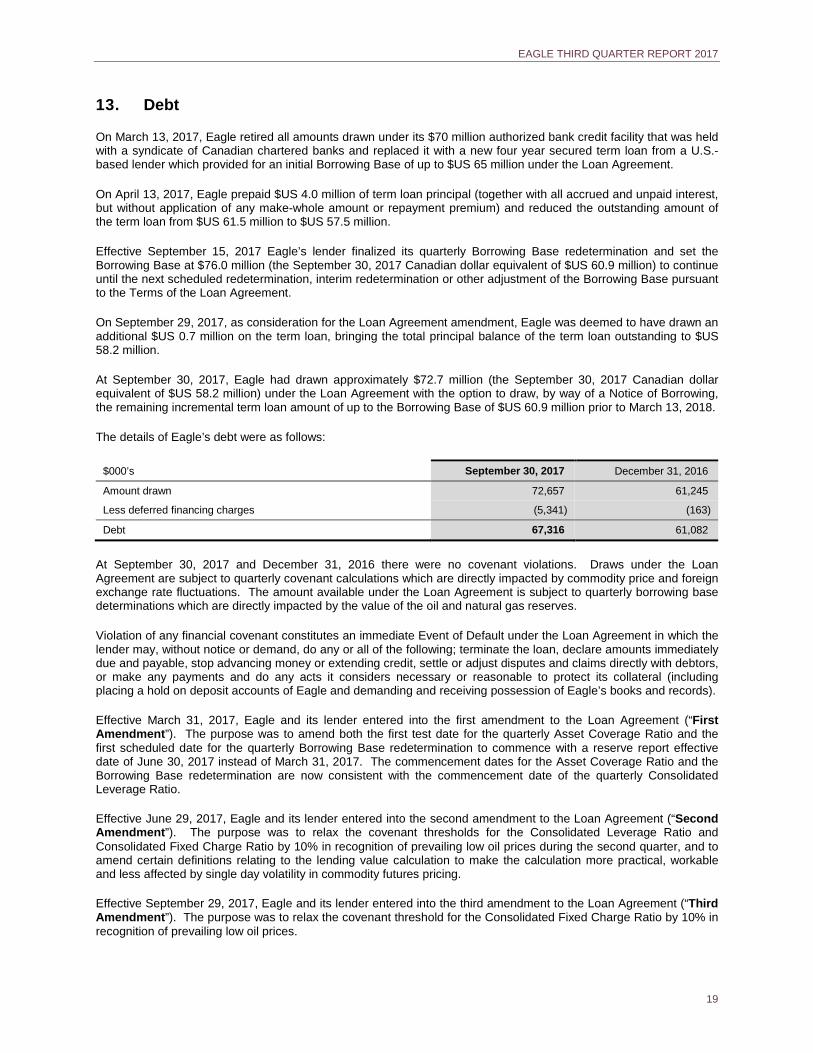
EAGLE THIRD QUARTER REPORT 2017
19
13. Debt
On March 13, 2017, Eagle retired all amounts drawn under its $70 million authorized bank credit facility that was held with a syndicate of Canadian chartered banks and replaced it with a new four year secured term loan from a U.S.-based lender which provided for an initial Borrowing Base of up to $US 65 million under the Loan Agreement.
On April 13, 2017, Eagle prepaid $US 4.0 million of term loan principal (together with all accrued and unpaid interest, but without application of any make-whole amount or repayment premium) and reduced the outstanding amount of the term loan from $US 61.5 million to $US 57.5 million.
Effective September 15, 2017 Eagle’s lender finalized its quarterly Borrowing Base redetermination and set the Borrowing Base at $76.0 million (the September 30, 2017 Canadian dollar equivalent of $US 60.9 million) to continue until the next scheduled redetermination, interim redetermination or other adjustment of the Borrowing Base pursuant to the Terms of the Loan Agreement.
On September 29, 2017, as consideration for the Loan Agreement amendment, Eagle was deemed to have drawn an additional $US 0.7 million on the term loan, bringing the total principal balance of the term loan outstanding to $US 58.2 million.
At September 30, 2017, Eagle had drawn approximately $72.7 million (the September 30, 2017 Canadian dollar equivalent of $US 58.2 million) under the Loan Agreement with the option to draw, by way of a Notice of Borrowing, the remaining incremental term loan amount of up to the Borrowing Base of $US 60.9 million prior to March 13, 2018.
The details of Eagle’s debt were as follows:
$000’s September 30, 2017 December 31, 2016
Amount drawn 72,657 61,245
Less deferred financing charges (5,341) (163)
Debt 67,316 61,082
At September 30, 2017 and December 31, 2016 there were no covenant violations. Draws under the Loan Agreement are subject to quarterly covenant calculations which are directly impacted by commodity price and foreign exchange rate fluctuations. The amount available under the Loan Agreement is subject to quarterly borrowing base determinations which are directly impacted by the value of the oil and natural gas reserves.
Violation of any financial covenant constitutes an immediate Event of Default under the Loan Agreement in which the lender may, without notice or demand, do any or all of the following; terminate the loan, declare amounts immediately due and payable, stop advancing money or extending credit, settle or adjust disputes and claims directly with debtors, or make any payments and do any acts it considers necessary or reasonable to protect its collateral (including placing a hold on deposit accounts of Eagle and demanding and receiving possession of Eagle’s books and records).
Effective March 31, 2017, Eagle and its lender entered into the first amendment to the Loan Agreement (“First Amendment”). The purpose was to amend both the first test date for the quarterly Asset Coverage Ratio and the first scheduled date for the quarterly Borrowing Base redetermination to commence with a reserve report effective date of June 30, 2017 instead of March 31, 2017. The commencement dates for the Asset Coverage Ratio and the Borrowing Base redetermination are now consistent with the commencement date of the quarterly Consolidated Leverage Ratio.
Effective June 29, 2017, Eagle and its lender entered into the second amendment to the Loan Agreement (“Second Amendment”). The purpose was to relax the covenant thresholds for the Consolidated Leverage Ratio and Consolidated Fixed Charge Ratio by 10% in recognition of prevailing low oil prices during the second quarter, and to amend certain definitions relating to the lending value calculation to make the calculation more practical, workable and less affected by single day volatility in commodity futures pricing.
Effective September 29, 2017, Eagle and its lender entered into the third amendment to the Loan Agreement (“Third Amendment”). The purpose was to relax the covenant threshold for the Consolidated Fixed Charge Ratio by 10% in recognition of prevailing low oil prices.
EAGLE THIRD QUARTER REPORT 2017
20
The following lists the key terms of the Loan Agreement between Eagle and its lender after giving effect to the First, Second and Third Amendments and the September 15, 2017 quarterly Borrowing Base redetermination.
• Effective Date - March 13, 2017
• Term - 4 years
• Maturity Date - March 13, 2021
• Aggregate Term Loan Commitment / Borrowing Base - $US 60.9 million
• Borrowing Base Redeterminations – The borrowing base is re-determined quarterly and becomes effective when the new borrowing base notice is received from the lender. Such borrowing base remains in effect until the next borrowing base redetermination. The quarterly borrowing base redeterminations are effective for Eagle and its lender on March 15, June 15, September 15 and December 15 of each year, commencing September 15, 2017. For purposes of quarterly borrowing base redeterminations, Eagle will provide its lender with quarterly reserve reports with effective dates of December 31, March 31, June 30 and September 30, commencing June 30, 2017. Failure of Eagle to provide a quarterly reserve report constitutes an immediate event of default.
Upon receipt by the lender of the quarterly reserve report (and other reports, data and supplemental information as may be reasonably requested), the lender will evaluate the information and propose a new borrowing base based upon an advance rate of 75% of the proved developed producing reserves value, before tax, discounted at 10% (“PDP PV10 reserves value”). The forward pricing used to calculate the PDP PV10 reserves value is based on 48 months of NYMEX futures contracts and is defined in the Loan Agreement.
In the event that a borrowing base redetermination results in the outstanding principal of the term loan exceeding the borrowing base then in effect (“Term Loan Excess”), then, after receiving a new borrowing base notice of such new or adjusted borrowing base (such date of receipt of notice being the “Borrowing Base Notification Date”), Eagle will, no later than twenty (20) business days from the Borrowing Base Notification Date, repay an amount equal to (A) the then applicable Term Loan Excess plus (B) 2% of the aggregate principal amount of any such repayment. If Eagle fails to pay the amount under (B), then that amount bears interest until paid in full at a rate of LIBOR plus 13% per annum. A non-payment by Eagle when and as required of amounts to be paid or repaid would constitute an immediate event of default.
• Coupon - LIBOR plus 8% (with LIBOR having a floor of 1%)
• Financial covenants - The four financial covenants in the Loan Agreement are briefly described below. Changes to the Consolidated Fixed Charge Ratio resulting from the Third Amendment are indicated in italics:
(a) Consolidated Leverage Ratio
As at the end of each fiscal quarter, commencing with the quarter ending June 30, 2017, Eagle is to maintain a Consolidated Leverage Ratio of not greater than (i) for the quarter ending June 30, 2017, 3.85 to 1.00, (ii) for the quarters ending September 30, 2017 and December 31, 2017, 3.50 to 1.00 and (iii) for each quarter ending on or after March 31, 2018, 3.00 to 1.00.
The “Consolidated Leverage Ratio” is defined in the Loan Agreement as the ratio of Consolidated Funded Debt to Consolidated Adjusted EBITDAX (as defined below) for the trailing four fiscal quarters. Notwithstanding the foregoing, for the purposes of determining the Consolidated Leverage Ratio, (i) Consolidated Adjusted EBITDAX for the four fiscal quarter period ending June 30, 2017 shall be deemed equal to Consolidated Adjusted EBITDAX for the fiscal quarter ending June 30, 2017 multiplied by 4, (ii) Consolidated Adjusted EBITDAX for the four fiscal quarter period ending on September 30, 2017 shall be deemed equal to Consolidated Adjusted EBITDAX for the two fiscal quarter period then ending multiplied by 2, and (iii) Consolidated Adjusted EBITDAX for the four fiscal quarter period ending on December 31, 2017 shall be deemed equal to Consolidated Adjusted EBITDAX for the three fiscal quarter period then ending multiplied by 4/3.
EAGLE THIRD QUARTER REPORT 2017
21
(b) Consolidated Fixed Charge Ratio
As at the end of each fiscal quarter, Eagle is to maintain a Consolidated Fixed Charge Ratio of not less than 2.25 to 1.00 (prior to the Third Amendment the ratio for September 30, 2017 and subsequent quarters was 2.50 to 1.00).
The “Consolidated Fixed Charge Ratio” for the fiscal quarter is defined in the Loan Agreement as the ratio that (i) Consolidated Adjusted EBITDAX plus (ii) income tax payments minus (iii) maintenance capital expenditures associated with proved developed producing reserves is to interest expense (each for the fiscal quarter).
(c) Asset Coverage Ratio
As at the end of each fiscal quarter, commencing with a June 30, 2017 effective date reserve report internally prepared by Eagle, Eagle is to maintain an Asset Coverage Ratio of not less than 1.333 to 1.000.
The “Asset Coverage Ratio” is defined in the Loan Agreement as the ratio of the PDP PV10 reserves value (using prices quoted on NYMEX and before tax) to the aggregate principal balance outstanding under the term loan.
(d) Consolidated Current Ratio
As at the end of each fiscal quarter, commencing with the quarter ended March 31, 2017, Eagle is to maintain a Consolidated Current Ratio of not less than 1.00 to 1.00.
The “Consolidated Current Ratio” is defined in the Loan Agreement as the ratio of Consolidated Current Assets to Consolidated Current Liabilities, but, in each case, excluding any risk management assets or risk management liabilities that are classified as current.
“Consolidated Adjusted EBITDAX”, as defined in the Loan Agreement means:
(a) net income; plus;
(b) interest expense, accrued taxes, depreciation, depletion, amortization, exploration expense and other non-recurring expenses that do not represent a cash item in such period or any future period; plus or minus;
(c) gains or losses attributable to write-ups or write-downs of assets; plus or minus;
(d) unrealized foreign exchange gains or losses; plus or minus;
(e) non-cash gains, losses or adjustments under Financial Accounting Standards Board (FASB) Statement 133 as a result of changes in the fair market value of derivatives; plus or minus;
(f) non-cash share based compensation or recovery amounts.
In addition, EBITDAX is calculated after giving effect on a pro-forma basis to any permitted acquisition or asset disposition as if such acquisition or disposition occurred at the beginning of such period.
EAGLE THIRD QUARTER REPORT 2017
22
14. Decommissioning Liability
$000’s Nine Months Ended September 30, 2017
Year Ended December 31, 2016
Beginning balance 26,202 26,998
Acquisition - 73
Additions 428 29
Change in estimate due to acquired properties - 180
Other changes in estimates (1,692) (1,427)
Accretion (unwinding of discount) 367 458
Effects of exchange rate (254) (109)
Ending balance 25,051 26,202
The decommissioning provision reflects the present value of internal estimates of future decommissioning costs of Eagle’s net ownership position in oil and gas wells and related facilities at the relevant balance sheet date determined using local pricing conditions and requirements. The liability would be incurred over the life of the assets, with the majority after the year 2050. The timing of payments related to the decommissioning provision is uncertain and is dependent upon various items not always within Management’s control.
The decommissioning provision was estimated using existing technology at current prices (adjusted for a 1.9% annual inflation rate), and discounted using a risk-free discount rate at September 30, 2017 of 2.1% for the Salt Flat, North Texas, Twining and NW Alberta properties (December 31, 2016 - 1.72%), and 2.47% for the Dixonville properties (December 31, 2016 - 2.3%).
15. Share Capital
Eagle has an unlimited number of common shares authorized for issuance. At September 30, 2017, the shares outstanding were as follows:
Shares Outstanding
Nine Months Ended September 30, 2017 Year Ended December 31, 2016
Number of shares Amount Number of shares Amount
(000’s) ($000’s) (000’s) ($000’s)
Beginning balance 42,451 320,012 34,863 315,379
Issuance of shares pursuant to the Business Combination (Note 5) - - 7,588 5,539
Issuance of shares pursuant to the RSUs and PSUs 851 503 - -
Share issuance costs - - - (906)
Ending balance 43,302 320,515 42,451 320,012
On January 27, 2016, as part of the Arrangement, Eagle issued 7.6 million shares valued at $0.73 per share for a total value of $5.5 million (see note 5 “Business Combination”). Costs associated with issuing shares pursuant to the Arrangement were approximately $890,000.
On March 24, 2017, 405,529 shares were issued and on September 12, 2017, an additional 444,834 shares were issued pursuant to the 2016 Equity Incentive Plan. Refer to note 7, “Share-based Payments”.
EAGLE THIRD QUARTER REPORT 2017
23
16. Commitments
Operating Lease Commitment – Head Office Lease in Calgary, Alberta
On January 1, 2013, Eagle entered into a lease for office space in Calgary which originally had an approximate 61 month term from January 8, 2013 to February 7, 2018. In May 2016, the lease was amended to extend the lease term and decrease the annual basic rental charge. The new term began August 1, 2016 and terminates February 28, 2023. Total minimum lease payments during the term of the lease from August 1, 2016 through February 28, 2023 approximate $3.1 million and include a leasehold improvement allowance up to $0.2 million, with 65 months and approximately $2.4 million remaining at September 30, 2017.
Operating Lease Commitment – Office Lease in Houston, Texas
Eagle entered into a lease in Houston on April 1, 2011, which originally had an approximate 30 month term from April 7, 2011 through September 30, 2013. On November 21, 2012, the lease was extended for an additional 63 month period from October 1, 2013 to December 31, 2017 and the premise space was expanded to incorporate additional square footage. In September, 2017, Eagle received landlord permission to remain in the leased space through January 31, 2018. Total minimum lease payments during the term of the lease approximate $US 1.4 million ($CA 1.8 million) and include a leasehold improvement allowance of $US 0.1 million with 4 months and approximately $US 0.1 million remaining at September 30, 2017. The remaining future minimum lease payments approximate $CA 0.13 million translated at the exchange rate in effect at the balance sheet date of $US 1.00 equal to $CA 1.31.
Operating Lease Commitment – New Office Lease in Houston, Texas
Eagle entered into an office lease in Houston on September 22, 2017 to replace the lease expiring on December 31, 2017. The term of the lease is from February 1, 2018 to August 31, 2025. Total minimum lease payments during the term of the lease approximate $US 1.2 million. The total minimum lease payments approximate $CA 1.5 million translated at the exchange rate in effect at the balance sheet date of $US 1.00 equal to $CA 1.31.
Corporate Information Board of Directors Officers
Richard W. Clark J. Wayne Wisniewski Executive Chairman President and Chief Executive Officer
David M. Fitzpatrick Kelly A. Tomyn Lead Independent Director Chief Financial Officer
Bruce K. Gibson (1) Glen D. Glass Director Vice President, Operations
Warren D. Steckley (2)(3) Jo-Anne M. Bund Director General Counsel and Corporate Secretary
J. Wayne Wisniewski Director, President and Chief Executive Officer
(1) Audit Committee Chair (2) Reserves & Governance Committee Chair (3) Compensation Committee Chair Auditors PricewaterhouseCoopers LLP Trustee and Transfer Agent Computershare Trust Company of Canada TSX:EGL
Engineering Consultants Netherland Sewell & Associates, Inc. McDaniel & Associates Consultants Ltd.
Legal Counsel Bennett Jones LLP
Calgary Office Houston Office
Eagle Energy Inc. Suite 2710, 500 – 4th Avenue SW Calgary, Alberta T2P 2V6 Phone: (403) 531-1575 Fax: (403) 508-9840 Email: [email protected]
Eagle Hydrocarbons Inc. Suite 3005, 333 Clay Street Houston, Texas 77002 Phone: (713) 300-3245 Fax: (713) 300-3240 Email: [email protected]
www.EagleEnergy.com